Article

A Novel Liquid Chromatographic Time-of-Flight Tandem Mass Spectrometric Method for the Determination of Secondary Metabolites in Functional Flours Produced from Grape Seed and Olive Stone Waste

by
Achilleas Panagiotis Zalidis
1,
Natasa P. Kalogiouri
2,*,
Ioannis Mourtzinos
3,
Dimitris Sarris
1 and
Konstantinos Gkatzionis
1,*
1
Laboratory of Consumer and Sensory Perception of Food & Drinks, Department of Food Science and Nutrition, University of the Aegean, Metropolite Ioakeim 2, 81400 Myrina, Greece
2
Laboratory of Analytical Chemistry, School of Chemistry, Aristotle University of Thessaloniki, 54124 Thessaloniki, Greece
3
Laboratory of Food Chemistry and Biochemistry, Department of Food Science and Technology, School of Agriculture, Aristotle University of Thessaloniki, 54124 Thessaloniki, Greece
*
Authors to whom correspondence should be addressed.
Molecules 2025, 30(7), 1527; https://doi.org/10.3390/molecules30071527
Submission received: 9 February 2025 / Revised: 21 March 2025 / Accepted: 21 March 2025 / Published: 29 March 2025
(This article belongs to the Special Issue Chromatography—The Ultimate Analytical Tool, 3rd Edition)

Abstract

:
Agricultural by-products like grape pomace and olive stones are rich in bioactive compounds and can be processed into grape seed and olive stone flours.The phenolic composition of such flours still remains underexplored. This study introduces a liquid chromatographic time-of-flight tandem mass spectrometric method (LC-QTOF-MS/MS) to assess the phenolic profiles of functional flours from different origins and evaluate their potential use within the frame of a circular economy. Grape seed and olive stone flours from Lemnos and commercial sources were analyzed employing target, suspect, and non-target screening. Target screening resulted in the determination of 23 phenolic compounds. Suspect screening revealed phenolic diversity in flours produced in Lemnos island. Non-target screening resulted in the detection of 1042 and 1620 mass features in grape seed and olive stone flours, respectively. Principal component analysis (PCA) and partial least squares-discriminant analysis (PLS-DA) successfully differentiated samples between commercially available and those produced in Lemnos. These results underscore the phenolic richness of grape seed and olive stone flours, supporting their use as functional ingredients and reinforcing sustainability and circular economy principles in the agri-food sector.

1. Introduction

The concept of circular economy has gained substantial traction in recent years as a sustainable framework aiming to minimize waste generation and promote resource efficiency. Central to this paradigm is the valorization of waste streams, transforming them into valuable resources through innovative approaches [1]. In the agricultural sector, where considerable quantities of by-products are generated, there exists significant potential for circular economy practices.
Among the diverse agricultural waste streams, the olive oil and wine industry by-products, predominant in Mediterranean regions, constitute a significant portion of agricultural waste [2]. These by-products are rich in bioactive compounds, dietary fibers, and other valuable components, rendering them suitable candidates for fortifying food and enriching its health-promoting properties [3,4]. By-products from the aforementioned streams include grape pomace, which could be milled into flour-producing grape seed flour, as well as olive stones, resulting in a fine olive stone powder/flour. Polyphenols in grapes are mainly reported in the seeds, in the range between 60% and 70% of the total extractable polyphenols [5]. Olive stones are a valuable source of micronutrients as well. Grinding olive stone into a powder and incorporating it into flour can enhance the nutritional content of dough products and snacks, enriching it with dietary fibers and phenolic compounds [6]. High concentrations of oleoside, nuezhenide, oleuropein verbascoside, ligstroside, and glycosides of tyrosol and hydroxytyrosol [7] with positive health effects have been reported in the literature [8,9]. A recent study [10] has illustrated the antioxidant and anti-inflammatory properties of the biomolecules in grape by-products and wastes as well as the cardiovascular protection and diabetes management they provide. Among the active metabolites that play a very important role are phenols, tannins, resveratrol, quercetin, flavonoids, and anthocyanins [11]. Additionally, grape seeds are rich in catechin and gallic acid [12], while the presence of epicatechin gallate and gallates of dimeric and trimeric procyanidins has also been reported [13].
The valorization of olive stones and grape seeds aligns with the principles of the circular economy by converting these agricultural wastes into valuable resources with diverse applications [14]. By incorporating them into food products and nutraceuticals, these by-products could contribute to reducing waste generation, promoting sustainable practices across various industries and further enriching the available nutrients. The current state of the art indicates that the primary use of olive stone flour is centered on creating polypropylene composites [15], with few applications in food, mainly in dough products [6,16]. Considering grape seed flour, the majority of the available studies focus on the effects of wheat flour substitution and the rheological parameters of doughs [17,18]. Additionally, the nutritional profile of food products has been investigated [19] along with the antioxidant activity and consumer acceptance [20,21].
The environmental conditions under which olive trees and grapevines grow significantly impact the composition of their by-products and, consequently, the properties of the functional flours derived from them. Olive trees are typically cultivated in dry, arid, and nutrient-poor soils, requiring minimal water input and exhibiting resilience to harsh climatic conditions [22]. These factors influence the chemical composition of olive stones, often resulting in a higher concentration of specific phenolic compounds such as oleuropein and hydroxytyrosol [23]. In contrast, grapevines thrive in more temperate and humid environments with richer soil conditions that promote the accumulation of diverse polyphenolic compounds, including flavonoids and tannins [24]. Additionally, the processing methods for olives and grapes differ considerably; olive processing involves mechanical extraction and prolonged exposure to water [25], while winemaking subjects grape seeds to fermentation processes that can alter their polyphenolic profile [26]. These environmental and processing differences contribute to distinct nutritional and bioactive properties in olive stone and grape seed flours, influencing their potential applications in food and nutraceutical products.
Even though numerous works are focusing on the analysis of olive and grape by-products as a valuable alternative source of bioactive compounds, there are limited studies evaluating the phenolic profile of the flour that is produced from grape seeds and olive stones. The analysis of grape seed and olive stone functional flours is vital for unlocking their full potential as an antioxidant and health-promoting sustainable ingredient in food production. Even though there are numerous works proposing analytical methods for food by-products, the literature regarding the in-depth characterization of functional flours is still scarce. High-resolution mass spectrometry plays a key role in food fingerprinting studies. Liquid chromatography coupled with time-of-flight tandem mass spectrometry (LC-QTOF-MS/MS) enables the detailed characterization of bioactive compounds, such as polyphenols and other secondary metabolites, with high resolution owing to its ability to differentiate among compounds with same unit mass but differing in mass defects. This is particularly useful, as LC-QTOF-MS/MS allows the comprehensive profiling of both known and unknown compounds, through target, suspect, and non-target screening.
Despite the promising potential of small molecules as biomarkers for assessing the quality and origin of olive stone and grape seed flours, their variability due to environmental factors poses a challenge to their reliability. Climatic conditions, soil composition, and agricultural practices can significantly alter the metabolite profile, potentially impacting their consistency as origin markers and affect data interpretation [27]. In this study, the phenolic fingerprint of grape seed and olive stone flours from Lemnos island and commercial sources was investigated. Target, suspect, and non-target screening were employed to assess their phenolic profile, evaluate their potential as raw materials in technological applications, and investigate if these small molecules could be used as markers in origin authenticity studies to distinguish between commercially available functional flours and those originating from Lemnos island. Future studies should aim to conduct multi-location studies to better assess the robustness of small molecules as authenticity markers.

2. Results and Discussion

2.1. Grape Seed Flour (GSF)

2.1.1. Target Screening Results

By scanning the flour samples and referring to the initial target list (Table S1, Supplementary Material), the presence of 23 target compounds was identified. These compounds included flavonoids: apigenin, chrysin, diosmin, luteolin, kaempferol, myricetin, quercetin, taxifolin (dihydroquercetin), naringenin, catechin, epicatechin, epigallocatechin, epicatechin gallate, rutin (quercetin-3-O-rutinoside), quercitrin (quercetin-3-O-rhamnoside), and myricitrin (myricetin-3-O-rhamnoside); phenolic acids: caffeic acid, coumaric acid, ferulic acid, sinapic acid, protocatechuic acid, gallic acid, and vanillic acid; and phenolic aldehyde (vanillin). Their presence was confirmed by comparing the experimental molecular ions and retention times with the corresponding standards, using a maximum threshold of ΔRt = 0.2 min. The most abundant fragments from the MS/MS spectra were recorded along with their elemental formulas, and the compounds were quantified based on peak areas. The target screening results for GSF are summarized in Table S2 along with the concentration (mean) for each compound. The extracted ion chromatograms (EICs), MS, and MS/MS spectra for GSF are shown in Figures S1–S14 in the Supplementary Materials.
Grape seeds offer several advantages for human consumption due to their phenolic content and other substances [28]. Catechin, epicatechin, gallic acid, gallocatechin, and epicatechin gallate are major phenolic constituents of grape seeds and could make up to 45% of the total phenolic content [29,30]. In Figure 1A, the mean concentration of epicatechin gallate is shown, which was the most abundant phenolic compound in grape seed flour from Lemnos (GSFL) and five times higher than that in commercial grape seed flour (GSFC). In Figure 1B, catechin, epicatechin, and epigallocatechin, the aforementioned compounds, are shown. GSFL again exhibited a higher mean concentration in the detected compounds with significant differences when compared to GSFC. The detected catechins have been previously associated with cardioprotective properties [31]. In a skin cancer cell line model, a grape seed extract rich in catechins significantly reduced apoptosis, lipid peroxide levels, lesion scores, and DNA damage [32].
In addition, GSFL yielded a higher concentration in the majority of the target substances with the exception of: kaemferol (GSFC: 3.22 mg/kg (sd = 0.31) and GSFL: 2.20 mg/kg (sd = 0.08)), myricitrin (GSFC: 4.85 mg/kg (sd = 0.10) and GSFL: 4.51 mg/kg (sd = 0.06)), and quercitrin (GSFC: 5.72 mg/kg (sd = 1.087) and GSFL: 3.88 mg/kg (sd = 0.18)).

2.1.2. Suspect Screening Results

GSF samples were further screened using the suspect list (Table S3, Supplementary Material), which was created from the literature. The presence of the compounds was tentatively verified on the basis of the accurate mass and examining the MS/MS spectra using in silico fragmentation tolls, such as MetFrag [33] and MassBank [34], and literature records. The suspect compounds were tentatively semi-quantified using the calibration curves of same-class compound derivatives. In total, 34 compounds were identified in GSF, and the suspect screening results from commercial grape seed flour (GSFC) and grape seed flour from Lemnos (GSFL) are shown in Table S4. The identified compounds belong to various phytochemical classes, including phenolic acids, flavonoids, anthocyanins, coumarins, and stilbenes. The phenolic acids include hydroxycinnamic acid derivatives such as 3-caffeoylshikimic acid, caftaric acid, chicoric acid, coutaric acid, and fertaric acid, as well as hydroxybenzoic acids like ellagic acid, ellagic acid hexoside 1, and p-hydroxybenzoic acid. The flavonoids are well represented, encompassing flavanols, flavonols, flavones, and their glycosides. Notable flavonoids include dihydrokaempferol-3-O-rhamnoside, epicatechin-3-O-gallate/trimer, epigallocatechin gallate, eriodyctiol-7-O-glucoside, gallocatechin, isorhamnetin-3-O-glucoside, isorhamnetin-3-O-rutinoside, kaempferol-3-O-glucoside, laricitrin-3-O-glucoside, luteolin-7-O-glucoside, myricetin-3-glucoside, myricetin-3-O-glucuronide, procyanidin A1, procyanidin B1/B2, quercetin-3-O-galactoside, quercetin-3-O-glucoside, quercetin-3-O-glucuronide, quercetin-3-O-rhamnoside, quercetin-3-O-rutinoside (rutin), taxifolin-3-O-glucoside, taxifolin-3-O-rhamnoside, and trifolin. The anthocyanin cyanidin-3-O-glucoside was also identified. Additionally, the coumarin fraxin was detected, along with stilbenes such as trans-piceatannol, trans-piceid (trans-polydatin), and trans-resveratrol.
Grape seeds have been previously confirmed as a rich source of phenolic compounds, including procyanidins [35], cinnamic acid derivatives [36], and flavonoids [29], all of them linked with numerous health benefits. Procyanidin A1 and B1 were identified in both GSFC and GSFL, with higher concentrations in GSFL. Specifically, procyanidin A1 was 4.5 times higher in GSFL compared to GSFC, while procyanidin B1/B2 was 1.5 times higher in GSFL. Proanthocyanidins in grape seeds have been previously associated with cholesterol metabolism, and their incorporation in animal feed serves as an effective dietary supplement improving lipid composition [37]. Additionally, recent evidence showed promise as nutraceuticals since they affect microbial ecology and gut microbiota [38].
Ellagic acid and its derivative (ellagic acid hexoside) were abundant in GSFC, and evidence indicates that the intake of ellagic acid is effective in reducing obesity and improving obesity-related metabolic complications [39]. Coutaric acid was significantly higher in GSFL (17.6 mg/kg (sd = 0.005) compared to 87.7 mg/kg (sd = 0.02)) and caftaric acid was not detected in GSFC (GSFL: 10.7 mg/kg). Significant flavonoids found in grape skin and seeds, such as gallocatechin, epigallocatechin gallate, and epicatechin-3-O-gallate, were notably higher in GSFL. Overall, GSFL exhibited higher concentrations of major phenolic constituents.
This detailed identification of bioactive compounds in grape seed products not only highlights their potential health benefits but also provides a foundation for waste stream valorization. The sustainable management of food waste, such as grape seeds, involves converting these by-products into valuable resources. While utilizing the bioactives from these by-products, a circular economy is supported by reintegrating these compounds into the food chain, reducing environmental impact, and enhancing the nutritional value of food products [40]. Furthermore, these identified compounds could potentially act as markers for authenticity and origin determination, offering a valid method to distinguish among those from different sources. This approach transforms what was once considered waste into a resource that aligns with sustainability goals, contributes to waste reduction, and fosters transparency in food sourcing and product labeling.

2.2. Olive Stone Flour (OSF)

2.2.1. Target Screening Results

The target screening process for OSF was the same that was used for GSF, and the target screening results with the respective mean concentration are summarized in Table S5. The extracted ion chromatograms (EICs), MS, and MS/MS spectra for OSF are shown in Figures S15–S29 in the Supplementary Materials.
A lower number of phenolic compounds was detected in OSF compared to GSF. Protocatechuic acid, vanillin, and luteolin were the most abundant compounds, at 95.7 mg/kg (sd = 0.98), 89.8 mg/kg (sd = 1.07), and 28.3 mg/kg (sd = 0.66) respectively. The Lemnos-variety olive stone flour (OSFL) exhibited an increased concentration in most substances, with quercitrin, a valuable curative agent [35], having been detected in abundance. Moreover, diosmin and taxifolin were unique to OSFL and not detected in commercial olive stone flour (OSFC). Diosmin has been found to be effective in reducing the proliferation of colon cancer cell metabolism [41], while taxifolin has demonstrated biological activities, such as anti-Alzheimer activity, anti-microbial activity, hepatoprotective activity, among others [42]. These compounds are already utilized as dietary supplements and in novel food products [43], while there are studies that support the addition of olive stone powder in biscuits in order to boost their nutritional properties [16]. However, the research did not include a detailed characterization of the phenolic content using chromatographic techniques. This omission means that, while the overall phenolic content increased, the specific phenolic compounds present were not identified or quantified, limiting the deeper understanding of the bioactive properties of olive stone powder. Incorporating chromatography could offer more precise insights into these bioactives, such as diosmin and taxifolin, and take advantage of them being unique to GSFL.

2.2.2. Suspect Screening Results

OSF samples were further screened using the suspect list (Table S6, Supplementary Materials). The tentative verification followed the GSF suspect screening protocol. In total, 63 compounds were present in OSF, and the suspect screening results for OSFC and OSFL are shown in Table S7. The compounds identified in OSF flours include a variety of phytochemical classes. Phenolic acids, such as 4-hydroxybenzoic acid, benzoic acid, chlorogenic acid, gentisic acid, and homovanillic acid, were present, along with flavonoids, including apigenin derivatives, chrysoeriol-O-glucoside, luteolin derivatives, kaempferol derivatives, quercetin derivatives, eriodictyol, naringin, gallocatechin, genistein, and 2′-hydroxygenistein. Secoiridoids, such as decarboxymethyl oleuropein aglycone (oleacein), oleuropein aglycone, oleoside, and elenolic acid, were also detected. Additionally, lignans, like hydroxypinoresinol, olivil, pinoresinol, and syringaresinol, as well as coumarins such as esculetin and fraxamoside, were identified. Stilbenes, like trans-polydatin, and triterpenoids, such as maslinic acid and oleanolic acid, were also found. Other phenolic compounds included tyrosol, tyrosol glucoside (salidroside), and verbascoside.
Olive stone contains a wide variety of phenolic compounds, including polyphenols [44], prenol lipids, secoiridoids [45], and flavonoids [46], which are potent antioxidants and linked to positive effects on human health by a large number of studies [28]. Tyrosol and hydroxytyrosol, two of the main compounds of the phenolic fraction of olive stones [47], were significantly higher in OSFL compared to OSFC. Moreover, oleuropein and its derivative (oleuropein aglycone), which are considered the most prevalent polyphenols in olives [48], were abundant in GSFC. The homovanillic acid concentration was six times higher in GSFC, with similar results for the 4-hydroxybenzoic acid, both major constituents in olives [49]. Concerning lignans in olive stone, olivil and pinoresinol were both identified and exhibited higher concentrations in OSFC. Verbascoside, which has been reported in olive mill wastewater and is considered a possible food antioxidant [50], was notably higher in commercial grape seed flour. In addition, oleanolic acid, a triterpenic acid with therapeutic potential [51], was detected in a high concentration in OSFC.
Given the importance of phenolic compounds in OSF, it is crucial to characterize them before they are incorporated into functional food products. These compounds could serve as unique chemical markers, reflecting specific environmental conditions tied to the geographical origin, thus enabling the distinction between flours from Lemnos and their commercial counterparts. Furthermore, in order to address the presence of soluble and hydrolyzable phenolic compounds in olive stone, studies highlight the importance of these compounds for their antioxidant potential [52]. Soluble phenols in olive stone can be criticized for their instability during food processing, which can reduce their functional efficacy. By deploying HRMS methods, it is possible to identify and monitor the turn-over of the specific classes of polyphenols, offering more precise insights into their composition and allowing for better utilization in functional food products.

2.3. Non-Target Screening Results

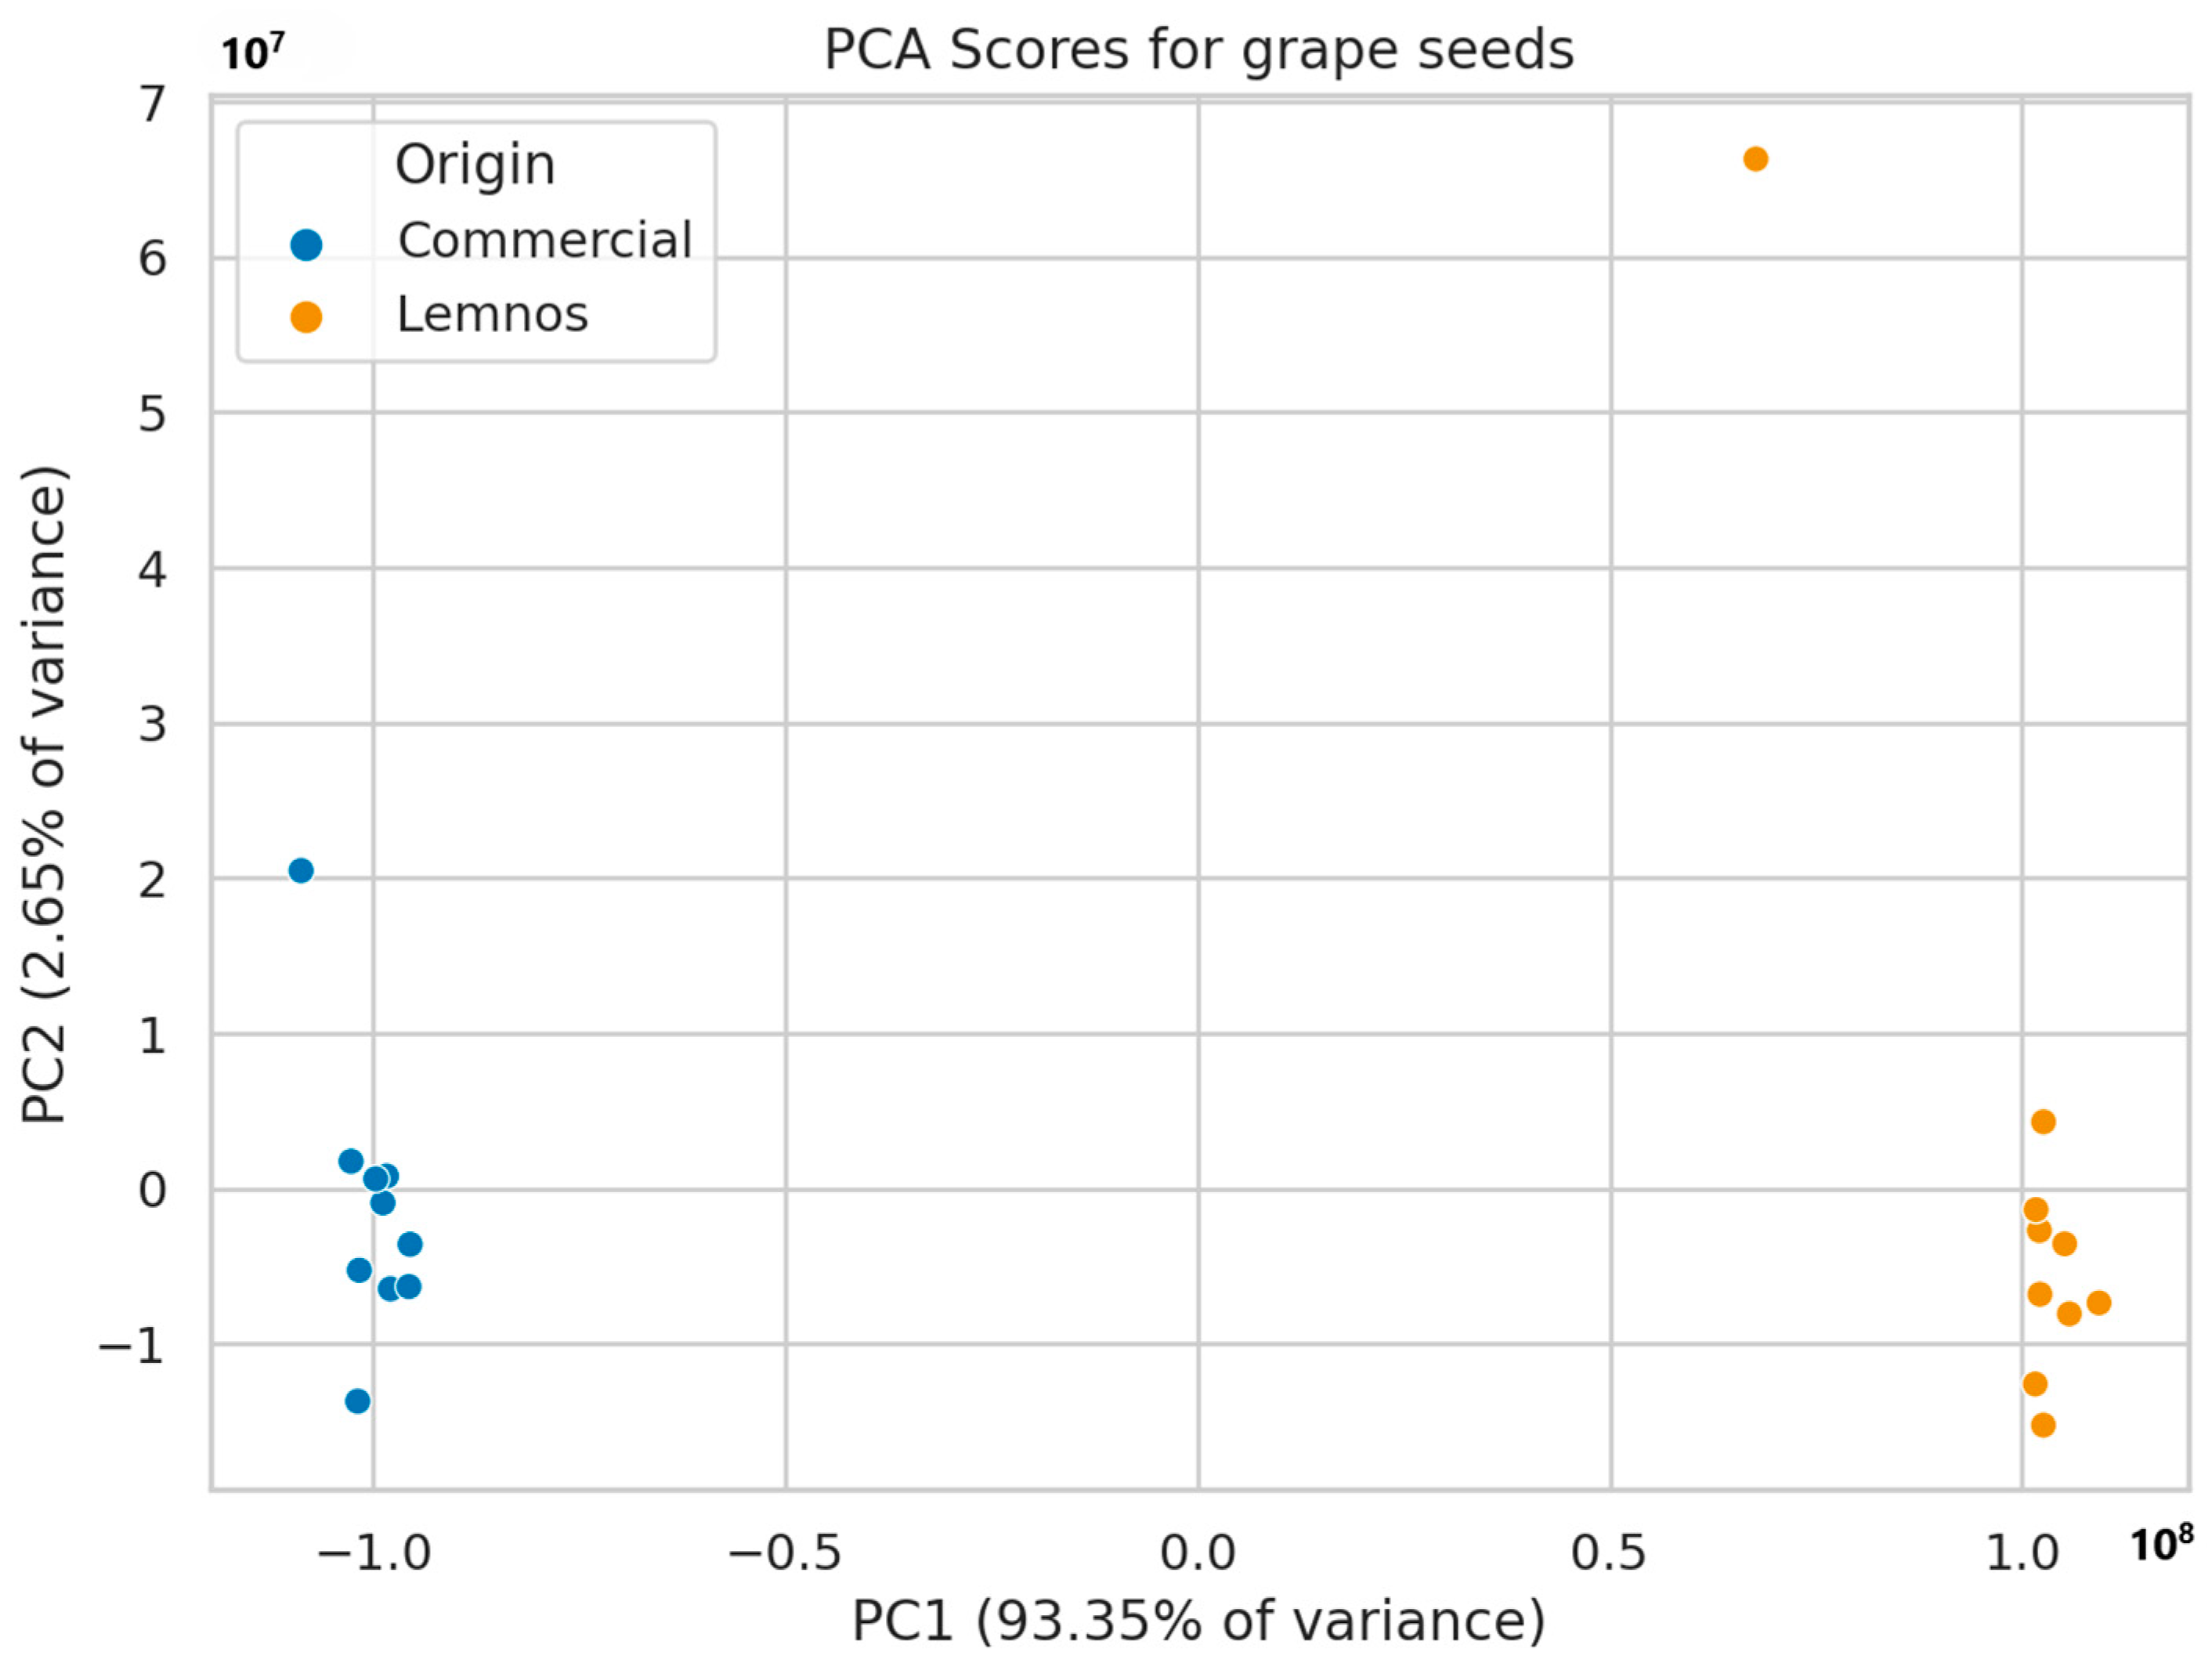
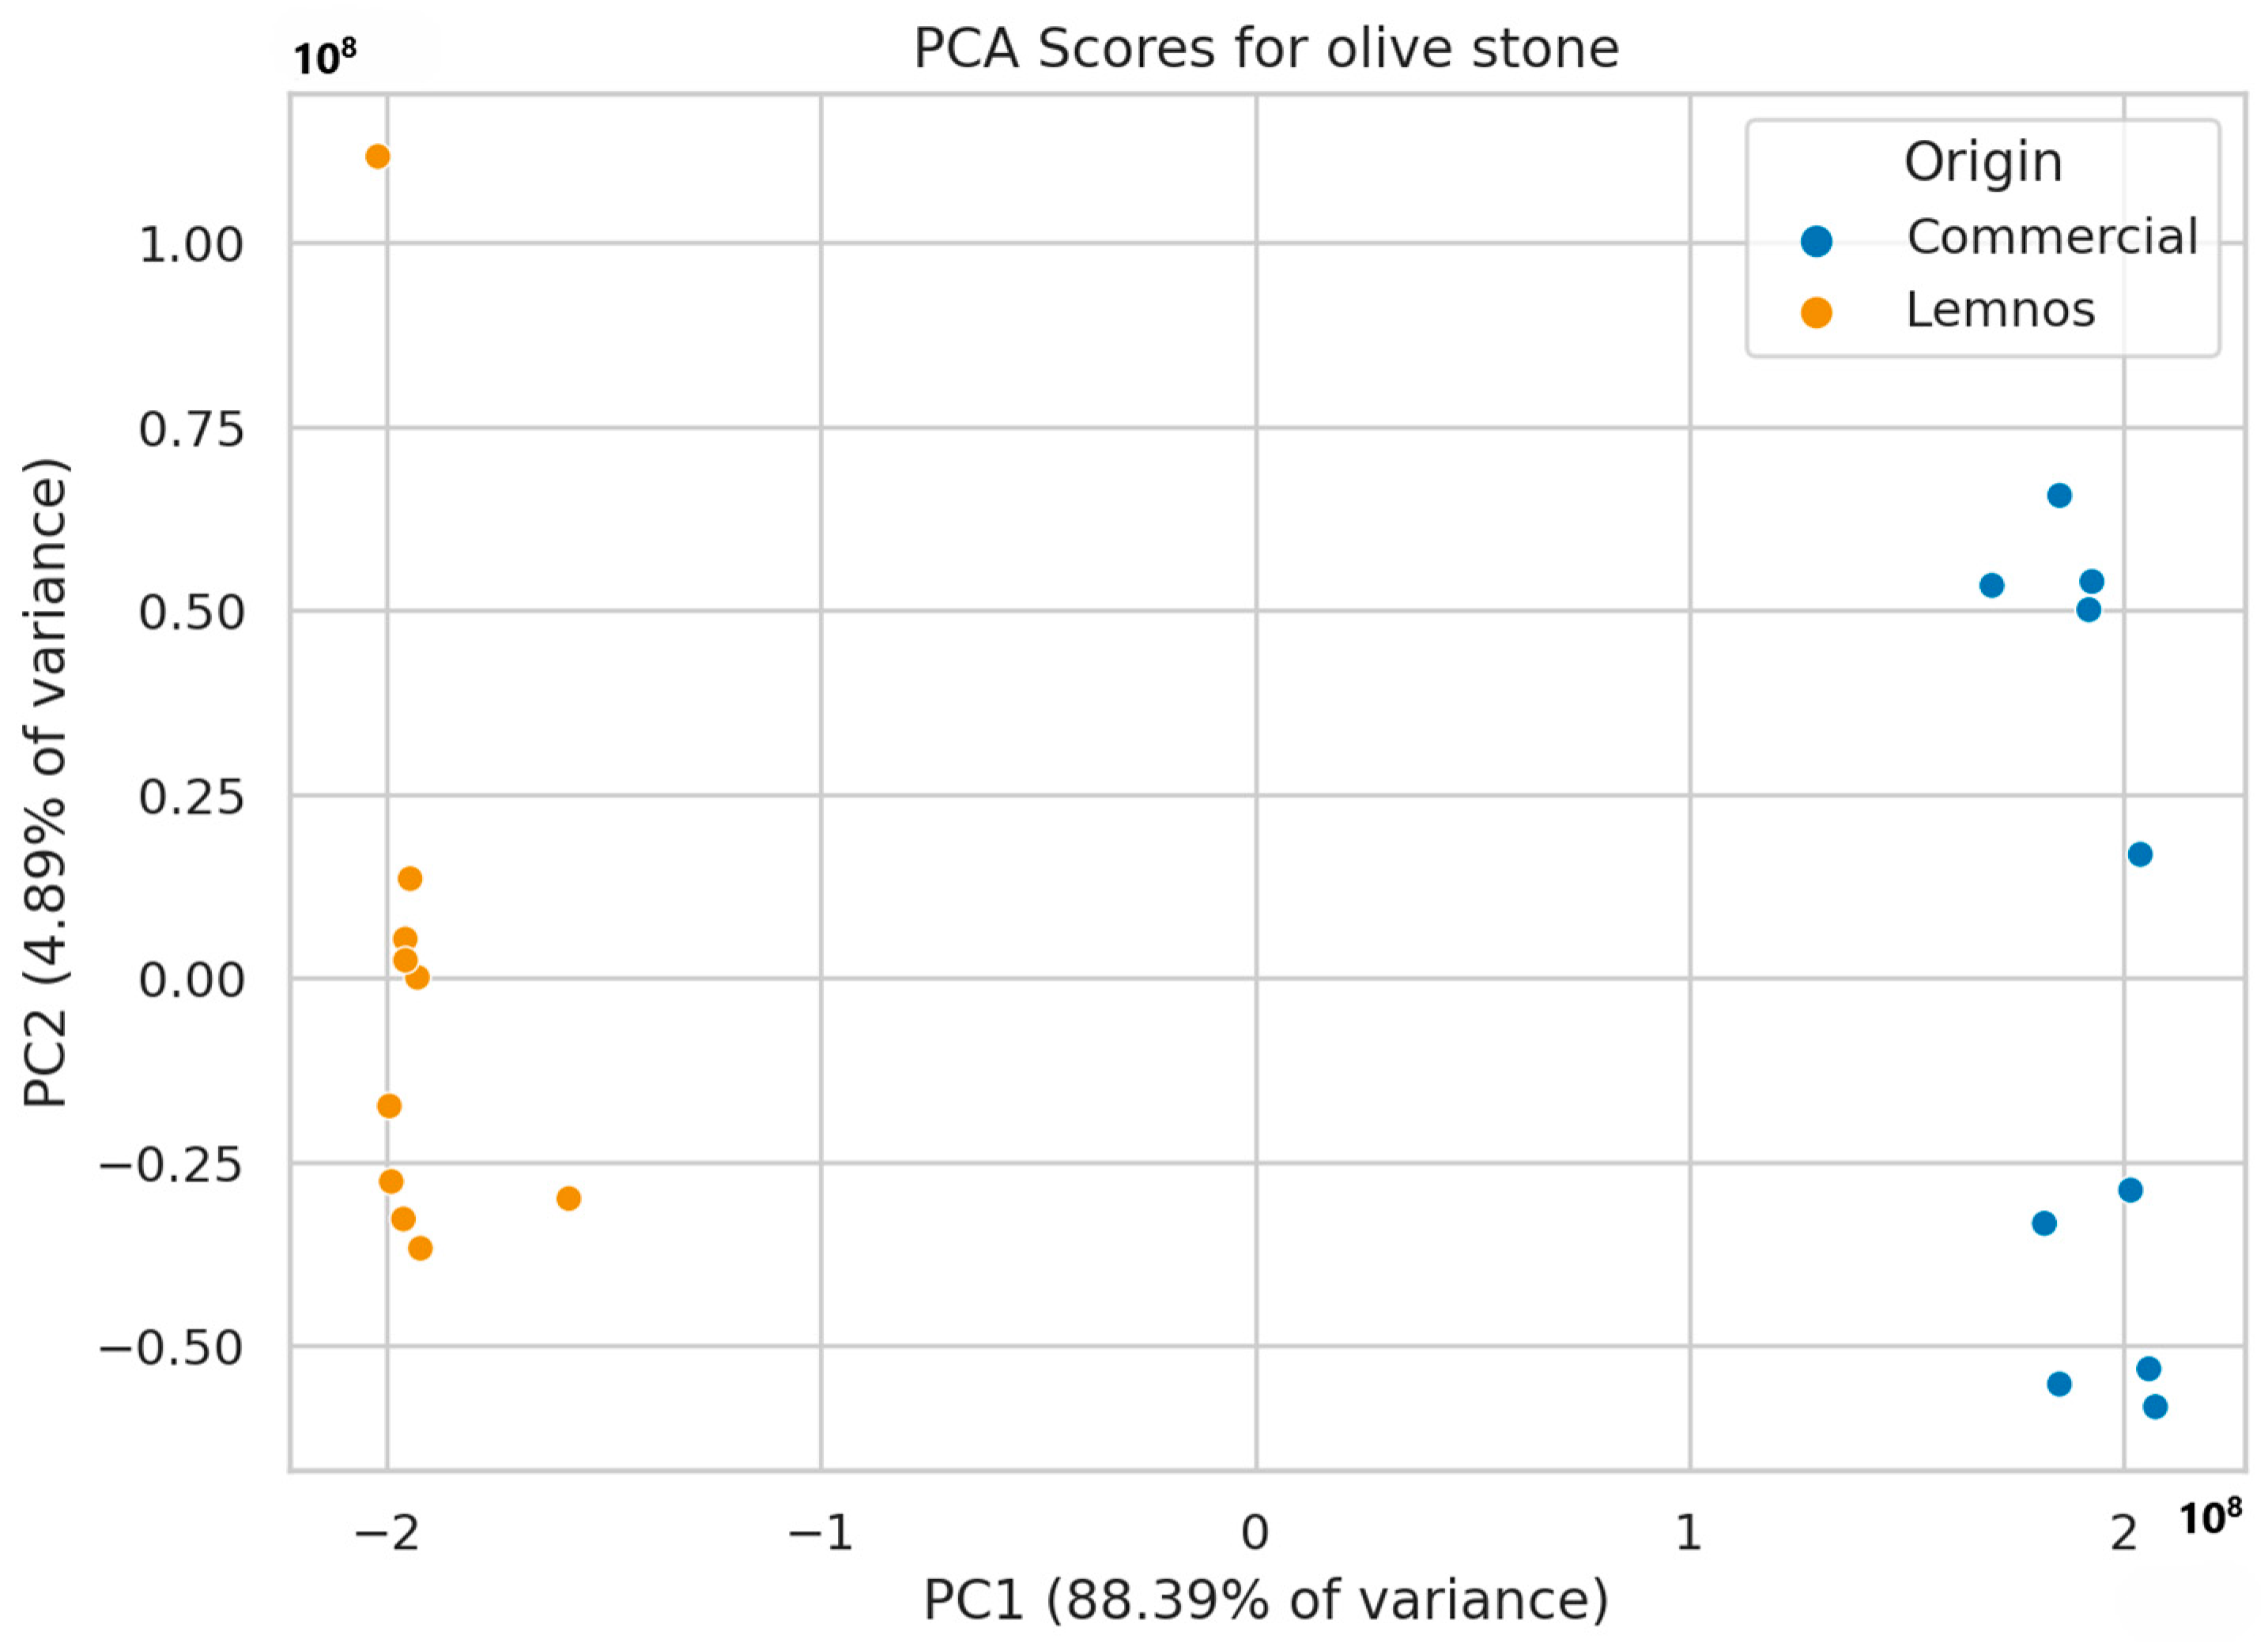
Non-target screening resulted in the generation of 1042 mass features in total for grape seed flour (GSFC and GSFL) and 1620 for olive stone flour (OSFC and OSFL). A principal component analysis (PCA) was utilized for the initial assessment of sample distribution. In GSF, the first two principal components explained 96.0% of the variation and two distinct groups were formed, namely commercial and Lemnos grape seed flours, as seen in Figure 2 (see also Supplementary Figure S30 for the loadings plot), while similar results were obtained for OSF (Figure 3), with PC1 and PC2 explaining 93.3% of the variation (see also Supplementary Figure S31 for the loadings plot).
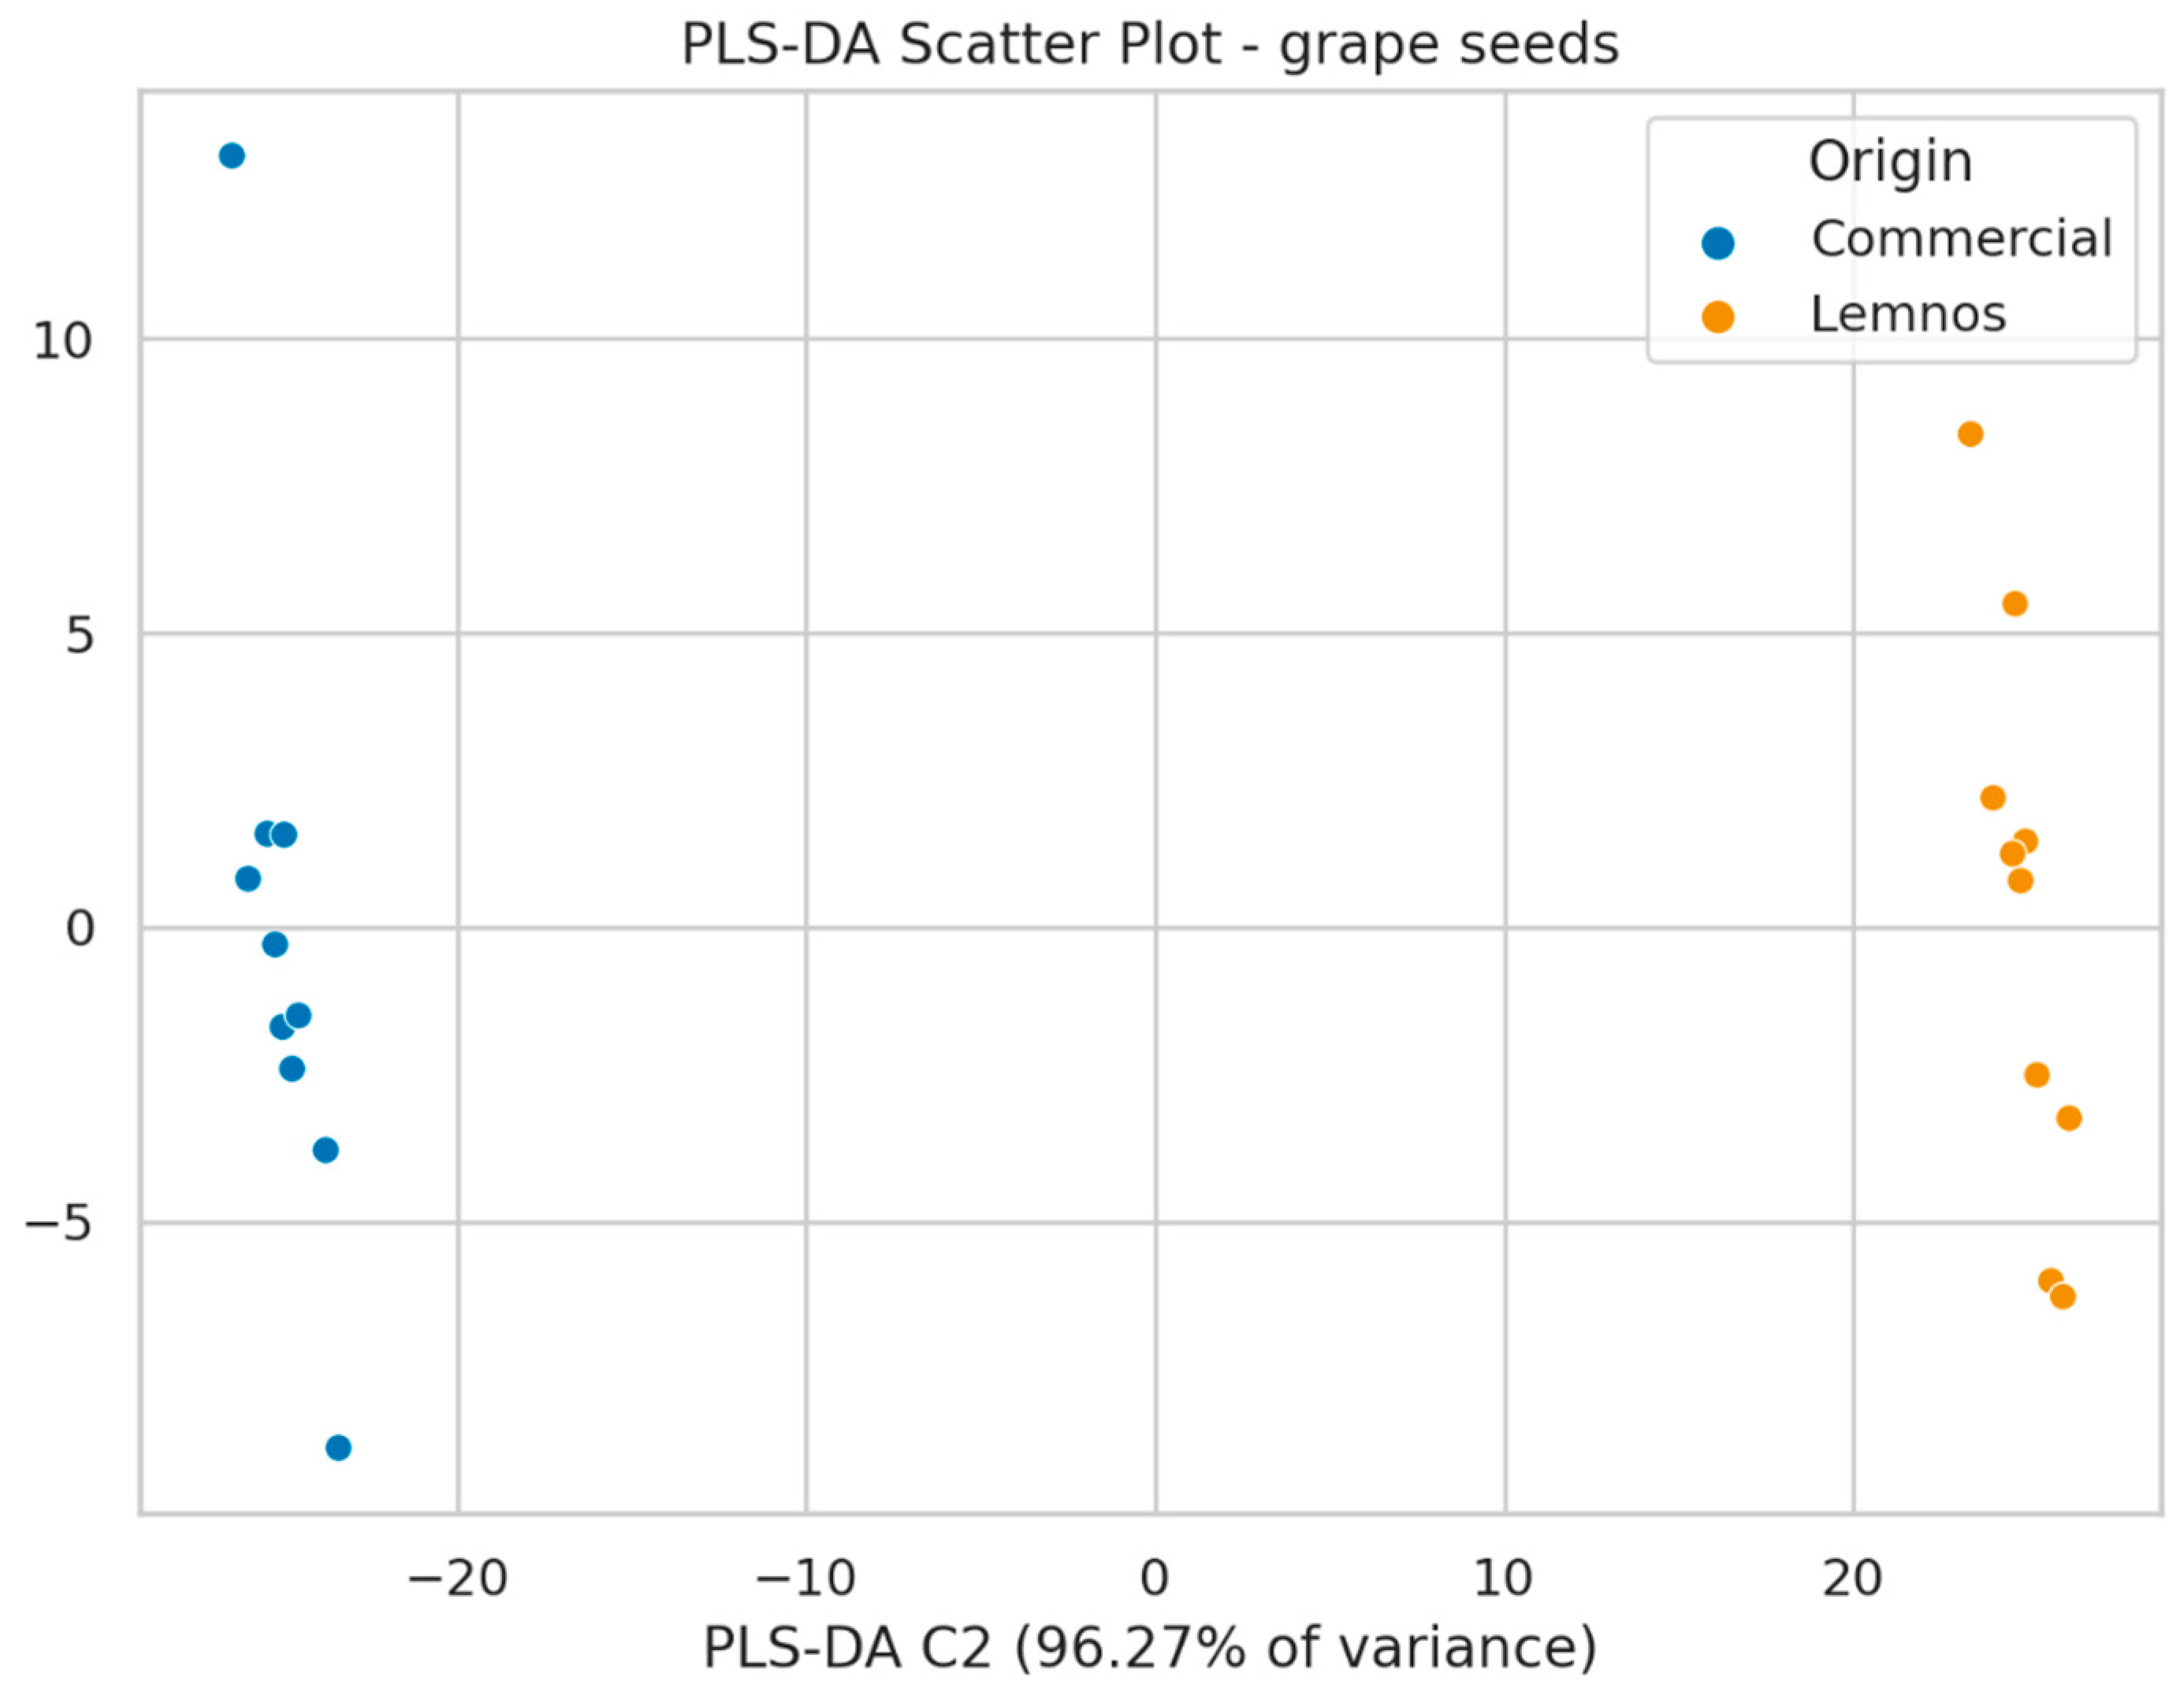
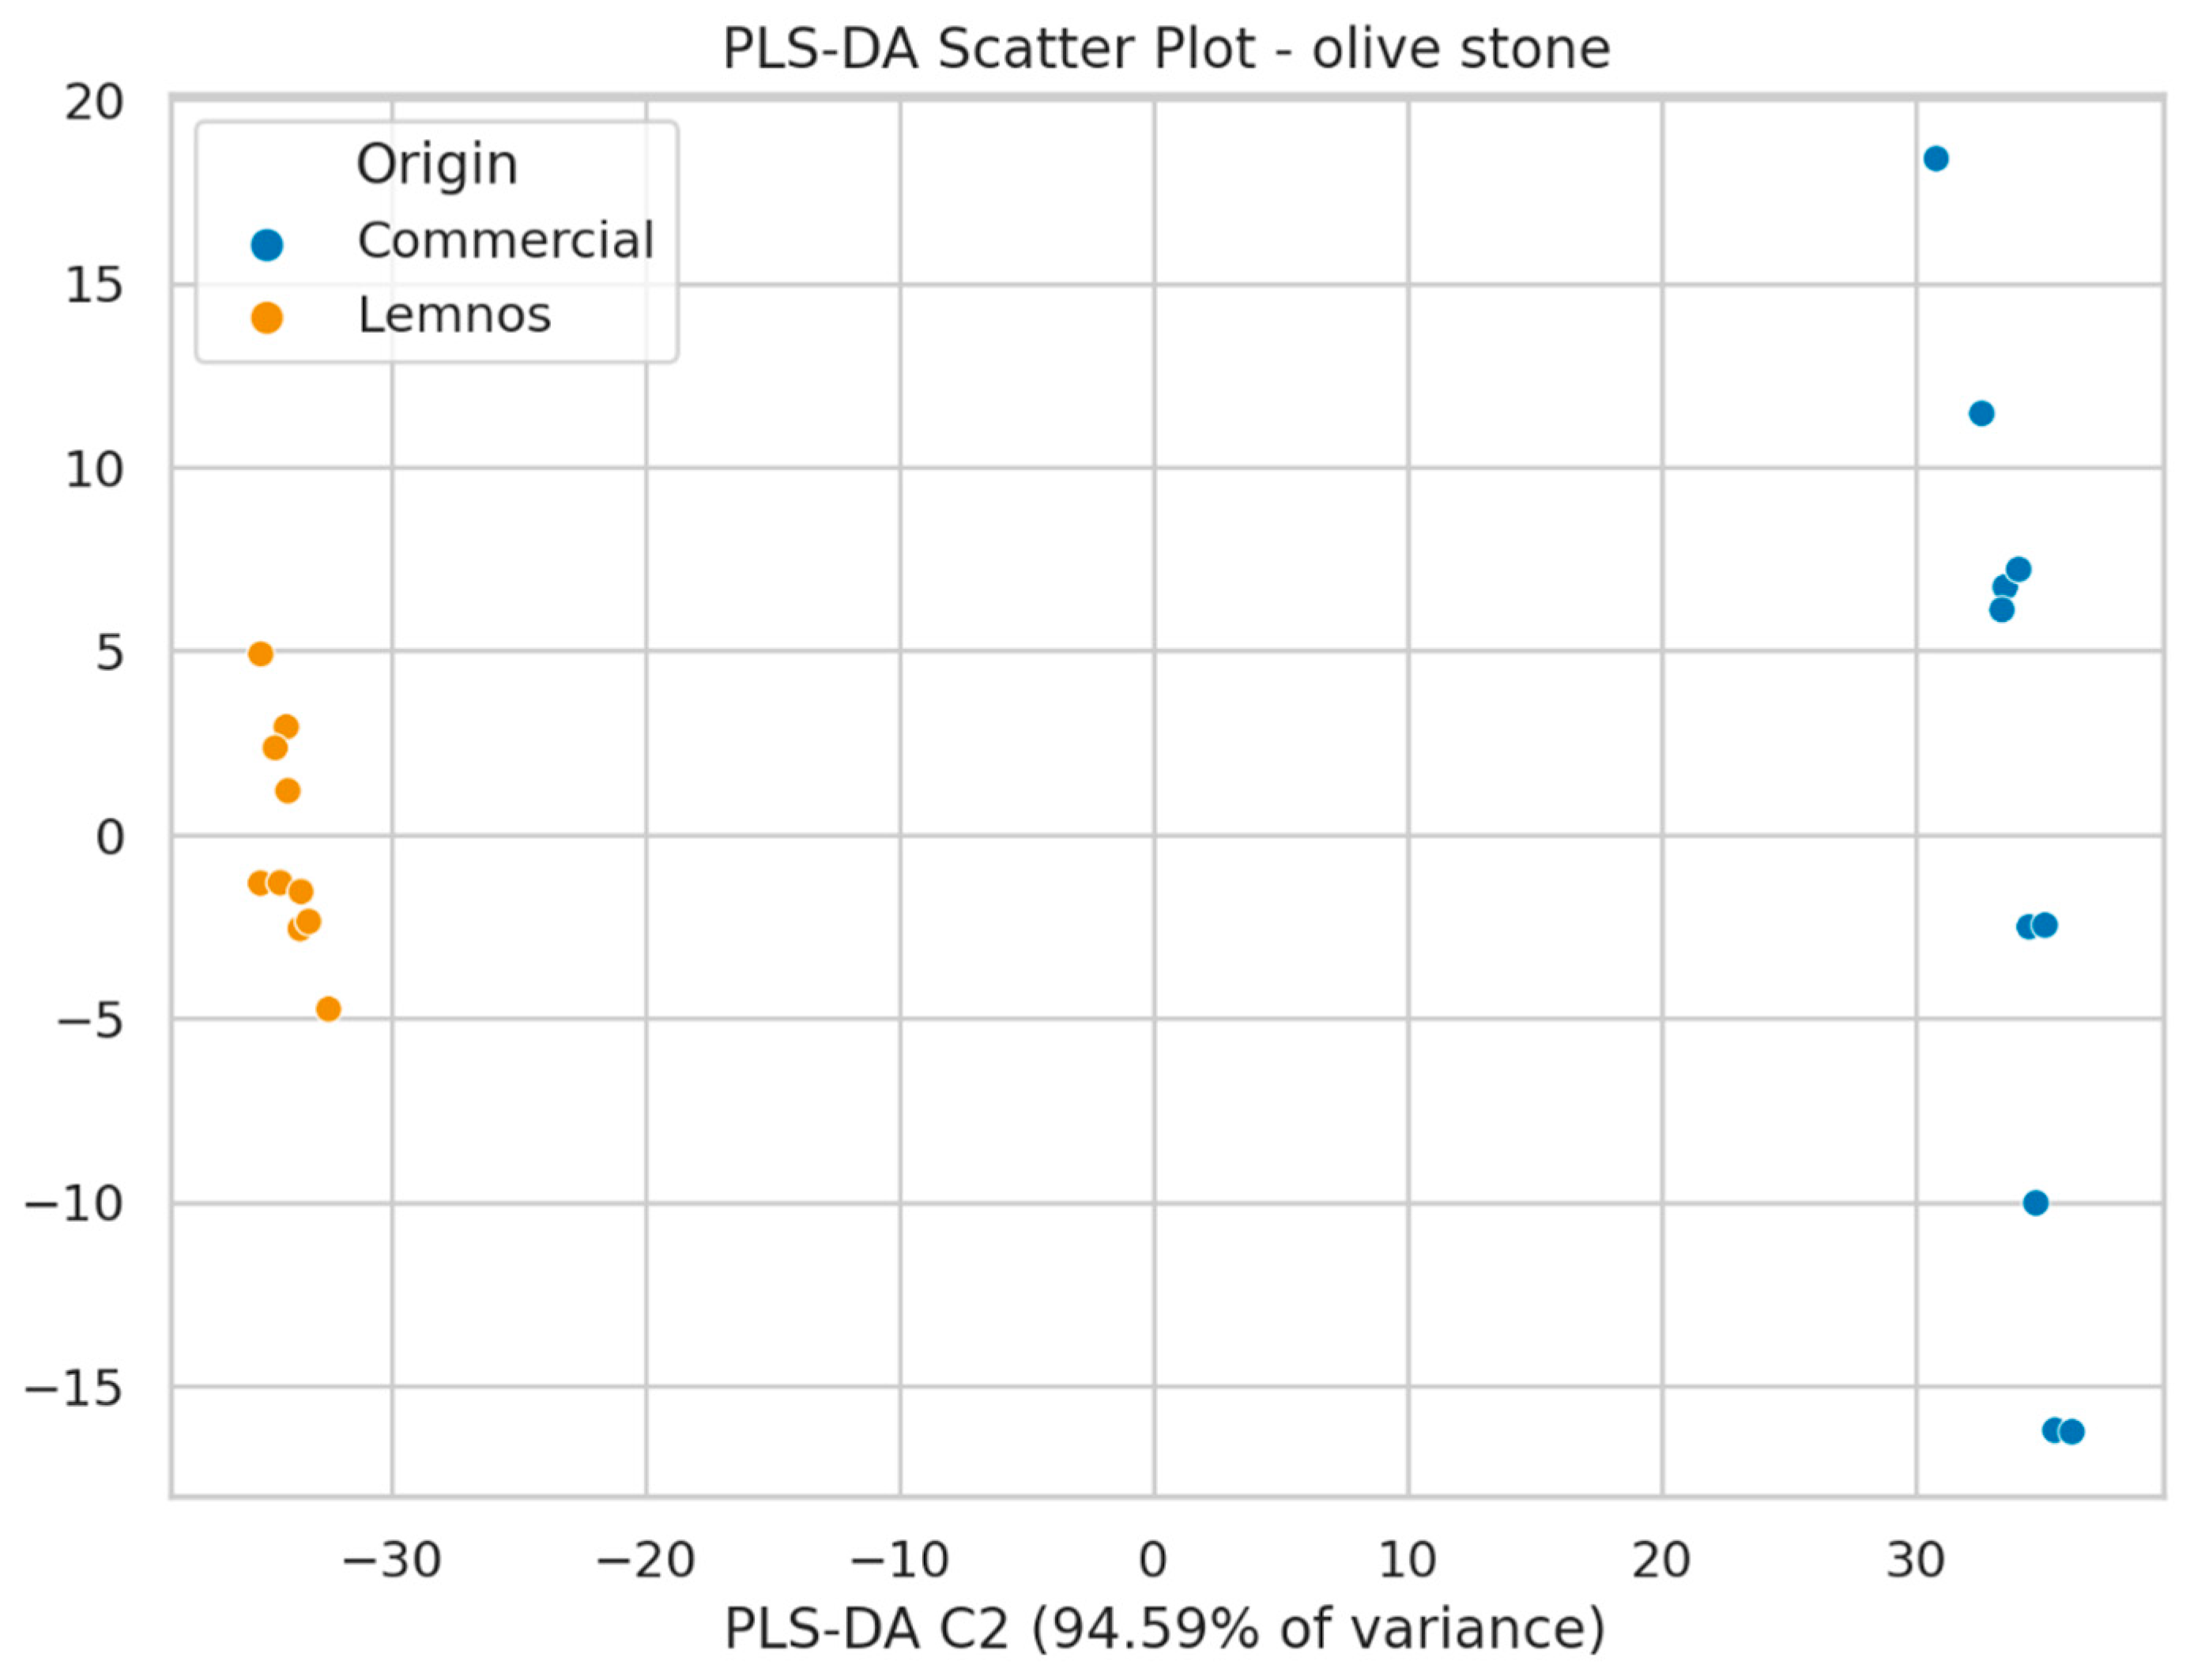
The next step involved the use of partial least squares-discriminant analysis (PLS-DA), which successfully distinguished commercial flours and the flour from Lemnos, both for grape seeds and olive stones (Figure 4 and Figure 5; see also Supplementary Figures S32 and S33 for the loadings plots). VIP scores were calculated for the PLS-DA model to identify the most significant features responsible for the classification of the samples. Compounds with VIP scores above 1.0 were selected as the most important, and in total, 56 mass features had high values for GSF, indicating they significantly contributed to the sample clustering, while 99 mass features contributed to the clustering for OSF (Figures S34 and S35). The model’s predictive value was satisfactory, with the goodness of fit (R2Y = 0.972) and predictability (Q2 = 0.796) values being acceptable. Permutation test statistics with 100 random permutations confirmed the model’s validity, as all permuted R2 and Q2 values were lower than the original values [53] (Figures S36 and S37). A receiver operating characteristic (ROC) curve was constructed to evaluate the model’s performance by plotting true positive and false positive rates. The area under the ROC curve (AUC) indicated that the model could classify all samples (GSF and OSF samples as well) with 100% accuracy (Figures S38 and S39).
The aforementioned VIP mass features for GSF and OSF are shown in Table 1. All features were tentatively identified using the SCIEX Natural Products Library, with a Library Match Score above 50.0. The MS/MS fragments were compared using literature records [54,55,56,57].
In OSF samples, 4-dihydroxybenzoic acid is a phenolic compound, related to other phenolics found in olives like hydroxytyrosol and oleuropein. Elenaic acid and one derivative of elenaic acid were tentatively identified. 16-Hydroxy-hexadecanoic acid, 9,10,18-trihydroxyoctadecanoic acid, (9R,10S)-dihydroxystearate, 13-hydroperoxylinolenic acid, and hexadecanedioate are fatty acid derivatives that are present in olives and, therefore, it is concluded that the functional ingredients of the matrix are present in the flour samples as well. Furthermore, 18-hydroxyoleate is a derivative of oleic acid, the primary fatty acid in olives. Chrysoeriol is a flavonoid that can be found in olive leaves and possibly in small amounts in olive oil. An intermediate in fatty acid oxidation. Salidroside, a glucoside derivative of tyrosol, is also found in olives as a marker and has been revealed to improve memory retrieval [58]. Cornoside is a lingstroside found in olives that is relatively abundant in young small olives [59]. All compounds are either directly found in olives or are related to compounds present in olives. Their nutritional significance lies primarily in their roles as antioxidants, anti-inflammatory agents, and contributors to lipid metabolism. The non-target screening results of the OSF samples are summarized in Table 1.
Table 1. Non-target screening results for olive stone flour (OSF) samples, including mass features with a variable importance in projection (VIP) score above 1.0, along with their library matches and plausible molecular formulas, tentative analytes, and Formula Finder scores.
[M − H]/RTVIPPlausible Molecular FormulaTentative AnalytePhytochemical ClassFormula Finder ScoreMassBank ID/Reference
109.0292/3.321.70990591C6H5O2 99
123.0449/3.613.88331912C7H8O2 99.9
153.0191/3.321.24806817C7H6O42,4-dihydroxybenzoic acidPhenolic acid91.2BS003106
153.0554/3.614.87762151C8H10O3 94.6
171.1023/7.771.32240845C8H14O 90
187.0966/7.652.20468526C9H16O4 82.76
199.0611/4.371.10983312C8H10O3HalleridoneTerpenoid90.7
215.0556/4.162.44049438C9H12O6 90.8
215.0914/6.361.91315487C11H20S2 90.4
223.0612/5.432.02782415C12H16S2 89
229.0717/4.571.35870769C10H14O6Elenaic acidLipid85.1[60]
241.1186/5.762.91752206C11H14O6Elenaic acid derivativeLipid84.1
253.2153/13.651.68171724C16H32O316-Hydroxy-hexadecanoic acidLipid91.1PR100487
265.0753/7.301.11639129C10H18O6S 90.5
265.1462/13.565.82308316C12H26O4S 90.9
266.1507/13.641.01144158C6H21N9OS 91.2
267.1956/12.451.32783509C16H30O4HexadecanedioateLipid derivative86.3JP001078
269.0445/9.022.64017779Apigenin (C15H10O6) 98.9
275.1039/6.151.30711949
279.2311/13.761.75842018C14H30N6O 99.6
281.2468/13.993.41644995C18H36O3 77.7
282.2510/13.993.53055616
283.2614/14.362.88130084C14H32N6 90.9
285.0386/8.369.07714971C15H10O6LuteolinFlavone95.9PM000420
286.0441/8.501.61411498
287.2212/10.645.0420702C16H32O4 90.6
293.2108/12.784.11240994
294.2158/12.841.05069407C18H34O3
295.2255/12.812.38947953C16H12O6
297.2417/13.641.15555122 18-HydroxyoleateLipid97[61]
299.0558/9.111.06125804C16H30O5ChrysoeriolFlavone92.1BS003342
299.1136/4.502.42334052C5H10N10O6
301.2009/10.452.5807432C18H30O4 92.3
305.0701/5.341.59445723C18H34O5 94.3
309.2069/12.081.20749047 13(S)-Hydroperoxylinolenic acidLipid derivative91.9EQ331602
311.2220/12.141.00496969C14H20O8 90.2
313.2372/12.312.63234722C18H36O4
315.1086/3.821.87543365C12H31N9OCornosideMonoterpenoid82.2[62]
315.2516/12.685.75432159C18H32O5(9R,10S)-DihydroxystearateLipid83.8
316.2560/12.681.87253721C18H34O6 99.6
327.2165/9.861.8513419C18H34O5 74.5
327.2170/10.581.27970038C18H34O5 89.4
329.2309/9.908.7666785C18H36O5 84.9
329.2312/10.4615.8827924C18H36O5 85
331.2397/10.583.15270061C20H18O5 73.7
331.2471/10.324.29045396C15H24N109,10,18-Trihydroxyoctadecanoic acidLipid82.9CB000003
337.1071/7.591.13852175C14H20O7 98.7
343.2103/9.765.61777449C18H34O6 90.1
345.1194/4.451.59752959C21H38O5SalidrosidePhenol93.2[63]
345.2267/10.142.43118178C14H30O4S 94.7
351.2535/13.801.65705829 90.7
353.1979/14.391.32301547C29H14N2 90.1
353.2683/14.033.8098374C24H40O4
389.1082/5.262.22477443C30H16N2 98.7
391.2846/13.981.54222771C30H16N2 99.9
403.1231/5.4311.927081C10H24N6O9S 97.7
403.1241/6.211.51585553C27H19NO3 93
403.1248/4.901.70275032C22H22N2O6 91.9
404.1284/5.462.71837775C26H42O4 83.2
409.1404/9.401.02744581C25H36O6 94.9
417.2995/14.022.96165422C25H36O7 86
431.2417/12.154.06742772C30H48O3 98.4
447.2371/12.051.69705193 79.9
455.3500/13.597.58565491C30H48O4 89.5
465.3191/13.912.81214421C21H46N8O4
471.3445/13.177.15603201C30H46O5 88.3
473.3526/13.151.17624378C26H44N6O3 91.2
485.3251/12.401.38424034C22H24N10O6 94.9
487.3408/12.621.05541295C26H28N4O8 89.4
523.1812/7.952.2817832C22H24N10O7 92.5
523.1823/6.691.98662549C31H28N4S3 94.9
539.1758/7.354.19041331C30H62N6O4 93.2
551.1401/7.201.30540864C27H30N4O9 89.5
551.4651/14.771.80521386C27H34N4O9 94.5
553.1923/8.171.01121826C27H26N4O10 80.5
557.2215/9.091.91276674C34H64O6 92.1
565.1570/7.801.48905009C37H72S2 95.5
567.4602/14.381.17748434C32H46N4O2S2 91.2
579.4967/15.891.53743162C36H65O6 94
581.2984/15.371.15630577C38H46O4S 94.9
593.4753/14.422.86762481C30H42N6O7 87.7
597.3028/14.891.26409343C26H28N10O9 91.7
597.3045/15.812.16408575C27H50N8O9 90.4
623.1956/6.316.10963709C36H38N4O8S 93.1
629.3615/3.801.63848932C36H38N4O8S 87.2
685.2318/6.7011.0557952C37H34N8O4S 94.3
685.2332/8.134.26228369C36H38N4O8S 94.8
685.2340/7.492.87707627C34H44N2O9S2 94.4
685.2350/8.852.42497379C29H46N6O6S4 95.6
687.2405/6.712.44188861C37H40N4O9S 94.7
701.2282/6.273.26078709C39H48O10S3 95.7
715.2448/6.862.14610112C33H42N9O7S3 95.2
771.2324/7.566.88415023C39H44N4O7S3 91.3
772.2375/7.583.06952732C40H46N4O7S3 90.7
775.2283/7.135.04216623C32H42N10O10S2 97.6
789.2423/6.925.89403491C38H74N8O10S 94.3
789.2428/7.766.82049513C43H80N8S4 94.8
833.5162/13.971.10683778C6H5O2 99
835.5312/13.982.88542004C7H8O2 96
In GSF samples, non-target screening resulted in the tentative identification of 12 compounds, which are listed in Table 2. Tartaric acid is a major organic acid in grapes, contributing to the acidity of grape products. Gluconic acid is another compound found in grapes. Catechin and quercetin were already determined via target screening. Brevifolincarboxylic acid is a phenolic compound with potential health effects. Ellagic acid is present in grapes. Phloionolic acid is a triterpenoid compounds that can be found in certain grape species. Amurensisin is also found in grape species. Epicatechin gallate is a flavonoid known for its antioxidant activity. Oleanolic acid is a triterpenoid found in grape skins, though it is more abundant in other plants. Myricetin-3-O-glucoside is a myricetin derivative common in grape skins that contributes to the antioxidant properties. Persicogenin was also detected. Quercetin 3-O-glucuronide (miquelianin) is a quercetin derivative found in grape skins. These compounds can potentially be used as markers for the discrimination of flours on the basis of their geographical origin.
In conclusion, non-target analysis facilitated the creation of a robust PLS-DA model that accurately classified the samples according to their origin. The further application of chemometric models to GSF and OSF revealed distinct bioactive fingerprints among functional flours from different origins. This variation is likely due to the samples originating from different geographical regions, agricultural practices, and milling processes.

3. Materials and Methods

3.1. Flour Samples

Twenty flours originating from Lemnos were sourced locally, namely ten grape seed flours (GSFLs) and ten olive stone flours (OSFLs). Concerning the grape seed flours, a mass of grapes was provided by local distilleries, from which the seeds were separated and dried for 24 h. Then, they were ground in a professional mixer, and the resulting powder was passed through a sieve to obtain the smallest grain-size flour. Olive stone flour was prepared similarly to grape seed flour. A mass of olive skins and stones was supplied from local farmers, was dried for 24 h, and then ground into a fine powder, which was sieved. Additionally, ten commercially available grape seed flours (GSFCs) and ten olive stone flours (OSFCs) were procured from two separate retailers. Specifically, GSFC was sourced from PaleoCentrum in Budapest, Hungary, and OSFC was purchased from Nutexa in Valencia, Spain.

3.2. Chemicals and Standards

Methanol and water (LC-MS grade) were purchased from HiPerSolv CHROMANORM, VWR Chemicals BDH (Amsterdam, The Netherlands). Formic acid 98–100% was purchased from Merck (Darmstadt, Germany). For the determination of phenolic compounds, apigenin 98%, caffeic acid 98%, catechin 97%, cinnamiccinnamic acid 97%, chrysin 98%, diosmin 97%, epicatechin, epigallocatechin 97%, ferulic acid 98%, epicatechin gallate 98%, hesperidin 98% (internal standard), kaempferol 98%, luteolin 98%, myritecin 97%, myricitrin 97%, naringin 98%, p-coumaric acid 98%, quercetin 98%, quercitrin 99%, rosmarinic acid 98%, protocatechuic acid 97%, rutin 98%, sinapic acid 98%, syringaldehyde 97%, syringic acid 98%, taxifolin 98%, vanillic acid 98%, and vanillin 98% were used and were purchased from Sigma-Aldrich (Stenheim, Germany). Stock standard solutions of all the analytical standard compounds were prepared with LC-MS-grade methanol at 1000 mg/L and were afterward stored in dark brown glass bottles at −20 °C.

3.3. Sample Preparation

For sample preparation, 0.1g of flour sample was weighted in an Eppendorf tube and 1 mL of MeOH: H2O (80:20, v/v) was added for the extraction of bioactive compounds. There was no incubation applied to the samples. The mixture was vortexed for 1 min and then centrifuged at 14,000 rpm at 25 °C for 10 min. Then, the extract was collected and filtered using 0.22 μm nylon syringe filters (Captiva, Agilent Technologies, Santa Clara, CA, USA). Hesperidin was as added as an internal standard at a 1 mg/Kg concentration level to monitor instrument response, and the samples were then directly injected into the chromatographic system.

3.4. Instrumental Analysis

Chromatographic analysis was conducted using an ExionAC LC system (SCIEX, Framingham, MA, USA) coupled with a quadrupole time-of-flight (QTOF) mass spectrometer. The X500R Q-TOF mass spectrometer (SCIEX, Framingham, MA, USA) equipped with an electrospray ionization (ESI) turboVTM source was connected to the LC system and it was operated in the negative ionization mode. TOF–MS and TOF–MS/MS data were acquired using the dependent acquisition electrospray ionization mode. Nebulizer gas, heater gas, and curtain gas pressures were set at 55 psi, 50 psi, and 30 psi, respectively. The spray ion spray voltage was −4500 V, with a declustering potential of 80 V. MS/MS spectra were obtained at a collision energy of 45 eV and a collision energy spread of 15 eV. External calibration was performed before the analysis with a cluster solution pro-vided by SCIEX, and additionally, the calibration solution was injected at the beginning of each run for internal calibration and once per five samples during batch acquisition. Mass spectra were recorded in the m/z range from 50 to 1000, at an accumulation time of 0.25 s. MS/MS experiments were conducted in the data-dependent acquisition mode, at an accumulation time of 0.08 s for the 10 most abundant precursor ions per full scan. Sample acquisition was monitored by the SCIEX OS software v. 3.4.5. Extraction ion chromatograms were generated using the SCIEX OS software. The established parameters were as follows: mass accuracy window, 5 ppm; S/N threshold, 3; minimum area threshold, 1000; minimum intensity threshold, 500.
Chromatographic separation was carried out using a C18 column (2.1 × 100 mm, 2.6 µm) from Fortis (Cheshire, UK), thermostated at 40 °C. The mobile phase (A) was an aqueous solution with 0.1% formic acid, and mobile phase (B) consisted of a methanolic solution with 0.1% formic acid. The adopted gradient elution program began with 1% organic phase (B) at a flow rate of 0.2 mL min−1 for one minute, gradually increasing to 39% over the next four minutes, then to 95% (12–15 min), and maintaining this composition for the subsequent three minutes (flow rate of 0.4 mL min−1). Subsequently, the organic phase increased gradually to 99% within one minute at a flow rate of 0.2 mL min−1 and remained constant for an additional four minutes (16–20 min). Finally, the system was returned to its initial conditions (1% B–99% A) within 0.1 min (flow rate decreased to 0.2 mL min−1) to re-equilibrate the column for 5 min before the next injection.

3.5. Screening Methodology

In LC-QTOF-MS/MS methodologies, target, suspect, and non-target screening are complementary approaches for compound detection. Target screening focuses on identifying and quantifying known compounds using reference databases. Suspect screening searches for expected compounds without reference standards, relying on predicted molecular formulas and fragmentation patterns. Non-target screening detects unknown compounds without prior assumptions, requiring advanced data processing and statistical analysis. Together, these approaches enable comprehensive profiling: non-target screening uncovers novel compounds, suspect screening enables tentative identification, and target screening ensures high-confidence confirmation and quantification [68]. The screening workflow for this study is depicted in Figure 6.

3.5.1. Target Screening

A target list comprising ten significant phenolic acids commonly found in plant-based foods, eighteen flavonoids present in various plant parts such as seeds and roots, and two methoxyphenols was established. This target list is detailed in Table S1 of the Supplementary Materials, and the analytical standards are described in Section 3.2. The classification of these compounds was conducted using FoodDB [69]. For each target compound, extracted ion chromatograms (EICs) of the precursor ions were generated and assessed across the samples using the Analytics package within the SCIEX OS software. The screening of target compounds in the samples was based on predefined parameters, including mass accuracy of the precursor ion and the MS/MS fragments with a selection window of 5 ppm, retention time tolerance (tR < 0.2 min), a response peak area threshold of above 1000, and peak intensity of at least 1000. Mean and standard deviation were calculated with the IBM SPSS Statistics v.23 software (Armonk, NY, USA: IBM Corp).

3.5.2. Suspect Screening

For suspect screening, a database was compiled from the existing literature containing phenolic compounds previously identified in grape and olive matrices. This database aimed to detect the presence of these compounds in the samples. The in-house suspect database comprised 74 compounds from grapes (stems, skins, and seeds) and 90 compounds from olives, olive trees, and olive oil. Tables S2 and S3 in the Supplementary Materials display the suspect lists, and compound classification was conducted using FoodDB [69].
Upon the detection of a peak in the matrix, the presence of the suspect compound was determined through the analysis of MS/MS fragments against those in mass spectral libraries. Additionally, in silico fragmentation tools such as MetFrag [33] and MassBank [34] were utilized. MetFrag was employed using the neutral exact mass with a mass error of 5 ppm and the appropriate ionization mode, while MassBank employed the compound name, exact mass (tolerance = 0.3), and molecular formula in the negative ionization mode. Similar to target analysis, mean and standard deviation were calculated with the IBM SPSS Statistics v.23 software (Armonk, NY, USA: IBM Corp).

3.5.3. Non Target Screening

Non-target screening involves detecting peaks and identifying compounds without prior information or available standards. The non-target screening process utilized the Analytics SCIEX OS software. Within this workflow, the non-targeted screening algorithm was selected. Peaks were provisionally identified based on mass accuracy, with a maximum threshold set at 5 ppm, and a fragmentation mass error of 10 ppm. For library searches, the smart confirmation search algorithm was chosen, with results sorted by purity.
Given the substantial amount of data generated by non-target analysis, the utilization of chemometric tools (CIMCB package v. 2.1.2 (https://github.com/CIMCB/cimcb, accessed on 20 March 2025)) becomes essential for interpretation. A multivariate statistical analysis was performed using both supervised and unsupervised models, specifically principal component analysis (PCA) and partial least squares-discriminant analysis (PLS-DA). The primary objective of PCA is to decrease the dimensionality of a dataset with many interrelated variables, while preserving as much of the original variation in the data as possible [70]. Additionally, PLS-DA was used because of its ability to achieve dimensionality reduction while fully considering the class labels, and it is suitable for feature selection and classification [71]. Variable importance in projection (VIP) scores are employed to identify the most significant features for class discrimination, incorporating bootstrap iterations offers a statistically robust approach compared to relying on a single random split of the data. Bootstrap aggregation, by generating numerous replicates of the dataset via sampling with replacement, addresses inherent variability within the data. This iterative process yields an ensemble of VIP scores, from which the mean is calculated. This mean VIP score provides a more reliable estimate of feature importance compared to a single instance, as it attenuates the influence of any single random split and captures the variability in the VIP score distribution. Consequently, features with consistently high mean VIP scores across bootstrap iterations can be confidently identified as the most important for model performance and subsequent interpretations [72,73]. A VIP cut-off value of 1.00 was applied to identify the most influential phenolic compounds. Subsequently, the model’s validity was assessed using cross-validation parameters (R2Y: goodness of fit and Q2Y: goodness of prediction) and permutation plots. Loading plots were used to evaluate the impact of each mass feature on a principal component. Features with a high degree of influence were further investigated, with plausible formulas proposed using the Formula Finder tool in the SCIEX OS software. The SCIEX Natural Products High Resolution MS/MS Spectral Library then suggested viable candidates. Only matches with a Formula Finder or Library Match Score of 50.0 or higher were considered high-confidence proposed formulas or compounds [74].

Supplementary Materials

The following supporting information can be downloaded at: https://www.mdpi.com/article/10.3390/molecules30071527/s1. Table S1. Target screening list of compounds; Table S2. Calibration values (peak area) for target screening compounds; Table S3. Target screening results for commercial grape seed flour (GSFC) and grape seed flour from Lemnos (GSFL); Table S4. Suspect screening list for grape seed flour; Table S5. Suspect screening results for commercial grape seed flour (GSFC) and grape seed flour from Lemnos (GSFL); Table S6. Target screening results for commercial olive stone flour (OSFC) and olive stone flour from Lemnos (OSFL); Table S7. Suspect screening list for olive stone flour; Table S8. Suspect screening results for commercial olive stone flour (OSFC) and olive stone flour from Lemnos (OSFL); Figure S1. Extracted ion chromatogram, MS, and MS/MS spectra of apigenin in GSFC; Figure S2. Extracted ion chromatogram, MS, and MS/MS spectra of caffeic acid in GSFL; Figure S3. Extracted ion chromatogram, MS, and MS/MS spectra of catechin in GSFL; Figure S4. Extracted ion chromatogram, MS, and MS/MS spectra of chrysin in GSFC; Figure S5. Extracted ion chromatogram, MS, and MS/MS spectra of coumaric acid in GSFL; Figure S6. Extracted ion chromatogram, MS, and MS/MS spectra of diosmin in GSFL; Figure S7. Extracted ion chromatogram, MS, and MS/MS spectra of epicatechin gallate in GSFL; Figure S8. Extracted ion chromatogram, MS, and MS/MS spectra of epigallocatechin in GSFC; Figure S9. Extracted ion chromatogram, MS, and MS/MS spectra of gallic acid in GSFC; Figure S10. Extracted ion chromatogram, MS, and MS/MS spectra of myricetin in GSFL; Figure S11. Extracted ion chromatogram, MS, and MS/MS spectra of protocatechuic acid in GSFC; Figure S12. Extracted ion chromatogram, MS, and MS/MS spectra of quercetin in GSFL; Figure S13. Extracted ion chromatogram, MS, and MS/MS spectra of quercitrin in GSFC; Figure S14. Extracted ion chromatogram, MS, and MS/MS spectra of rutin in GSFL; Figure S15. Extracted ion chromatogram, MS, and MS/MS spectra of apigenin in OSFL; Figure S16. Extracted ion chromatogram, MS, and MS/MS spectra of caffeic acid in OSFC; Figure S17. Extracted ion chromatogram, MS, and MS/MS spectra of chrysin in OSFC; Figure S18. Extracted ion chromatogram, MS, and MS/MS spectra of coumaric acid in OSFC; Figure S19. Extracted ion chromatogram, MS, and MS/MS spectra of diosmin in OSFL; Figure S20. Extracted ion chromatogram, MS, and MS/MS spectra of ferulic acid in OSFL; Figure S21. Extracted ion chromatogram, MS, and MS/MS spectra of gallic acid in OSFL; Figure S22. Extracted ion chromatogram, MS, and MS/MS spectra of luteolin in OSFL; Figure S23. Extracted ion chromatogram, MS, and MS/MS spectra of quercetin in OSFL; Figure S24. Extracted ion chromatogram, MS, and MS/MS spectra of quercitrin in OSFL; Figure S25. Extracted ion chromatogram, MS, and MS/MS spectra of rutin in OSFL; Figure S26. Extracted ion chromatogram, MS, and MS/MS spectra of sinapic acid in OSFC; Figure S27. Extracted ion chromatogram, MS, and MS/MS spectra of taxifolin in OSFL; Figure S28. Extracted ion chromatogram, MS, and MS/MS spectra of vanillic acid in OSFC; Figure S29. Extracted ion chromatogram, MS, and MS/MS spectra of vanillin in OSFL; Figure S30. Loadings plot for GSFC and GSFL corresponding to PCA; Figure S31. Loadings plot for OSFC and OSFL corresponding to PCA; Figure S32. Loadings plot for GSFC and GSFL corresponding to the PLS-DA model; Figure S33. Loadings plot for OSFC and OSFL corresponding to the PLS-DA model; Figure S34. VIP scores corresponding to the PLS-DA model for GSFC and GSFL; Figure S35. VIP scores corresponding to the PLS-DA model for OSFC and OSFL; Figure S36. Permutation test corresponding to the PLS-DA model for GSFC and GSFL; Figure S37. Permutation test corresponding to the PLS-DA model for OSFC and OSFL; Figure S38. ROC curve corresponding to the PLS-DA model for GSFC and GSFL (LV1, LV2: Explanatory variables); Figure S39. ROC curve corresponding to the PLS-DA model for OSFC and OSFL (LV1, LV2: Explanatory variables).

Author Contributions

A.P.Z.: Investigation, Writing—original draft. N.P.K.: Conceptualization, Methodology, Investigation, Validation, Writing—review and editing, Supervision. I.M.: Conceptualization, Methodology, Supervision, Writing—review and editing. D.S.: Conceptualization, Investigation, Project administration, Supervision. K.G.: Conceptualization, Investigation, Project administration, Funding acquisition, Writing—review and editing, Supervision. All authors have read and agreed to the published version of the manuscript.

Funding

This research was co-financed by the European Regional Development Fund of the European Union and Greek national funds through the Operational Program Competitiveness, Entrepreneurship and Innovation, under the call RESEARCH—CREATE—INNOVATE (project code: Τ2EDK-02137).

Institutional Review Board Statement

Not applicable.

Informed Consent Statement

Not applicable.

Data Availability Statement

Data are available upon request.

Acknowledgments

The authors are grateful to Poriazi Family, Lemnos, for providing the locally sourced raw materials as well as Interdisciplinary Agri-Food Center (KEAGRO), Aristotle University of Thessaloniki, for providing access to the equipment of the unit.

Conflicts of Interest

The authors declare no conflicts of interest.

References

  1. Rekleitis, G.; Haralambous, K.-J.; Loizidou, M.; Aravossis, K. Utilization of agricultural and livestock waste in anaerobic digestion (A.D): Applying the biorefinery concept in a circular economy. Energies 2020, 13, 4428. [Google Scholar] [CrossRef]
  2. Zouboulis, A. Project: Best Practices for Agricultural Wastes (AW) Treatment and Reuse in the Mediterranean Countries. 2011. Available online: https://webgate.ec.europa.eu/life/publicWebsite/project/LIFE10-ENV-GR-000594/best-practices-for-agricultural-wastes-treatment-and-reuse-in-the-mediterranean-countries (accessed on 20 March 2025).
  3. Madureira, J.; Margaça, F.M.A.; Santos-Buelga, C.; Ferreira, I.C.F.R.; Verde, S.C.; Barros, L. Applications of bioactive compounds extracted from olive industry wastes: A review. Compr. Rev. Food Sci. Food Saf. 2021, 21, 453–476. [Google Scholar] [CrossRef]
  4. Amaya-Chantaca, D.; Flores-Gallegos, A.C.; Iliná, A.; Aguilar, C.N.; Verma, D.K.; Baranwal, D.; Chávez-González, M.L. Wine waste as a potential source of bioactive compounds. In Innovations in Fermentation and Phytopharmaceutical Technologies; Elsevier: Amsterdam, The Netherlands, 2022; pp. 361–380. [Google Scholar]
  5. Stefano, D.; Buzzanca, V.; Melilli, C.; Indelicato, S.; Mauro, M.; Vazzana, M.; Arizza, V.; Lucarini, M.; Durazzo, A.; Bongiorno, D. Polyphenol Characterization and Antioxidant Activity of Grape Seeds and Skins from Sicily: A Preliminary Study. Sustainability 2022, 14, 6702. [Google Scholar] [CrossRef]
  6. Jahanbakhshi, R.; Ansari, S. Physicochemical properties of sponge cake fortified by olive stone powder. J. Food Qual. 2020, 2020, 1493638. [Google Scholar] [CrossRef]
  7. Ben Mansour, A.; Porter, E.A.; Kite, G.C.; Simmonds, M.S.J.; Abdelhedi, R.; Bouaziz, M. Phenolic profile characterization of chemlali olive stones by liquid chromatography-ion trap mass spectrometry. J. Agric. Food Chem. 2015, 63, 1990–1995. [Google Scholar] [CrossRef]
  8. Marković, A.K.; Torić, J.; Barbarić, M.; Brala, C.J. Hydroxytyrosol, tyrosol and derivatives and their potential effects on human health. Molecules 2019, 24, 2001. [Google Scholar] [CrossRef]
  9. Maestri, D.; Barrionuevo, D.; Bodoira, R.; Zafra, A.; Jiménez-López, J.; Alché, J.d.D. Nutritional profile and nutraceutical components of olive (Olea europaea L.) seeds. J. Food Sci. Technol. 2019, 56, 4359–4370. [Google Scholar] [CrossRef]
  10. Ali, K.; Maltese, F.; Choi, Y.H.; Verpoorte, R. Metabolic constituents of grapevine and grape-derived products. Phytochem. Rev. 2009, 9, 357–378. [Google Scholar] [CrossRef] [PubMed]
  11. Santini, A.; Tenore, G.C.; Novellino, E. Nutraceuticals: A paradigm of proactive medicine. Eur. J. Pharm. Sci. 2017, 96, 53–61. [Google Scholar] [CrossRef]
  12. Hao, J.; Li, L.; Wolf, M.; Xu, M.; Brinsko, B.; Yanik, M.; Chen, S.; Binzer, L.; Green, S.; Hitz, C.; et al. Antioxidant properties and phenolic components of grape seeds. Funct. Plant Sci. Biotechnol. 2009, 3, 60–68. [Google Scholar]
  13. Kallithraka, S.; Garcia-Viguera, C.; Bridle, P.; Bakker, J. Survey of solvents for the extraction of grape seed phenolics. Phytochem. Anal. 1995, 6, 265–267. [Google Scholar] [CrossRef]
  14. Toop, T.A.; Ward, S.; Oldfield, T.; Hull, M.; Kirby, M.E.; Theodorou, M.K. AgroCycle—Developing a circular economy in agriculture. Energy Procedia 2017, 123, 76–80. [Google Scholar] [CrossRef]
  15. Valvez, S.; Maceiras, A.; Santos, P.; Reis, P.N.B. Olive stones as filler for polymer-based composites: A review. Materials 2021, 14, 845. [Google Scholar] [CrossRef]
  16. Bolek, S. Olive stone powder: A potential source of fiber and antioxidant and its effect on the rheological characteristics of biscuit dough and quality. Innov. Food Sci. Emerg. Technol. 2020, 64, 102423. [Google Scholar] [CrossRef]
  17. Oprea, O.B.; Popa, M.E.; Apostol, L.; Gaceu, L. Research on the potential use of grape seed flour in the bakery industry. Foods 2022, 11, 1589. [Google Scholar] [CrossRef]
  18. Aghamirzaei, M.; Peighambardoust, S.H.; Azadmard-Damirchi, S.; Majzoobi, M. Effects of Grape Seed Powder as a Functional Ingred Ient on Flour Physicochemical Characteristics and Dough Rheological Properties. J. Agric. Sci. Technol. 2018, 17, 365–373. [Google Scholar]
  19. Antonic, B.; Dordevic, D.; Jancikova, S.; Holeckova, D.; Tremlova, B.; Kulawik, P. Effect of grape seed flour on the antioxidant profile, textural and sensory properties of waffles. Processes 2021, 9, 131. [Google Scholar] [CrossRef]
  20. Soto, R.; Brown, M.U.; Ross, K. Antioxidant activity and consumer acceptance of grape seed flour-containing food products. Int. J. Food Sci. Technol. 2012, 47, 592–602. [Google Scholar]
  21. Hoye, J.C.; Ross, C.F. Total phenolic content, consumer acceptance, and instrumental analysis of bread made with grape seed flour. J. Food Sci. 2011, 76, S428–S436. [Google Scholar] [CrossRef]
  22. Fraga, H.; Moriondo, M.; Leolini, L.; Santos, J.A. Mediterranean olive orchards under climate change: A review of future impacts and adaptation strategies. Agronomy 2020, 11, 56. [Google Scholar] [CrossRef]
  23. Mousavi, S.; Stanzione, V.; Mariotti, R.; Mastio, V.; Azariadis, A.; Passeri, V.; Valeri, M.C.; Baldoni, L.; Bufacchi, M. Bioactive compound profiling of olive fruit: The contribution of genotype. Antioxidants 2022, 11, 672. [Google Scholar] [CrossRef] [PubMed]
  24. Ighbareyeh, J.M.; Carmona, E.C. Impact of environment conditions on grapevine (Vitis vinifera L.): To optimal production and sustainability, achieving food security and increasing the Palestinian economy. J. Geosci. Environ. Prot. 2018, 6, 62–73. [Google Scholar] [CrossRef]
  25. Tsarouhas, P.; Achillas, C.; Aidonis, D.; Folinas, D.; Maslis, V. Life Cycle Assessment of olive oil production in Greece. J. Clean. Prod. 2015, 93, 75–83. [Google Scholar] [CrossRef]
  26. Silva, A.; Silva, V.; Igrejas, G.; Aires, A.; Falco, V.; Valentão, P.; Poeta, P. Phenolic compounds classification and their distribution in winemaking by-products. Eur. Food Res. Technol. 2022, 249, 207–239. [Google Scholar] [CrossRef]
  27. Kapcsándi, V.; Lakatos, E.H.; Sik, B.; Linka, L.Á.; Székelyhidi, R. Antioxidant and polyphenol content of different Vitis vinifera seed cultivars and two facilities of production of a functional bakery product. Chem. Pap. 2021, 75, 5711–5717. [Google Scholar] [CrossRef]
  28. Juhaimi, A.; Özcan, F. Effect of cold press and soxhlet extraction systems on fatty acid, tocopherol contents, and phenolic compounds of various grape seed oils. J. Food Process. Preserv. 2018, 42, e13417. [Google Scholar]
  29. Yilmaz, Y.; Toledo, R.T. Major flavonoids in grape seeds and skins: Antioxidant capacity of catechin, epicatechin, and gallic acid. J. Agric. Food Chem. 2003, 52, 255–260. [Google Scholar] [CrossRef]
  30. Bucić-Kojić, A.; Planinić, M.; Tomas, S.; Jakobek, L.; Šeruga, M. Influence of solvent and temperature on extraction of phenolic compounds from grape seed, antioxidant activity and colour of extract. Int. J. Food Sci. Technol. 2009, 44, 2394–2401. [Google Scholar] [CrossRef]
  31. Gouvinhas, I.; Santos, R.; Queiroz, M.; Leal, C.; Saavedra, M.J.; Domínguez-Perles, R.; Rodrigues, M.A.M.; Barros, A. Monitoring the Antioxidant and Antimicrobial Power of Grape (Vitis vinifera L.) Stems Phenolics over Long-Term Storage. Ind. Crops Prod. 2018, 126, 83–91. [Google Scholar] [CrossRef]
  32. Perde-Schrepler, M.; Chereches, G.; Brie, I.; Tatomir, C.; Postescu, I.D.; Soran, L.; Filip, A. Grape seed extract as photochemopreventive agent against UVB-induced skin cancer. J. Photochem. Photobiol. B Biol. 2013, 118, 16–21. [Google Scholar] [CrossRef]
  33. Wolf, S.; Schmidt, S.; Müller-Hannemann, M.; Neumann, S. In silico fragmentation for computer assisted identification of metabolite mass spectra. BMC Bioinform. 2010, 11, 148. [Google Scholar] [CrossRef]
  34. Horai, H.; Arita, M.; Kanaya, S.; Nihei, Y.; Ikeda, T.; Suwa, K.; Ojima, Y.; Tanaka, K.; Tanaka, S.; Aoshima, K.; et al. MassBank: A public repository for sharing mass spectral data for life sciences. J. Mass Spectrom. 2010, 45, 703–714. [Google Scholar] [CrossRef]
  35. Deepika; Maurya, P.K. Health benefits of quercetin in age-related diseases. Molecules 2022, 27, 2498. [Google Scholar] [CrossRef] [PubMed]
  36. Hong, N.; Yaylayan, V.A.; Raghavan, G.S.V.; Paré, J.R.J.; Bélanger, J.M.R. Microwave-assisted extraction of phenolic compounds from grape seed. Nat. Prod. Lett. 2001, 15, 197–204. [Google Scholar] [CrossRef]
  37. Zhang, Y.; Zhai, Y.; Wei, X.; Yang, X.; Deng, C.; Li, Q.; Wang, W.; Hao, R. Effects of grape seed procyanidins on the lipid metabolism of growing-finishing pigs based on transcriptomics and metabolomics analyses. Meat Sci. 2024, 213, 109504. [Google Scholar] [CrossRef] [PubMed]
  38. Unusan, N. Proanthocyanidins in grape seeds: An updated review of their health benefits and potential uses in the food industry. J. Funct. Foods 2020, 67, 103861. [Google Scholar] [CrossRef]
  39. Kang, I.; Buckner, T.; Shay, N.F.; Gu, L.; Chung, S. Improvements in metabolic health with consumption of ellagic acid and subsequent conversion into urolithins: Evidence and mechanisms. Adv. Nutr. Int. Rev. J. 2016, 7, 961–972. [Google Scholar] [CrossRef]
  40. Mateus, A.R.S.; Barros, S.C.; Cortegoso, S.M.; Sendón, R.; Barbosa-Pereira, L.; Khwaldia, K.; Pataro, G.; Ferrari, G.; Breniaux, M.; Ghidossi, R.; et al. Potential of fruit seeds: Exploring bioactives and ensuring food safety for sustainable management of food waste. Food Chem. X 2024, 23, 101718. [Google Scholar] [CrossRef]
  41. Barberis, A.; Deiana, M.; Spissu, Y.; Azara, E.; Fadda, A.; Serra, P.A.; D’Hallewin, G.; Pisano, M.; Serreli, G.; Orrù, G.; et al. Antioxidant, antimicrobial, and other biological properties of pompia juice. Molecules 2020, 25, 3186. [Google Scholar] [CrossRef]
  42. Liu, Y.; Shi, X.; Tian, Y.; Zhai, S.; Liu, Y.; Xiong, Z.; Chu, S. An insight into novel therapeutic potentials of taxifolin. Front. Pharmacol. 2023, 14, 1173855. [Google Scholar] [CrossRef]
  43. EFSA Panel on Dietetic Products, Nutrition and Allergies (NDA); Turck, D.; Bresson, J.L.; Burlingame, B.; Dean, T.; Fairweather-Tait, S.; Heinonen, M.; Hirsch-Ernst, K.I.; Mangelsdorf, I.; McArdle, H.J.; et al. Scientific Opinion on taxifolin-rich extract from Dahurian Larch (Larix gmelinii). EFSA J. 2017, 15, e04682. [Google Scholar] [CrossRef] [PubMed]
  44. Frankel, E.; Bakhouche, A.; Lozano-Sánchez, J.; Segura-Carretero, A.; Fernández-Gutiérrez, A. Literature review on production process to obtain extra virgin olive oil enriched in bioactive compounds. potential use of byproducts as alternative sources of polyphenols. J. Agric. Food Chem. 2013, 61, 5179–5188. [Google Scholar] [CrossRef]
  45. Servili, M.; Taticchi, A.; Esposto, S.; Urbani, S.; Selvaggini, R.; Montedoro, G.F. Effect of olive stoning on the volatile and phenolic composition of virgin olive oil. J. Agric. Food Chem. 2007, 55, 7028–7035. [Google Scholar] [CrossRef] [PubMed]
  46. Spizzirri, U.G.; Restuccia, D.; Chiricosta, S.; Parisi, O.I.; Cirillo, G.; Curcio, M.; Iemma, F.; Puoci, F.; Picci, N. Olive stones as a source of antioxidants for food industry. J. Food Nutr. Res. 2011, 50, 57–67. [Google Scholar]
  47. Fernández-Bolaɂos, J.; Felizón, B.; Brenes, M.; Guillén, R.; Heredia, A. Hydroxytyrosol and tyrosol as the main compounds found in the phenolic fraction of steam-exploded olive stones. J. Am. Oil Chem. Soc. 1998, 75, 1643–1649. [Google Scholar] [CrossRef]
  48. Barbaro, B.; Toietta, G.; Maggio, R.; Arciello, M.; Tarocchi, M.; Galli, A.; Balsano, C. Effects of the olive-derived polyphenol oleuropein on human health. Int. J. Mol. Sci. 2014, 15, 18508–18524. [Google Scholar] [CrossRef]
  49. Tuck, K.L.; Hayball, P.J. Major phenolic compounds in olive oil: Metabolism and health effects. Food Chem. X 2002, 13, 636–644. [Google Scholar] [CrossRef]
  50. Cardinali, A.; Pati, S.; Minervini, F.; D’antuono, I.; Linsalata, V.; Lattanzio, V. Verbascoside, isoverbascoside, and their derivatives recovered from olive mill wastewater as possible food antioxidants. J. Agric. Food Chem. 2012, 60, 1822–1829. [Google Scholar] [CrossRef]
  51. Castellano, J.M.; Ramos-Romero, S.; Perona, J.S. Oleanolic acid: Extraction, characterization and biological activity. Nutrients 2022, 14, 623. [Google Scholar] [CrossRef]
  52. Alam, M.Z.; Fristedt, R.; Landberg, R.; Kamal-Eldin, A. Soluble and hydrolyzable phenolic compounds in date fruits (Phoenix dactylifera L.) by UPLC-QTOF-MS/MS and UPLC-DAD. J. Food Compos. Anal. 2024, 132, 106354. [Google Scholar] [CrossRef]
  53. el Bouhaddani, S.; Houwing-Duistermaat, J.; Salo, P.; Perola, M.; Jongbloed, G.; Uh, H.-W. Evaluation of O2PLS in Omics data integration. BMC Bioinform. 2016, 17, S11. [Google Scholar] [CrossRef] [PubMed]
  54. Karadimou, C.; Petsa, E.; Ouroumi, N.; Papadakis, E.; Kontoudakis, N.; Theocharis, S.; Mourtzinos, I.; Menkissoglu-Spiroudi, U.; Kalogiouri, N.P.; Koundouras, S. Exploration of the anthocyanin and proanthocyanidin profile of Greek red grape skins belonging to Vradiano, Limnio, and Kotsifali cultivars, analyzed by a novel LC-QTOF-MS/MS method. Phytochem. Anal. 2024, 35, 1781–1793. [Google Scholar] [CrossRef] [PubMed]
  55. Mitsikaris, P.D.; Kostas, S.; Mourtzinos, I.; Menkissoglu-Spiroudi, U.; Papadopoulos, A.; Kalogiouri, N.P. Investigation of Rosa species by an optimized LC-QTOF-MS/MS method using targeted and non-targeted screening strategies combined with multivariate chemometrics. Phytochem. Anal. 2024, 35, 1100–1111. [Google Scholar] [CrossRef]
  56. Kalogiouri, N.P.; Aalizadeh, R.; Thomaidis, N.S. Application of an advanced and wide scope non-target screening workflow with LC-ESI-QTOF-MS and chemometrics for the classification of the Greek olive oil varieties. Food Chem. 2018, 256, 53–61. [Google Scholar] [CrossRef] [PubMed]
  57. Kritikou, E.; Kalogiouri, N.P.; Kolyvira, L.; Thomaidis, N.S. Target and suspect HRMS metabolomics for the determination of functional ingredients in 13 varieties of olive leaves and drupes from Greece. Molecules 2020, 25, 4889. [Google Scholar] [CrossRef]
  58. Gouvinhas, I.; Garcia, J.; Granato, D.; Barros, A. Seed phytochemical profiling of three olive cultivars, antioxidant capacity, enzymatic inhibition, and effects on human neuroblastoma cells (SH-SY5Y). Molecules 2022, 27, 5057. [Google Scholar] [CrossRef]
  59. Bastoni, L.; Bianco, A.; Piccioni, F.; Uccella, N. Biophenolic profile in olives by nuclear magnetic resonance. Food Chem. 2001, 73, 145–151. [Google Scholar] [CrossRef]
  60. Kumar, A.; Singh, N.; Joshi, R. Insights into the growth parameters, mineral composition, protein and UHPLC–QTOF–LC/MS-based non-targeted metabolomic fingerprints of wheatgrass as a function of photoperiod and temperature. Int. J. Food Sci. Technol. 2023, 58, 2423–2436. [Google Scholar]
  61. Luo, K.; Luo, D.; Liu, H. Determination of Metabolites in the Cerebellum of 2,3,7,8-Tetrachlorodibenzo-p-Dioxin Exposed Mice by Fourier Transform Ion Cyclotron Resonance Mass Spectrometry. Anal. Lett. 2014, 48, 594–604. [Google Scholar] [CrossRef]
  62. Rodríguez-Pérez, C.; Zengin, G.; Segura-Carretero, A.; Lobine, D.; Mahomoodally, M.F. Chemical fingerprint and bioactivity evaluation of Globularia orientalis L. and Globularia trichosantha Fisch. & CA Mey. using non-targeted HPLC-ESI-QTOF-MS approach. Phytochem. Anal. 2019, 30, 237–252. [Google Scholar]
  63. Jiang, Y.; Mao, S.; Huang, W.; Lu, B.; Cai, Z.; Zhou, F.; Li, M.; Lou, T.; Zhao, Y. Phenylethanoid glycoside profiles and antioxidant activities of Osmanthus fragrans Lour. flowers by UPLC/PDA/MS and simulated digestion model. J. Agric. Food Chem. 2016, 64, 2459–2466. [Google Scholar]
  64. Li, J.; Chen, L.; Jiang, H.; Li, M.; Wang, L.; Li, J.X.; Wang, Y.Y.; Guo, Q.X. New Type of Tannins Identified from the Seeds of Cornus officinalis Sieb. et Zucc. by HPLC-ESI-MS/MS. Molecules 2023, 28, 2027. [Google Scholar] [CrossRef] [PubMed]
  65. Li, X.X.; Wang, L.; Liu, Y.L.; Zhao, Z.X.; Wang, X.L.; Lei, R.; Li, H.J. Comprehensive identification of Vitex trifolia fruit and its five adulterants by comparison of micromorphological, microscopic characteristics, and chemical profiles. Microsc. Res. Tech. 2020, 83, 1530–1543. [Google Scholar] [CrossRef]
  66. Wang, J.N.; Chen, Y.J.; Hano, Y.; Nomura, T.; Tan, R.X. Antioxidant activity of polyphenols from seeds of Vitis amurensis in vitro. Acta Pharmacol. Sin. 2000, 21, 633–636. [Google Scholar] [PubMed]
  67. Ziani, B.E.C.; Barros, L.; Boumehira, A.Z.; Bachari, K.; Heleno, S.A.; Alves, M.J.; Ferreira, I.C.F.R. Profiling polyphenol composition by HPLC-DAD-ESI/MSn and the antibacterial activity of infusion preparations obtained from four medicinal plants. Food Funct. 2017, 9, 149–159. [Google Scholar] [CrossRef]
  68. Krauss, M.; Singer, H.; Hollender, J. LC–high resolution MS in environmental analysis: From target screening to the identification of unknowns. Anal. Bioanal. Chem. 2010, 397, 943–951. [Google Scholar] [CrossRef]
  69. Harrington, R.A.; Adhikari, V.; Rayner, M.; Scarborough, P. Nutrient composition databases in the age of big data: foodDB, a comprehensive, real-time database infrastructure. BMJ Open 2019, 9, e026652. [Google Scholar] [CrossRef] [PubMed]
  70. Jolliffe, I. Principal component analysis for special types of data. In Principal Component Analysis; Springer: New York, NY, USA, 2002; pp. 338–372. [Google Scholar]
  71. Ruiz-Perez, D.; Guan, H.; Madhivanan, P.; Mathee, K.; Narasimhan, G. So you think you can PLS-DA? BMC Bioinform. 2020, 21, 2. [Google Scholar] [CrossRef]
  72. Gosselin, R.; Rodrigue, D.; Duchesne, C. A Bootstrap-VIP approach for selecting wavelength intervals in spectral imaging applications. Chemom. Intell. Lab. Syst. 2010, 100, 12–21. [Google Scholar] [CrossRef]
  73. Afanador, N.; Tran, T.; Buydens, L. Use of the bootstrap and permutation methods for a more robust variable importance in the projection metric for partial least squares regression. Anal. Chim. Acta 2013, 768, 49–56. [Google Scholar] [CrossRef]
  74. Peña-Herrera, J.; Montemurro, N.; Barceló, D.; Pérez, S. Combining quantitative and qualitative approaches using Sequential Window Acquisition of All Theoretical Fragment-Ion methodology for the detection of pharmaceuticals and related compounds in river fish extracted using a sample miniaturized method. J. Chromatogr. A 2020, 1620, 461009. [Google Scholar] [CrossRef] [PubMed]
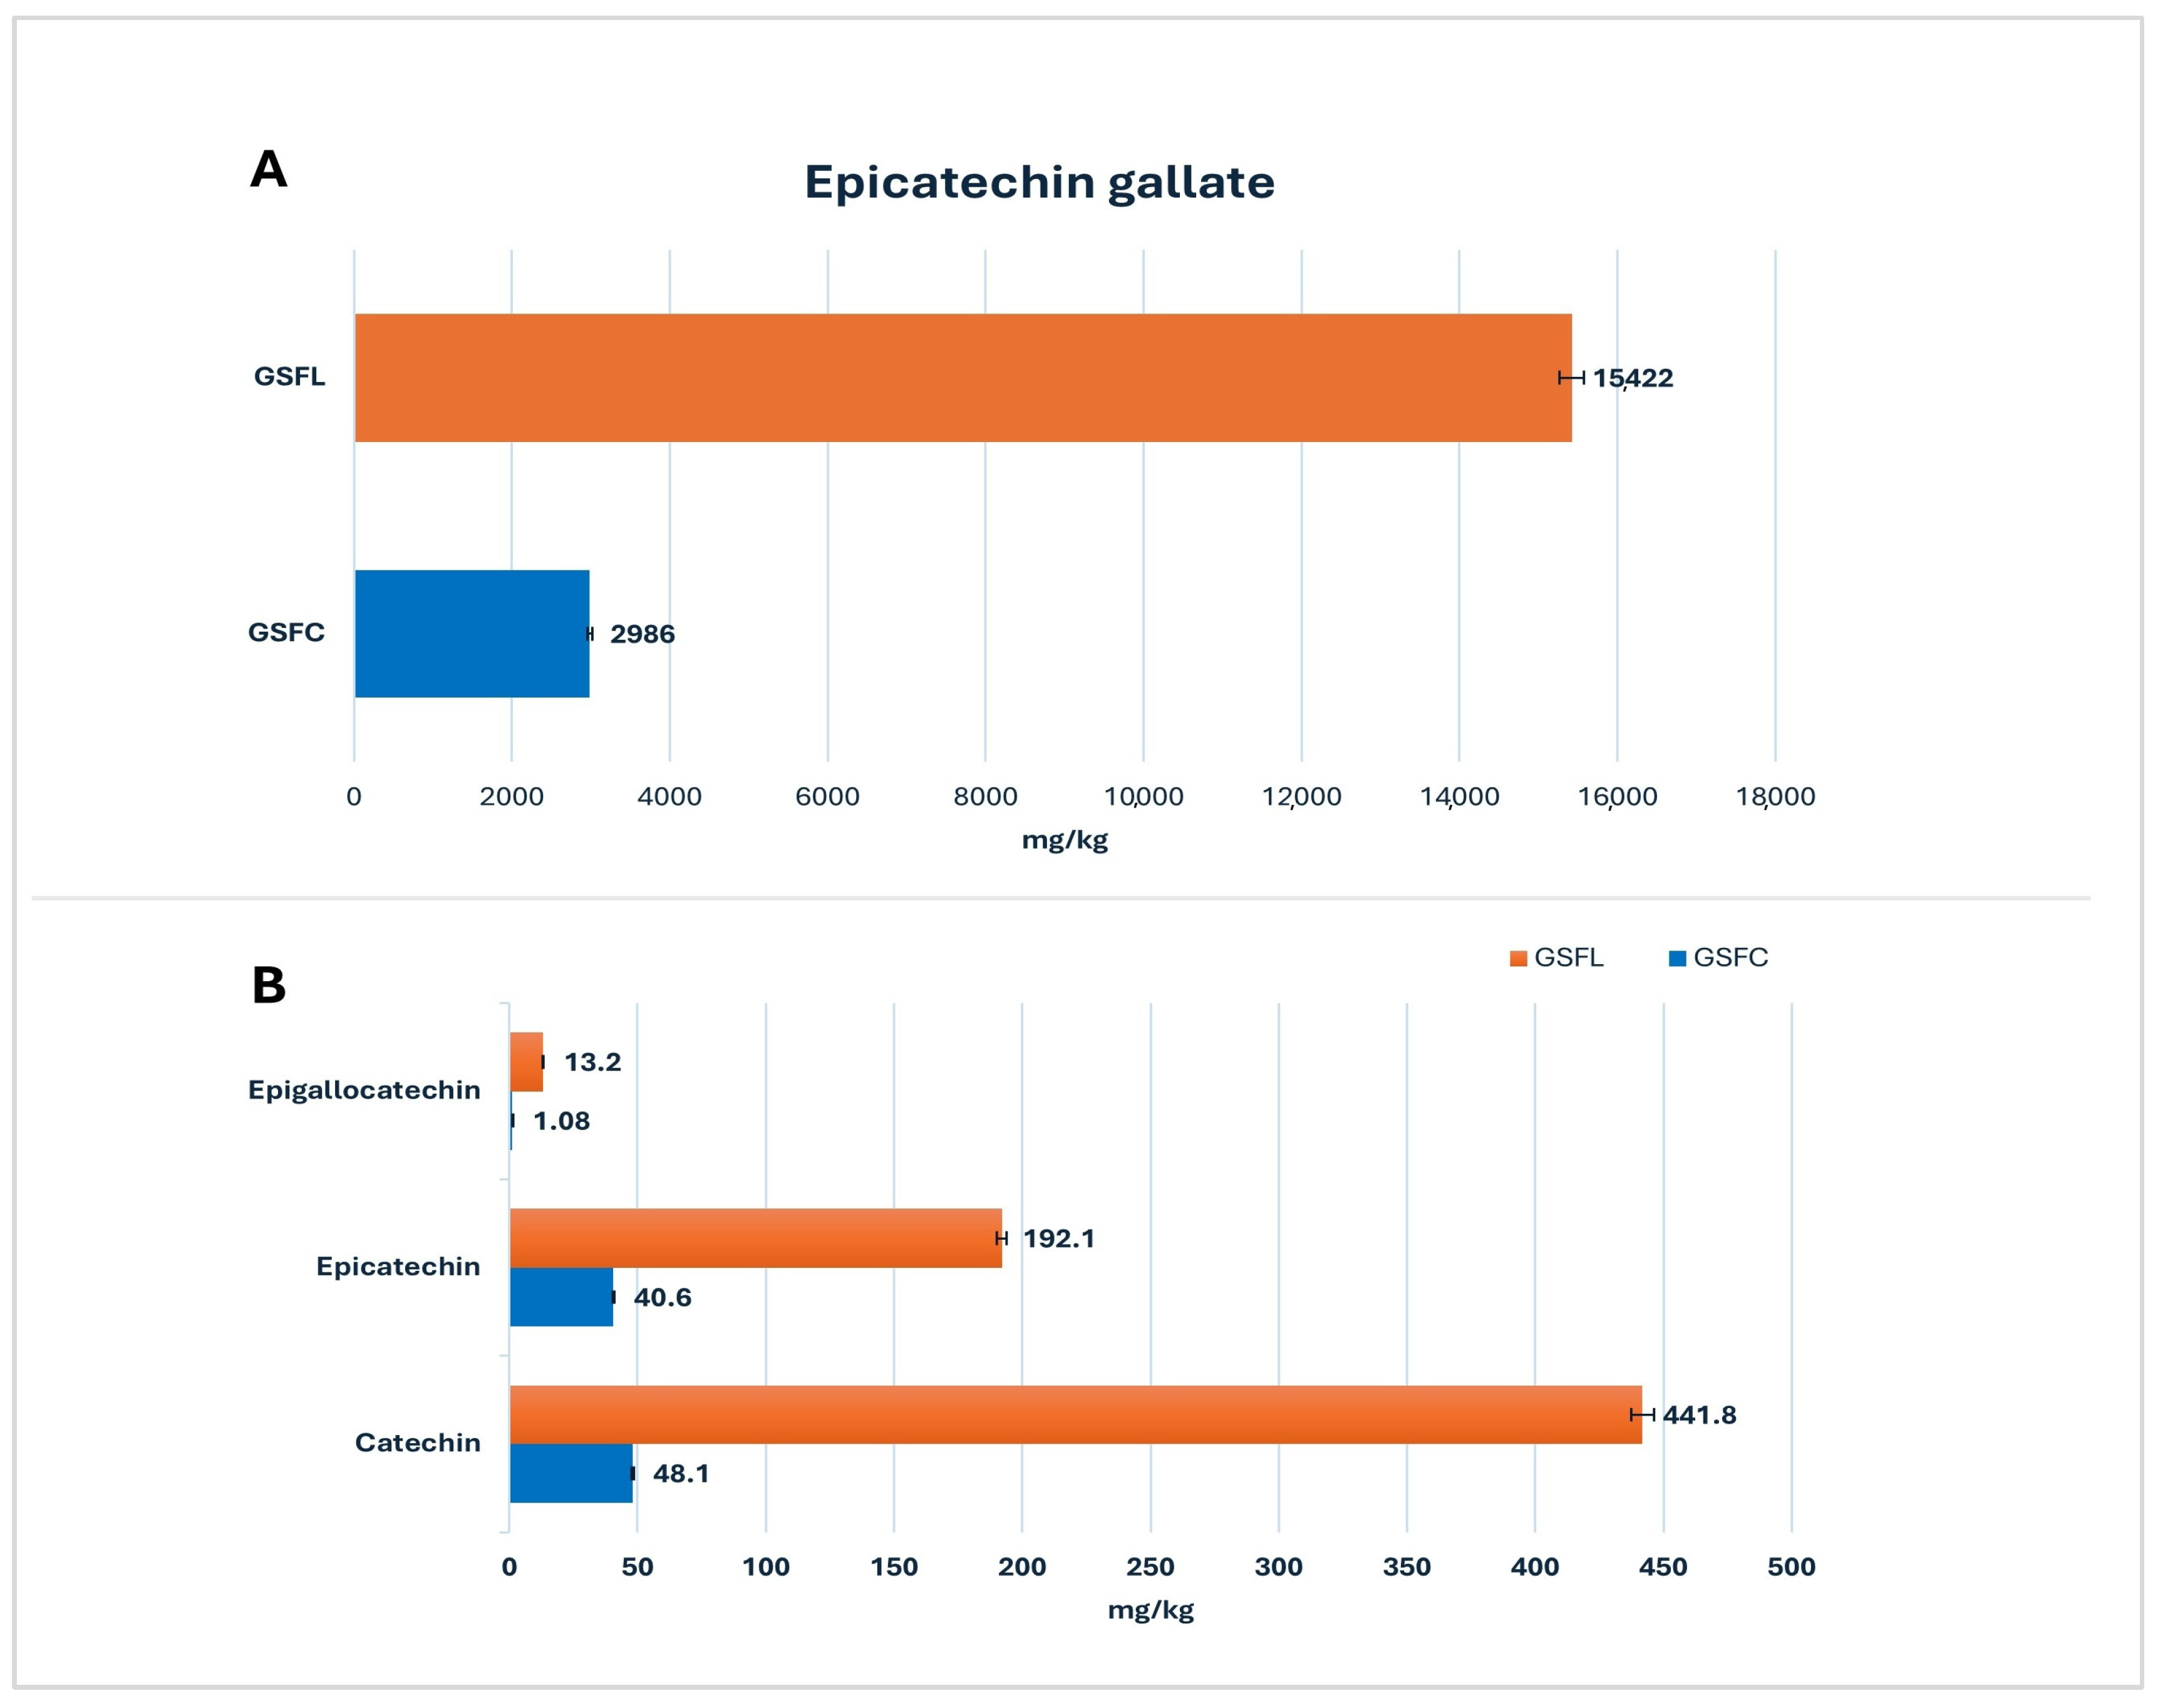
Figure 1. (A) Mean concentration (mg/kg) of epicatechin gallate in commercial grape seed flour (GSFC: n = 10) and grape seed flour from Lemnos (GSFL: n = 10). (B) Mean concentration (mg/kg) of major phenolic constituents in commercial grape seed flour (GSFC: n = 10) and grape seed flour from Lemnos (GSFL: n = 10).
Molecules 30 01527 g001
Figure 2. PCA model applied to GSFC (blue) and GSFL (orange).
Molecules 30 01527 g002
Figure 3. PCA model applied to OSFC (blue) and OSFL (orange).
Molecules 30 01527 g003
Figure 4. PLS-DA model applied to GSFC (blue) and GSFL (orange).
Molecules 30 01527 g004
Figure 5. PLS-DA model applied to OSFC (blue) and OSFL (orange).
Molecules 30 01527 g005
Figure 6. Screening workflow.
Molecules 30 01527 g006
Table 2. Non-target screening results for grape seed flour (GSF) samples, including mass features with a variable importance in projection (VIP) score above 1.0, along with their library matches and plausible molecular formulas, tentative analytes, and Formula Finder scores.
[M − H]/RTVIPPlausible Molecular FormulaTentative CompoundPhytochemical ClassFormula Finder ScoreMassBank ID/Reference
149.0088/0.991.908055C4H6O6Tartaric acidOrganic acids92.8KO001902
195.0504/0.984.165611C6H12O7Gluconic acidOrganic acids88.6KO000864
247.0249/5.131.542148C13H12OS2 87.9
255.2311/13.961.687796C16H32O2 65.6
265.1460/13.511.05701C12H26O4S 79.3
265.1475/14.051.072462 88.4
279.2309/13.796.86827 92.5
281.2465/14.037.233686 91.4
282.2507/14.012.547436 89.4
283.2635/14.341.250575 78.5
289.0702/5.2412.24895 82.6
289.0705/4.5014.487C15H14O6CatechinFlavonoid97.8BS003014
291.0146/5.123.056952C13H8O8Brevifolincarboxylic acidPolyphenol92.5[64]
293.1240/5.221.667305C12H22O8 89.9
293.1791/15.701.215117
295.2263/13.065.327168 88.2
297.2422/13.052.411256C18H34O3 91.4
300.9982/6.848.084582 Ellagic acidPolyphenol92.2NGA02837
301.0345/8.091.688408Quercetin (C15H10O7)QuercetinFlavonoid93.5PR100233
309.1727/14.341.722773
311.2221/11.841.983825
313.2368/12.208.325131C18H36O5Phloionolic acidTriterpenoid88.4
314.2411/12.211.989586C12H29N9O
315.0875/7.061.83894C17H16O6PersicogeninFlavonoid95.6[65]
315.2528/12.651.635675
329.2327/10.381.132457
341.1077/0.984.904493
341.1086/1.801.266851C13H26O6S2 82.2
366.1190/5.821.098081C17H21NO8 78.4
380.9556/6.291.721243C15H10O6S3 73.5
387.1144/0.961.194701
409.2340/14.651.206799C21H34N2O6 78.8
433.0408/6.512.234584C20H10N4O8 75.5
433.2336/14.262.630344
439.0650/6.754.659214C22H16O10 89.2
439.0656/7.425.428307C22H16O10AmurensisinFlavonoid82.3[66]
439.0841/0.991.663483C15H16N6O10 78.5
440.0712/7.561.214139C16H11N9O7 77.9
441.0808/5.738.944765C22H18O8Epicatechin gallateFlavonoid81.3BS003900
442.0865/5.872.155587C16H12N9O7 82.2
453.0676/4.781.773836C20H14N4O9 83.4
455.3510/13.602.632012C30H48O3Oleanolic acidTriterpenoid acid91.2TY000153
461.2655/15.862.204115C25H38N2O6 78.4
463.0515/5.801.35816C21H12N4O9 90.4
476.2760/13.281.116856C25H39N3O6 95.6
477.0664/6.621.626783C21H18O13Quercetin 3-O-glucuronide (Miquelianin)Flavonoid glycoside97.7PR100978
479.0829/6.151.042092C21H20O13Myricetin-3-O-glucosideFlavonoid glycoside92.2[67]
571.2874/15.622.853407C40H36N4 83.5
577.1328/4.715.115305C27H17N10O6 87.4
577.1332/4.145.979778C27H18N10O6 86.5
577.1347/5.871.222666C23H26N6O10S 88.2
578.1376/4.741.749601C24H21N9O9 92.1
578.1378/4.112.151917C24H21N9O9 86.4
595.2864/14.962.240486C41H40O4 98.1
729.1441/4.952.275241C31H42N2O8S5 84.2
865.1964/4.971.576048C47H46O8S4 83.4
Disclaimer/Publisher’s Note: The statements, opinions and data contained in all publications are solely those of the individual author(s) and contributor(s) and not of MDPI and/or the editor(s). MDPI and/or the editor(s) disclaim responsibility for any injury to people or property resulting from any ideas, methods, instructions or products referred to in the content.