Article

Mid-Level Data Fusion Techniques of LC-MS and HS-GC-MS for Distinguishing Green and Ripe Forsythiae Fructus

TCM and Ethnomedicine Innovation & Development International Laboratory, School of Pharmacy, Hunan University of Chinese Medicine, Changsha 410208, China
*
Author to whom correspondence should be addressed.
These authors contributed equally to this study.
Molecules 2025, 30(7), 1404; https://doi.org/10.3390/molecules30071404
Submission received: 8 February 2025 / Revised: 10 March 2025 / Accepted: 18 March 2025 / Published: 21 March 2025
(This article belongs to the Special Issue The Application of LC-MS in Pharmaceutical Analysis)

Abstract

Forsythia suspensa is a crucial plant resource due to its considerable edible and medicinal value. Its fruit, named Forsythiae Fructus (FF), has been widely used in Traditional Chinese Medicine (TCM). According to the fruit maturity stage, FF is categorized into GFF (green Forsythiae Fructus) and RFF (ripe Forsythiae Fructus). In this study, metabolomics based on UPLC-Q/Orbitrap MS and HS-GC-MS, combined with chemometric methods, was employed to differentiate GFF from RFF and identify potential differential metabolites. Additionally, the mid-level data fusion method was employed to integrate data from both techniques, and the performance of the OPLS-DA model (R2Y = 0.986, Q2 = 0.974) surpassed that of the single HS-GC-MS technique (R2Y = 0.968, Q2 = 0.930). Moreover, using the criteria of VIP > 1 and p-value < 0.05, 30 differential compounds were selected via mid-level data fusion, compared to the initial 61 differential compounds identified by single techniques, effectively reducing data noise and eliminating irrelevant variables. This study provides a comprehensive analysis of volatile and non-volatile compounds in FF, offering valuable insights into quality control and clinical differentiation between GFF and RFF. The findings highlight the potential use of multi-technology metabolomics in the quality control of TCM and offer new perspectives for future research on medicinal plants.

Graphical Abstract

1. Introduction

Forsythia suspensa is regarded as an important plant due to its high value as both an edible and medicinal resource. It is widely distributed in northern and central China, particularly in Shaanxi, Shanxi, Henan, Shandong, and Anhui, which serve as its major production regions. The different parts of Forsythia suspensa, such as flowers, leaves, and fruit, possess significant pharmacological effects [1]. Forsythiae Fructus (FF), also known as Lianqiao in Chinese, is derived from the dried fruit. It has been used in Traditional Chinese Medicine (TCM) for centuries due to its potent heat-clearing, detoxifying, and stasis-dissipating properties [2]. Pharmacological research indicates that FF exhibits properties such as anti-inflammatory, antioxidant, antibacterial, anticancer, antiviral, anti-allergic, and neuroprotective activities [3,4]. The medicinal effects of FF are due to its abundant bioactive compounds, including phenylethanoid glycosides, lignans, terpenoids, flavonoids, and volatile oils [5]. According to Chinese Pharmacopoeia (2020 edition), forsythiaside A and phillyrin are considered major quality evaluation indicators of FF [6]. The complex compound composition of FF makes it insufficient to rely solely on high-performance liquid chromatography (HPLC) based on non-volatile components for quality control, as it fails to comprehensively reflect its overall characteristics and quality [7].
Additionally, the concentration of chemical composition in FF is impacted by its degree of maturity and regional geographical differences. In the TCM system, it is classified into Qingqiao (green Forsythiae Fructus, GFF) and Laoqiao (ripe Forsythiae Fructus, RFF) based on maturity [5]. Although both of them are included as FF in the Chinese Pharmacopoeia, the harvest time may influence their qualitative characteristics and relative content of compounds, thereby further affecting their pharmacological activity [7,8,9]. Therefore, a comprehensive characterization of non-volatile components such as phenylethanoid glycosides and lignans, along with the volatile compounds in essential oils, and the exploration of their differential metabolites, is of significant importance for distinguishing the clinical applications of GFF and RFF.
Metabolomics, as an emerging technology, has proven to be of significant value in the effective discovery of potential differential compounds from TCMs and medicinal plants [10,11,12]. The main analytical platforms used in metabolomics include LC-MS, GC-MS, and NMR [13,14,15,16]. The integration of multiple analytical techniques with chemometric methods provided comprehensive compound characterization, reduced background noise, and highlighted key information, improving classification performance more effectively than single techniques [17,18,19]. However, due to the high-dimensional and complex nature of metabolomics data, multi-technology metabolomics encompasses rich and intricate compositional information, which can easily lead to data redundancy. Therefore, appropriate methods are required for data integration and effective information extraction.
In recent years, data fusion has gained widespread attention for its ability to integrate multi-source data, provide more comprehensive characterization, and reduce errors associated with single data sources through cross-validation and information complementarity [20,21,22]. Data fusion was categorized into three types: low-level, mid-level, and high-level fusion [23]. In low-level data fusion, raw data from various sources were combined without feature selection or processing. Its main drawback was the increase in irrelevant variables, which caused information redundancy. By contrast, mid-level data fusion, which combines the most discriminative variables, significantly enhances classification performance and shows greater discriminative ability [24]. Recent studies have utilized data fusion from different chromatographic and spectroscopic techniques for sample differentiation. For example, Rivera-Pérez et al. successfully integrated 1H NMR, UHPLC-HRMS, and GC-HRMS data, improving the classification accuracy of thyme and providing a more comprehensive representation of its chemical profile [14]. Similarly, Gao et al. developed a qualitative discrimination model based on near-infrared (NIR), mid-infrared (MIR), and microscopic Raman spectra, combined with individual spectra and multispectral data fusion strategies, to achieve rapid and effective identification of Hebei yam [25]. These studies demonstrate the potential of multi-technology methods in distinguishing complex samples by integrating information from different data sources and providing a more comprehensive analysis.
So far, the chemical composition analysis of FF mainly focused on single methods, including HPLC, GC-MS, and LC-MS, with the application of multi-technology metabolomics in the classification of GFF and RFF remaining limited. Relying solely on specific compounds for such comparison presents several limitations. First, the chosen compounds might not comprehensively capture the complexity of the sample, as metabolic processes often involve a broad range of compounds, and focusing on a limited number could lead to the omission of essential components. Second, the results are highly dependent on the instrument and method employed, as different analytical instruments, such as GC-MS and LC-MS, possess inherent disparities in sensitivity, resolution, and quantification accuracy, which can impact the detection and measurement of compounds. Therefore, the integration of multiple analytical techniques is crucial to reduce bias and enhance the reliability of results.
This study aims to systematically distinguish GFF and RFF using metabolomics approaches and to identify potential differential metabolites. UPLC-Q/Orbitrap MS and HS-GC-MS were employed to comprehensively analyze the non-volatile and volatile components of FF, combined with chemometric methods to enhance classification accuracy. Furthermore, a mid-level data fusion strategy was implemented to integrate multi-platform data, evaluating its effectiveness in differentiating GFF from RFF and improving data interpretation. Through the identification of differential compounds, this study provides a scientific basis for the quality control and clinical application of FF and further demonstrates the applicability of multi-platform metabolomics in Traditional Chinese Medicine (TCM) research.

2. Results and Discussion

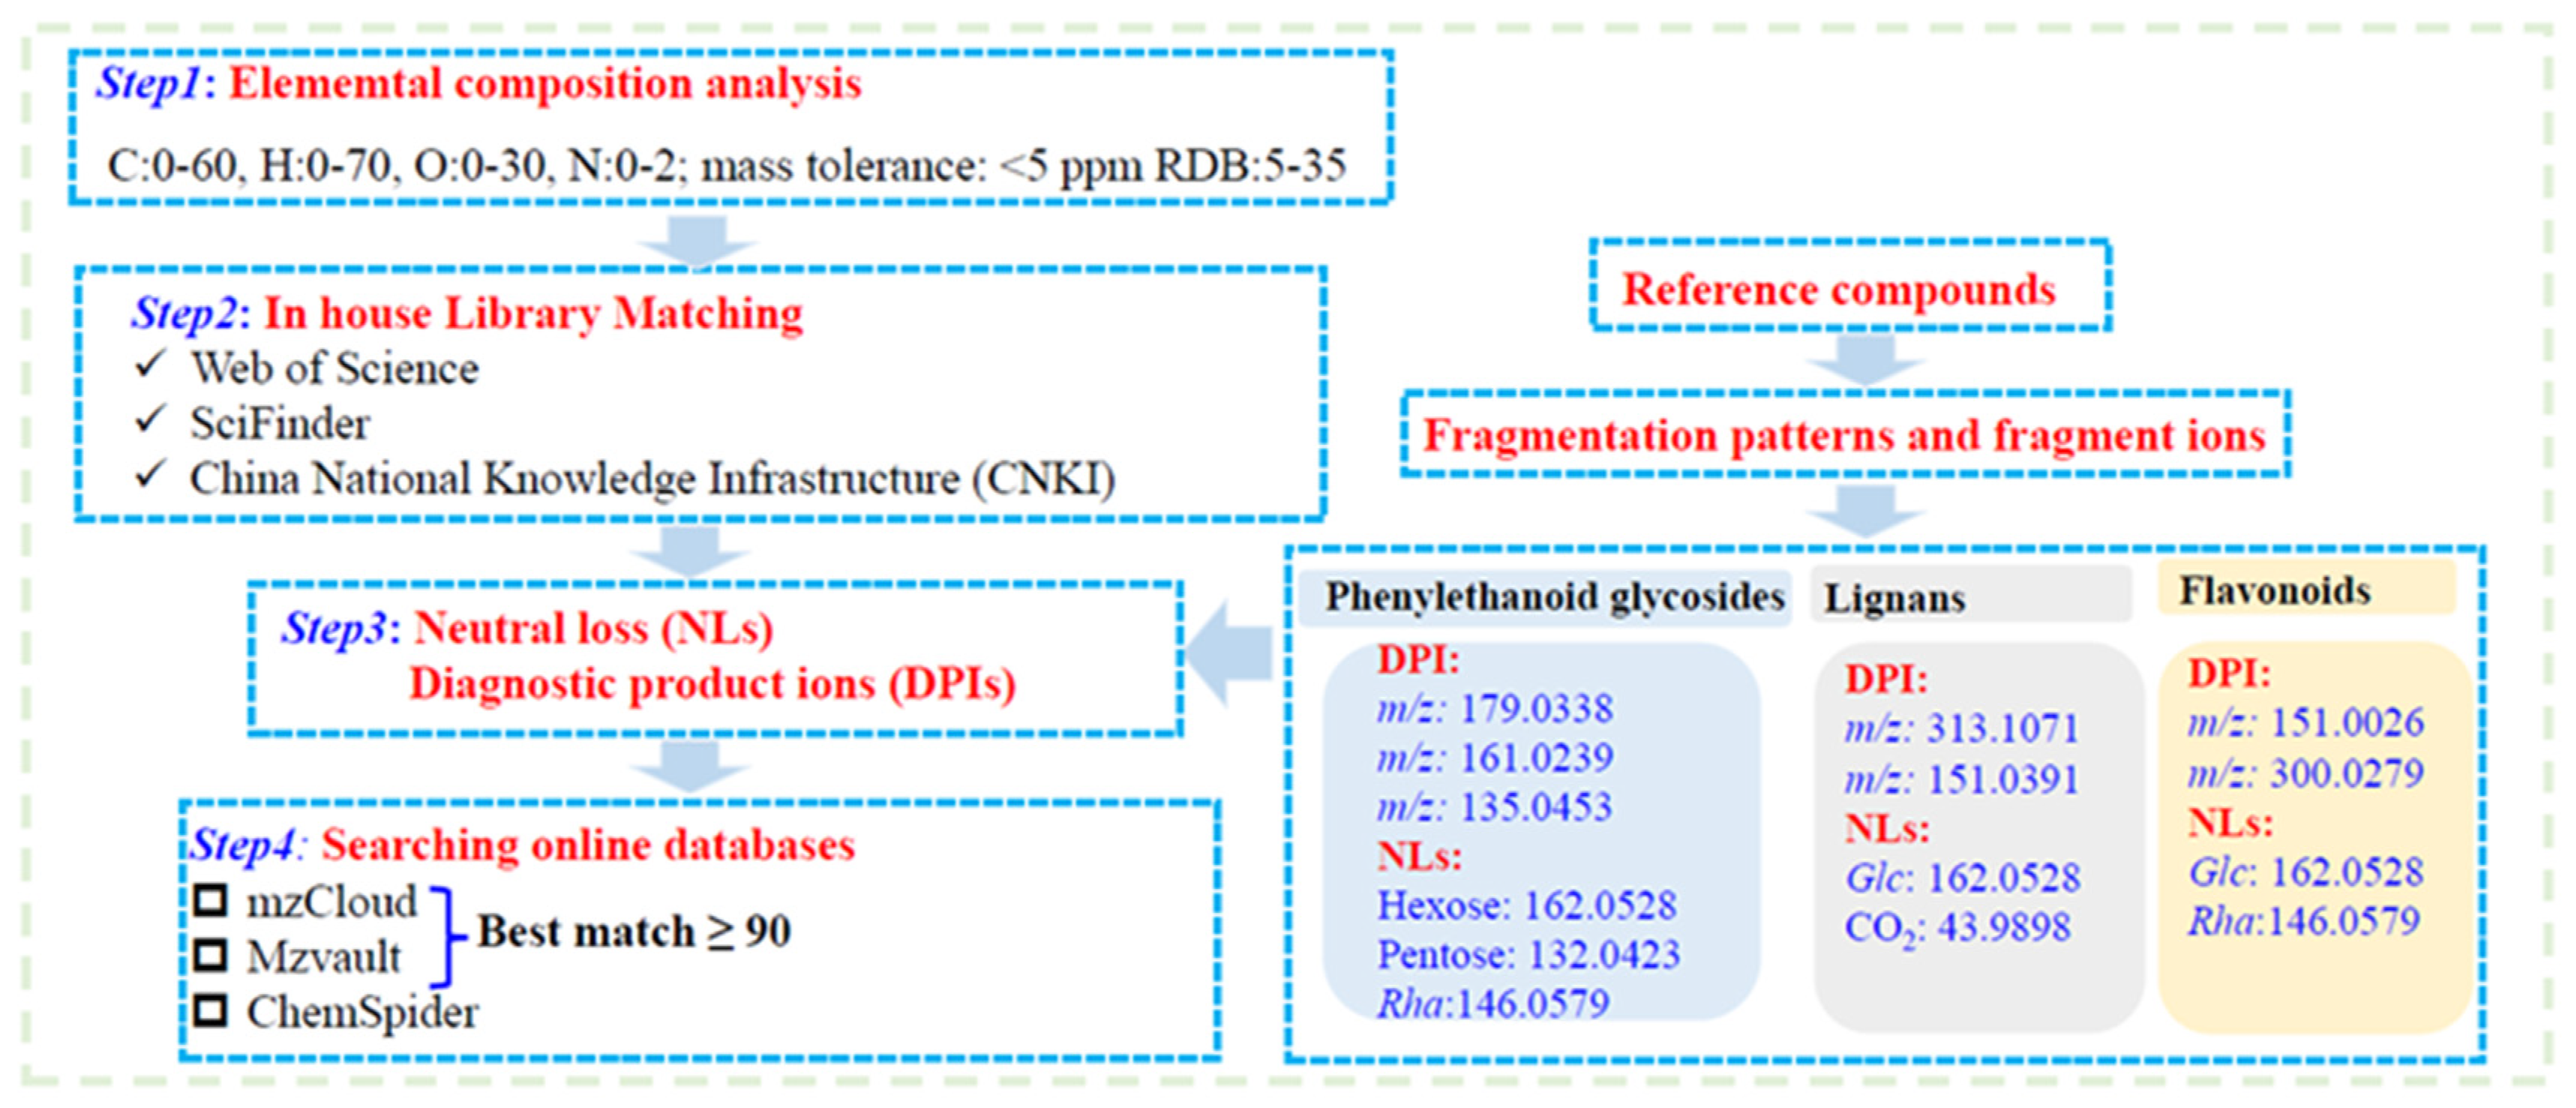
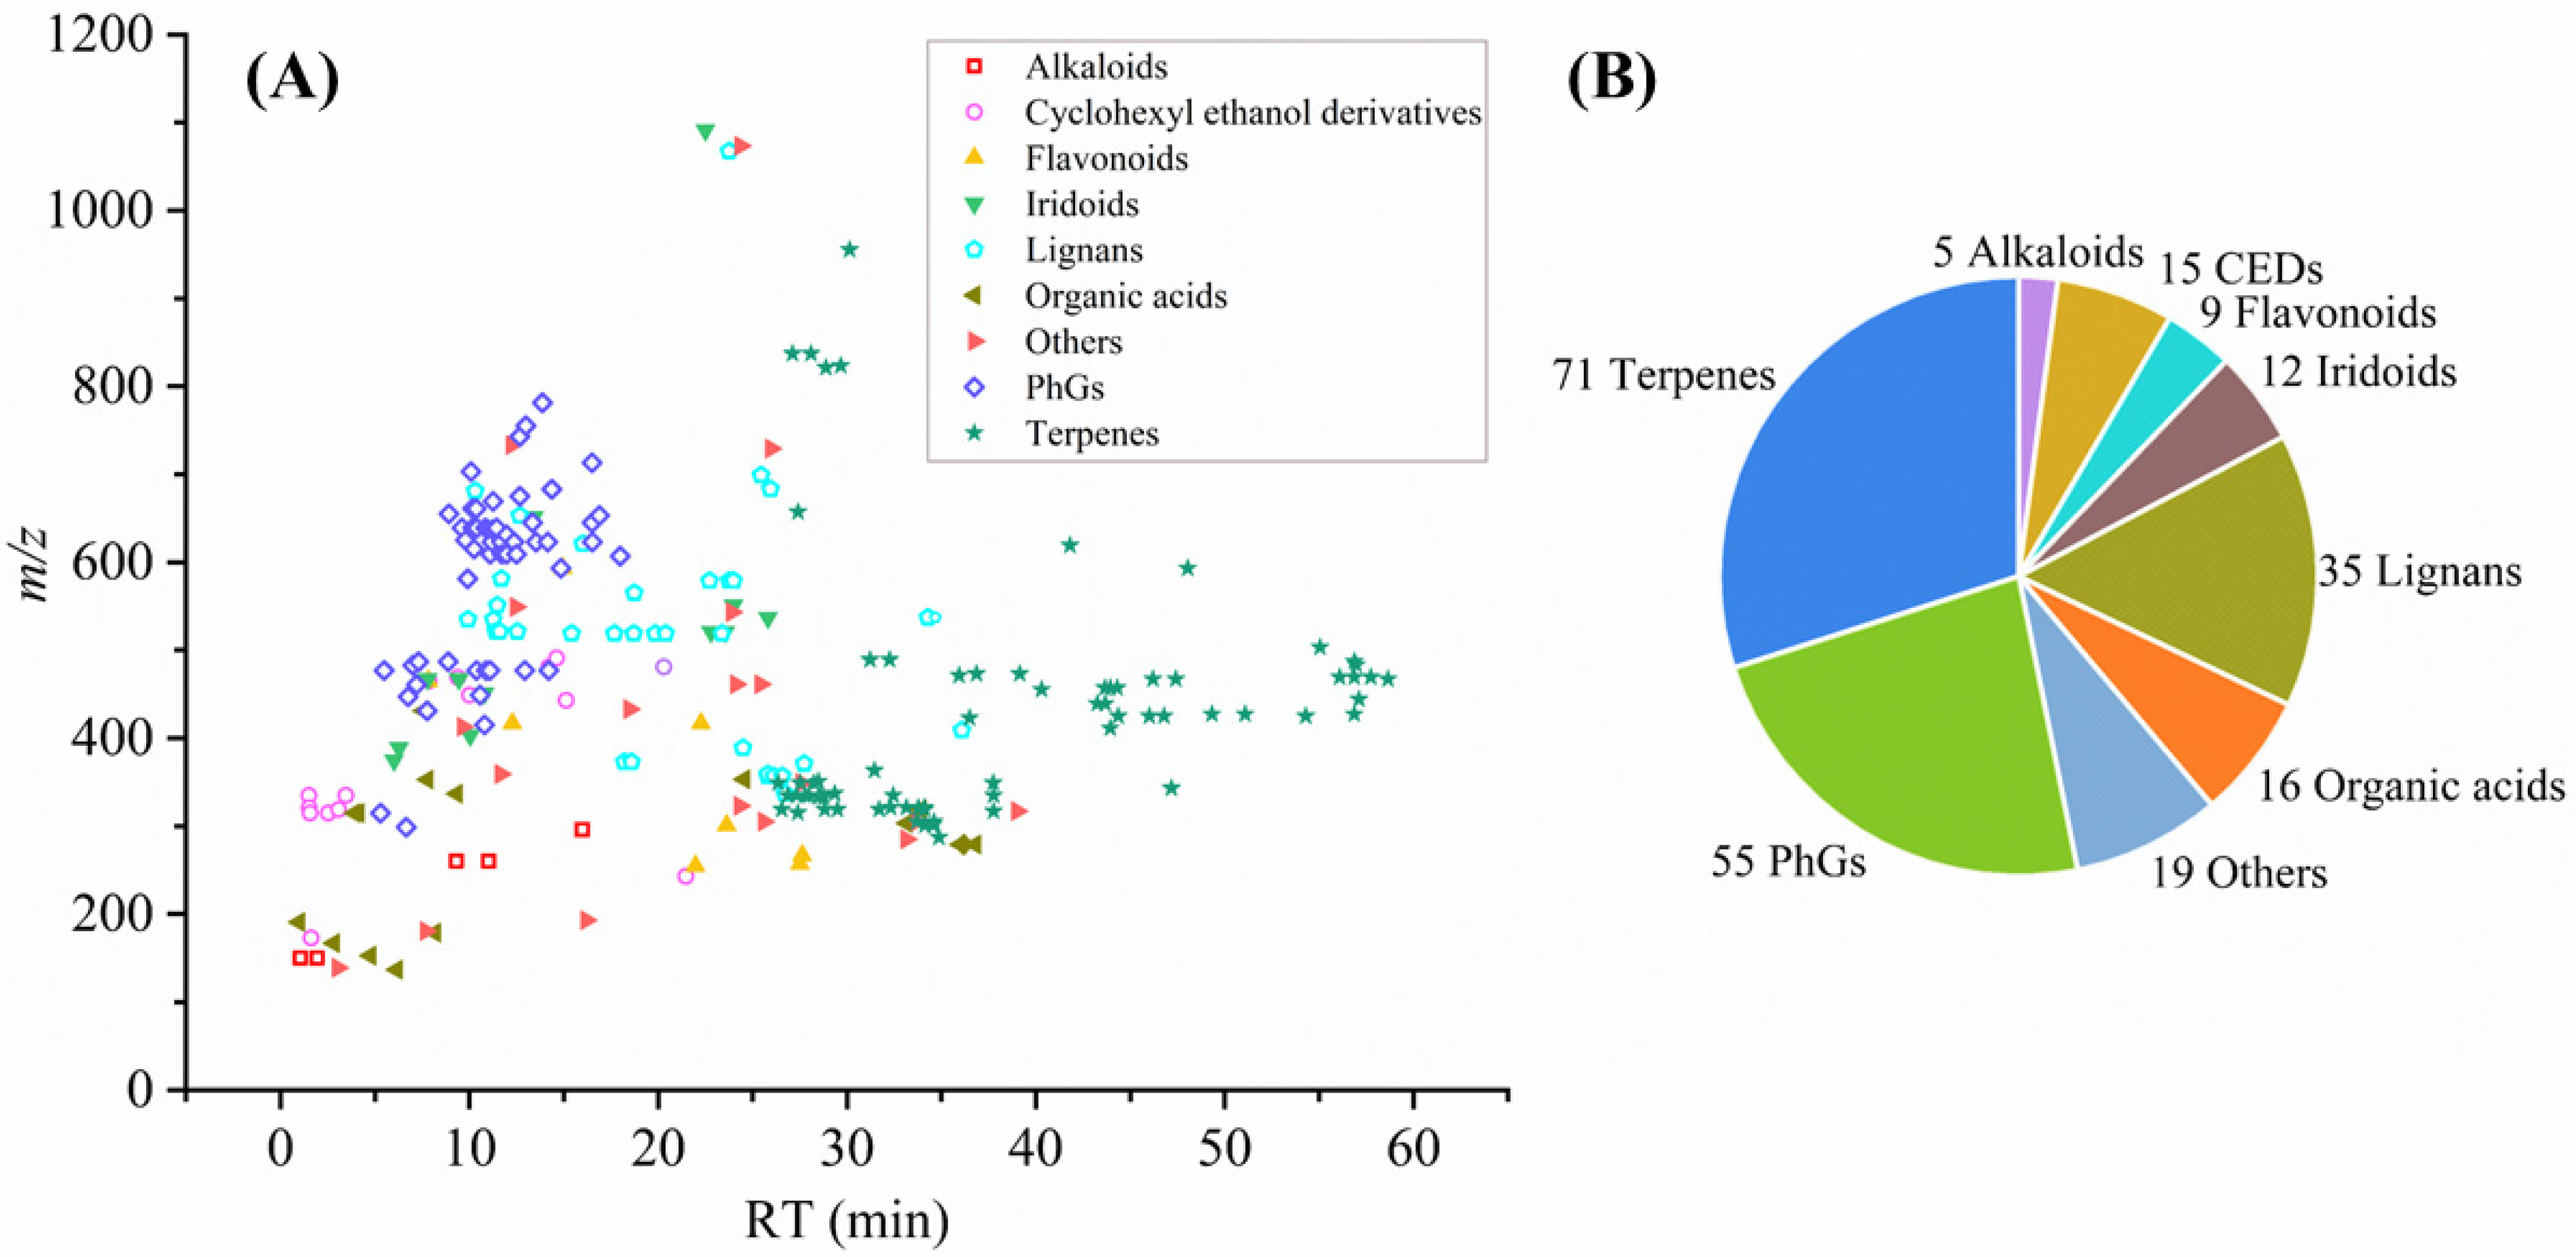
2.1. Characterization of Non-Volatile Metabolites in GFF and RFF

The total ion chromatograms (TIC) for the QC sample, shown in Figure S1, were obtained in both ion modes. The compound identification process was based on high-resolution mass spectrometry (HRMS), which allowed the precise determination of molecular formulas by measuring the exact mass-to-charge ratio (m/z) of molecular ions. In addition to molecular formula, retention time, and fragmentation patterns, isotopic distribution was also a critical parameter for confirming the structural characteristics of the identified compounds. According to the compound identification strategy (Figure 1), 237 compounds were tentatively identified from the QC samples. Among these, 21 compounds were unambiguously identified by matching retention times and mass spectra with reference compounds. Some of them were excluded due to unavailable MS/MS data. The detailed information of the identified compounds by LC-MS analysis is presented in Table S1. Figure 2 illustrates the distribution and chemical structure types of these compounds identified by LC-MS. Different types of compounds may have similar m/z or retention times. For example, phenylethanoid glycosides, which have high polarity, are mainly concentrated within a retention time of 0–15 min, whereas terpenoids, with lower polarity, are more widely distributed. The pie chart illustrates the proportion of different compound categories, with terpenoids being the most abundant, followed by phenylethanoid glycosides and lignans.

2.1.1. Identification of Phenylethanoid Glycosides

Phenylethanoid glycosides (PhGs) are the active and characteristic compounds in FF, with forsythoside A and forsythoside E being the main representatives [26]. The basic structure of PhGs consists of phenylethyl alcohol and glycosyl moieties. The typical sugar groups include glucose, rhamnose, xylose, and arabinose [27]. These compounds exhibit significant anti-inflammatory, antibacterial, antiviral, and antioxidant properties in both in vitro and in vivo studies [5]. In this study, 56 phenylethanoid glycosides were characterized. Among them, 9 phenylethanoid glycosides (21, 24, 75, 82, 90, 94, 96, 98, and 110) were confirmed by comparing retention times, [M−H] ion masses, and MS/MS spectra with reference compounds. In negative mode, these standards were prone to losing sugar moieties, such as rhamnose (146 Da, C6H10O4) and glucose (162 Da, C6H10O5), as well as caffeoyl units (162 Da, C9H6O3), ultimately generating phenylethanoid-related ions at m/z 153.0557 [C8H10O3−H] or 137.0608 [C8H10O2−H] (Figure S2A). Fragment ions at m/z 461.1627 [M−H−Glc], 443.1640 [M−H−Glc−H2O], and 315.1085 [M−H−C9H6O3−C6H10O4] were observed in the MS/MS spectrum of forsythoside A (Figure 3A), attributed to the loss of glucose, H2O, and caffeoyl units.
The “Neutral Loss” mode was introduced to quickly screen compounds with common neutral loss groups at m/z 162, 146, 60, or 44 Da, associated with glucose, rhamnose, acetic acid, and CO2, respectively. For example, 21 compounds were successfully screened with a neutral loss of a caffeoyl group (162 Da, C9H6O3). Among them, six compounds (75, 90, 94, 96, 98, and 110) were characterized as forsythoside I, forsythoside B, forsythoside A, acteoside, calceolarioside B, and isoacteoside, respectively, based on comparisons with reference compounds. Notably, peaks 47, 49, 50, 53, 78, 91, and 109 were identified as potential new compounds since they did not match any entries in the in-house database and online resources (ChemSpider and SciFinder).
Additionally, fragment ions associated with caffeic acid at m/z 179.0348 [C9H8O4−H], 161.0245 [C9H8O4−H−H2O], and 135.0422 [C9H8O4−H−CO2] were detected and recognized as Diagnostic Product Ions (DPIs) for compound screening and identification. Moreover, the isomers (75, 82, 93, 94, 96, and 110) were difficult to identify due to the identical precursor ion at m/z 623.1981 [M−H] (calculated for C29H36O15) and similar fragmentation characteristics (Figure S2A). Clog p values, which are calculated based on factors such as molecular weight, hydrophobicity, and functional groups, indicate the polarity of the compounds. Higher Clog p values indicate lower polarity, resulting in longer retention times in reversed-phase chromatography [28]. In this study, Chemdraw Ultra 14.0 was used to calculate the Clog p values of the compounds. Isoacteoside had a higher Clog p value (−0.057) than acteoside (−0.890), suggesting its later elution (RT = 16.51 min) compared to acteoside (RT = 14.15 min). Accordingly, the isomers were distinguished.

2.1.2. Identification of Lignans

Lignans in FF can be classified into two types based on their structural skeletons, including furofuran and 2,3-dibenzylbutyrolactone [29]. To facilitate the structural identification and classification of lignan compounds, this study summarized the fragmentation pattern of the two types of lignan using reference standards of (+)-pinoresinol-4′-O-β-D-glucopyranoside and arctiin as examples. (+)-Pinoresinol-4′-O-β-D-glucopyranoside presented [M−H] at m/z 519.1886 with the molecular formula C26H32O11 (Figure 3B). Its main fragment ions at m/z 357.1337 [M−H−C6H10O5], 342.1098 [M−H−C6H10O5−CH3], and 311.1312 [M−H−C6H10O5−CH3−CH2O] resulted from the successive loss of glucose (162Da, C6H10O5), CH3, and CH2O, respectively. Moreover, fragment ions at m/z 151.0402 [C8H8O3−H] and 136.0167 [C8H8O3−H−CH3] were also detected. Compounds 105, 113, 118, 120, 122, and 129 exhibited the same deprotonated ion [M−H] at m/z 535.1794, aligning with the formula C26H32O11. Compound 105 was confirmed as (+)-pinoresinol-4′-O-β-D-glucopyranoside by matching it with reference standards. Given the same characteristic fragment ions at 357, 342, 151, and 136 in their MS/MS spectra, these compounds may be classified as furofuran-type lignans and characterized as isomers of (+)-pinoresinol-4′-O-β-D-glucopyranoside. In addition, Compounds 126 and 163 were recognized as phillyrin and phillygenin in reference to the corresponding standards. Arctiin was selected as a representative compound to illustrate the fragmentation patterns of 2,3-dibenzylbutyrolactone type lignans (Figure 3C). The [M−H] ion at m/z 579.2081 underwent fragmentation in negative ion mode, yielding product ions at m/z 371.1529 [M−H−C6H10O5] and 356.1233 [M−H−C6H10O5−CH3] through the loss of a glucose and a methyl group.

2.1.3. Identification of Cyclohexyl Ethanol Derivatives

Cyclohexane ethanol derivatives (CEDs), a major chemical structure type in FF with a glucose skeleton, are linked to various C6-C2 derivatives at C-1 or C-6 through glycosidic or ester bonds. These compounds exhibit unstable chemical properties, which hinder their isolation and purification [30]. By comparing MS/MS fragment ions with the in-house database, 19 cyclohexane ethanol derivatives were characterized in negative ion mode. The typical cyclohexanol derivative, forsythenside B, in FF produced ions at m/z 315.1085 [M−H−C8H8O4], 153.0557 [C8H10O3−H], 135.0451 [C8H10O3−H−H2O], 167.0350 [C8H8O4−H], 149.0224 [C8H8O4−H−H2O], and 121.0295 [C8H8O4−H−H2O−CO], resulting from the loss of sugar moieties, H2O, and CO (Figure S2B). In comparison with the standards, compounds 8 and 32 were confirmed as cornoside and forsythenside B. Additionally, compounds 4, 11, 38, 45, 97, 100, 103, and 120 were identified, as shown in Table S3, by searching the molecular formulas of reported compounds in the literature using Compound Discoverer 3.3 (CD) software and matching their fragmentation behaviors.

2.1.4. Identification of Terpenoid

Due to the higher number of fragment ions and stronger responses observed in the positive ion mode for terpenoid compounds (e.g., ursolic acid), their analysis was carried out in this mode. In this study, 71 terpenoids in FF were identified or tentatively characterized. Ursolic acid exhibited a precursor ion at m/z 457.3576 [M+H]+, along with product ions at m/z 439.3571 [M+H−H2O]+; and 393.3414 [M+H−2H2O−CO]+, arising from the sequential loss of water, CO2, and CO, respectively (Figure S3A). The ions at m/z 205.1951 C15H25+ and 189.1638 C14H21+ were also formed through subsequent fragmentation or rearrangement reactions. Through comparison with the standards, compounds 214, 217, and 218, which have the precursor ion [M+H]+ at m/z 457.3676, were identified as betulinic acid, oleanolic acid, and ursolic acid. Moreover, compound 205 was unambiguously determined to be corosolic acid. The abundance of product ions and structural complexity of terpenoids posed challenges in the accurate assignment of ions and structure identification. CD software was used for molecular network analysis, and 30 triterpenoid compounds were identified in ESI+ mode (Figure S3B). Each node represents a compound, and the pie chart for each node shows the proportion of the precursor ion peak area.

2.1.5. Identification of Other Compounds

Other components in FF, such as flavonoids, organic acids, and alkaloids, exhibit significant pharmacological effects such as anti-inflammatory, antimicrobial, antioxidant, and anticancer activities [31,32]. Considering the ionization behavior and chemical nature of flavonoids and organic acids, negative ion mode was utilized to improve both the accuracy and sensitivity of the identification process.
Based on the in-house database, nine flavonoids were tentatively identified. Compound 79 was confirmed as rutin. It showed a [M−H] ion at m/z 609.1457 (C27H30O16), with fragment ions at m/z 301.0372 [M−H−C6H10O5−C6H10O4] and 271.0275 [M−H−C6H10O5−C6H10O4−CH2O], which result from the loss of glucose, rhamnose, and CH2O (Figure 3D). An ion related to Retro-Diels-Alder (RDA) cleavage, with m/z 151.0036 [1,3A], was also detected. Based on the fragmentation pattern, compounds 102 and 130 were tentatively assigned as kaempferol 3-O-rutinoside and quercetin.
Additionally, hydroxytyrosol (15) and caffeic acid (33) are typical representatives of organic acids involved in the biosynthesis of phenylethanol glycosides in FF [2]. These organic acids are crucial intermediates in the metabolic pathway, contributing to the formation of phenylethanol glycosides, which possess various bioactivities.

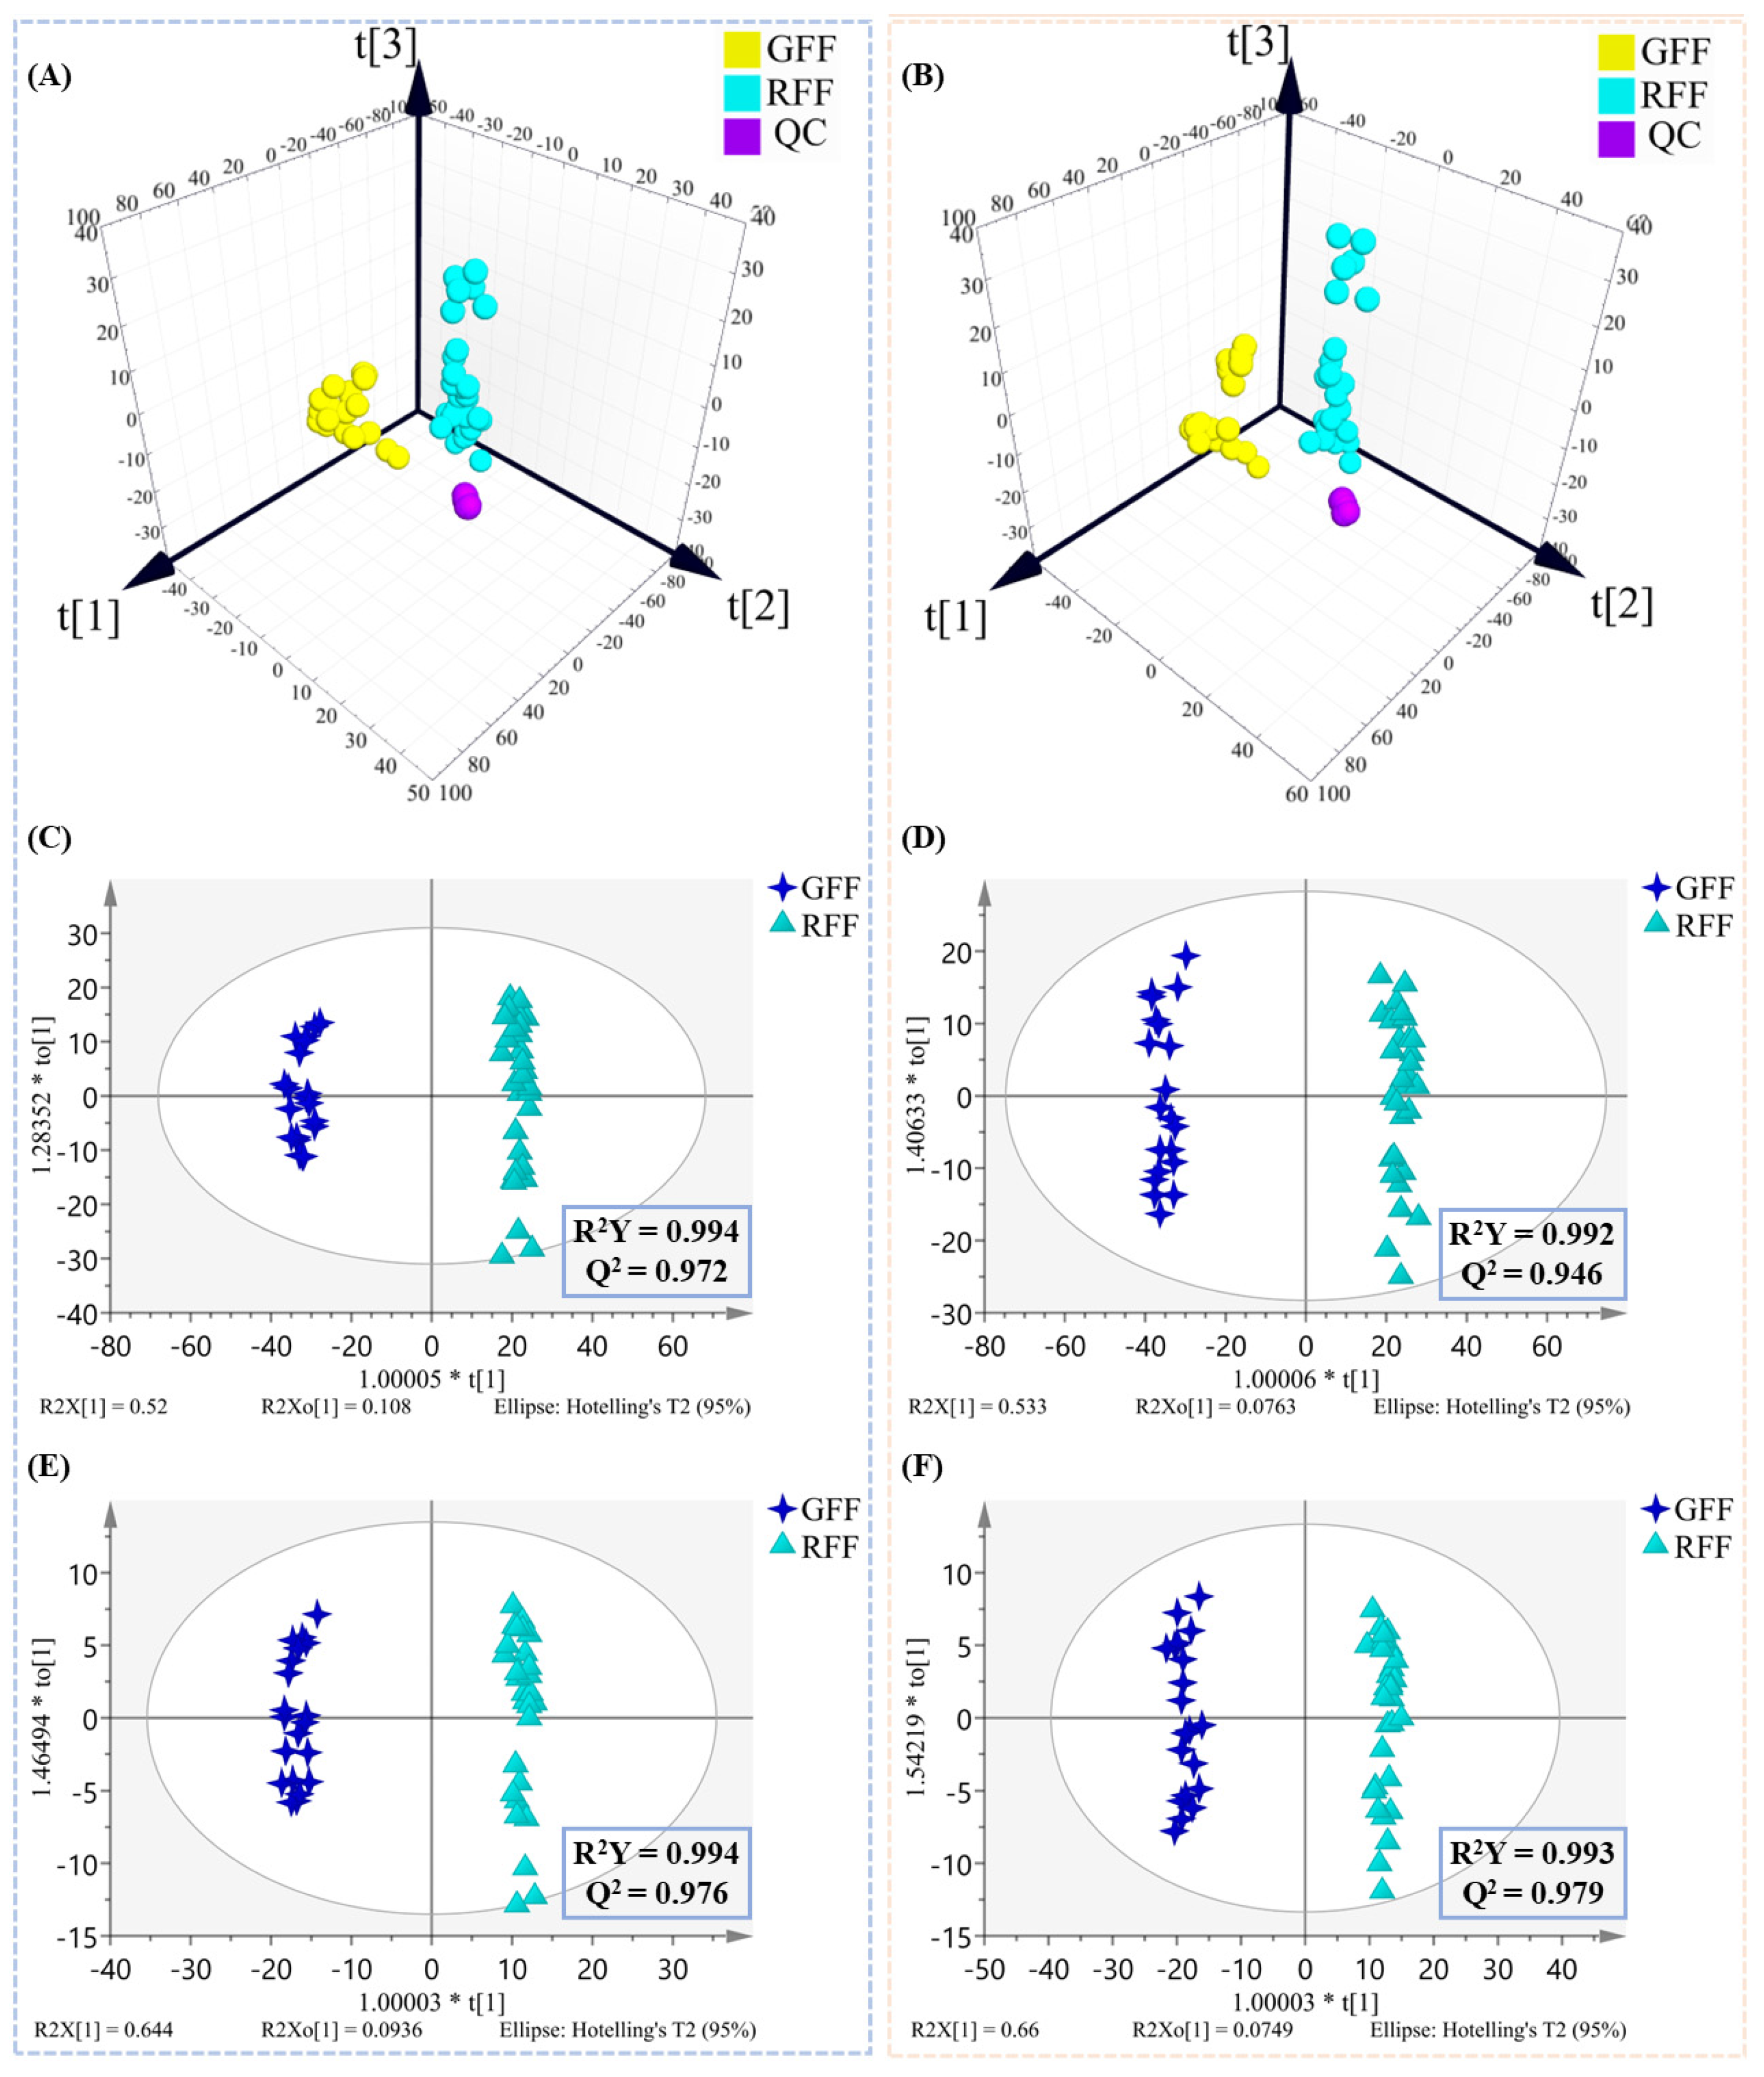
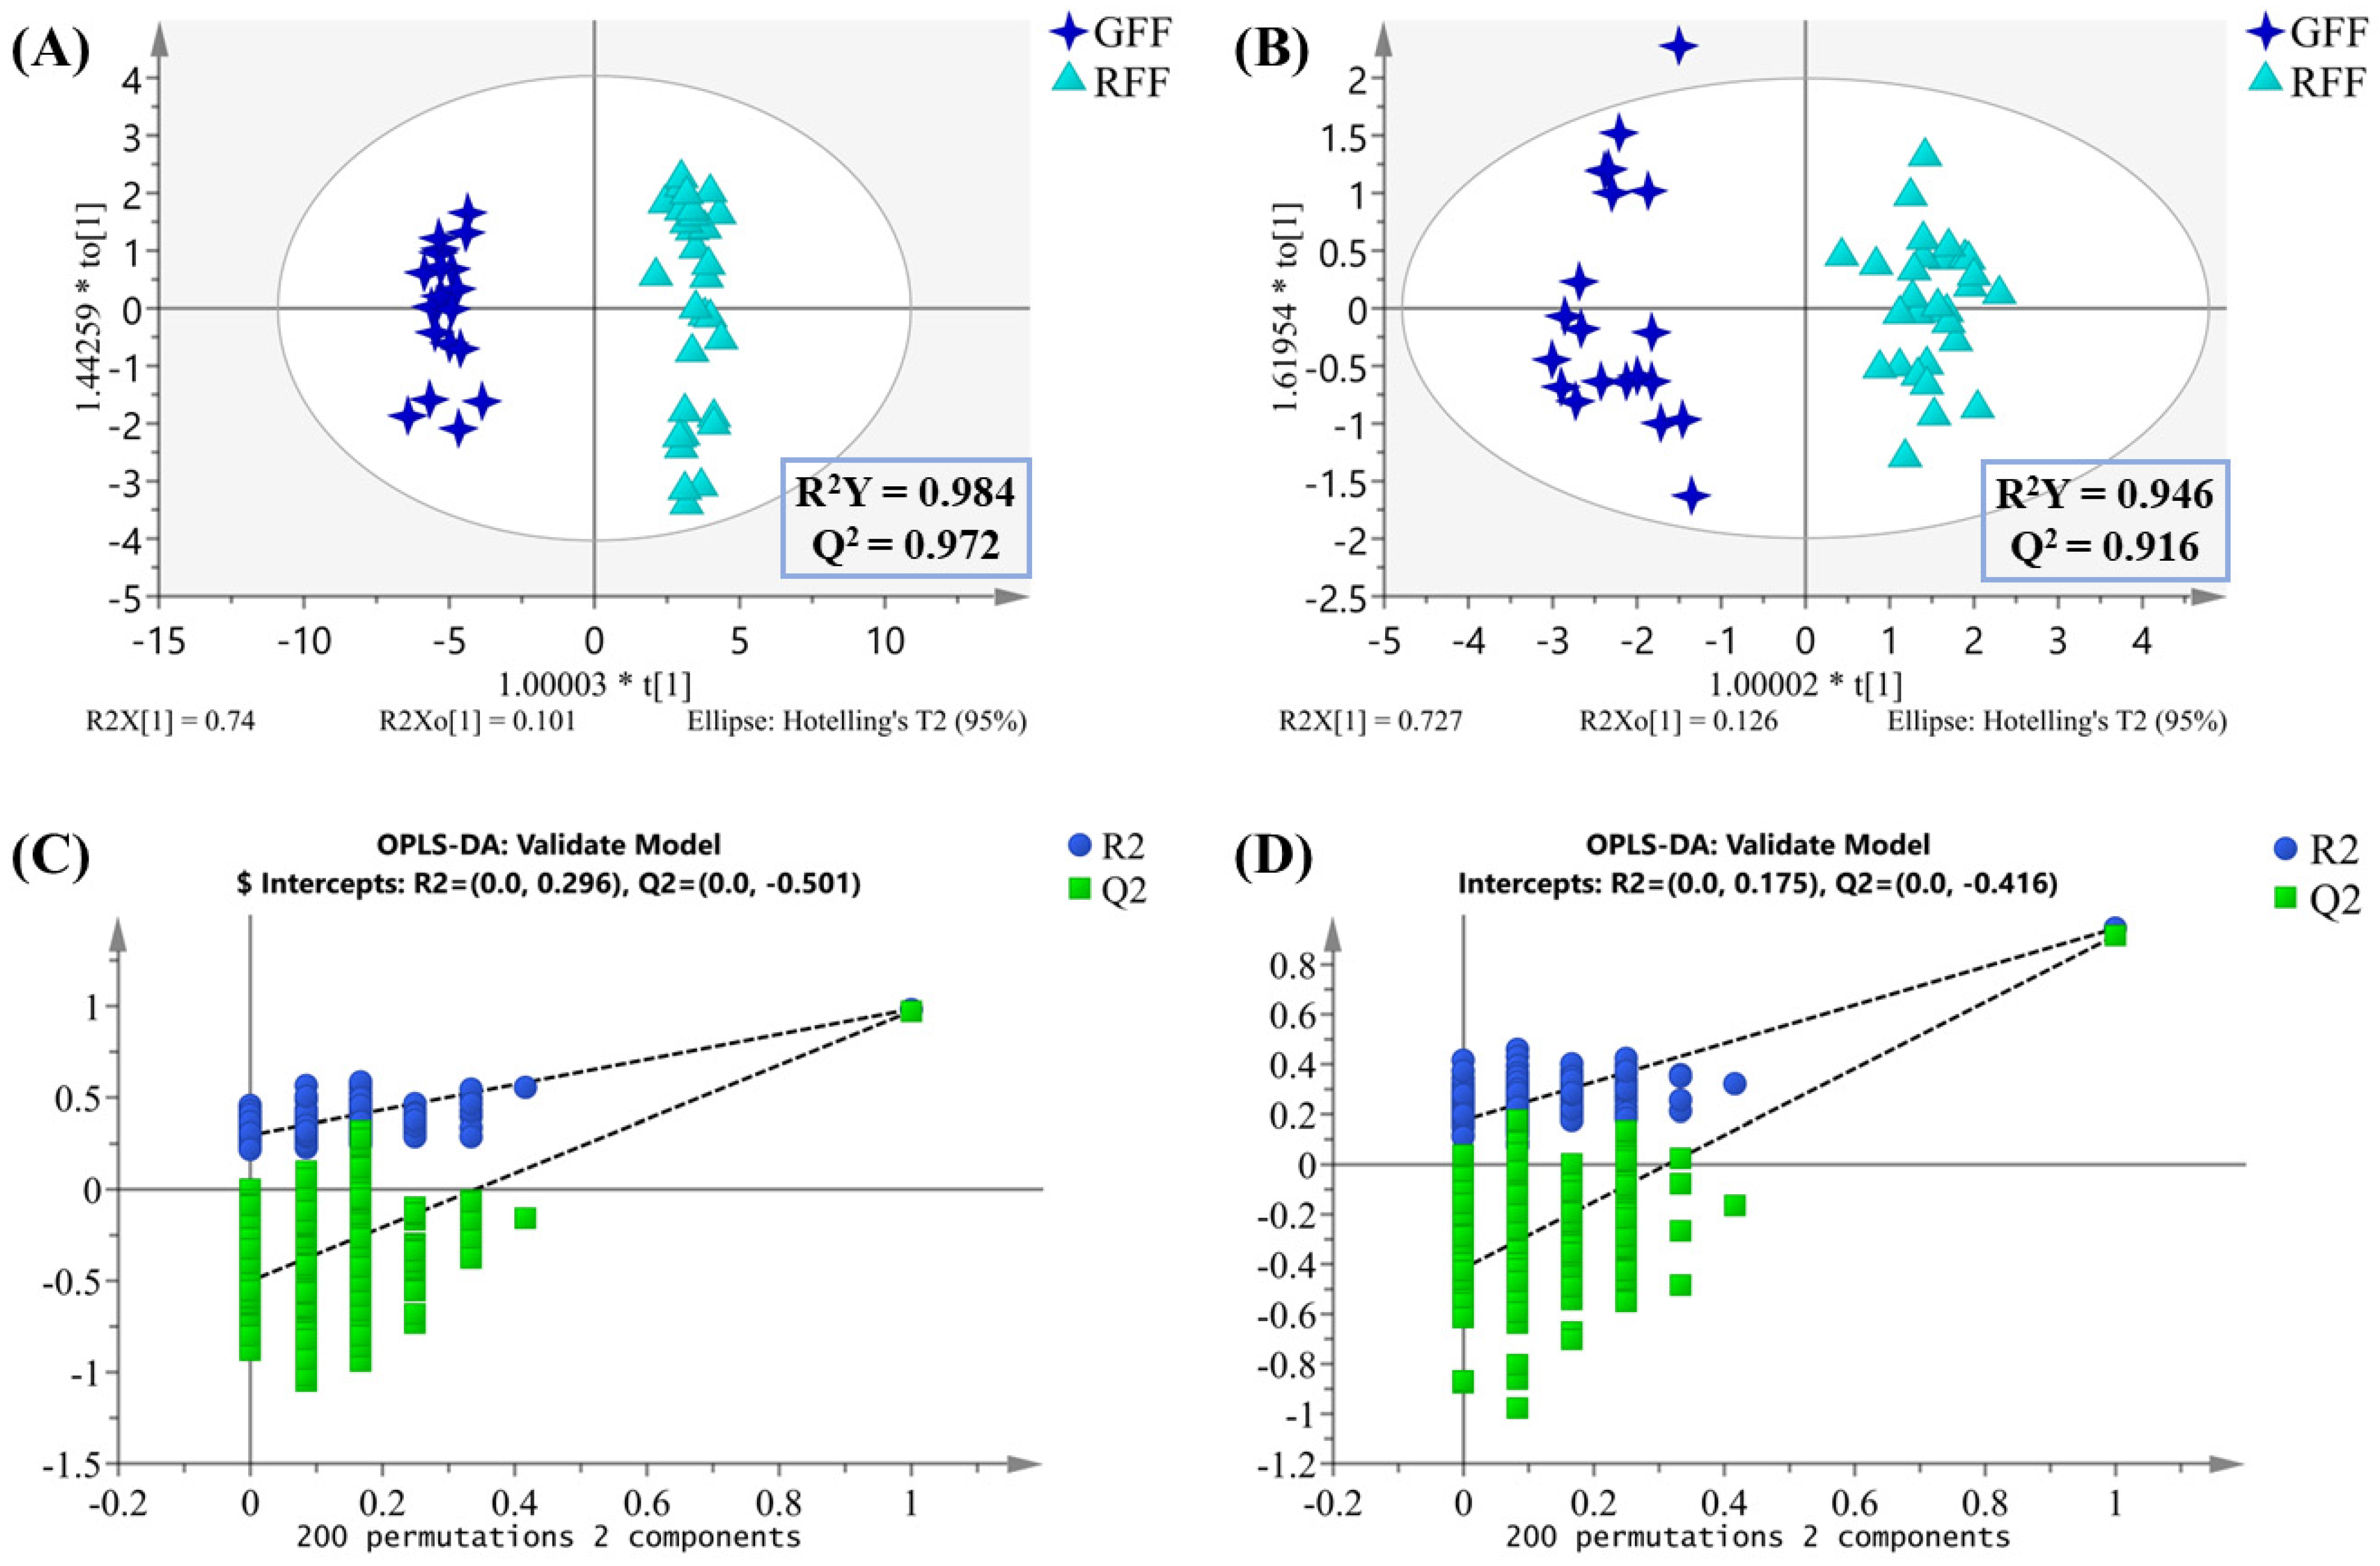
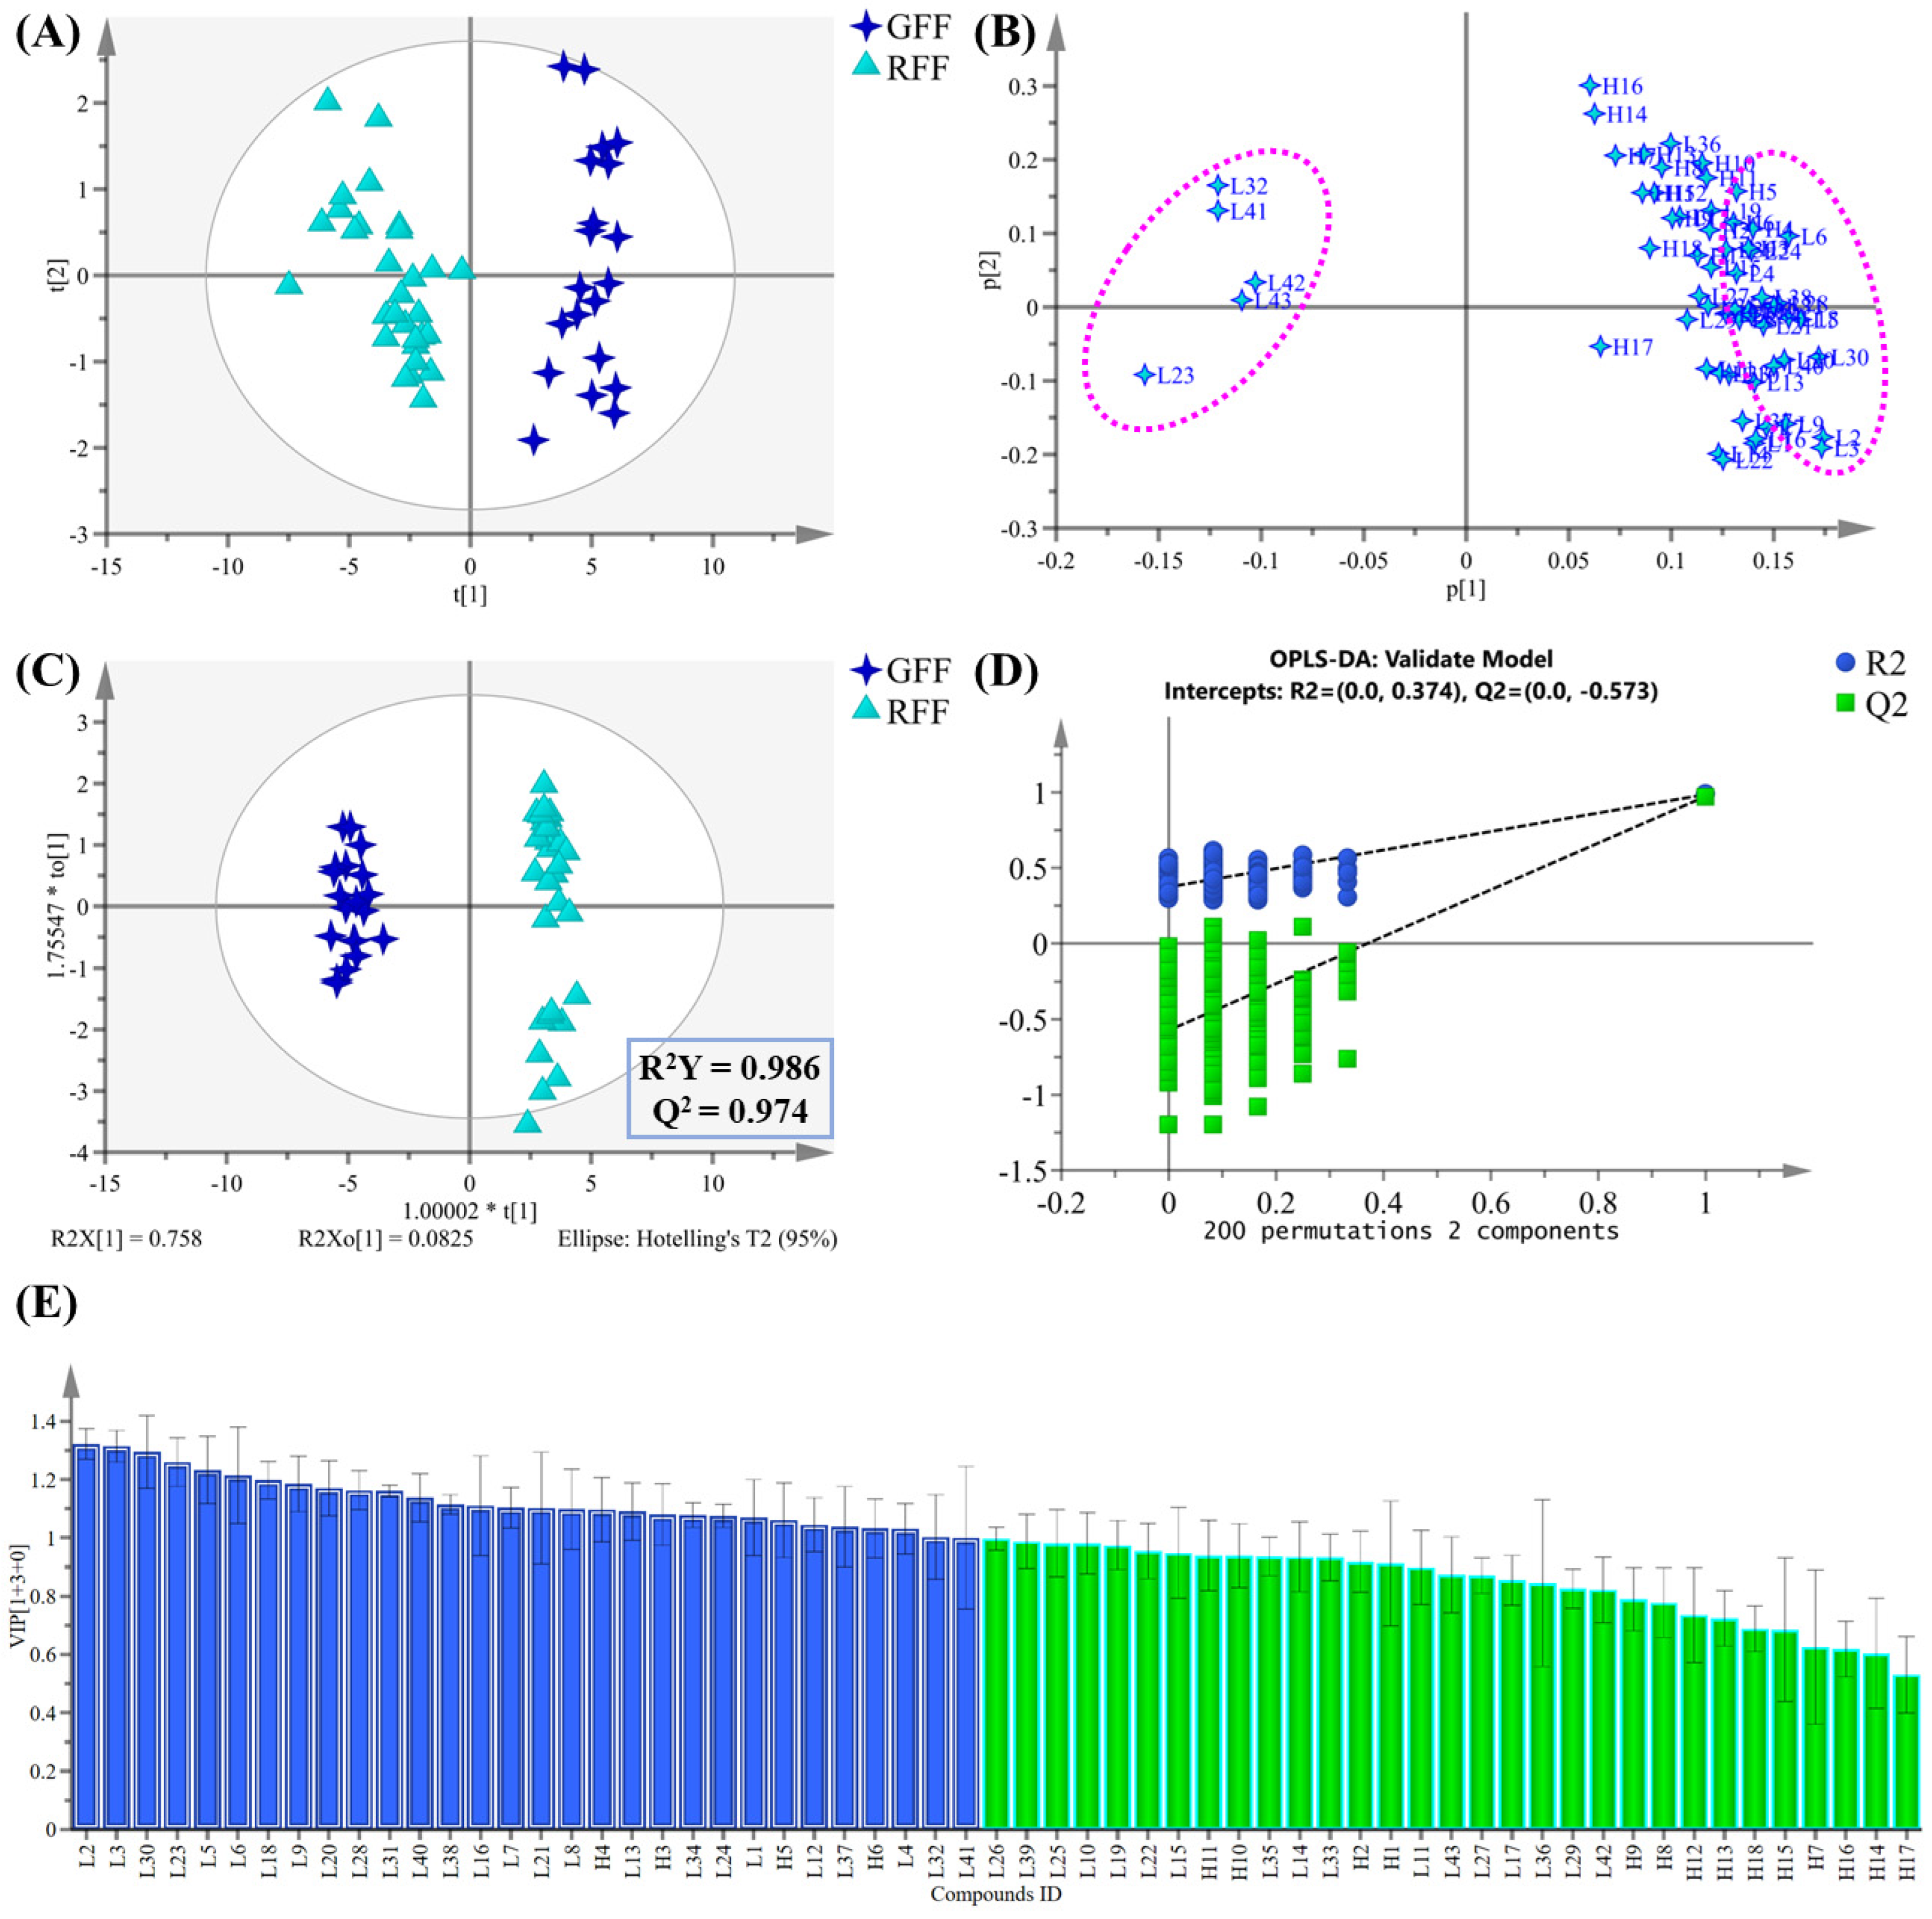
2.2. Multivariate Statistical Analysis of Non-Volatile Compounds

Given that positive and negative ionization modes may result in different metabolite profiles, analyses for ESI+ and ESI data were performed separately to ensure proper handling of the data from each mode. This approach enabled the identification of the specific contributions of each ionization mode to the metabolic differences between GFF and RFF samples, providing a more comprehensive and accurate view of the metabolite variations. CD software was used to process the raw LC-MS data, yielding 8524 and 12,496 mass spectrometric features in positive (ESI+) and negative (ESI) ion modes, respectively. The generated data matrix, which contained m/z values, retention times, and normalized peak areas, was then imported into SIMCA 14.1 for chemometric analysis. As shown in the 3D PCA score plot (Figure 4A,B), the QC samples exhibited tight clustering in both ESI+ and ESI modes, indicating excellent instrument stability and reproducibility. For ESI+ (Figure 4A), the first three principal components (PCs) explained 53.8%, 14.9%, and 7.5% of the total variance, respectively, yielding a cumulative interpretation rate (R2Xcum) of 83.3%. In ESI (Figure 4B), the corresponding values were 51.7%, 16.9%, and 9.8%, with a total variance explanation of 89.8%. The explanation rate of ESI (89.8%) was higher than that of ESI+ (83.3%), which reflects greater relative concentration changes between GFF and RFF in metabolites. The OPLS-DA model showed a clear separation between GFF and RFF in both ionization modes (Figure 4C,D), indicating significant differences in their chemical compositions. Furthermore, VIP (Variable Importance in Projection) values were applied to determine metabolites with significant contributions to sample discrimination.
Due to the high-dimensional nature of the LC-MS data, the VIP values could not effectively screen differential metabolites. Therefore, the Result Filter function in CD software was used to remove irrelevant noise, enhancing the identification accuracy of differential compounds. A total of 798 features in ESI+ and 1071 features in ESI were chosen for further OPLS-DA analysis based on the following filtering criteria: Peak rating ≥ 6, RSD QC area ≤ 30%, adjusted p-value < 0.01 for any ratio, and a normalized area value for each file. The OPLS-DA models, as shown in Figure 4E,F, demonstrated that the GFF and RFF groups could still be significantly distinguished in ESI+ and ESI, and the model parameters (R2Y and Q2) exhibited good explanatory and predictive ability. Additionally, the 200 permutation tests (Figure S4A,B) indicated that no overfitting phenomenon was observed. These results indicate that the filtering criteria effectively excluded features with low peak quality or unreliable values, without affecting the classification results.
A total of 217 and 353 characteristic peaks were screened in ESI+ and ESI, respectively, based on VIP > 1 and p-value < 0.05, facilitating the differentiation between GFF and RFF samples. Features without MS/MS spectra were excluded, and differential metabolites were identified based on retention time, m/z, and fragment ions, as detailed in Figure 1. Finally, 43 differential compounds were identified, with detailed information presented in Table 1. The main differential compounds included 13 phenylethyl glycosides, 8 lignans, 8 iridoids, 6 cyclohexyl alcohol derivatives, 3 terpenes, 3 organic acids, 1 flavonoid, and 1 alkaloid. The clustering heatmap, based on chromatographic peak areas, displays the distribution of 43 differential metabolites in GFF and RFF (Figure S5). The results indicated that most compounds, such as cornoside, isoforsythiaside, and forsythoside A, are more abundant in GFF than in RFF, which is consistent with the findings of Jia et al. [2]. Compared to NMR analysis, the differential compounds identified by LC-MS did not include phillyrin and rutin. This may be related to the ionization efficiency of these compounds and their relatively small differences in GFF and RFF samples. Although the differences observed in the heatmap reflect relative variations in metabolite levels between the sample groups rather than absolute concentration differences, they still offer important insights into the differences between GFF and RFF.
Additionally, the relative concentrations of S-suspensaside methyl ether, forsyshiyanine B, esculentic acid, 18-β-glycyrrhetinic acid, and maslinic acid were higher in RFF compared to GFF. This finding could be associated with the anti-inflammatory and mass-dispersing properties of RFF in clinical applications. Forsythianine B, an alkaloid with a rare skeleton structure, exhibits antiviral activities against influenza A virus and respiratory syncytial virus, as well as anti-inflammatory properties [33]. Previous studies have shown that the terpenoid compounds esculentic acid, 18-β-glycyrrhetinic acid, and maslinic acid possess significant anti-inflammatory, antitumor, and antioxidant properties [34,35,36]. Wang et al. demonstrated that 18-β-glycyrrhetinic acid exerts strong antitumor activity against colorectal cancer by suppressing cell proliferation and migration [35]. Earlier research has mainly explored the variations in phenylethanoid glycosides, lignans, and flavonoids between GFF and RFF [37]. Our findings reveal that terpenoids also play a crucial role in their pharmacological disparities, underscoring their impact on chemical diversity and bioactivity.

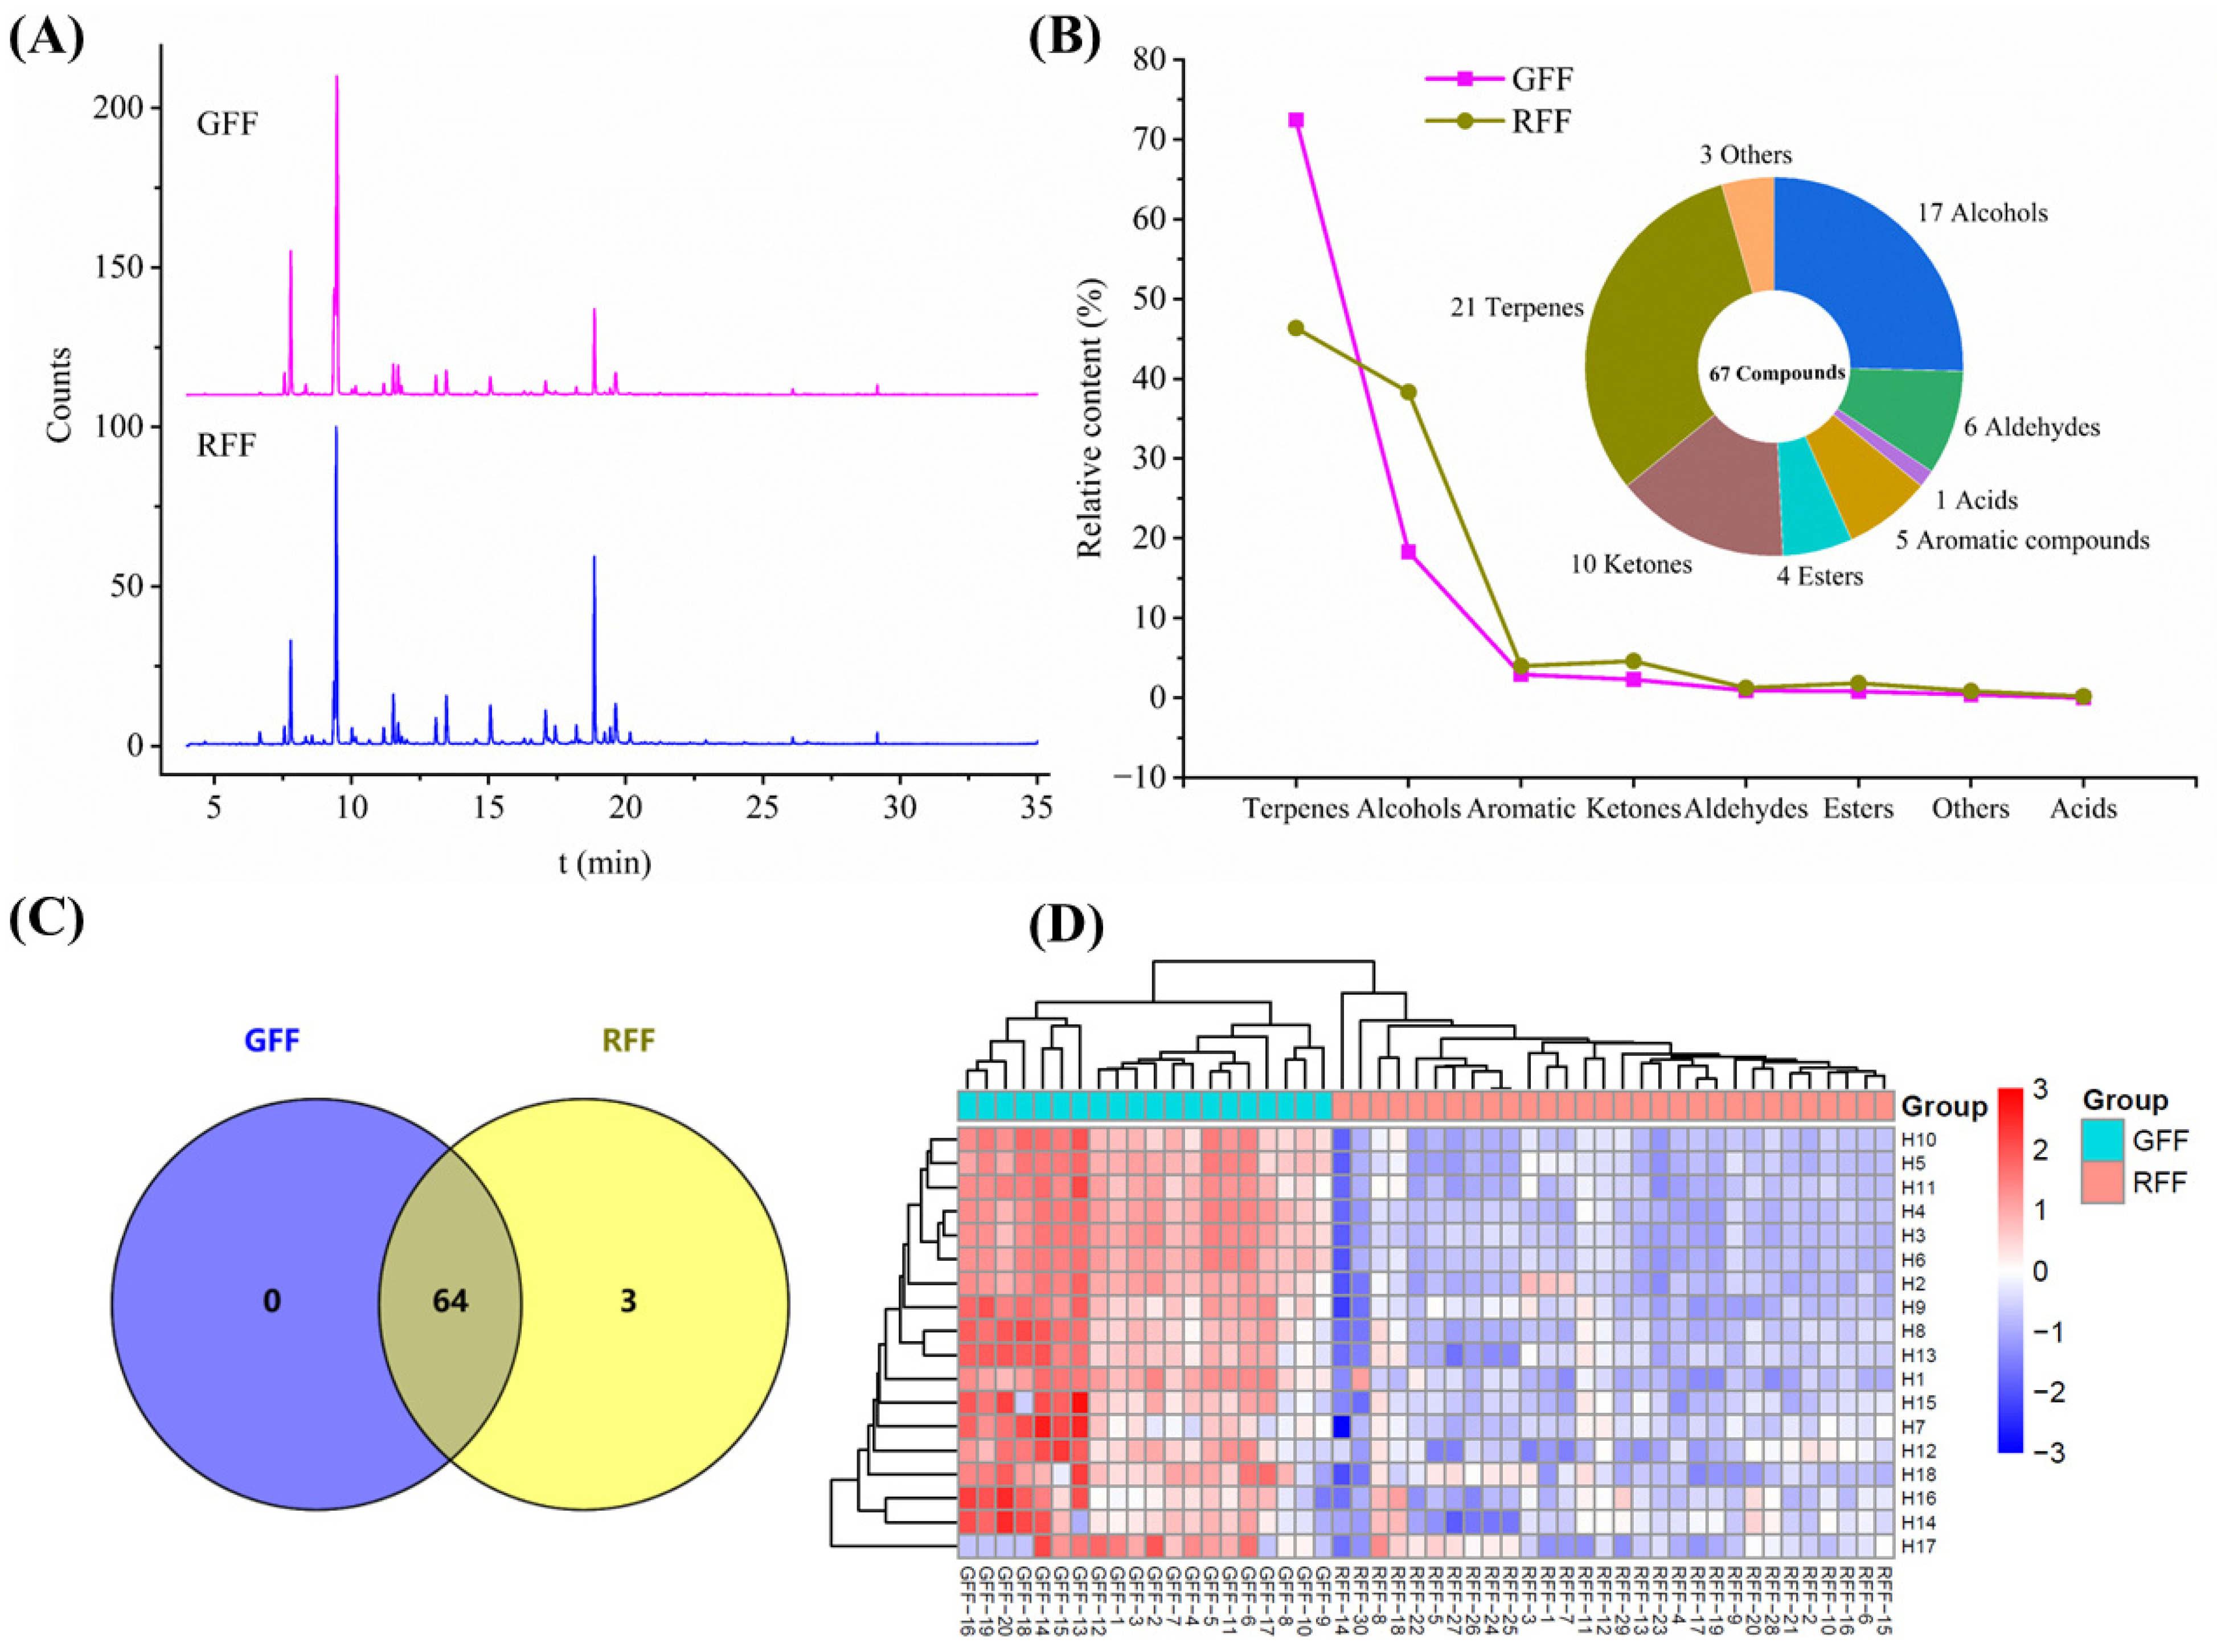
2.3. Characterization of the Volatile Metabolites in GFF and RFF

The Total Ion Chromatograms (TICs) obtained by HS-GC-MS analysis clearly reveal significant differences between the GFF and RFF samples (Figure 5A). Sixty-seven volatile compounds were identified based on reference standards, the NIST 17.0 database, and the literature [38,39,40], comprising 21 terpenes, 17 alcohols, 10 ketones, 6 aldehydes, 5 aromatics, 4 esters, 1 acid, and 3 others (Figure 5B). The Venn plot (Figure 5C) showed that 64 volatile components were common to both GFF and RFF. Hexanoic acid, 1-hexanol, and 4-methylenecyclohexanone were only detected in RFF.
The differences in volatile compounds between GFF and RFF may be influenced by multiple factors, including variety, maturity stage, harvest time, drying and storage conditions, and enzymatic and non-enzymatic reactions [41,42,43]. Specifically, it was found that GFF, harvested at an earlier stage, exhibits a higher relative abundance of terpenes (Figure 5B). In contrast, RFF, harvested at full maturity, shows a reduction in terpenes and an increase in alcohols and ketones. These changes are closely related to metabolic transitions during fruit maturation, the regulation of metabolic pathways, and processing methods [44,45]. β-Pinene, α-pinene, sabinene, and terpinen-4-ol are the major volatile components, with relative contents exceeding 5% in both GFF and RFF samples (Table 2). Moreover, β-pinene was the most abundant compound in both GFF and RFF, which is consistent with previous studies [38]. However, the relative content of β-pinene significantly decreased during maturation, from 39.96% ± 1.65% in GFF to 23.52% ± 2.64% in RFF. This change may be due to alterations in the terpenoid metabolic pathway of RFF fruits during maturation, such as reduced monoterpene synthase (TPS) activity or increased activity of downstream oxidases, leading to the degradation or transformation of terpene compounds [46].
Furthermore, the proportion of terpenes in GFF is 72.34%, significantly higher than in RFF (46.30%). This trend suggests that terpene synthesis is more active during early fruit development. As the fruit matures, the secondary metabolic pathways gradually shift toward other metabolic products, such as alcohols and ketones, which may play an important role in fruit maturation and adaptation to environmental changes [47]. Recent research indicated that the accumulation of certain alcohols and ketones during fruit maturation could be associated with cell wall degradation, flavor formation, and stress regulation [48]. Therefore, the differences in volatile components between GFF and RFF could be attributed to metabolic changes, enzymatic transformations, and growth conditions during fruit maturation.

2.4. Multivariate Statistical Analysis of Volatile Compounds

HS-GC-MS qualitative analysis indicated that the types of volatile compounds in GFF and RFF samples are similar, but their relative concentrations vary significantly. To better visualize these differences and identify the differential compounds, PCA and OPLS-DA analyses were performed using the 67 identified volatile compounds. From the PCA score plot (Figure 6A), it can be seen that the first two PCs explain about 69.5% of the total variance, but the GFF and RFF samples did not fully separate. However, the OPLS-DA score plot (Figure 6B) exhibited a clear separation between GFF and RFF samples, consistent with the PCA models. Model parameters (R2X = 0.785, R2Y = 0.968, Q2 = 0.93) indicated robust explanatory and predictive abilities. Furthermore, 200 permutation tests confirmed the absence of overfitting. The VIP values of 67 compounds are displayed in Figure 6C, and 18 volatile compounds (VIP > 1 and p-value < 0.05) were chosen as potential markers to distinguish GFF from RFF (Table S4). The cluster heatmap analysis (Figure 4D) reveals a clear separation between GFF and RFF samples, indicating distinct differences in the volatile components between GFF and RFF. The analysis of these characteristic metabolites revealed that the accumulation of ketones, alcohols, aldehydes, and esters was higher in RFF compared to GFF, with prominent compounds such as sabinone, o-cymene, and terpinolene. In contrast, the levels of terpene compounds, including α-thujene, α-pinene, (R)-isocarvestrene, camphene, cyclene, sabinene, β-pinene, and eucalyptol, were significantly reduced.

2.5. Discriminant Ability Assessment of Differential Compounds

To assess the discriminative power of the selected differential compounds, both supervised OPLS-DA and unsupervised HCA methods were applied. The two new OPLS-DA models in Figure 7A,B demonstrate comparable effectiveness to the original models (Figure 4C,D) in distinguishing the samples. Additionally, the OPLS-DA model results show that LC-MS outperforms HS-GC-MS in sample distribution, suggesting that LC-MS provides a higher resolution and greater application potential, particularly offering unique advantages in the analysis of complex samples. Moreover, these new models exhibit strong statistical parameters, confirming their reliable fitting and predictive performance. The permutation test confirms the robustness and strong predictive capabilities of the two OPLS-DA models (Figure 4C,D). Distinct clustering results can be observed by HCA (Hierarchical Clustering Analysis, Figure S6B), which are consistent with the OPLS-DA results. Overall, the differential compounds screened by the untargeted metabolomics approach using LC-MS and HS-GC-MS provide strong support for distinguishing between GFF and RFF.

2.6. Mid-Level Data Fusion of LC-MS and HS-GC-MS

LC-MS is capable of providing information regarding both polar and non-polar compounds. In contrast, GC-MS primarily focuses on volatile compounds. Nevertheless, variations in sensitivity, detection limits, and sample preparation among different instruments can lead to disparate results. By integrating data fusion methods with multiple analytical techniques, a more extensive metabolite profile can be obtained [21,49]. Rivera-Pérez et al. demonstrated that mid-level data fusion, combining UHPLC-HRMS, GC-HRMS, and 1H NMR, enhanced the classification accuracy of black pepper from 92% to 100%, highlighting its potential for metabolomics-based authentication and quality control [49].
In this study, a mid-level data fusion method was used to efficiently combine the results from LC-MS and HS-GC-MS analyses. This strategy facilitated a comprehensive understanding of the volatile and non-volatile constituents in the FF samples. The fused dataset consisted of 43 non-volatile differential metabolites identified by LC-MS and 18 volatile differential metabolites identified by HS-GC-MS. After min-max normalization, the data matrix was uploaded to SIMCA 14.1 software, followed by log transformation and Pareto scaling before PCA and OPLS-DA analysis. The PCA score plot (Figure 8A) reveals that GFF and RFF are clearly separated along the first two principal components (PC1 and PC2), suggesting significant differences in metabolite composition between the groups. The loading plot (Figure 8B) shows the contribution of key metabolites to the sample separation. Metabolites farther from the origin have a greater impact on the group differences. For example, compounds L2 (hydroxytyrosol 1-O-glucoside), L3 (cornoside), L23 (S-suspensaside methyl ether), L30 (forsythenside L), L32 (forsyshiyanine B), and L41 (esculentic acid) contribute significantly to the first two principal components, suggesting their important role in the differences between groups. The findings align with the OPLS-DA model, where the VIP values of these five compounds exceed 1.0 (Figure 8E). The OPLS-DA model with mid-level data fusion showed improved separation between GFF and RFF samples (Figure 8C). Moreover, the model exhibited superior performance, with reliable goodness-of-fit (R2Y = 0.986) and predictability (Q2 = 0.974), outperforming the single HS-GC-MS technique (R2Y = 0.968, Q2 = 0.930) (Table S5).
Additionally, mid-level data fusion was applied to further screen markers in order to identify metabolites with higher specificity and representativeness. Using VIP > 1 and p-value < 0.05 as criteria, 30 significantly different compounds were identified between GFF and RFF (Figure 8E). Among them, 26 non-volatile compounds were identified through LC-MS, with the top 10 compounds based on VIP values, including hydroxytyrosol-1-O-glucoside, cornoside, forsythenside L, S-suspensaside methyl ether, vanilloloside, forsythoside D, forsythenside B, (+)-8-hydroxypinoresinol 4-O-β-D-glucopyranoside, salidroside, and forsythialanside E. Additionally, four volatile compounds, including α-pinene, camphene, sabinene, and β-pinene, were selected through HS-GC-MS analysis. By reducing the 61 differential compounds initially identified through single techniques to 30 compounds selected through mid-level data fusion, this process effectively eliminated irrelevant variables and maintained excellent predictive performance.
Furthermore, the differential compounds identified through mid-level data fusion mainly originate from non-volatile compounds from LC-MS analysis. This may be attributed to the lower content of volatile compounds in GFF and RFF, compared to non-volatile components. This phenomenon might be a consequence of the volatile nature of these compounds, which makes them prone to loss during long-term storage or extraction processes, leading to lower concentrations [43]. Despite the relatively high concentrations of volatile compounds in GFF and RFF, HS-GC-MS still provides valuable insights, particularly in revealing the sensory characteristics and potential biological activity of the medicinal materials. For example, volatile compounds such as α-pinene, camphene, and sabinene, which were detected, are closely related to the flavor, aroma, and potential biological activity (e.g., anti-inflammatory and antimicrobial) of the medicinal material [50,51].

3. Materials and Methods

3.1. Chemicals and Materials

The ultrapure water was sourced from Guangzhou Watsons Food and Beverage Co., Ltd. in Guangzhou, China. Methanol and acetonitrile (LC-MS grade), as well as the n-alkane standards (C8-C25), were purchased from Merck in Darmstadt, Germany. Formic acid (LC-grade) was supplied by Anpel Laboratory Technologies Inc. (Shanghai, China). Other chemicals and solvents were sourced from Sinopharm (Shanghai, China). Twenty-one reference standards from Shanghai Shidande Standard Technical Service Co., Ltd. were used for LC-MS analysis. Eight reference standards from Shanghai Aladdin Biochemical Technology Co., Ltd. (Shanghai, China) were used for HS-GC-MS analysis (Table S2). All reference standards met analytical purity requirements.
Fifty batches of FF were collected from commercial suppliers, with detailed information provided in Table S3. The samples of FF were stored at the School of Pharmacy, Hunan University of Chinese Medicine, China.

3.2. UPLC-Q/Orbitrap MS Analysis

3.2.1. Preparation of the Sample Solution

A 50 mg sample powder was precisely weighed and extracted ultrasonically with 50 mL of 70% methanol for 30 min. After centrifugation at 13,000 rpm for 10 min, the supernatant was separated and used for LC-MS analysis. Equal volumes of supernatant from different sample batches were combined to prepare the quality control (QC) samples. Standards were dissolved in 70% methanol to prepare stock solutions, which were then mixed in batches to identify isomers. All extracts were kept at −40 °C until analysis.

3.2.2. Data Acquisition

The chromatographic separation was conducted on a Hypersil GOLD™ Aq-C18 column (100 × 2.1 mm, 1.9 μm) provided by Thermo Fisher Scientific (Waltham, MA, USA). The mobile phase consisted of 0.1% formic acid in water (A) and acetonitrile (B), with a flow rate of 0.3 mL/min, and the gradient was set as follows: 0–5 min, 3–5% A; 5–10 min, 5–15% A; 10–15 min, 15–17% A; 15–20 min, 17% A; 20–35 min, 17–50% A; 35–45 min, 50–65% A; 45–55 min, 65–95% A; 55–65 min, 95–98% A. Before injecting 2 μL of the sample solution for analysis, the column was maintained at 30 °C and equilibrated for 5 min.
Mass spectrometry was executed on an Orbitrap Exploris 120 system (Thermo Fisher Scientific, Waltham, MA, USA), utilizing heated electrospray ionization (H-ESI) in both positive (+3500 V) and negative (−3000 V) ion modes. The ion transfer tube had a temperature of 325 °C, and the vaporizer was at 350 °C. The scan range was defined from 100 to 1200 Da, with an intensity threshold set at 2 × 10⁵. Fragmentation was performed in ddMS2 mode at 15,000 resolutions with stepped HCD collision energies of 30, 60, and 90 eV. To verify the stability of the instrument, QC samples were examined initially and after every eighth injection.

3.2.3. Data Pre-Processing

The LC-MS data were analyzed in Compound Discoverer 3.3 (CD) with an untargeted metabolomics workflow. The workflow included peak extraction, baseline correction, retention time alignment, background subtraction, and peak area normalization. Compounds were identified within 1–60 min retention time, with a 5 ppm mass tolerance and a minimum intensity of 100,000. The analysis was conducted separately for positive and negative ion modes. Median normalization of peak areas was applied after background filtering and gap filling. The analysis was based on relative concentrations, as the peak area normalization method reflects the relative abundance of metabolites. Absolute concentrations of metabolites were not measured or considered in this study.
An in-house FF database was developed from the literature (e.g., Scifinder, PubMed, CNKI) and imported into CD software. The identification and characterization strategy for FF chemical constituents is shown in Figure 1. Elemental composition was predicted based on exact masses. Mass Frontier 8.0 was used to analyze the fragmentation patterns of reference compounds. The diagnostic product ions (DPIs) and neutral losses (NLs) of different types of compounds, based on the fragmentation patterns of reference compounds, were summarized. The differentiation of isomers was achieved by calculating ClogP values with ChemBioDraw Ultra 14.0.

3.3. HS-GC-MS Analysis

3.3.1. Instruments and Conditions

The sample powder (50 mg) was accurately weighed and placed in a 20 mL headspace vial, sealed, and then inserted into the 7697A Headspace Sampler (Agilent, Santa Clara, CA, USA). An Agilent 7890/7000A GC-QQQ/MS system (Agilent, Santa Clara, CA, USA) was used for compound identification. The vial was heated to 120 °C and equilibrated for 30 min. The quantitative loop was maintained at 130 °C, while the transfer line was set to 140 °C. The balance time for the quantitative loop was 0.05 min. A 1000 μL injection volume was used, with 0.5 min for sample retrieval, and a 40-min GC cycle time.
An Agilent HP-5MS Capillary GC column (30 m × 0.25 mm × 0.25 µm) was used. The sample injection was carried out at 250 °C in 1:20 split modes, with a solvent delay of 3 min. The temperature program began at 50 °C for 3 min, then ramped up to 80 °C at 3 °C/min for 2 min. After that, it increased to 120 °C at 5 °C/min, held for 2 min, and eventually rose to 240 °C at 12 °C/min. After the run, the temperature was held at 280 °C for 3 min, with a total run time of 38 min. The electron ionization source was kept at 230 °C with an ionization voltage of 70 eV. Full-scan mode (m/z 50–550) was used for data acquisition, with the ion source and quadrupole maintained at 250 °C and 150 °C, respectively. n-Alkane standards (C8-C25) were injected for analysis.

3.3.2. Data Processing

The raw HS-GC-MS data were analyzed with the Agilent MassHunter Unknowns program (Version 10.1), and compounds were identified by matching with the NIST 17.0 library (scores > 80%). Retention indices (RIs) were calculated using n-alkanes (C8-C25) and compared to the NIST database values for the same column, with identifications accepted when RI differences were <10. Reference compounds were employed to confirm the identifications. The relative content of compounds was calculated using the peak area normalization method and expressed as the mean ± SD (standard deviation).

3.4. Chemometric Analysis

For LC-MS analysis, chemometric analysis was performed on raw features rather than identified compounds due to the complexity of the data. LC-MS generates a large number of ions, and direct analysis of identified compounds alone may not adequately capture the full metabolite profile. HS-GC-MS provides a direct and reliable analytical approach, simplifying data processing and ensuring accurate compound identification and quantification. Therefore, identified compounds are used for chemometric analysis in HS-GC-MS analysis. The peak areas of the extracted features or compounds were imported into SIMCA 14.1 software (Umetrics, Malmo, Sweden) for chemometric analysis. Data were Log-transformed and Pareto-scaled before performing PCA and OPLS-DA analysis. R2Y and Q2 were used as validation parameters for the OPLS-DA model, with 200 permutation tests to avoid overfitting. Differential compounds were selected with VIP ≥ 1 and p-value < 0.05. In addition, fold change (FC) analysis was applied to compare compound abundances between groups. Cluster heatmaps were visualized using the Bioinformatics platform, and hierarchical clustering of metabolite biomarkers was performed with MetaboAnalyst 5.0.

3.5. Mid-Level Data Fusion Strategies

Mid-level data fusion was applied to integrate LC-MS and HS-GC-MS datasets for differentiating the ripening stages of FF, aiming to assess metabolite information and improve prediction accuracy. VIP scores from OPLS-DA models and t-test p-values obtained from multiple platforms were used to identify discriminative compounds, which were subsequently integrated into a new matrix for classification. Min-max normalization was applied to address scale differences, followed by auto-scaling of the mid-level matrix before modeling.

4. Conclusions

In this study, a systematic analysis of GFF and RFF compounds was performed using LC-MS and HS-GC-MS, identifying 237 non-volatile compounds and 67 volatile compounds. High-resolution LC-MS offers superior sensitivity and broader metabolite coverage, allowing for the simultaneous detection of both polar and non-polar compounds while providing structural information, making it particularly advantageous for the identification of non-volatile metabolites. HS-GC-MS features low sample consumption and rapid separation and detection of volatile compounds without additional extraction. However, LC-MS has limitations in detecting volatile compounds, and HS-GC-MS has lower sensitivity for non-volatile compounds. Therefore, integrating the complementary strengths of both techniques is crucial for improving the accuracy and comprehensiveness of the analysis.
A mid-level data fusion strategy was employed to overcome the potential information gaps or limitations of single techniques, thereby enhancing the reliability and representativeness of the analysis. Using VIP > 1 and p-value < 0.05 as criteria, 30 differential metabolites, including 26 non-volatile and 4 volatile compounds, were identified. Among them, only S-suspensaside methyl ether, forsyshiyanine B, and esculentic acid showed higher relative concentrations in RFF than in GFF. Although a higher relative concentration does not necessarily indicate a higher absolute concentration, the relative concentrations of metabolites can still provide valuable insights into the differences between GFF and RFF.
This study provides scientific evidence for the quality assessment, authenticity identification, and pharmacological research of GFF and RFF, demonstrating the potential of data fusion in Traditional Chinese Medicine. However, relying solely on chemical composition analysis is insufficient to fully explain the pharmacological differences, and future studies could combine in vitro or vivo bioactivity assays and network pharmacology methods to further explore the mechanisms of action.

Supplementary Materials

The following supporting information can be downloaded at: https://www.mdpi.com/article/10.3390/molecules30071404/s1, Figure S1. Total ion chromatograms (TICs) for the QC sample in positive ion modes (ESI+) and negative ion modes (ESI); Figure S2. The fragmentation behavior of (A) phenylethanoid glycosides and (B) forsythenside B in negative ion mode; Figure S3. The MS/MS spectra of ursolic acid in ESI+ and ESI (A). Molecular network analysis with CD software identified 30 triterpenoid compounds in ESI+ mode; Figure S4. 200 times permutation test plots: (A) ESI+ mode with 798 features and (B) ESI mode with 1071 features; Figure S5. Heatmap of 43 differential non-volatile compounds; Figure S6. Hierarchical Clustering Analysis (HCA) based on the differential metabolites screened by LC-MS (A) and HS-GC-MS (B); Table S1. The detailed information of 237 compounds identified through LC-MS analysis; Table S2. The detailed information of all 29 reference standards used in this study; Table S3. The detailed information of Forsythiae Fructus samples; Table S4. Differential compounds identified through LC-MS and HS-GC-MS analysis; Table S5. Performance and validation results of OPLS-DA models for GFF and RFF classification based on single techniques and mid-level data fusion.

Author Contributions

Conceptualization, Q.X. and H.Y.; methodology, Q.X.; software, J.L.; investigation, Q.X.; resources, L.L. and S.L.; data curation, B.L.; writing—original draft preparation, Q.X.; writing—review and editing, H.Y. and M.W.; visualization, Q.X.; supervision, W.W.; project administration, B.L.; funding acquisition, W.W. and H.Y. All authors have read and agreed to the published version of the manuscript.

Funding

This work was supported by the National Natural Science Foundation of China (Grant No. 82304878) and the Graduate Innovation Project of Hunan University of Chinese Medicine (Grant No. 2023CX12).

Institutional Review Board Statement

Not applicable.

Informed Consent Statement

Not applicable.

Data Availability Statement

The original contributions presented in this study are included in the article/Supplementary Materials. Further inquiries can be directed to the corresponding authors.

Acknowledgments

We acknowledge the collective effort and contributions of all those involved in this research.

Conflicts of Interest

The authors declare no conflicts of interest.

References

  1. Ji, Y.-L.; Feng, X.; Chang, Y.-Q.; Zheng, Y.-G.; Hou, F.-J.; Zhang, D.; Guo, L. Chemical Characterization of Different Parts of Forsythia suspensa and α-Glucosidase and Pancreatic Lipase Inhibitors Screening Based on UPLC-QTOF-MS/MS and Plant Metabolomics Analysis. Arab. J. Chem. 2024, 17, 105723. [Google Scholar] [CrossRef]
  2. Jia, J.; Zhang, F.; Li, Z.; Qin, X.; Zhang, L. Comparison of Fruits of Forsythia suspensa at Two Different Maturation Stages by NMR-Based Metabolomics. Molecules 2015, 20, 10065–10081. [Google Scholar] [CrossRef]
  3. Dong, Z.; Lu, X.; Tong, X.; Dong, Y.; Tang, L.; Liu, M. Forsythiae Fructus: A Review on Its Phytochemistry, Quality Control, Pharmacology and Pharmacokinetics. Molecules 2017, 22, 1466. [Google Scholar] [CrossRef] [PubMed]
  4. Shao, S.-Y.; Zhang, F.; Yang, Y.-N.; Feng, Z.-M.; Jiang, J.-S.; Zhang, P.-C. Neuroprotective and Anti-Inflammatory Phenylethanoidglycosides from the Fruits of Forsythia suspensa. Bioorg. Chem. 2021, 113, 105025. [Google Scholar] [CrossRef]
  5. Li, J.-J.; Chen, Z.-H.; Liu, C.-J.; Kang, Y.-S.; Tu, X.-P.; Liang, H.; Shi, W.; Zhang, F.-X. The Phytochemistry, Pharmacology, Pharmacokinetics, Quality Control, and Toxicity of Forsythiae Fructus: An Updated Systematic Review. Phytochemistry 2024, 222, 114096. [Google Scholar] [CrossRef]
  6. Pharmacopoeia Commission of the People’s Republic of China. Pharmacopoeia of People’s Republic of China; Chemical Industry Press: Beijing, China, 2020. [Google Scholar]
  7. Pan, M.; Su, Y.; Liu, X.; Xiang, S.; Ding, Y.; Li, Q. Identification of Forsythia suspensa (Thunb.) Vahl in Different Harvest Periods Using Intelligent Sensory Technologies, HPLC Characteristic Fingerprint Coupled with Chemometrics. Phytochem. Anal. 2022, 33, 490–501. [Google Scholar] [CrossRef] [PubMed]
  8. Bai, Y.; Li, J.; Liu, W.; Jiao, X.; He, J.; Liu, J.; Ma, L.; Gao, X.; Chang, Y. Pharmacokinetic of 5 Components after Oral Administration of Fructus Forsythiae by HPLC-MS/MS and the Effects of Harvest Time and Administration Times. J. Chromatogr. B 2015, 993, 36–46. [Google Scholar] [CrossRef]
  9. Bao, J.; Ding, R.-B.; Liang, Y.; Liu, F.; Wang, K.; Jia, X.; Zhang, C.; Chen, M.; Li, P.; Su, H.; et al. Differences in Chemical Component and Anticancer Activity of Green and Ripe Forsythiae Fructus. Am. J. Chin. Med. 2017, 45, 1513–1536. [Google Scholar] [CrossRef]
  10. Chen, L.-H.; Zhang, Y.-B.; Yang, X.-W.; Xu, J.; Wang, Z.-J.; Sun, Y.-Z.; Xu, W.; Wang, Y.-P. Application of UPLC-Triple TOF-MS/MS Metabolomics Strategy to Reveal the Dynamic Changes of Triterpenoid Saponins during the Decocting Process of Asian Ginseng and American Ginseng. Food Chem. 2023, 424, 136425. [Google Scholar] [CrossRef]
  11. Yin, X.-L.; Peng, Z.-X.; Pan, Y.; Lv, Y.; Long, W.; Gu, H.-W.; Fu, H.; She, Y. UHPLC-QTOF-MS-Based Untargeted Metabolomic Authentication of Chinese Red Wines According to Their Grape Varieties. Food Res. Int. 2024, 178, 113923. [Google Scholar] [CrossRef]
  12. Jin, G.; Zhu, Y.; Cui, C.; Yang, C.; Hu, S.; Cai, H.; Ning, J.; Wei, C.; Li, A.; Hou, R. Tracing the Origin of Taiping Houkui Green Tea Using 1H NMR and HS-SPME-GC-MS Chemical Fingerprints, Data Fusion and Chemometrics. Food Chem. 2023, 425, 136538. [Google Scholar] [CrossRef]
  13. Yan, X.; Wang, Y.; Yu, X.; Xie, J.; Yu, Q.; Chen, Y. Exploring Authenticity and Potential Markers of Lushan Yunwu Green Tea by Fusing 1H NMR and UPLC-Q/TOF-MS Techniques. Food Control 2024, 163, 110492. [Google Scholar] [CrossRef]
  14. Rivera-Pérez, A.; Romero-González, R.; Garrido Frenich, A. Untargeted 1H NMR-Based Metabolomics and Multi-Technique Data Fusion: A Promising Combined Approach for Geographical and Processing Authentication of Thyme by Multivariate Statistical Analysis. Food Chem. 2023, 420, 136156. [Google Scholar] [CrossRef] [PubMed]
  15. Shan, X.; Li, L.; Liu, Y.; Wang, Z.; Wei, B.; Zhang, Z. Untargeted Metabolomics Analysis Using UPLC-QTOF/MS and GC-MS to Unravel Changes in Antioxidant Activity and Compounds of Almonds before and after Roasting. Food Res. Int. 2024, 194, 114870. [Google Scholar] [CrossRef] [PubMed]
  16. Pantharos, P.; Sukcharoen, P.; Phadungrakwittaya, R.; Akarasereenont, P.; Booranasubkajorn, S.; Lumlerdkij, N. Utilization of UPLC-PDA and GC–MS/MS Coupled with Metabolomics Analysis to Identify Bioactive Metabolites in Medicinal Turmeric at Different Ages for the Quality Assurance. Phytomedicine 2022, 102, 154157. [Google Scholar] [CrossRef] [PubMed]
  17. Xue, B.-X.; Tuliebieke, T.; Zhang, T.-T.; Lai, J.-X.; Rao, Y.; Zhang, L.-H.; Yang, W.-Z.; Jiang, M.-M.; Wang, Y.-F.; Tian, X.-X.; et al. A Strategy Integrating GC–MS, UPLC Profiling, and DNA Metabarcoding for Characterization and Discrimination of the Medicinal and Culinary Pieces from Four Curcuma Species. Microchem. J. 2024, 203, 110895. [Google Scholar] [CrossRef]
  18. Gan, Y. Using HS-GC-MS and Flash GC e-Nose in Combination with Chemometric Analysis and Machine Learning Algorithms to Identify the Varieties, Geographical Origins and Production Modes of Atractylodes lancea. Ind. Crops Prod. 2024, 209, 117955. [Google Scholar] [CrossRef]
  19. Guo, J.; Zhang, S.-S.; Guo, S.; Hou, Y.; Bai, L.; Ho, C.-T.; Bai, N. A Comprehensive Analysis of the Chemical Composition of Fraxinus Mandshurica Roots Based on HPLC-DAD-MS, GC-MS and UPLC-ESI-Q-TOF-MS. J. Pharm. Biomed. Anal. 2023, 233, 115449. [Google Scholar] [CrossRef]
  20. Cuevas, F.J.; Pereira-Caro, G.; Moreno-Rojas, J.M.; Muñoz-Redondo, J.M.; Ruiz-Moreno, M.J. Assessment of Premium Organic Orange Juices Authenticity Using HPLC-HR-MS and HS-SPME-GC-MS Combining Data Fusion and Chemometrics. Food Control 2017, 82, 203–211. [Google Scholar] [CrossRef]
  21. Wu, X.-M.; Zuo, Z.-T.; Zhang, Q.-Z.; Wang, Y.-Z. Classification of Paris Species According to Botanical and Geographical Origins Based on Spectroscopic, Chromatographic, Conventional Chemometric Analysis and Data Fusion Strategy. Microchem. J. 2018, 143, 367–378. [Google Scholar] [CrossRef]
  22. Ding, R.; Yu, L.; Wang, C.; Zhong, S.; Gu, R. Quality Assessment of Traditional Chinese Medicine Based on Data Fusion Combined with Machine Learning: A Review. Crit. Rev. Anal. Chem. 2024, 54, 2618–2635. [Google Scholar] [CrossRef] [PubMed]
  23. Hong, Y.; Birse, N.; Quinn, B.; Li, Y.; Jia, W.; McCarron, P.; Wu, D.; Da Silva, G.R.; Vanhaecke, L.; Van Ruth, S.; et al. Data Fusion and Multivariate Analysis for Food Authenticity Analysis. Nat. Commun. 2023, 14, 3309. [Google Scholar] [CrossRef]
  24. Rubini, M.; Sandak, J.; Robles, E.; Sandak, A.; Charrier, B. Mid-Level Data Fusion Techniques for Gum Rosin Discrimination According to Pinus Species, Tapping Methods, and Geographic Origins. Microchem. J. 2024, 112630. [Google Scholar] [CrossRef]
  25. Gao, X.; Dong, W.; Ying, Z.; Li, G.; Cheng, Q.; Zhao, Z.; Li, W. Rapid Discriminant Analysis for the Origin of Specialty Yam Based on Multispectral Data Fusion Strategies. Food Chem. 2024, 460, 140737. [Google Scholar] [CrossRef]
  26. Wang, F.N.; Ma, Z.Q.; Liu, Y.; Guo, Y.Z.; Gu, Z.W. New Phenylethanoid Glycosides from the Fruits of Forsythia suspense (Thunb.) Vahl. Molecules 2009, 14, 1324–1331. [Google Scholar] [CrossRef]
  27. Wu, L.; Georgiev, M.I.; Cao, H.; Nahar, L.; El-Seedi, H.R.; Sarker, S.D.; Xiao, J.; Lu, B. Therapeutic Potential of Phenylethanoid Glycosides: A Systematic Review. Med. Res. Rev. 2020, 40, 2605–2649. [Google Scholar] [CrossRef] [PubMed]
  28. Zhou, X.; Chen, X.; Yin, X.; Wang, M.; Zhao, J.; Ren, Y. A Strategy Integrating Parent Ions List-Modified Mass Defect Filtering-Diagnostic Product Ions for Rapid Screening and Systematic Characterization of Flavonoids in Scutellaria Barbata Using Hybrid Quadrupole-Orbitrap High-Resolution Mass Spectrometry. J. Chromatogr. A 2022, 1674, 463149. [Google Scholar] [CrossRef] [PubMed]
  29. Guo, H.; Liu, A.-H.; Ye, M.; Yang, M.; Guo, D.-A. Characterization of Phenolic Compounds in the Fruits of Forsythia suspensa by High-Performance Liquid Chromatography Coupled with Electrospray Ionization Tandem Mass Spectrometry. Rapid Commun. Mass Spectrom. 2007, 21, 715–729. [Google Scholar] [CrossRef]
  30. Xia, Y.; Liang, J.; Guo, X.; Sun, H.; Kuang, H. UPLC-QTOF-MSE-based Diagnostic Product Ion Filtering to Unveil Unstable C6-C2 Glucoside Conjugates in Forsythia suspensa. J. Mass Spectrom. 2017, 52, 848–859. [Google Scholar] [CrossRef]
  31. Wei, Q.; Zhang, R.; Wang, Q.; Yan, X.J.; Yu, Q.W.; Yan, F.X.; Li, C.; Pei, Y.H. Iridoid, Phenylethanoid and Flavonoid Glycosides from Forsythia suspensa. Nat. Prod. Res. 2020, 34, 1320–1325. [Google Scholar] [CrossRef]
  32. Li, W.; Sun, L.; Zhao, L.; Yue, X.; Dai, S. New C9-Monoterpenoid Alkaloids Featuring a Rare Skeleton with Anti-Inflammatory and Antiviral Activities from Forsythia suspensa. Chem. Biodivers. 2022, 19, e202100668. [Google Scholar] [CrossRef] [PubMed]
  33. Zhao, L.; Li, W.; Dai, S.-J.; Liu, R.-X.; Xie, Z.-P.; Zhang, S.-M.; Yue, X.-D. Alkaloids Bearing Rare Skeletons from Forsythia suspensa with Anti-Inflammatory and Anti-Viral Activities In Vitro. Phytochemistry 2021, 186, 112739. [Google Scholar] [CrossRef] [PubMed]
  34. Niu, X.; Mu, Q.; Li, W.; Yao, H.; Li, H.; Huang, H. Esculentic Acid, a Novel and Selective COX-2 Inhibitor with Anti-Inflammatory Effect In Vivo and In Vitro. Eur. J. Pharmacol. 2014, 740, 532–538. [Google Scholar] [CrossRef]
  35. Wang, S.; Shen, Y.; Qiu, R.; Chen, Z.; Chen, Z.; Chen, W. 18 β-Glycyrrhetinic Acid Exhibits Potent Antitumor Effects against Colorectal Cancer via Inhibition of Cell Proliferation and Migration. Int. J. Oncol. 2017, 51, 615–624. [Google Scholar] [CrossRef] [PubMed]
  36. Montilla, M.P.; Agil, A.; Navarro, M.C.; Jiménez, M.I.; García-Granados, A.; Parra, A.; Cabo, M.M. Antioxidant Activity of Maslinic Acid, a Triterpene Derivative Obtained from Olea Europaea. Planta Med. 2003, 69, 472–474. [Google Scholar] [CrossRef]
  37. Jing, F.; Wang, L.; Yang, M.; Wu, C.; Li, J.; Shi, L.; Feng, S.; Li, F. Visualizing the Spatial Distribution of Functional Metabolites in Forsythia suspensa at Different Harvest Stages by MALDI Mass Spectrometry Imaging. Fitoterapia 2022, 162, 105285. [Google Scholar] [CrossRef] [PubMed]
  38. Jiao, J.; Fu, Y.-J.; Zu, Y.-G.; Luo, M.; Wang, W.; Zhang, L.; Li, J. Enzyme-Assisted Microwave Hydro-Distillation Essential Oil from Fructus Forsythia, Chemical Constituents, and Its Antimicrobial and Antioxidant Activities. Food Chem. 2012, 134, 235–243. [Google Scholar] [CrossRef]
  39. Jiao, J.; Gai, Q.-Y.; Fu, Y.-J.; Zu, Y.-G.; Luo, M.; Zhao, C.-J.; Li, C.-Y. Microwave-Assisted Ionic Liquids Treatment Followed by Hydro-Distillation for the Efficient Isolation of Essential Oil from Fructus Forsythiae Seed. Sep. Purif. Technol. 2013, 107, 228–237. [Google Scholar] [CrossRef]
  40. Jiao, J.; Ma, D.-H.; Gai, Q.-Y.; Wang, W.; Luo, M.; Fu, Y.-J.; Ma, W. Rapid Analysis of Fructus Forsythiae Essential Oil by Ionic Liquids-Assisted Microwave Distillation Coupled with Headspace Single-Drop Microextraction Followed by Gas Chromatography-Mass Spectrometry. Anal. Chim. Acta 2013, 804, 143–150. [Google Scholar] [CrossRef]
  41. Wang, H.; Zhou, X.; Deng, Y.; Zhang, R.; Fu, K.; Huang, J.; Huang, Q.; Zeng, C.; Liu, D.; Wang, W. Variations in Volatile Components and Biological Activities of Essential Oils from Citrus Aurantium ‘Changshanhuyou’ at Different Growth and Ripening Stages. Food Res. Int. 2024, 197, 115303. [Google Scholar] [CrossRef]
  42. Ray, A.; Mohanty, S.; Jena, S.; Sahoo, A.; Acharya, L.; Panda, P.C.; Sial, P.; Duraisamy, P.; Nayak, S. Drying Methods Affects Physicochemical Characteristics, Essential Oil Yield and Volatile Composition of Turmeric (Curcuma Longa L.). J. Appl. Res. Med. Aromat. Plants 2022, 26, 100357. [Google Scholar] [CrossRef]
  43. Famiani, F.; Farinelli, D.; Urbani, S.; Al Hariri, R.; Paoletti, A.; Rosati, A.; Esposto, S.; Selvaggini, R.; Taticchi, A.; Servili, M. Harvesting System and Fruit Storage Affect Basic Quality Parameters and Phenolic and Volatile Compounds of Oils from Intensive and Super-Intensive Olive Orchards. Sci. Hortic. 2020, 263, 109045. [Google Scholar] [CrossRef]
  44. Ricci, A.; Levante, A.; Cirlini, M.; Calani, L.; Bernini, V.; Del Rio, D.; Galaverna, G.; Neviani, E.; Lazzi, C. The Influence of Viable Cells and Cell-Free Extracts of Lactobacillus casei on Volatile Compounds and Polyphenolic Profile of Elderberry Juice. Front. Microbiol. 2018, 9, 2784. [Google Scholar] [CrossRef]
  45. Zhang, S.; Wu, Y.; Ren, Y.; Xu, Y.; An, H.; Zhao, Q.; Wang, Y.; Li, H. Widely Metabolomic Combined with Transcriptome Analysis to Build a Bioactive Compound Regulatory Network for the Fruit Growth Cycle in Pseudocydonia sinensis. Food Chem. 2024, 456, 139933. [Google Scholar] [CrossRef] [PubMed]
  46. Wang, Q.; Jiang, J.; Liang, Y.; Li, S.; Xia, Y.; Zhang, L.; Wang, X. Expansion and Functional Divergence of Terpene Synthase Genes in Angiosperms: A Driving Force of Terpene Diversity. Hortic. Res. 2025, 12, uhae272. [Google Scholar] [CrossRef]
  47. Xie, J.; Cao, Q.; Wang, W.; Zhang, H.; Deng, B. Understanding Changes in Volatile Compounds and Fatty Acids of Jincheng Orange Peel Oil at Different Growth Stages Using GC–MS. J. Integr. Agric. 2023, 22, 2282–2294. [Google Scholar] [CrossRef]
  48. Pei, Y.; Xue, Q.; Shu, P.; Xu, W.; Du, X.; Wu, M.; Liu, K.; Pirrello, J.; Bouzayen, M.; Hong, Y.; et al. Bifunctional Transcription Factors SlERF.H5 and H7 Activate Cell Wall and Repress Gibberellin Biosynthesis Genes in Tomato via a Conserved Motif. Dev. Cell 2024, 59, 1345–1359.e6. [Google Scholar] [CrossRef]
  49. Rivera-Pérez, A.; Romero-González, R.; Garrido Frenich, A. Application of an Innovative Metabolomics Approach to Discriminate Geographical Origin and Processing of Black Pepper by Untargeted UHPLC-Q-Orbitrap-HRMS Analysis and Mid-Level Data Fusion. Food Res. Int. 2021, 150, 110722. [Google Scholar] [CrossRef]
  50. Shan, M.-Q.; Qian, Y.; Yu, S.; Guo, S.-C.; Zhang, L.; Ding, A.-W.; Wu, Q.-N. Anti-Inflammatory Effect of Volatile Oil from Schizonepeta tenuifolia on Carrageenin-Induced Pleurisy in Rats and Its Application to Study of Appropriate Harvesting Time Coupled with Multi-Attribute Comprehensive Index Method. J. Ethnopharmacol. 2016, 194, 580–586. [Google Scholar] [CrossRef]
  51. Sieniawska, E.; Los, R.; Baj, T.; Malm, A.; Glowniak, K. Antimicrobial Efficacy of Mutellina purpurea Essential Oil and α-Pinene against Staphylococcus epidermidis Grown in Planktonic and Biofilm Cultures. Ind. Crops Prod. 2013, 51, 152–157. [Google Scholar] [CrossRef]
Figure 1. The strategy for identifying and characterizing the chemical constituents of FF.
Molecules 30 01404 g001
Figure 2. The compounds identified in the QC sample by LC-MS: (A) a 2D scatter plot with m/z versus RT (min); (B) a pie chart displaying the number of different types of compounds.
Molecules 30 01404 g002
Figure 3. The MS/MS spectra of (A) forsythoside A, (B) (+)-pinoresinol-4′-O-β-D-glucopyranoside, (C) arctiin, and (D) rutin in ESI mode.
Molecules 30 01404 g003
Figure 4. 3D PCA score plots of GFF and RFF samples: (A) ESI+ mode with 8524 features and (B) ESI mode with 12,496 features; OPLS-DA score plots of GFF and RFF samples: (C) ESI+ mode with 8524 features and (D) ESI mode with 12,496 features; OPLS-DA score plots of GFF and RFF samples: (E) ESI+ mode with 798 features and (F) ESI mode with 1071 features.
Molecules 30 01404 g004
Figure 5. (A) Total Ion Chromatograms (TICs) from HS-GC-MS analysis of GFF and RFF samples; (B) type composition of volatile compounds and Venn plot (C) in GFF and RFF; (D) heatmap visualization of 18 differential volatile compounds.
Molecules 30 01404 g005
Figure 6. Score plots of the PCA model (A) and OPLS-DA model (B); VIP plots (C) based on 67 compounds identified by HS-GC-MS.
Molecules 30 01404 g006
Figure 7. OPLS-DA score plots based on the screened 43 differential metabolites identified by LC-MS (A) and 18 differential metabolites identified by HS-GC-MS (B); 200 times permutation tests of the OPLS-DA model for differential metabolites identified by LC-MS (C) and HS-GC-MS (D).
Molecules 30 01404 g007
Figure 8. Score plots (A) and loading plots (B) of the PCA model; score plots of the OPLS-DA model (C); 200 times permutation tests (D); VIP plots (E) based on the mid-level fusion method.
Molecules 30 01404 g008
Table 1. Detailed information on the 43 differential compounds identified by LC-MS.
No.Compound NameVIP ScoreRT (min)AdductFormulam/zError (ppm)MS/MS
L1Quinic acid1.240.98[M−H]C7H12O6191.0560−0.74173.0463, 127.0405
L2Hydroxytyrosol 1-O-glucoside1.521.56[M−H]C14H20O8315.1085−0.41153.0559, 135.0457, 89.0246
L3Cornoside1.522.52[M−H]C14H20O8315.1084−1.85153.0571, 135.0455, 119.0350, 113.0244
L4Rengynic acid-1-O-β-D-glucopyranoside1.243.46[M−H]C14H24O9335.1346−0.34179.0579, 161.0463, 131.0347, 119.0352
L5Vanilloloside1.43.92[M−H]C14H20O8315.1085−0.28153.0554, 135.0459, 119.0353, 101.0250
L6Forsythoside D1.435.49[M−H]C20H30O13477.1605−1.71449.4005, 315.1103, 179.0560, 161.0463, 135.0455
L7Adoxosidic acid1.286.01[M−H]C16H24O10375.1284−3.20337.1743, 213.0771, 169.0872, 151.0768, 125.0611
L8Forsythide1.236.28[M−H]C16H22O11389.1077−3.05345.1214, 183.0665, 165.0560, 121.0662, 119.0355
L9Salidroside1.356.66[M−H]C14H20O7299.1135−2.30119.0350, 101.0248
L10Rebouoside B1.116.76[M−H]C19H28O12447.1499−2.07315.1107, 191.0566, 149.0456, 135.0450, 131.0353
L11Forsythoside E1.027.19[M−H]C20H30O12461.1655−2.05315.1081, 163.0613, 153.0561, 135.0454, 131.0353
L12Darendoside A1.267.76[M−H]C19H28O11431.1550−1.99299.1140, 191.0568, 149.0460, 137.0603, 131.0353
L13Forsythenside B1.247.86[M−H]C22H26O11465.1396−1.15161.0456, 153.0552, 149.0247, 135.0454
L144-O-p-Coumaroylquinic acid1.19.33[M−H]C16H18O8337.0929−0.05191.0565, 173.0457, 163.0402, 145.0300
L15Rengyoside D1.139.39[M−H]C22H30O11469.1709−1.42193.0505, 161.0617, 151.0403, 133.0296, 123.0459
L16Hastatoside1.1910.05[M−H]C17H24O11403.1236−2.53371.0999, 327.1099, 191.0359, 179.0715, 137.0610
L17Calceolarioside A1.0210.89[M−H]C23H26O11477.1395−1.61179.0354, 161.0250, 135.0456, 133.0298
L18(+)-8-Hydroxypinoresinol 4-O-β-D-glucopyranoside1.211.27[M−H]C26H32O11535.1816−0.66373.1295, 343.1180, 313.1063, 179.0718, 163.0406, 151.0397, 109.0295
L19Forsythiayanoside B1.4411.47[M−H]C27H36O12551.2130−0.64359.1494, 191.0721, 163.0404
L20Forsythialanside E1.1911.69[M−H]C26H32O11581.1874−0.31373.1261, 343.1176, 163.0407
L21Calceolarioside C1.2811.97[M−H]C28H34O15609.1819−1.01447.1505, 315.1081, 179.0351, 161.0245, 153.0568
L22Isoforsythiaside1.112.36[M−H]C29H36O15623.1979−0.39461.1692, 443.1567, 179.0353, 161.0246, 135.0454
L23S-Suspensaside methyl ether1.5412.67[M−H]C30H38O16653.2085−0.33621.1834, 179.0354 161.0246, 151.0404, 135.0454
L24Plantainoside A1.312.93[M−H]C23H26O11477.1395−1.44315.1104, 179.0346, 161.0247, 135.0455, 133.0298
L25Adoxosidic acid-6′-oleuroperic ester1.1713.41[M−H]C30H36O16651.1928−0.39427.1253, 179.0351, 163.0611, 161.0246, 135.0453
L26Forsythoside A1.1913.54[M−H]C29H36O15623.1978−0.50461.1658, 315.1178, 179.0352, 161.0245, 135.0453
L27Acteoside1.0514.15[M−H]C29H36O15623.1978−0.50461.1663, 315.1077, 179.0348, 161.0245, 153.0556
L28Calceolarioside B1.3514.21[M−H]C23H26O11477.1395−1.47315.1085, 179.0352, 161.0246, 135.0452, 133.0297
L29Kaempferol 3-O-rutinoside1.0214.95[M−H]C27H30O15593.1511−0.12447.1546, 285.0403, 163.0035, 151.0037, 135.0085
L30Forsythenside L1.5715.12[M−H]C20H28O11443.1551−1.86427.8166, 149.0611
L31(+)-Pinoresinol 4′-O-β-D-glucopyranoside1.3915.42[M−H]C26H32O11519.1867−0.98357.1334, 342.1089, 311.1313, 163.0404, 161.0261, 151.0402, 136.0166
L32Forsyshiyanine B1.0915.98[M+H]+C18H17NO3296.1281−0.10132.0807, 117.0573
L33Isoacteoside1.0916.51[M−H]C29H36O15623.1978−0.48461.1663, 179.0351, 161.0245, 153.0553, 135.0453
L34Fraxiresinol-4′-O-β-D-glucopyranoside1.2618.73[M−H]C27H34O13565.1925−0.37357.1336, 327.1258, 151.0403, 137.0243, 135.0451
L35Matairesinoside1.0620.40[M−H]C26H32O11519.1867−0.91357.1335, 342.1098, 137.0614, 122.0375
L36Forsydoitriside A1.0822.50[M−H]C48H68O281091.3822−0.24929.3305, 883.8681, 733.2557, 715.2502, 571.2033, 553.1916, 445.1343, 375.1285, 357.1173, 151.0765
L37Suspenoidside A1.1922.79[M−H]C25H30O12521.1660−0.82315.1242, 163.0400, 149.0121, 145.0293, 119.0502
L38Acanthoside B1.3323.76[M−H]C28H36O13579.2081−0.41371.1505, 356.1262, 121.0295
L39Suspenoidside E1.2423.99[M−H]C26H32O13551.1767−0.62345.1339, 327.1238, 193.0508, 179.0366, 149.0614
L40Suspenoidsides D1.3525.81[M−H]C25H30O13537.1610−0.68243.0665, 137.0250, 135.0089, 109.0298, 91.0191
L41Esculentic acid1.1932.25[M+H]+C30H48O5489.3574−0.17435.3245, 407.3309, 219.1744, 201.1638, 191.1795
L4218-β-Glycyrrhetinic acid1.0435.94[M+H]+C30H46O4471.3467−0.33425.3417, 407.3317, 317.2097, 191.1799, 189.1639
L43Maslinic acid1.0939.15[M+H]+C30H48O4473.36260.10437.3422, 427.3572, 357.2803, 315.2331, 189.1631
Table 2. The volatile compounds and their relative contents in GFF and RFF samples obtained by HS-GC-MS analysis.
No.RT a
(min)
Compounds NameFormulaCAS
Number
RIcal bRIref cClassRelative Content d (%)
(Mean ± SD)
GFFRFF
14.66FurfuralC5H4O298-01-1835833Aldehydes0.25 ± 0.090.25 ± 0.11
25.681-HexanolC6H14O111-27-3872868Alcohols-0.07 ± 0.05
36.663-Methylcyclopentyl acetateC8H14O224070-70-0901905Esters0.27 ± 0.050.74 ± 0.17
47.35CycleneC10H16508-32-7922925Terpenes0.05 ± 0.010.04 ± 0.02
57.56α-thujeneC10H162867-05-2929929Terpenes1.92 ± 0.221.63 ± 0.74
67.79α-PineneC10H1680-56-8935937Terpenes13.09 ± 1.126.83 ± 1.21
78.34CampheneC10H1679-92-5950952Terpenes0.92 ± 0.110.46 ± 0.07
88.424-MethylenecyclohexanoneC7H10O29648-66-6952\Ketones-0.11 ± 0.04
98.572,4-ThujadieneC10H1436262-09-6956956Others0.24 ± 0.060.45 ± 0.16
108.74(2E)-2-HeptenalC7H12O18829-55-5960958Aldehydes0.04 ± 0.010.09 ± 0.04
118.83BenzaldehydeC7H6O100-52-7962962Aromatic0.06 ± 0.010.12 ± 0.02
129.37SabineneC10H163387-41-5975974Terpenes8.98 ± 1.044.88 ± 1.18
139.46β-PineneC10H16127-91-3977979Terpenes39.96 ± 1.6523.52 ± 2.64
149.84Hexanoic acidC6H12O2142-62-1985990Acids-0.2 ± 0.07
1510.026-Methylhept-5-en-2-oneC8H14O110-93-0989986Ketones0.6 ± 0.111.07 ± 0.15
1610.15β-MyrceneC10H16123-35-3992991Terpenes0.72 ± 0.180.69 ± 0.08
1710.65α-PhellandreneC10H1699-83-210031005Terpenes0.3 ± 0.040.4 ± 0.05
1811.18α-TerpineneC10H1699-86-510161017Terpenes1.15 ± 0.141.52 ± 0.37
1911.53o-CymeneC10H14527-84-410241022Aromatic2.59 ± 0.313.23 ± 0.57
2011.70(R)-IsocarvestreneC10H161461-27-410281027Terpenes2.22 ± 0.321.83 ± 0.2
2111.83EucalyptolC10H18O470-82-610311032Alcohols0.88 ± 0.080.72 ± 0.09
2212.00Benzyl alcoholC7H8O100-51-610351036Aromatic0.17 ± 0.020.39 ± 0.1
2312.39PhenylacetaldehydeC8H8O122-78-110441045Aldehydes0.07 ± 0.010.09 ± 0.03
2412.66trans-ThujenolC10H16O97631-68-010491039Alcohols0.05 ± 0.010.05 ± 0.01
2513.08γ-TerpineneC10H1699-85-410581060Terpenes1.84 ± 0.242.38 ± 0.53
2613.46(Z)-sabinene hydrateC10H18O15537-55-010661070Alcohols2.33 ± 0.155.53 ± 1.68
2713.99Benzyl formateC8H8O2104-57-410761080Esters0.04 ± 0.020.08 ± 0.02
2814.54TerpinoleneC10H16586-62-910861088Terpenes0.42 ± 0.040.59 ± 0.14
2915.06(E)-sabinene hydrateC10H18O17699-16-011701070Alcohols1.89 ± 0.185.16 ± 1.7
3015.29LinaloolC10H18O78-70-611001099Alcohols0.09 ± 0.010.16 ± 0.04
3115.463,4-DimethylstyreneC10H1227831-13-611041100Others0.16 ± 0.030.39 ± 0.1
3215.87FencholC10H16O1632-73-111141113Alcohols0.05 ± 0.040.18 ± 0.05
3315.93Phenylethyl AlcoholC8H10O60-12-811151116Aromatic0.1 ± 0.030.2 ± 0.04
3416.06ThujoneC10H16O546-80-511181103Ketones0.07 ± 0.010.1 ± 0.02
3516.304-Terpinenyl acetateC12H20O24821-04-911241301Esters0.35 ± 0.060.68 ± 0.11
3616.55α-CampholenalC10H16O4501-58-011301125Aldehydes0.31 ± 0.060.43 ± 0.15
3717.08Laevo-pinocarveolC10H16O547-61-511421139Alcohols1.49 ± 0.362.91 ± 0.72
3817.20(E)-Para-2-menthen-1-olC10H18O29803-81-411441140Alcohols0.35 ± 0.070.84 ± 0.09
3917.43Camphene hydrateC10H18O465-31-611511148Alcohols0.5 ± 0.121.48 ± 0.45
4017.97SabinoneC10H14O67690-48-611601163Ketones0.08 ± 0.020.11 ± 0.03
4118.03Sabina ketoneC9H14O513-20-211631156Ketones0.1 ± 0.030.27 ± 0.07
4218.20PinocarvoneC10H14O30460-92-511661164Ketones0.79 ± 0.181.25 ± 0.45
4318.35endo-BorneolC10H18O507-70-011691167Alcohols0.16 ± 0.030.43 ± 0.1
4418.53cis-SabinolC10H16O3310-02-911721175Alcohols0.1 ± 0.030.16 ± 0.03
4518.70PinocamphoneC10H16O15358-88-011761173Ketones0.05 ± 0.030.11 ± 0.04
4618.86Terpinen-4-olC10H18O562-74-311801177Alcohols6.77 ± 1.1315.31 ± 1.67
4719.03MyrtanalC10H16O4764-14-111831188Aldehydes0.11 ± 0.020.17 ± 0.04
4819.254-Isopropyl-2-cyclohexen-1-oneC9H14O500-02-711871184Ketones0.36 ± 0.060.8 ± 0.21
4919.44α-TerpineolC10H18O98-55-511911189Alcohols0.51 ± 0.121.19 ± 0.25
5019.65(±)-MyrtenolC10H16O515-00-411951195Alcohols2.99 ± 0.763.96 ± 1.27
5120.16(S)-VerbenoneC10H14O80-57-912081205Ketones0.24 ± 0.110.85 ± 0.26
5220.55CarveolC10H16O99-48-912201219Alcohols0.09 ± 0.020.13 ± 0.04
5320.722-HydroxycineoleC10H18O218679-48-612241228Alcohols0.06 ± 0.020.14 ± 0.05
5421.26CuminaldehydeC10H12O122-03-212411239Aldehydes0.17 ± 0.040.23 ± 0.07
5521.83PiperitoneC10H16O89-81-612571253Ketones0.03 ± 0.010.07 ± 0.03
5622.51β-CubebeneC15H2413744-15-513921389Terpenes0.06 ± 0.010.09 ± 0.03
5722.92Bornyl acetateC12H20O25655-61-812871284Esters0.16 ± 0.030.34 ± 0.05
5823.493-tert-ButylphenolC10H14O585-34-213021296Aromatic0.03 ± 0.010.05 ± 0.02
5925.23α-CubebeneC15H2417699-14-813551351Terpenes0.04 ± 0.010.09 ± 0.01
6026.09CopaeneC15H243856-25-513801376Terpenes0.3 ± 0.080.48 ± 0.12
6126.50(+)-epi-BicyclosesquiphellandreneC15H2454274-73-61392\Terpenes0.05 ± 0.010.09 ± 0.06
6227.24SantaleneC15H24512-61-814241420Terpenes0.03 ± 0.010.05 ± 0.02
6328.07γ-MuuroleneC15H2430021-74-014661477Terpenes0.01 ± 0.010.03 ± 0.01
6428.47Germacrene DC15H2423986-74-514861481Terpenes0.04 ± 0.020.05 ± 0.03
6528.79(R)-β-himachaleneC15H241461-03-615021500Terpenes0.01 ± 0.010.03 ± 0.01
6629.17(+)-δ-CadineneC15H24483-76-115291524Terpenes0.34 ± 0.10.65 ± 0.26
6729.47α-CalacoreneC15H2021391-99-115501542Others0.02 ± 0.010.03 ± 0.01
Terpenes 72.4646.35
Alcohols 18.3038.33
Aromatic 2.943.99
Ketones 2.324.62
Aldehydes 0.941.26
Esters 0.821.85
Others 0.420.87
Acids 0.000.20
Total identified compounds 98.2097.46
a RT: Retention time; b RI: Retention index on the HP-5MS column. c RIref: Retention indices were obtained from the NIST Mass Spectral Library (June 2017) and the Wiley Registry of Mass Spectral Data, 8th Edition. d Relative content (%) = (area under peak/total area) × 100. The relative content was calculated using the area normalization method and expressed as mean ± SD (n = 3); “-”: Not detected.
Disclaimer/Publisher’s Note: The statements, opinions and data contained in all publications are solely those of the individual author(s) and contributor(s) and not of MDPI and/or the editor(s). MDPI and/or the editor(s) disclaim responsibility for any injury to people or property resulting from any ideas, methods, instructions or products referred to in the content.

