
Methionine Aminopeptidase 2 (MetAP2) Inhibitor BL6 Attenuates Inflammation in Cultured Microglia and in a Mouse Model of Alzheimer’s Disease

 , ,
, ,  ,
,
Abstract
1. Introduction
2. Results
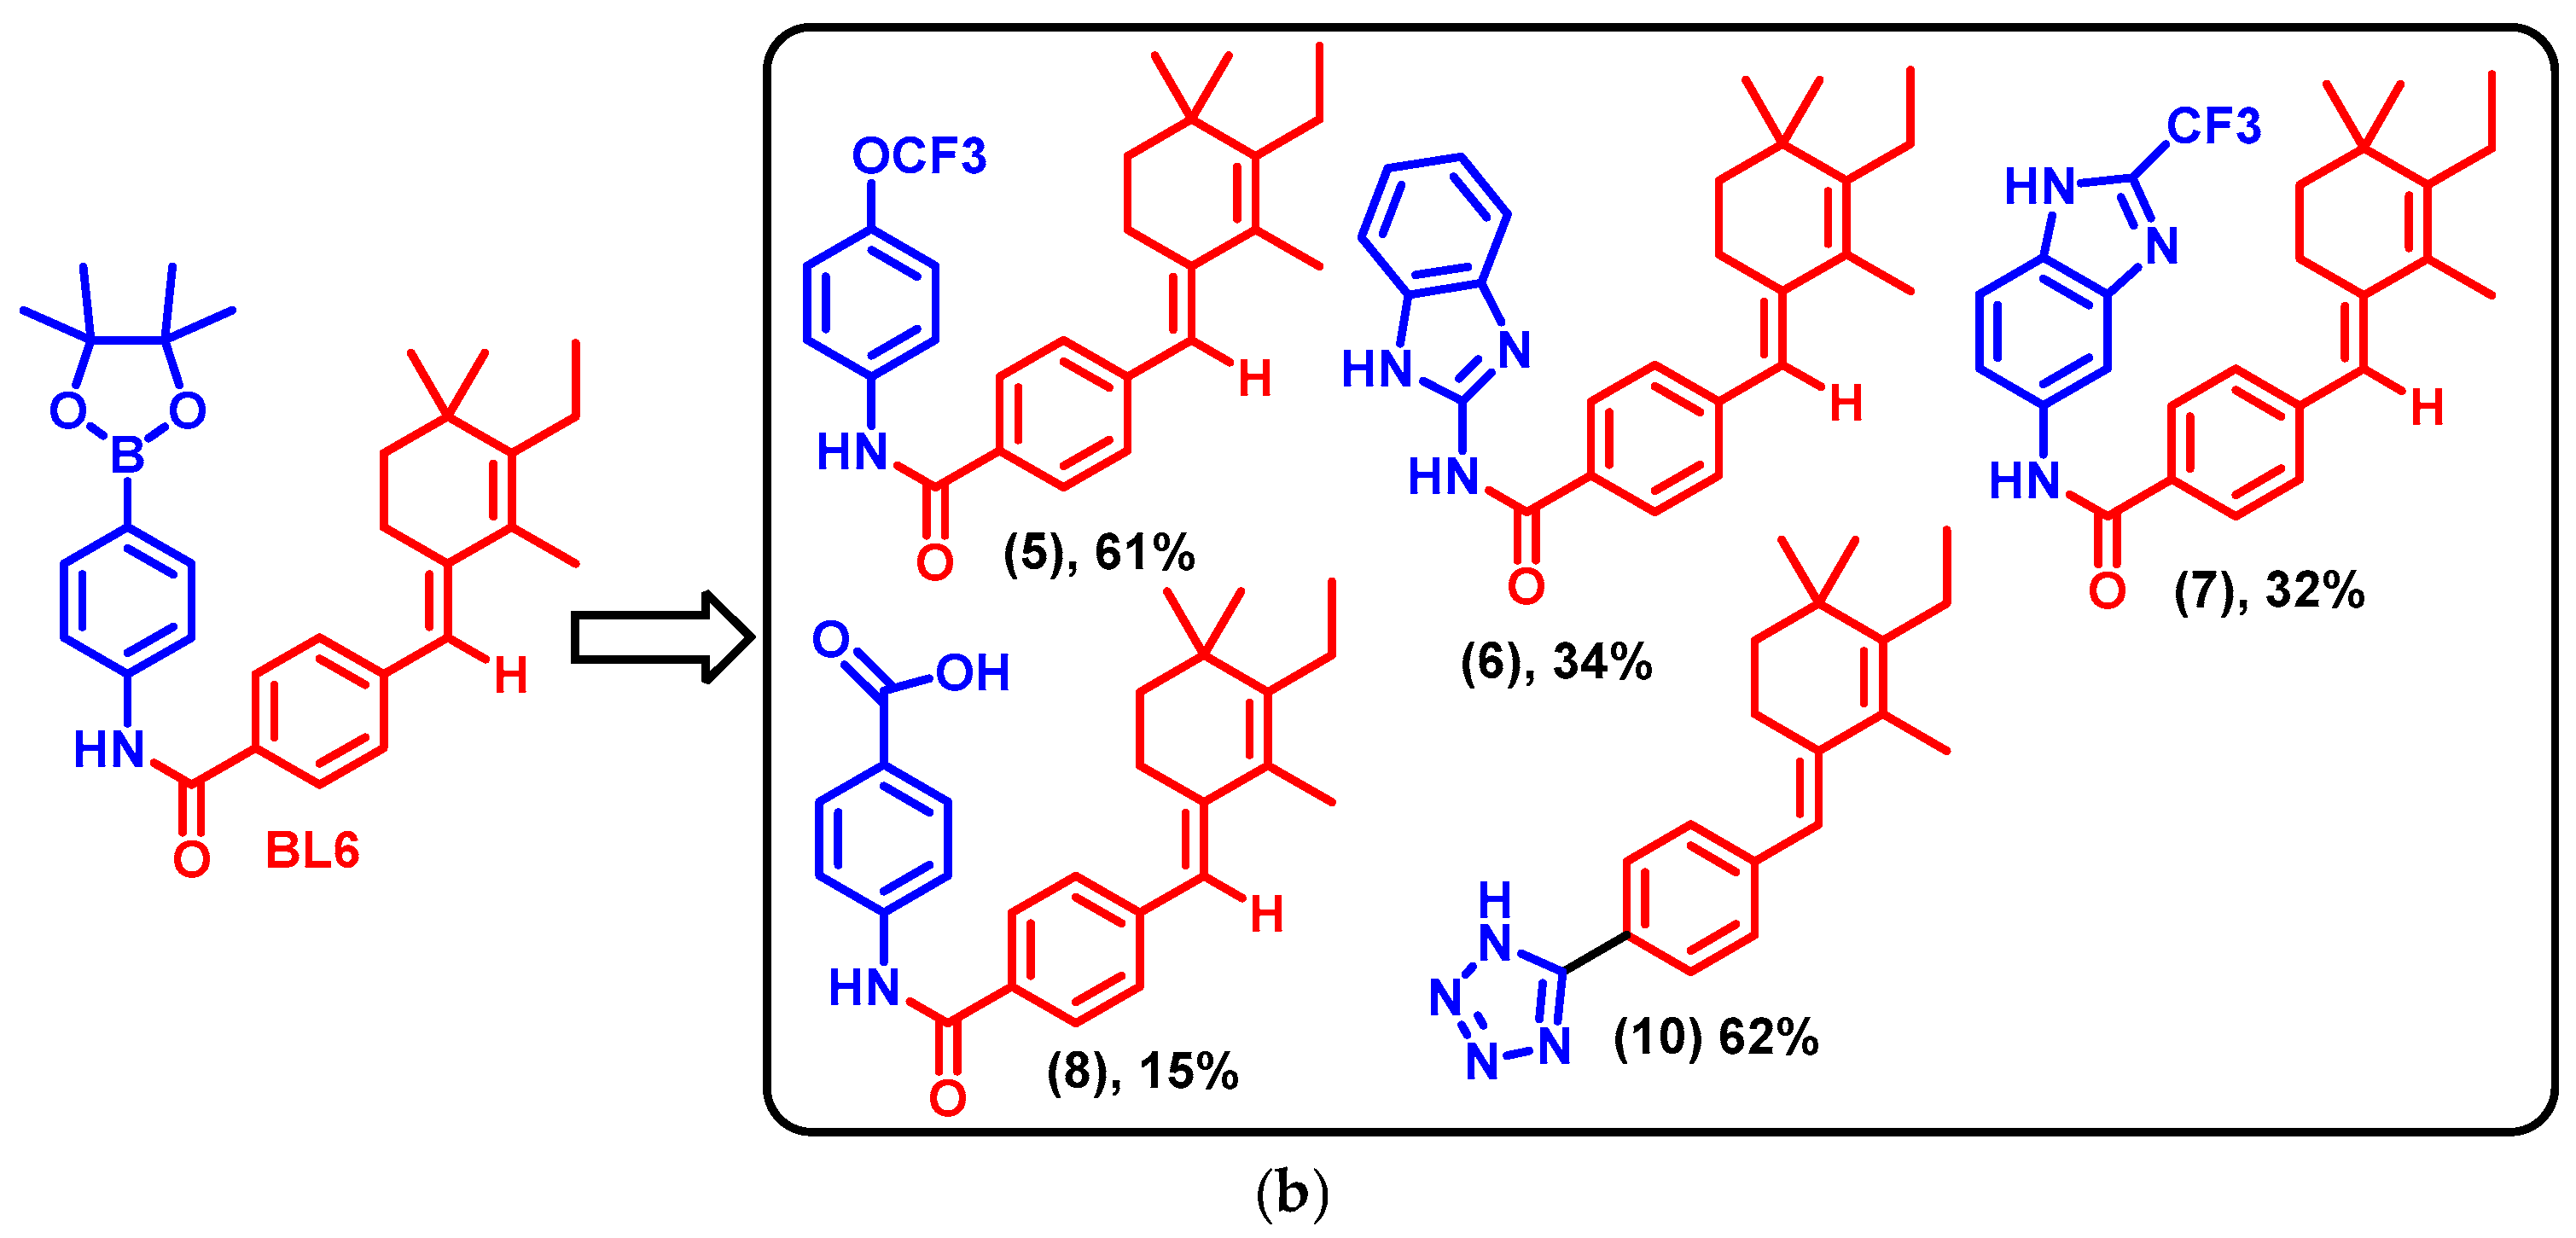
2.1. BL6 Synthesis
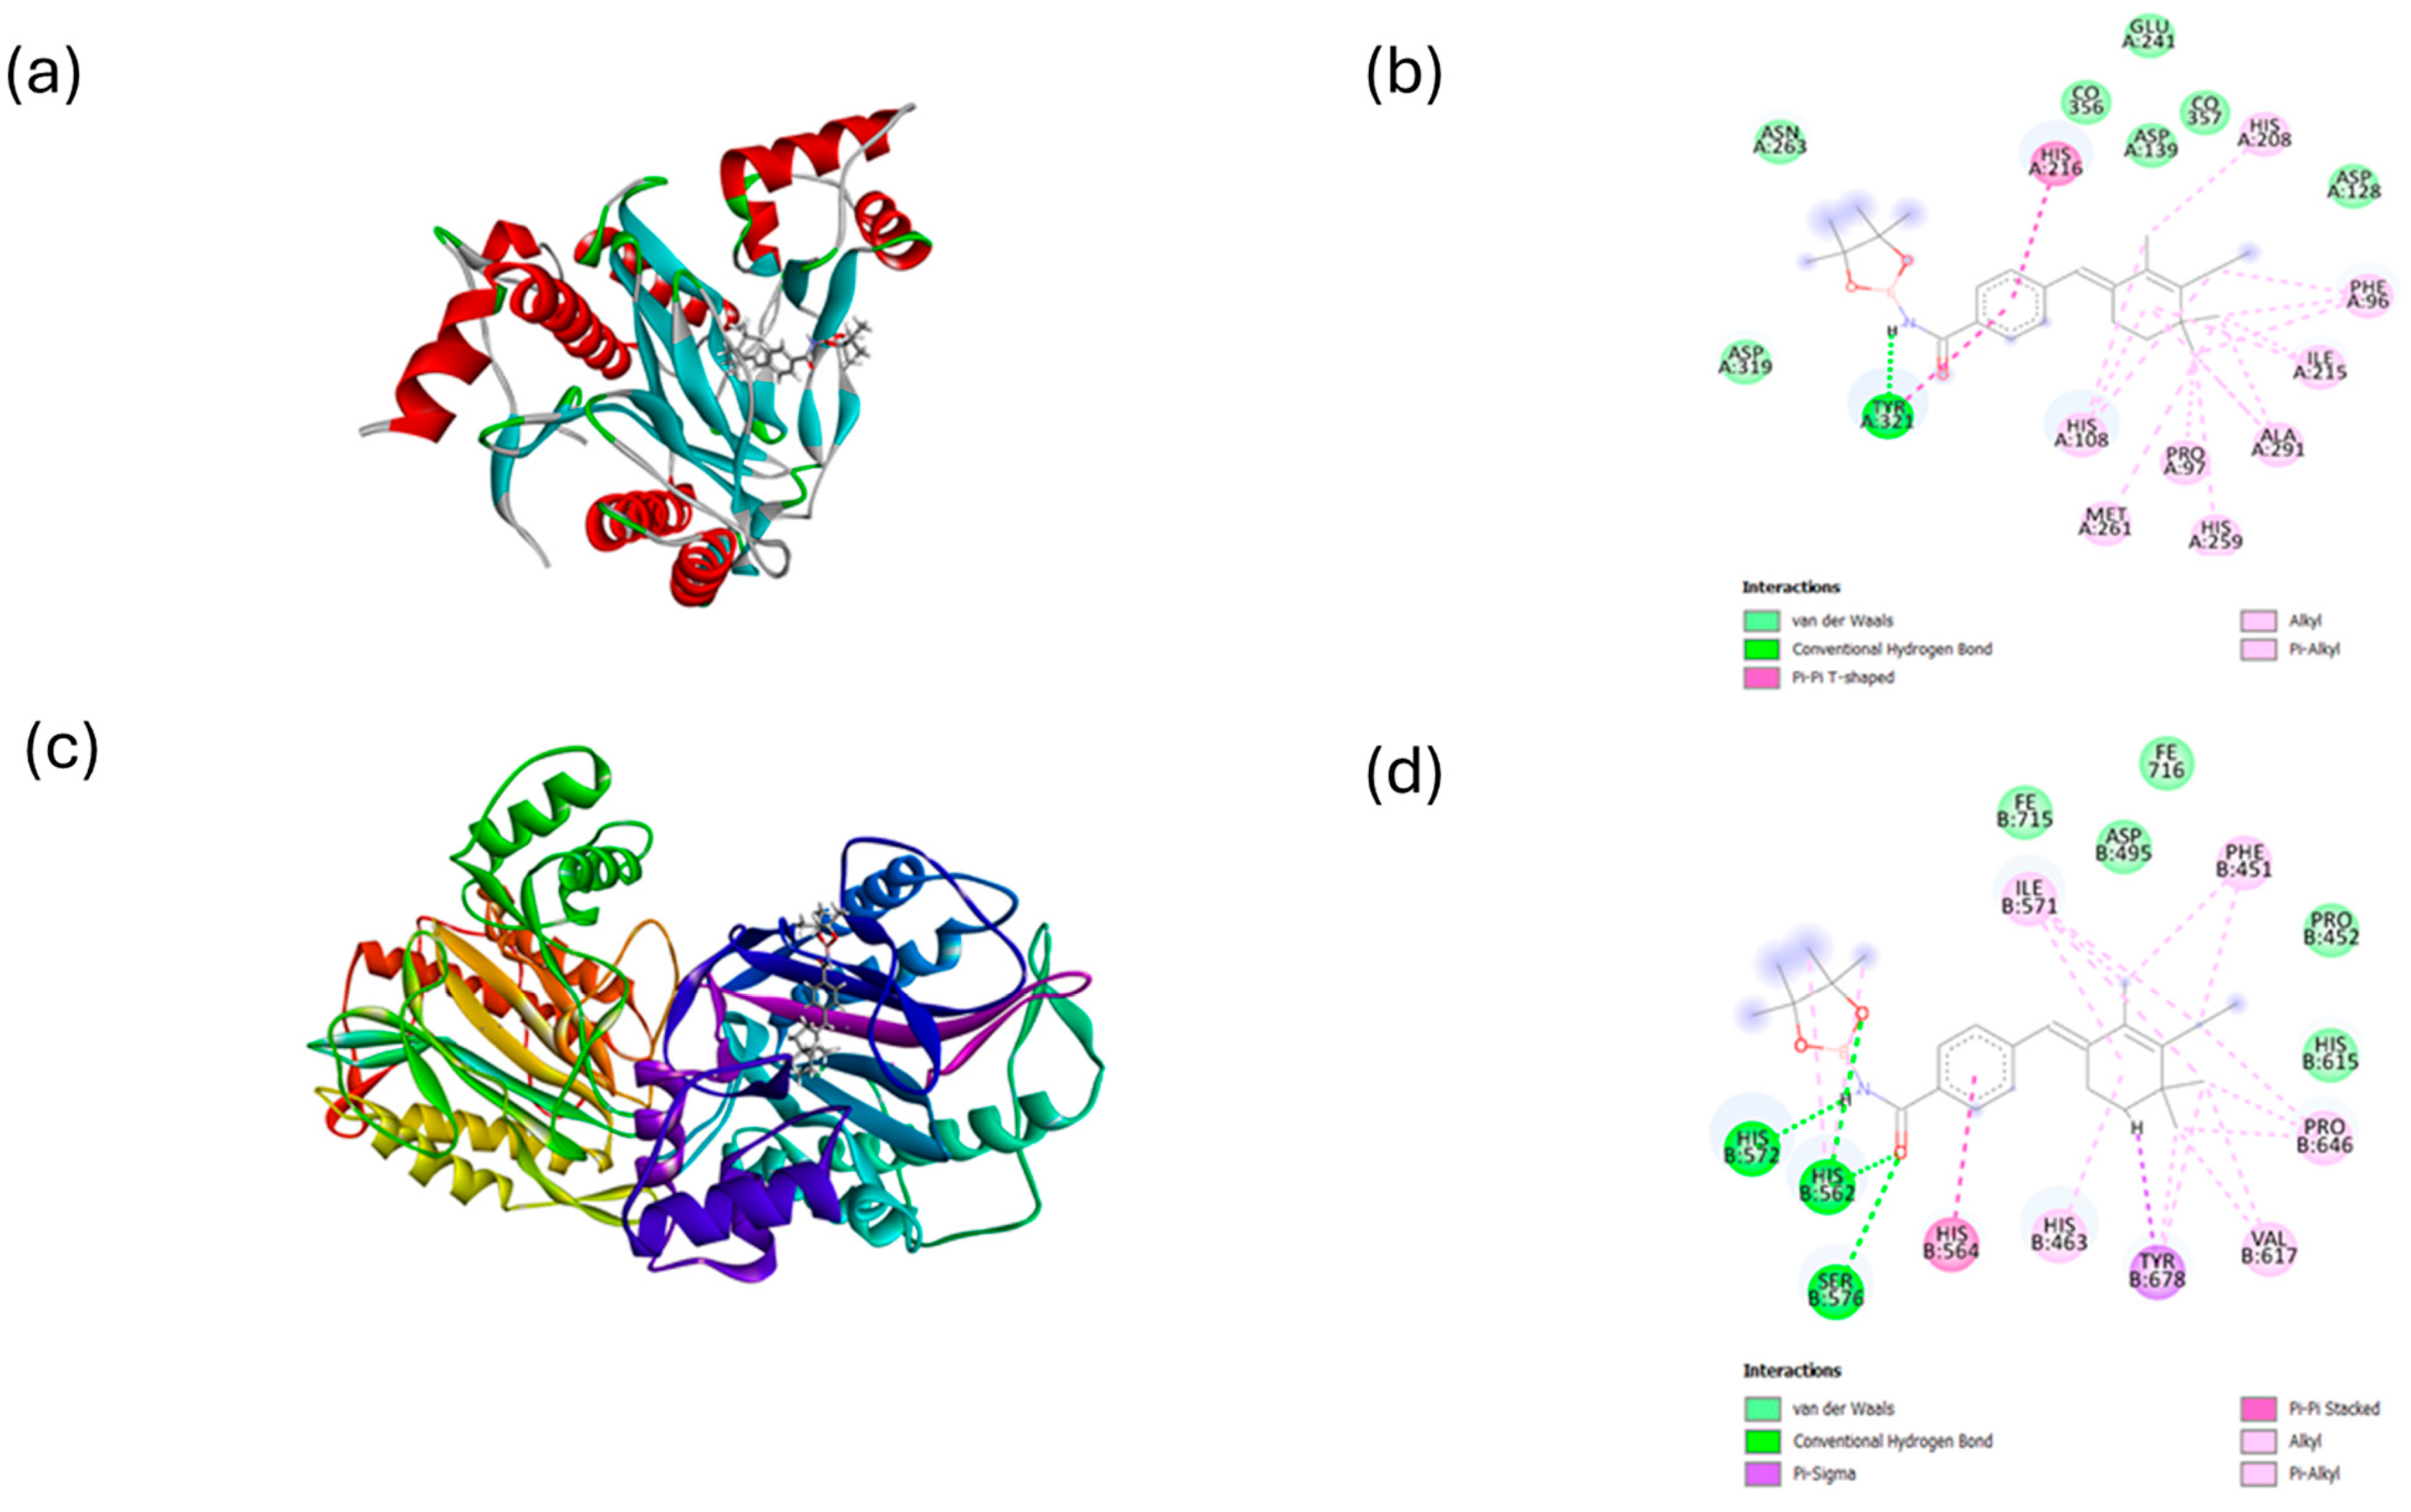
2.2. Molecular Docking
2.3. ADMET Properties
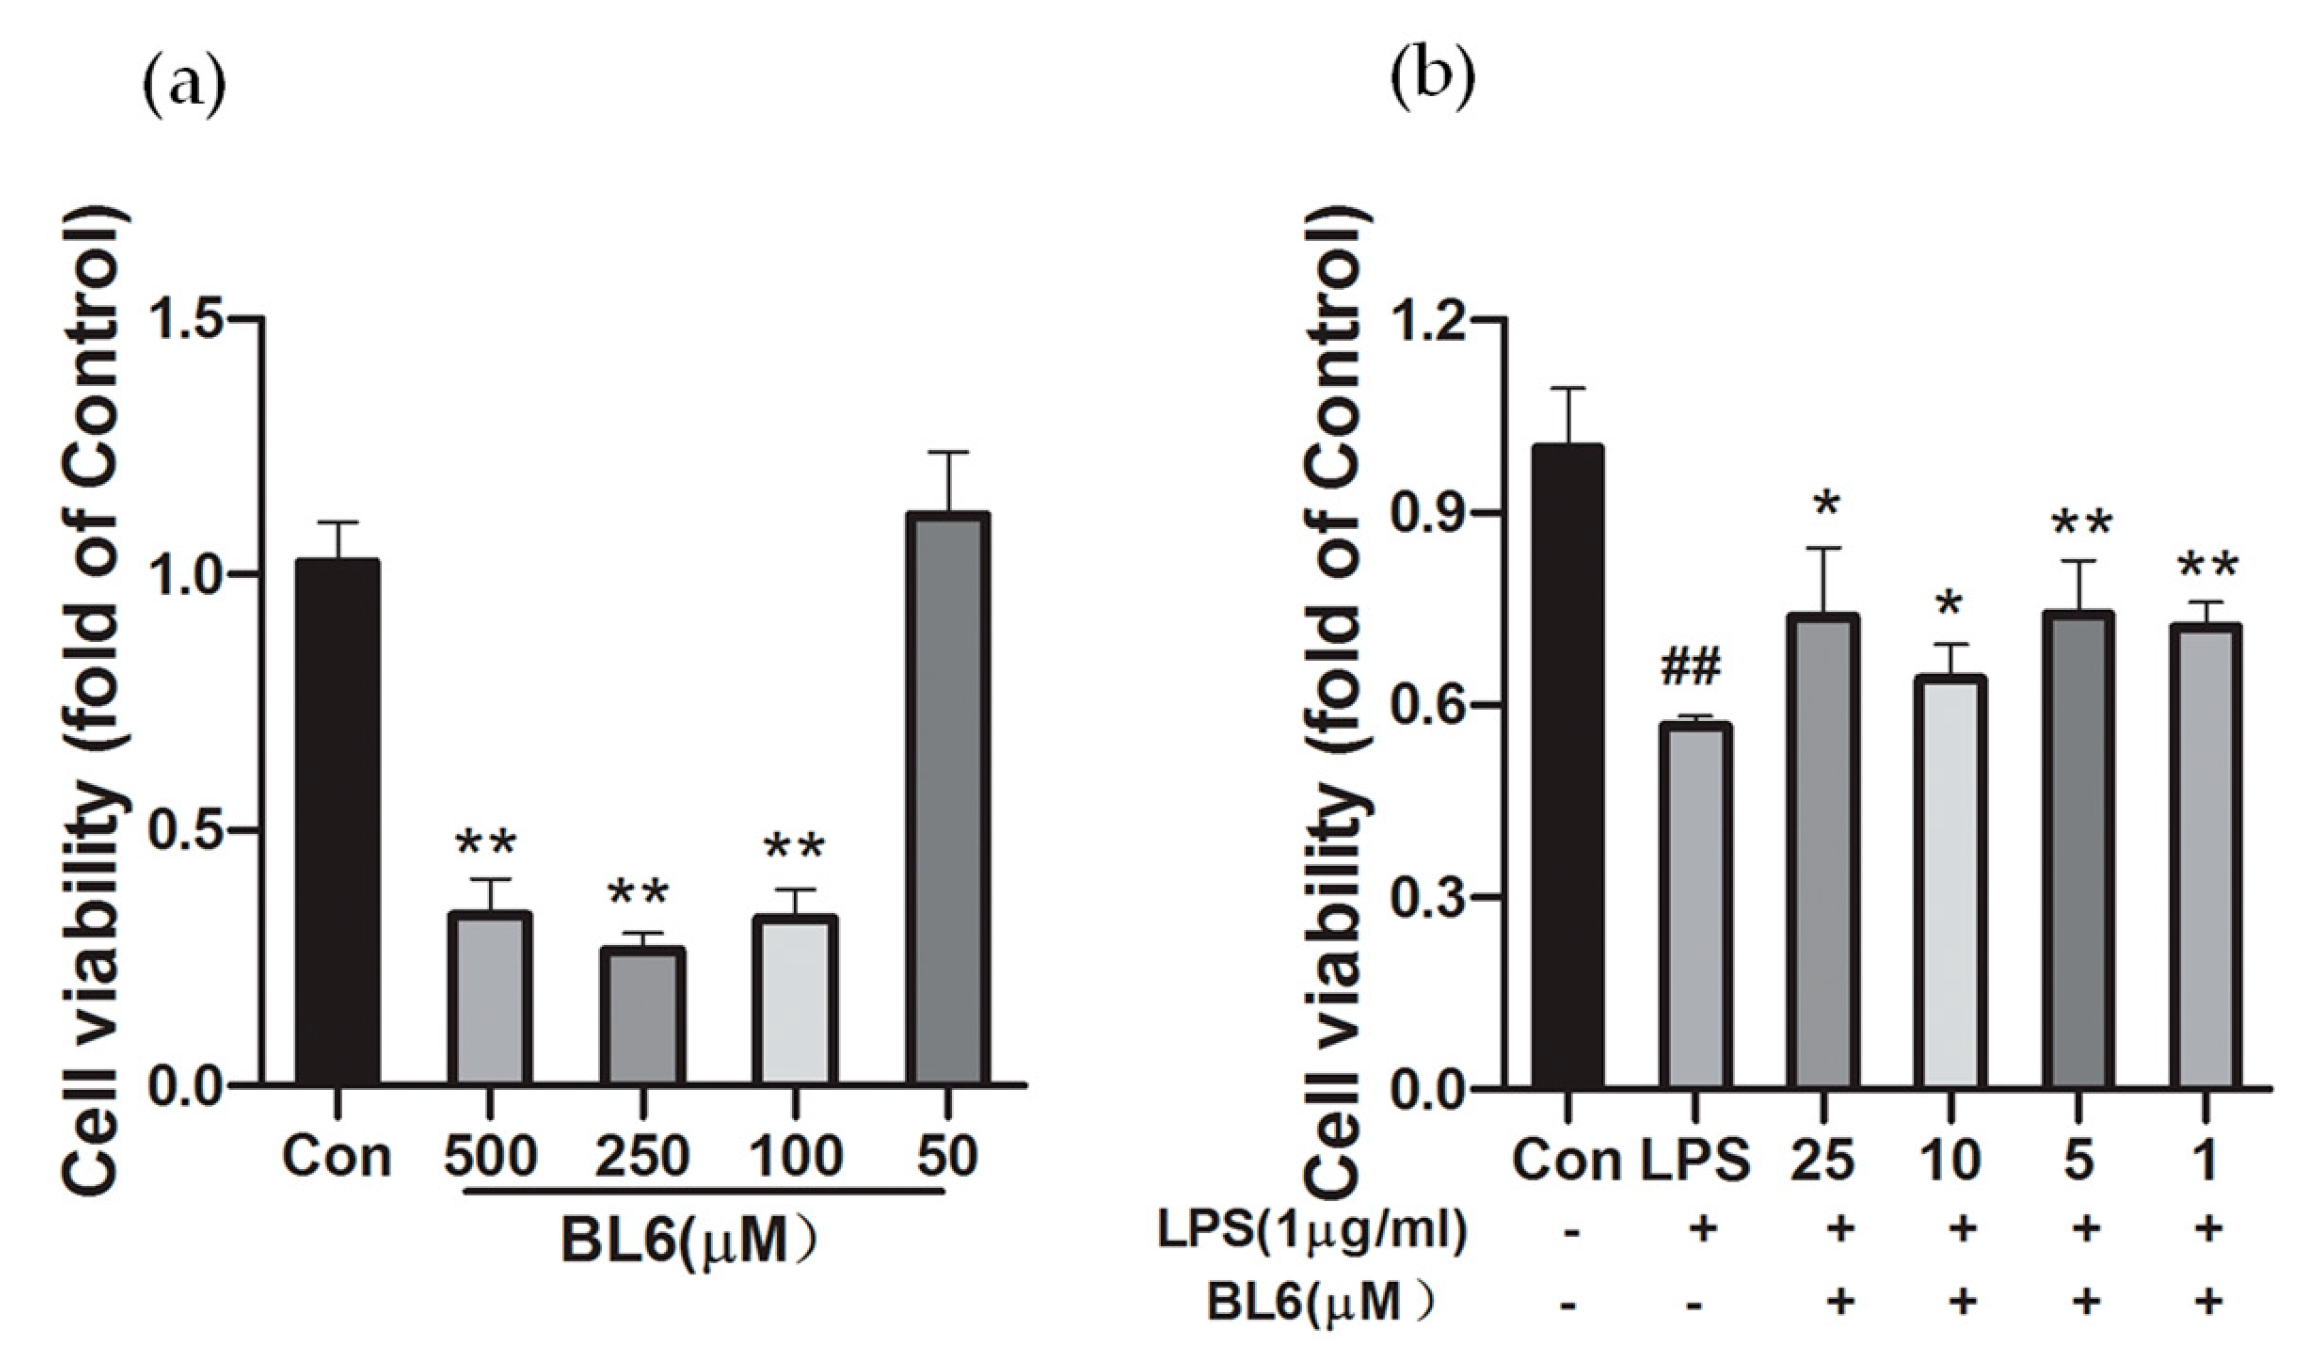
2.4. Effects of BL6 on the Cell Viability of SIM-A9 Cells Treated with a High Dose of LPS
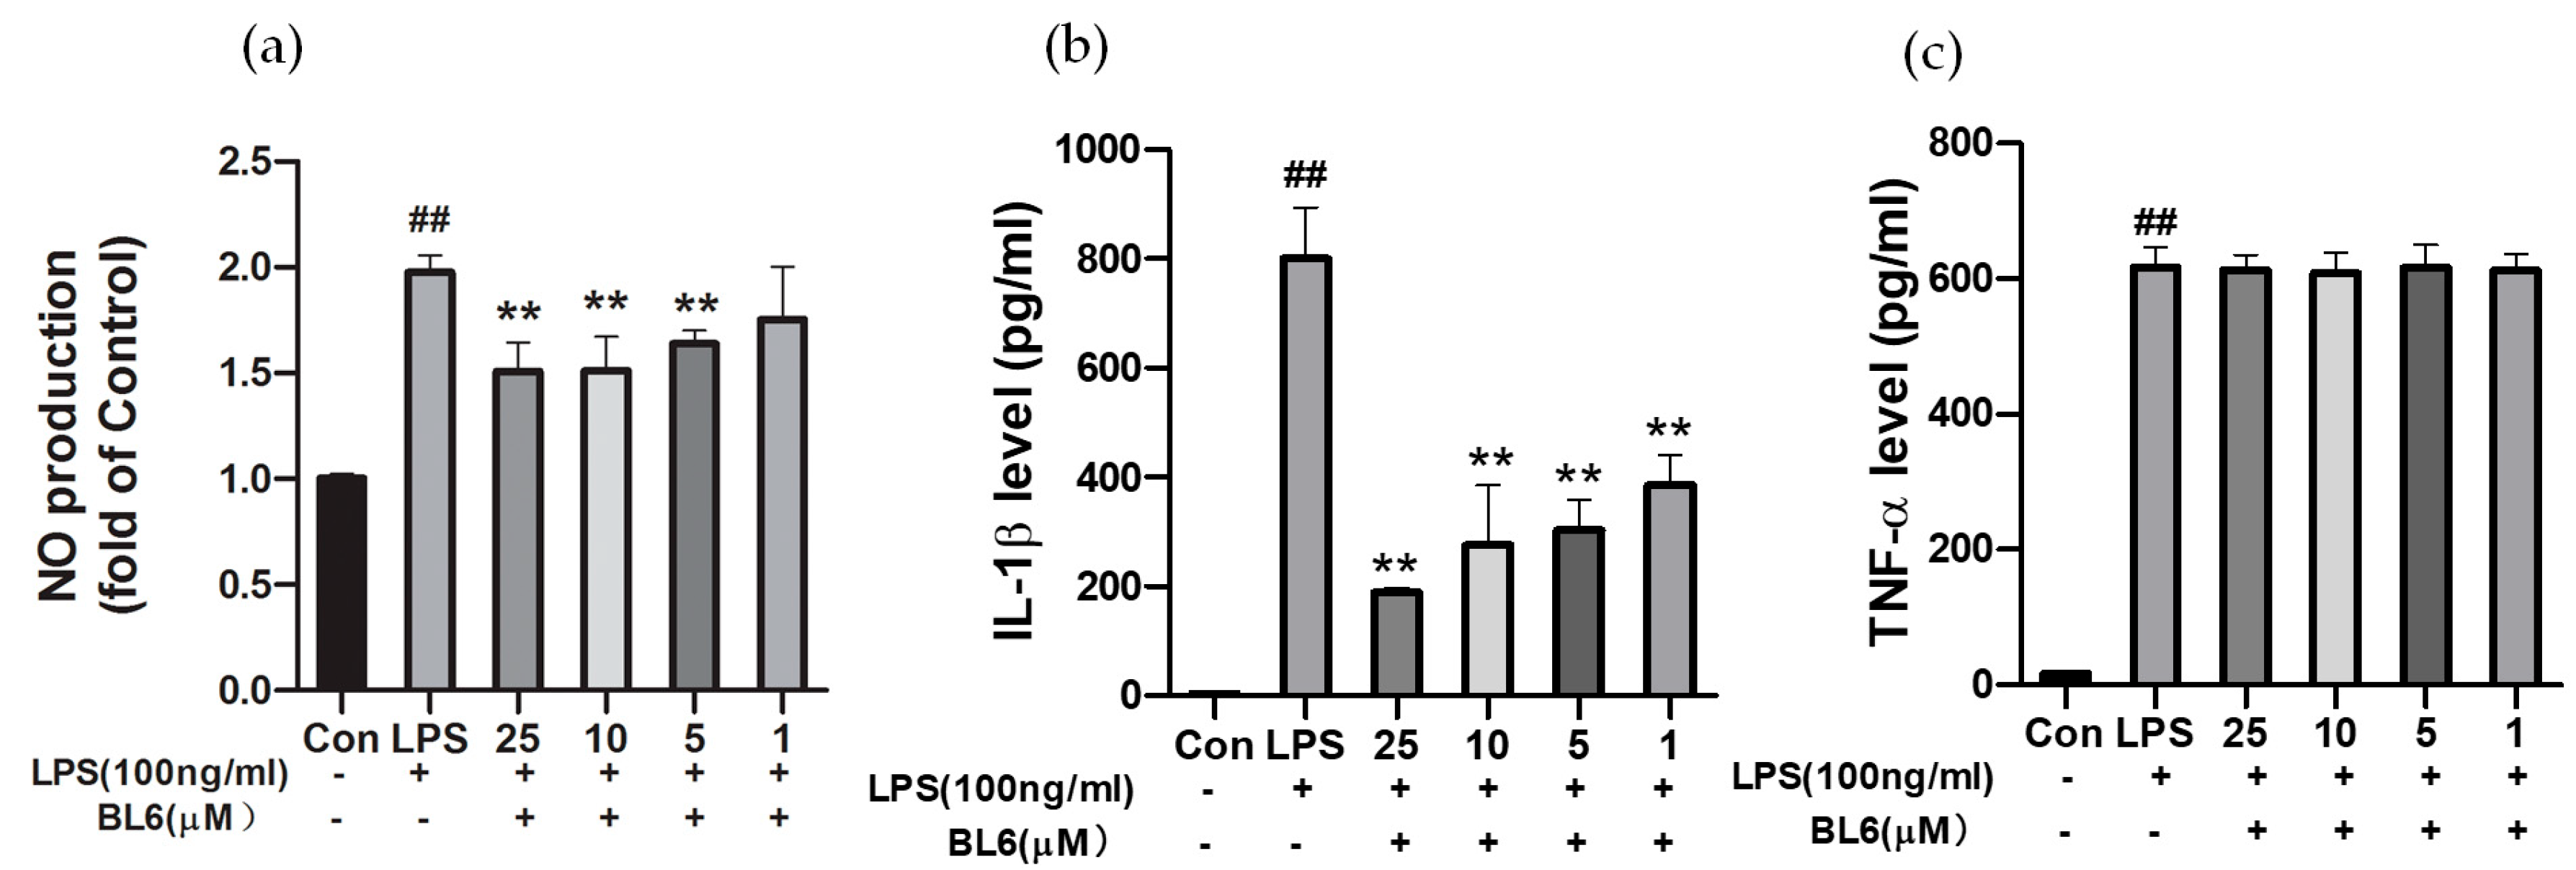
2.5. Effects of BL6 on NO Production and Inflammatory Cytokines Induced by LPS in SIM-A9 Cells
2.6. BL6 May Promote M1 to M2 Microglial Polarization in SIM-A9 Cells Stimulated by LPS
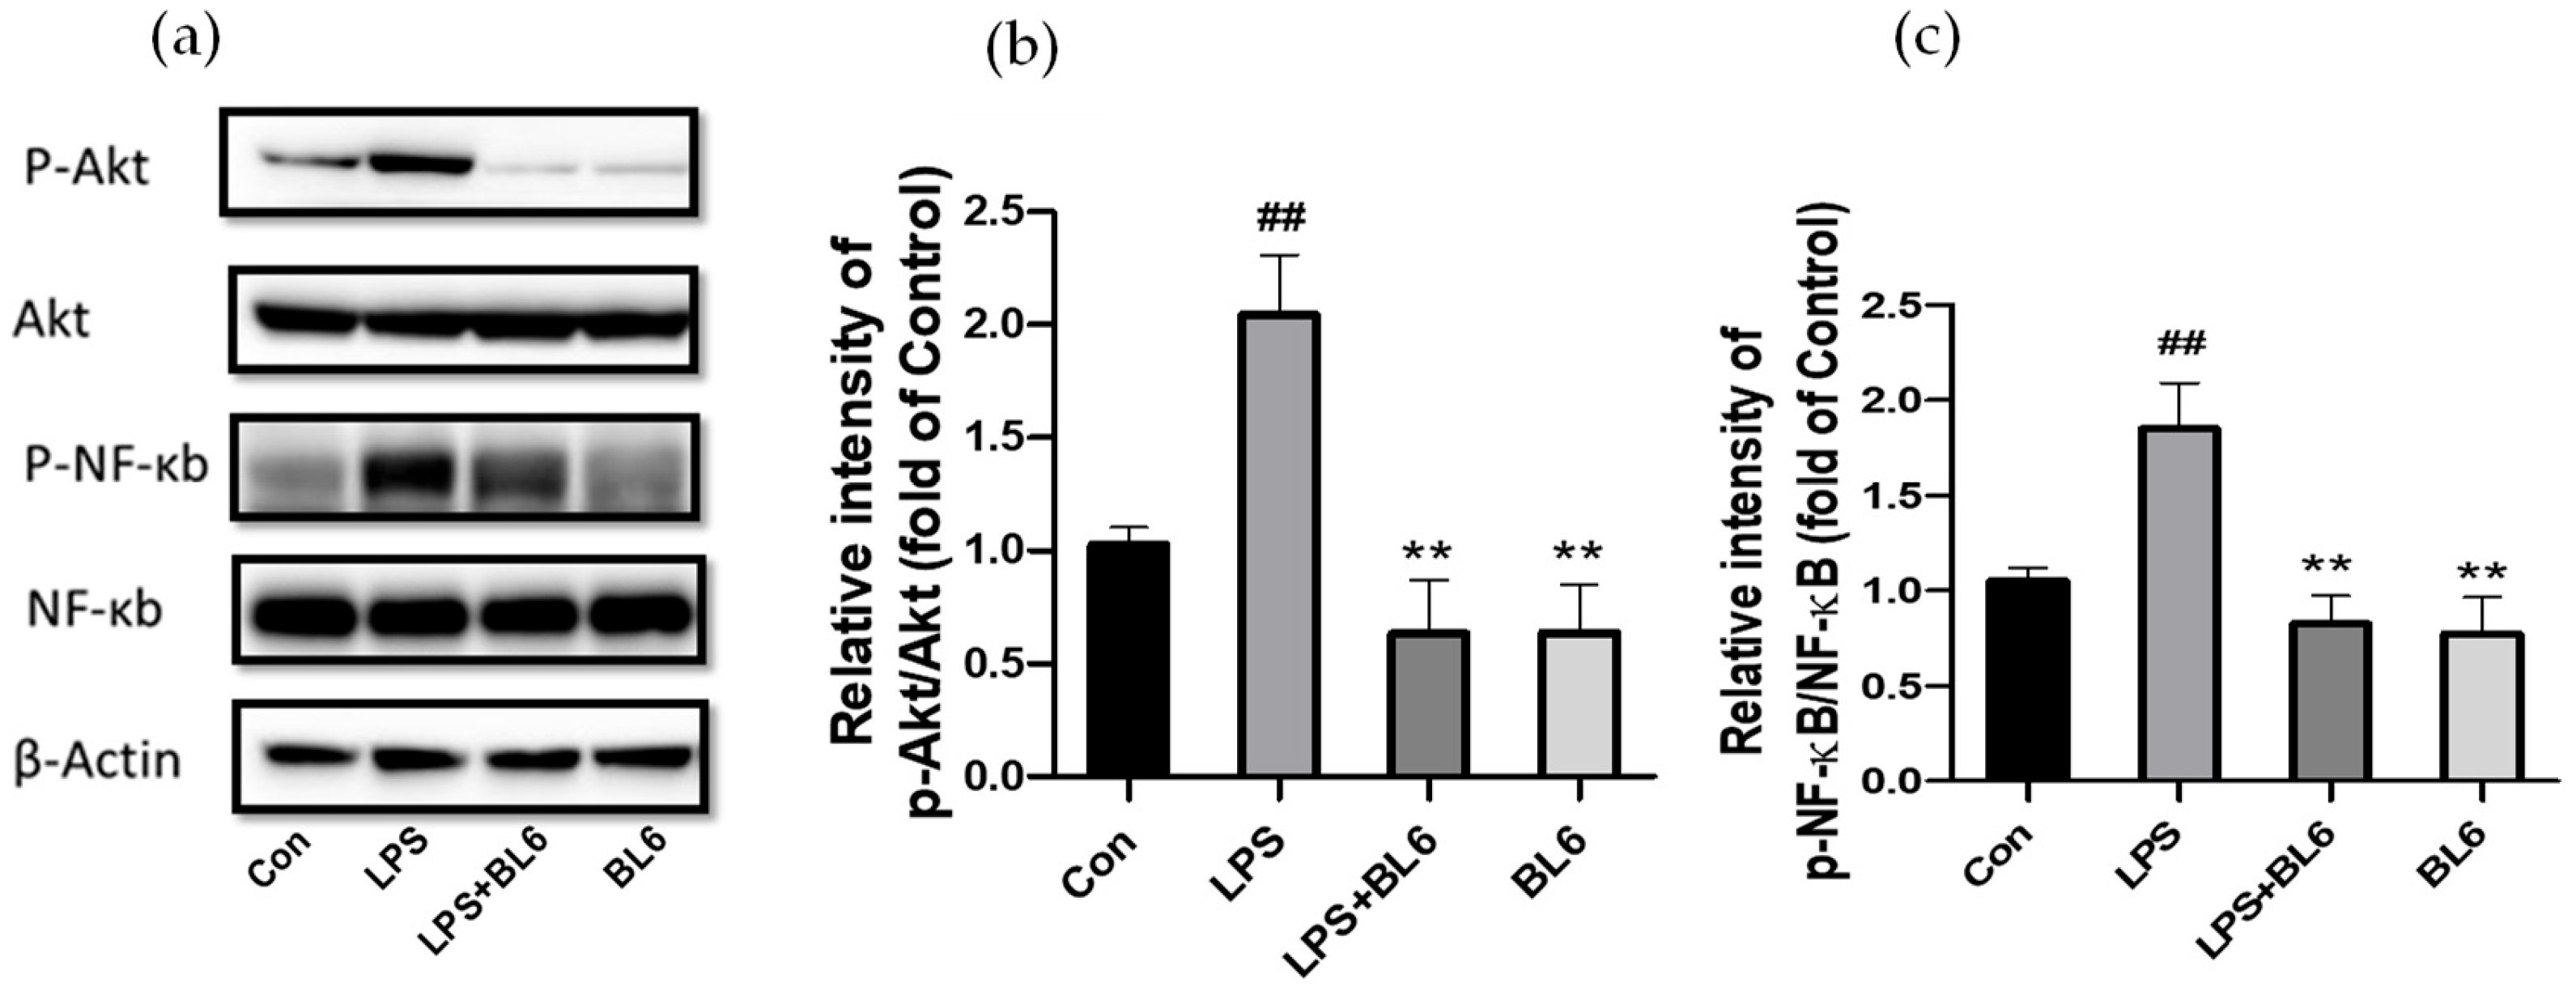
2.7. Involvement of the PI3K/Akt/NF-κB Pathway in the Anti-Inflammatory Effects of BL6
2.8. BL6 Had No Protective Effect on STZ-Induced Neuro-2a Cytotoxicity
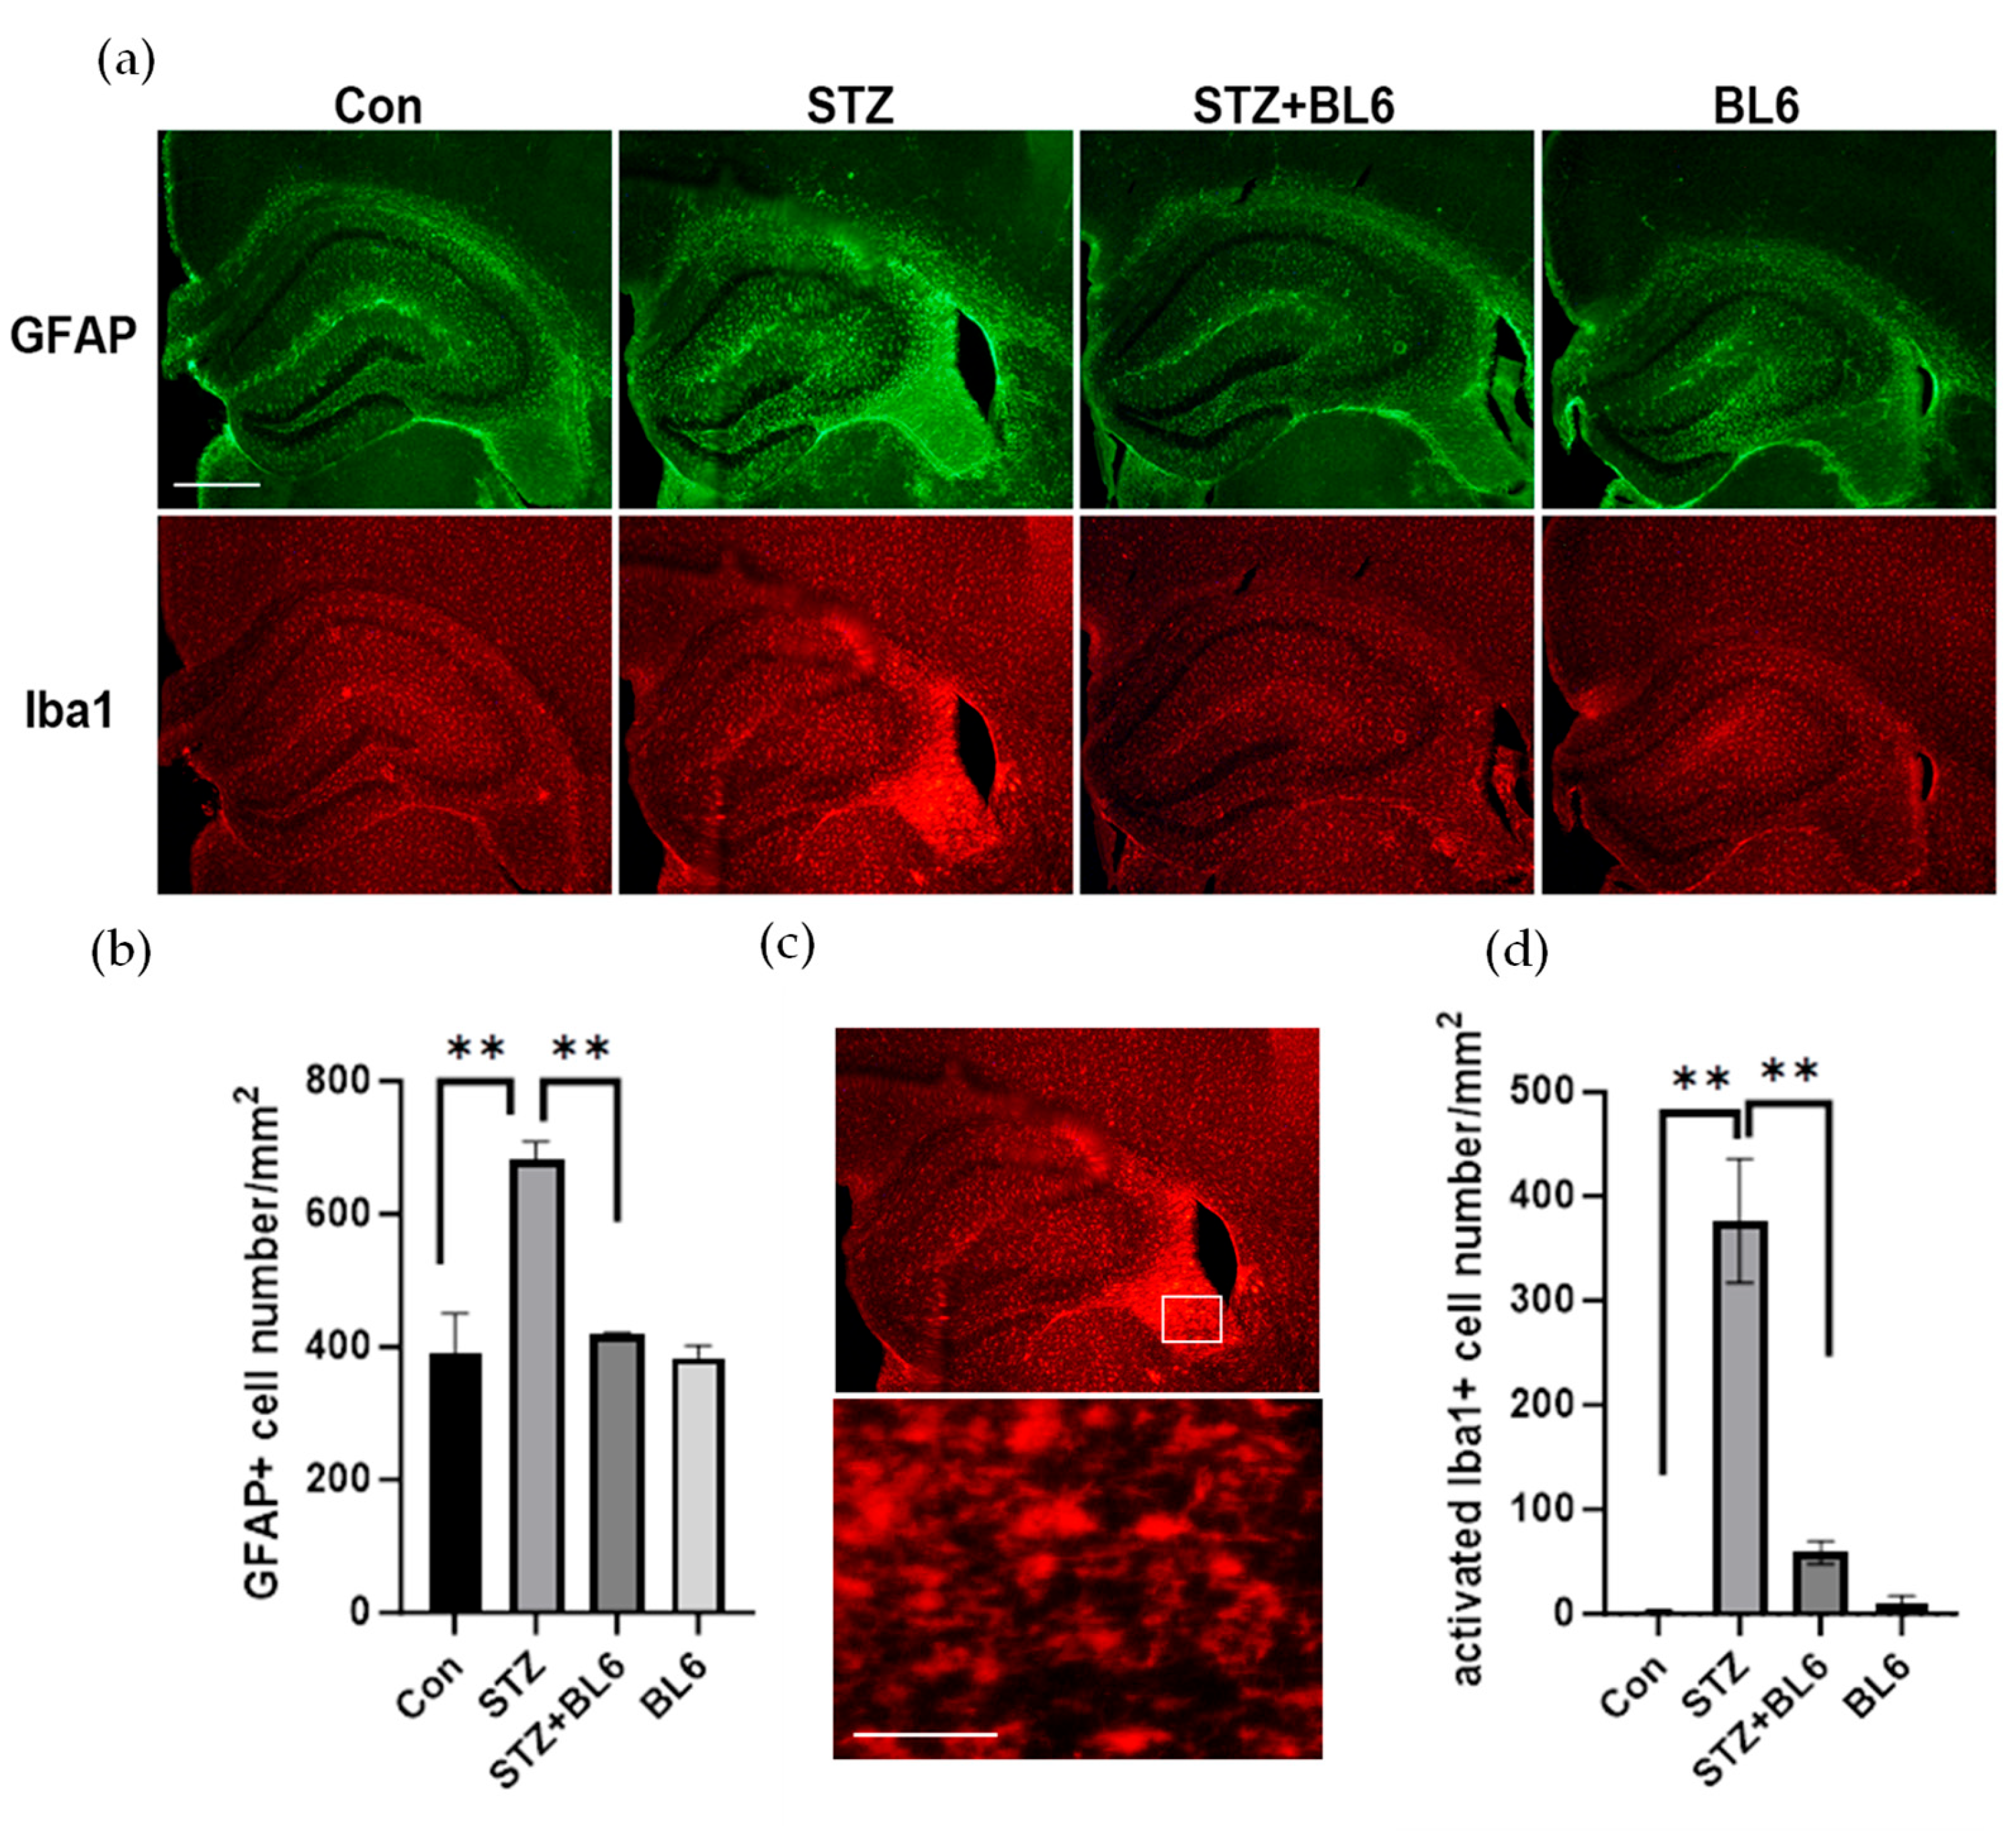
2.9. BL6 Reduced Icv-STZ-Induced Glial Activation in the Mouse Hippocampus
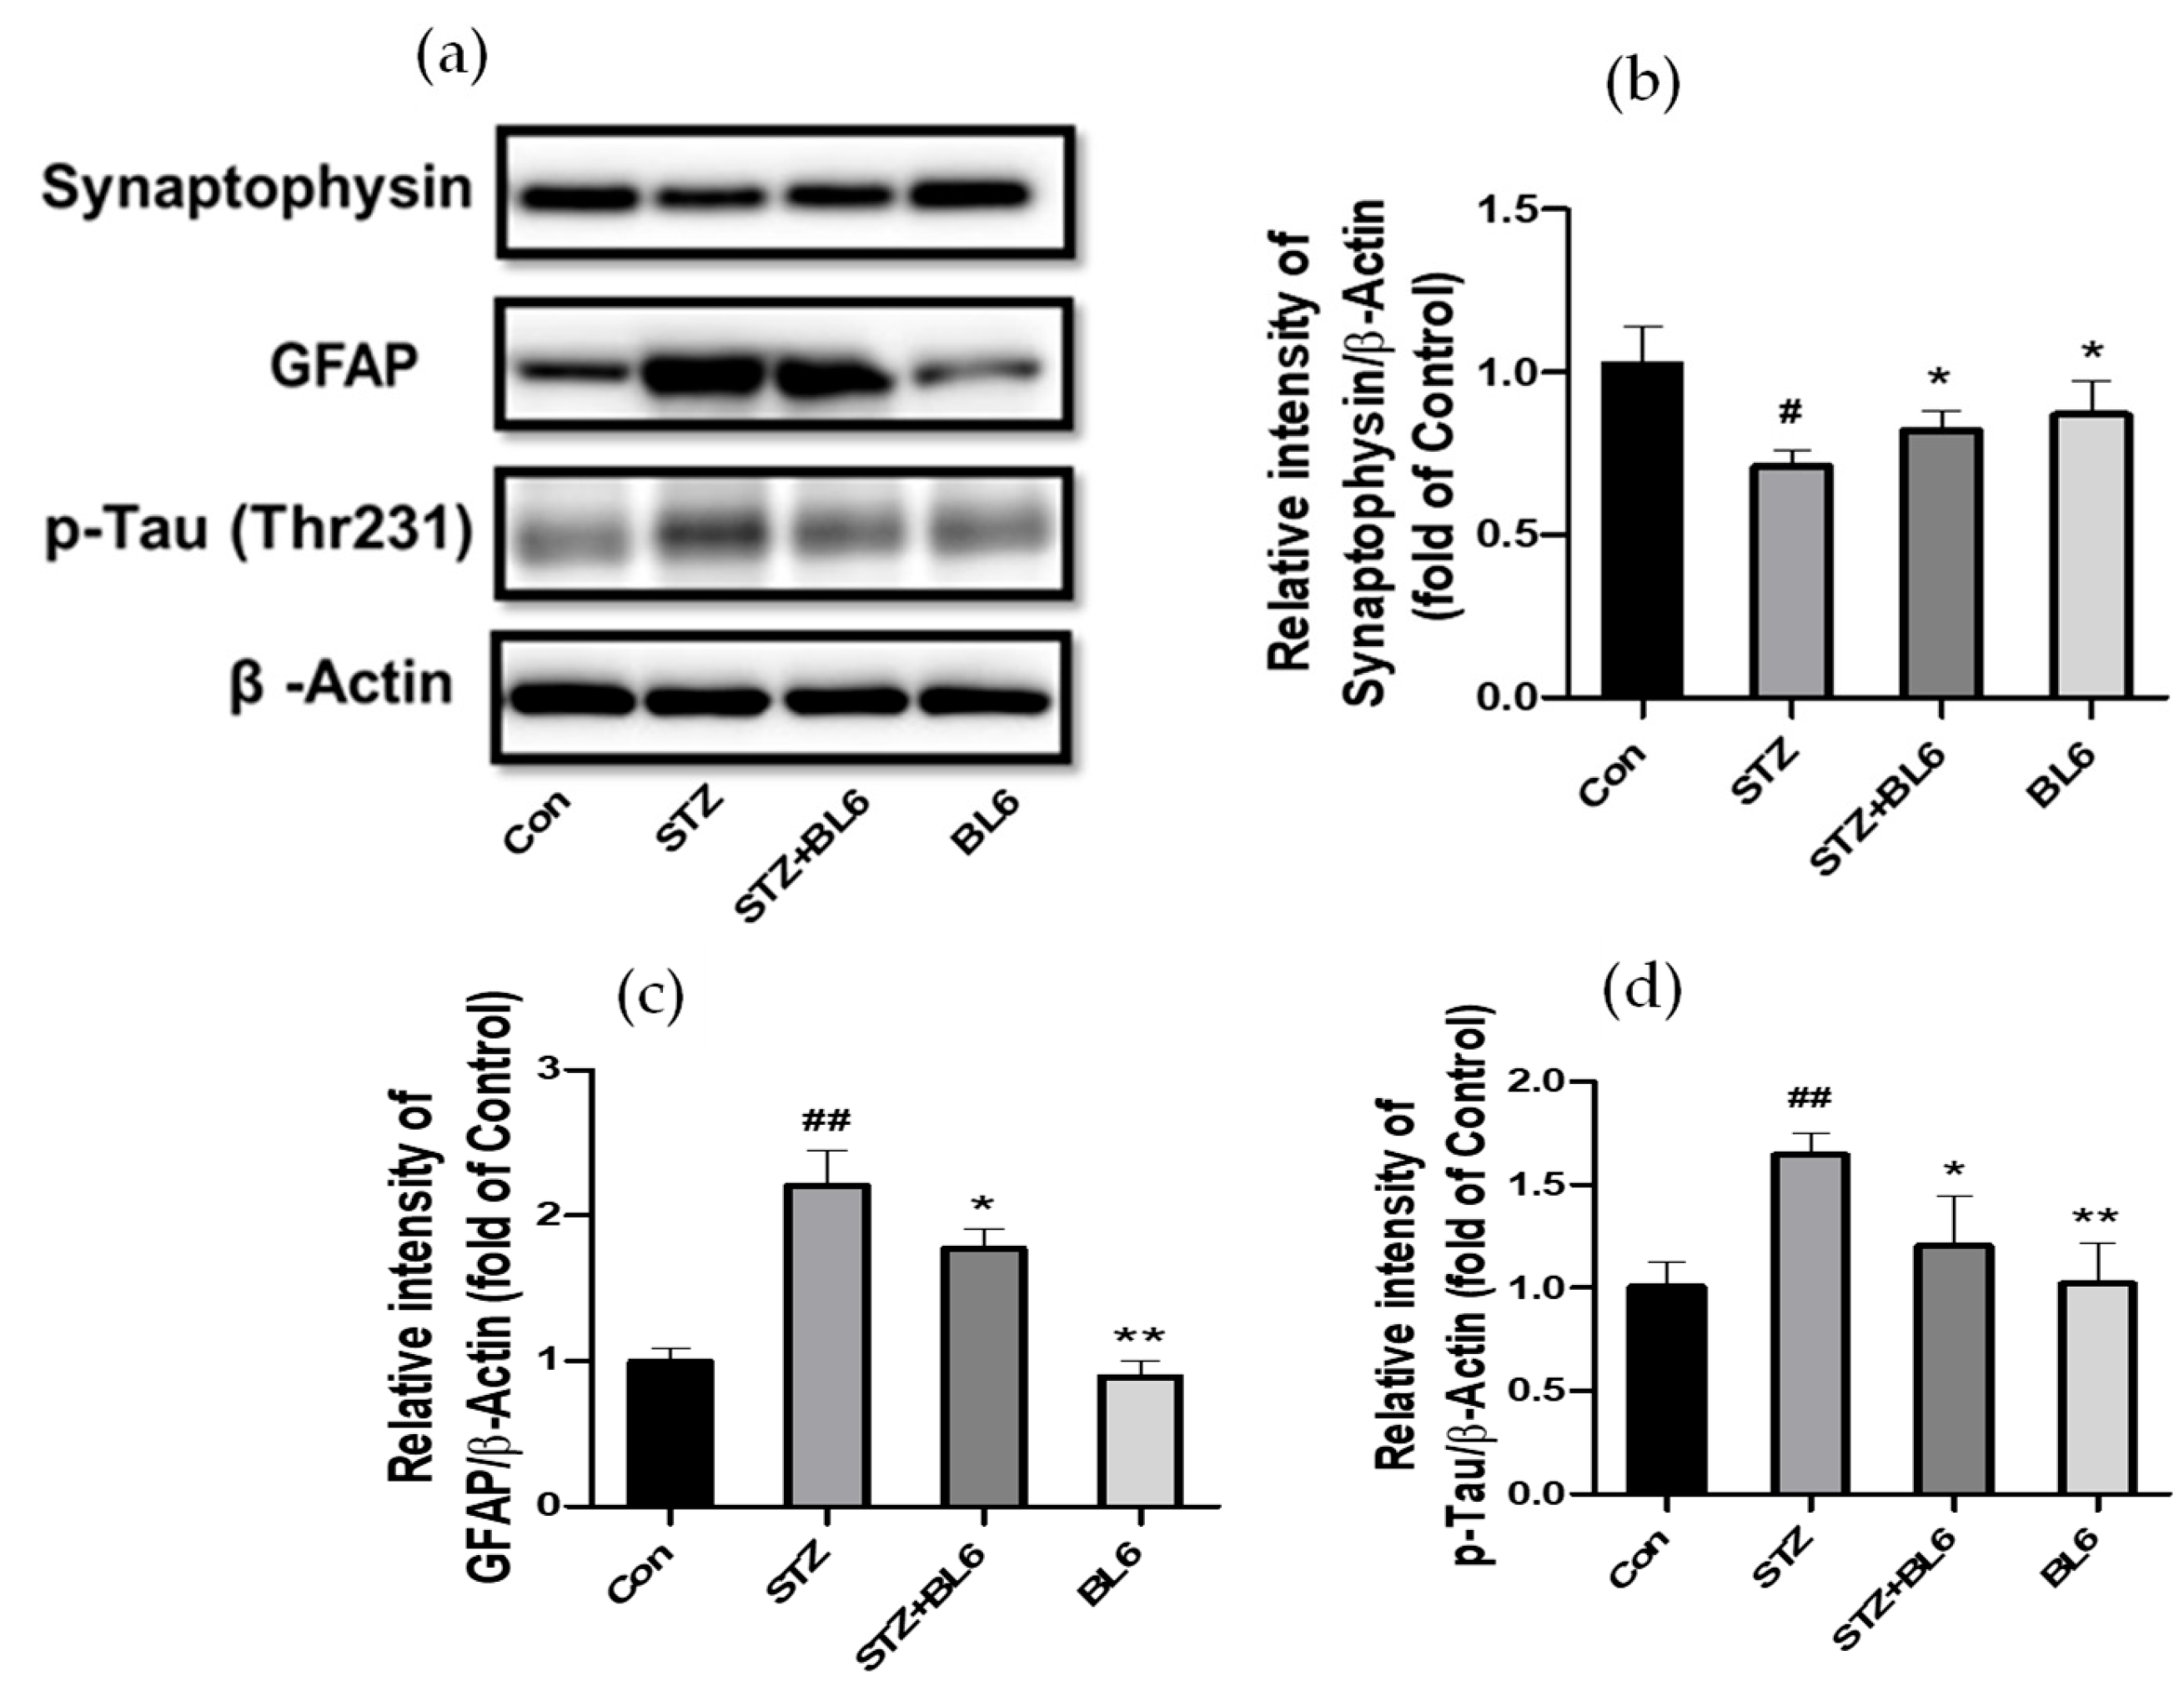
2.10. Effect of BL6 on GFAP, Synaptophysin, and p-Tau Levels in the Hippocampus of Icv-STZ-Treated Mice
3. Discussion
4. Materials and Methods
4.1. Synthesis of BL6
4.2. Cell Culture
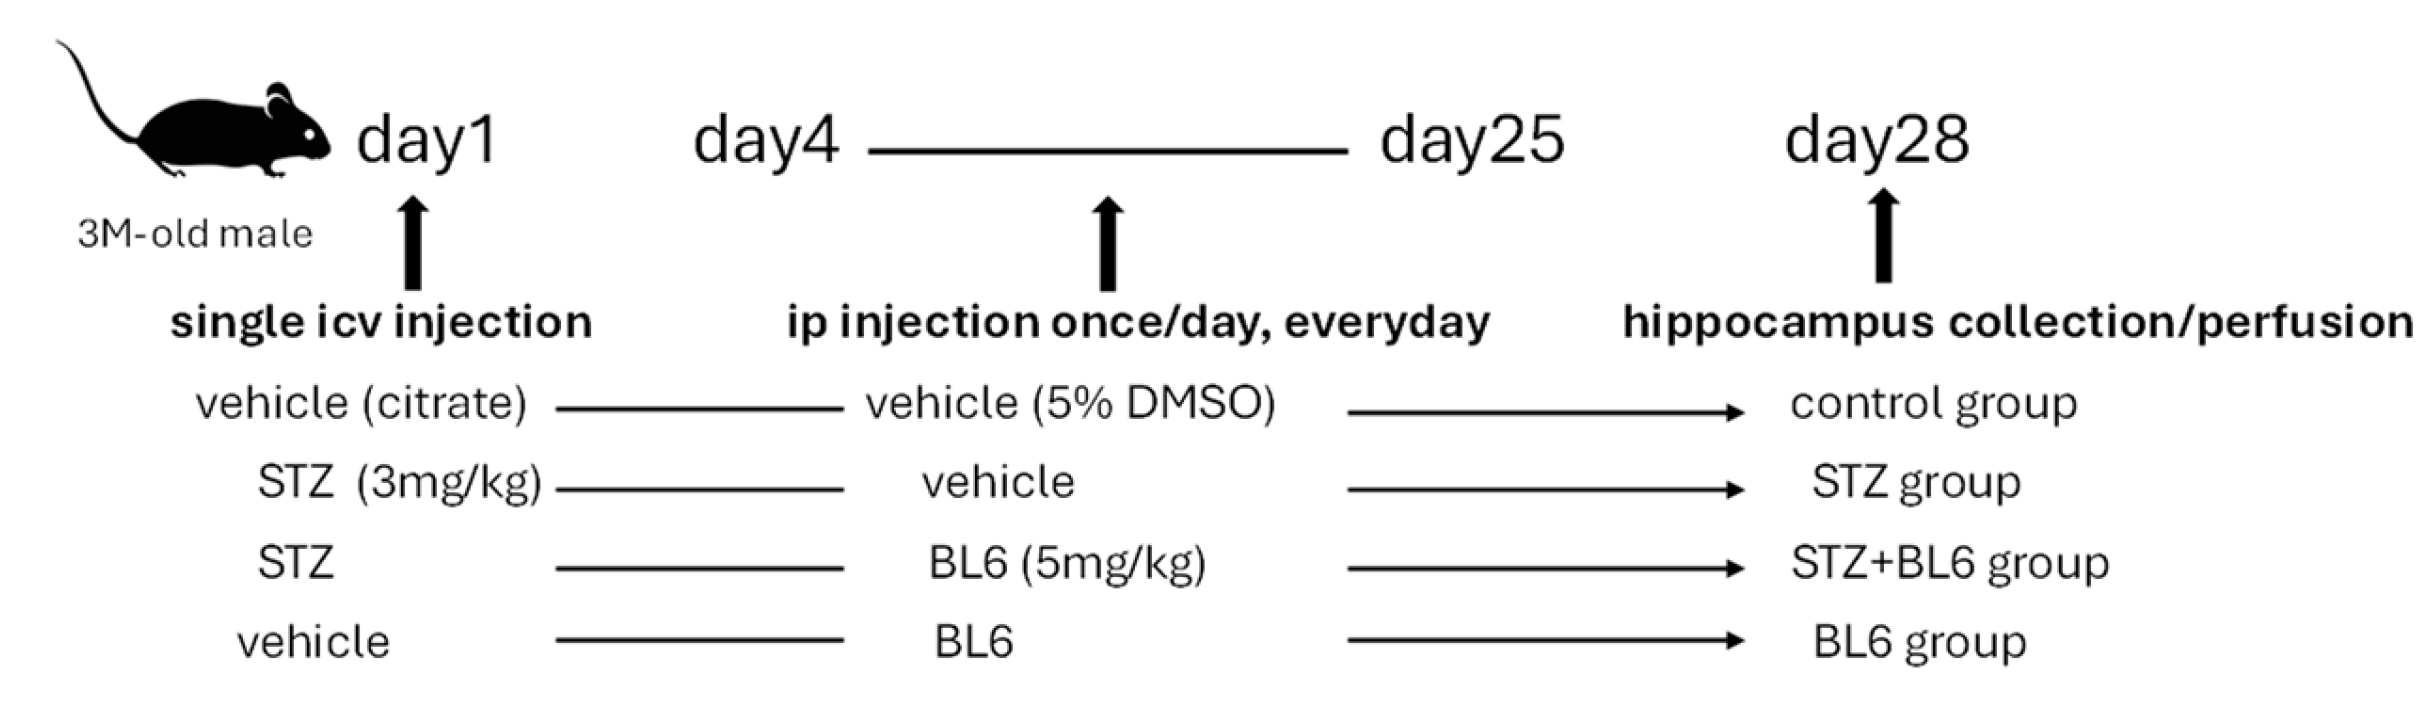
4.3. Preparation of the Icv-STZ Mouse Model and BL6 Administration
4.4. Cell Viability Detection
4.5. Nitric Oxide (NO) Detection
4.6. Inflammatory Cytokine Detection
4.7. Immunoblot
4.8. Immunofluorescence Staining
4.9. Statistical Analysis
4.10. Molecular Docking and ADMET Profiling
Supplementary Materials
Author Contributions
Funding
Institutional Review Board Statement
Data Availability Statement
Conflicts of Interest
References
- Jackson, R.; Hunter, T. Role of methionine in the initiation of haemoglobin synthesis. Nature 1970, 227, 672–676. [Google Scholar] [CrossRef] [PubMed]
- Winter, N.; Novatchkova, M.; Bachmair, A. Cellular Control of Protein Turnover via the Modification of the Amino Terminus. Int. J. Mol. Sci. 2021, 22, 3545. [Google Scholar] [CrossRef]
- Arfin, S.M.; Kendall, R.L.; Hall, L.; Weaver, L.H.; Stewart, A.E.; Matthews, B.W.; Bradshaw, R.A. Eukaryotic methionyl aminopeptidases: Two classes of cobalt-dependent enzymes. Proc. Natl. Acad. Sci. USA 1995, 92, 7714–7718. [Google Scholar] [CrossRef]
- Vetro, J.A.; Chang, Y.H. Yeast methionine aminopeptidase type 1 is ribosome-associated and requires its N-terminal zinc finger domain for normal function in vivo. J. Cell Biochem. 2002, 85, 678–688. [Google Scholar] [CrossRef]
- Vetro, J.A.; Dummitt, B.; Micka, W.S.; Chang, Y.H. Evidence of a dominant negative mutant of yeast methionine aminopeptidase type 2 in Saccharomyces cerevisiae. J. Cell Biochem. 2005, 94, 656–668. [Google Scholar] [CrossRef]
- Datta, R.; Choudhury, P.; Bhattacharya, M.; Soto Leon, F.; Zhou, Y.; Datta, B. Protection of translation initiation factor eIF2 phosphorylation correlates with eIF2-associated glycoprotein p67 levels and requires the lysine-rich domain I of p67. Biochimie 2001, 83, 919–931. [Google Scholar] [CrossRef]
- Ingber, D.; Fujita, T.; Kishimoto, S.; Sudo, K.; Kanamaru, T.; Brem, H.; Folkman, J. Synthetic analogues of fumagillin that inhibit angiogenesis and suppress tumour growth. Nature 1990, 348, 555–557. [Google Scholar] [CrossRef]
- Griffith, E.C.; Su, Z.; Turk, B.E.; Chen, S.; Chang, Y.H.; Wu, Z.; Biemann, K.; Liu, J.O. Methionine aminopeptidase (type 2) is the common target for angiogenesis inhibitors AGM-1470 and ovalicin. Chem. Biol. 1997, 4, 461–471. [Google Scholar] [CrossRef]
- Sin, N.; Meng, L.; Wang, M.Q.; Wen, J.J.; Bornmann, W.G.; Crews, C.M. The anti-angiogenic agent fumagillin covalently binds and inhibits the methionine aminopeptidase, MetAP-2. Proc. Natl. Acad. Sci. USA 1997, 94, 6099–6103. [Google Scholar] [CrossRef]
- Griffith, E.C.; Su, Z.; Niwayama, S.; Ramsay, C.A.; Chang, Y.H.; Liu, J.O. Molecular recognition of angiogenesis inhibitors fumagillin and ovalicin by methionine aminopeptidase 2. Proc. Natl. Acad. Sci. USA 1998, 95, 15183–15188. [Google Scholar] [CrossRef]
- Goya Grocin, A.; Kallemeijn, W.W.; Tate, E.W. Targeting methionine aminopeptidase 2 in cancer, obesity, and autoimmunity. Trends Pharmacol. Sci. 2021, 42, 870–882. [Google Scholar] [CrossRef] [PubMed]
- Hughes, T.E.; Kim, D.D.; Marjason, J.; Proietto, J.; Whitehead, J.P.; Vath, J.E. Ascending dose-controlled trial of beloranib, a novel obesity treatment for safety, tolerability, and weight loss in obese women. Obesity 2013, 21, 1782–1788. [Google Scholar] [CrossRef]
- Kim, D.D.; Krishnarajah, J.; Lillioja, S.; de Looze, F.; Marjason, J.; Proietto, J.; Shakib, S.; Stuckey, B.G.A.; Vath, J.E.; Hughes, T.E. Efficacy and safety of beloranib for weight loss in obese adults: A randomized controlled trial. Diabetes Obes. Metab. 2015, 17, 566–572. [Google Scholar] [CrossRef] [PubMed]
- Wentworth, J.M.; Colman, P.G.; Zafgen Study Group. The methionine aminopeptidase 2 inhibitor ZGN-1061 improves glucose control and weight in overweight and obese individuals with type 2 diabetes: A randomized, placebo-controlled trial. Diabetes Obes. Metab. 2020, 22, 1215–1219. [Google Scholar] [CrossRef] [PubMed]
- Siddik, M.A.B.; Das, B.C.; Weiss, L.; Dhurandhar, N.V.; Hegde, V. A MetAP2 inhibitor blocks adipogenesis, yet improves glucose uptake in cells. Adipocyte 2019, 8, 240–253. [Google Scholar] [CrossRef]
- An, J.; Wang, L.; Patnode, M.L.; Ridaura, V.K.; Haldeman, J.M.; Stevens, R.D.; Ilkayeva, O.; Bain, J.R.; Muehlbauer, M.J.; Glynn, E.L.; et al. Physiological mechanisms of sustained fumagillin-induced weight loss. JCI Insight 2018, 3, e99453. [Google Scholar] [CrossRef]
- Burkey, B.F.; Hoglen, N.C.; Inskeep, P.; Wyman, M.; Hughes, T.E.; Vath, J.E. Preclinical Efficacy and Safety of the Novel Antidiabetic, Antiobesity MetAP2 Inhibitor ZGN-1061. J. Pharmacol. Exp. Ther. 2018, 365, 301–313. [Google Scholar] [CrossRef]
- Han, J.; Tang, Y.; Lu, M.; Hua, H. Comprehensive comparison of MetAP2 tissue and cellular expression pattern in lean and obese rodents. Diabetes Metab. Syndr. Obes. 2018, 11, 565–577. [Google Scholar] [CrossRef]
- Melchiorri, D.; Merlo, S.; Micallef, B.; Borg, J.J.; Drafi, F. Alzheimer’s disease and neuroinflammation: Will new drugs in clinical trials pave the way to a multi-target therapy? Front. Pharmacol. 2023, 14, 1196413. [Google Scholar] [CrossRef]
- Novoa, C.; Salazar, P.; Cisternas, P.; Gherardelli, C.; Vera-Salazar, R.; Zolezzi, J.M.; Inestrosa, N.C. Inflammation context in Alzheimer’s disease, a relationship intricate to define. Biol. Res. 2022, 55, 39. [Google Scholar] [CrossRef]
- Turk, B.E.; Su, Z.; Liu, J.O. Synthetic analogues of TNP-470 and ovalicin reveal a common molecular basis for inhibition of angiogenesis and immunosuppression. Bioorg Med. Chem. 1998, 6, 1163–1169. [Google Scholar] [CrossRef] [PubMed]
- Aguilar-Cazares, D.; Chavez-Dominguez, R.; Carlos-Reyes, A.; Lopez-Camarillo, C.; Hernadez de la Cruz, O.N.; Lopez-Gonzalez, J.S. Contribution of Angiogenesis to Inflammation and Cancer. Front. Oncol. 2019, 9, 1399. [Google Scholar] [CrossRef] [PubMed]
- Jeong, J.H.; Ojha, U.; Lee, Y.M. Pathological angiogenesis and inflammation in tissues. Arch. Pharm. Res. 2021, 44, 1–15. [Google Scholar] [CrossRef] [PubMed]
- Yoshimura, T.; Benny, O.; Bazinet, L.; D’Amato, R.J. Suppression of autoimmune retinal inflammation by an antiangiogenic drug. PLoS ONE 2013, 8, e66219. [Google Scholar] [CrossRef]
- Zhou, H.F.; Yan, H.; Hu, Y.; Springer, L.E.; Yang, X.; Wickline, S.A.; Pan, D.; Lanza, G.M.; Pham, C.T. Fumagillin prodrug nanotherapy suppresses macrophage inflammatory response via endothelial nitric oxide. ACS Nano 2014, 8, 7305–7317. [Google Scholar] [CrossRef]
- Akhtar, A.; Gupta, S.M.; Dwivedi, S.; Kumar, D.; Shaikh, M.F.; Negi, A. Preclinical Models for Alzheimer’s Disease: Past, Present, and Future Approaches. ACS Omega 2022, 7, 47504–47517. [Google Scholar] [CrossRef]
- Kazkayasi, I.; Telli, G.; Nemutlu, E.; Uma, S. Intranasal metformin treatment ameliorates cognitive functions via insulin signaling pathway in ICV-STZ-induced mice model of Alzheimer’s disease. Life Sci. 2022, 299, 120538. [Google Scholar] [CrossRef]
- Lannert, H.; Hoyer, S. Intracerebroventricular administration of streptozotocin causes long-term diminutions in learning and memory abilities and in cerebral energy metabolism in adult rats. Behav. Neurosci. 1998, 112, 1199–1208. [Google Scholar] [CrossRef]
- Mehla, J.; Pahuja, M.; Gupta, Y.K. Streptozotocin-induced sporadic Alzheimer’s disease: Selection of appropriate dose. J. Alzheimers Dis. 2013, 33, 17–21. [Google Scholar] [CrossRef]
- Salkovic-Petrisic, M.; Knezovic, A.; Hoyer, S.; Riederer, P. What have we learned from the streptozotocin-induced animal model of sporadic Alzheimer’s disease, about the therapeutic strategies in Alzheimer’s research. J. Neural. Transm. 2013, 120, 233–252. [Google Scholar] [CrossRef]
- Chen, Y.; Liang, Z.; Blanchard, J.; Dai, C.L.; Sun, S.; Lee, M.H.; Grundke-Iqbal, I.; Iqbal, K.; Liu, F.; Gong, C.X. A non-transgenic mouse model (icv-STZ mouse) of Alzheimer’s disease: Similarities to and differences from the transgenic model (3xTg-AD mouse). Mol. Neurobiol. 2013, 47, 711–725. [Google Scholar] [CrossRef] [PubMed]
- Wang, D.; Wang, C.; Liu, L.; Li, S. Protective effects of evodiamine in experimental paradigm of Alzheimer’s disease. Cogn. Neurodyn 2018, 12, 303–313. [Google Scholar] [CrossRef] [PubMed]
- Arnold, S.E.; Arvanitakis, Z.; Macauley-Rambach, S.L.; Koenig, A.M.; Wang, H.Y.; Ahima, R.S.; Craft, S.; Gandy, S.; Buettner, C.; Stoeckel, L.E.; et al. Brain insulin resistance in type 2 diabetes and Alzheimer disease: Concepts and conundrums. Nat. Rev. Neurol. 2018, 14, 168–181. [Google Scholar] [CrossRef] [PubMed]
- Cherry, J.D.; Olschowka, J.A.; O’Banion, M.K. Neuroinflammation and M2 microglia: The good, the bad, and the inflamed. J. Neuroinflamm. 2014, 11, 98. [Google Scholar] [CrossRef] [PubMed]
- Guo, S.; Wang, H.; Yin, Y. Microglia Polarization From M1 to M2 in Neurodegenerative Diseases. Front. Aging Neurosci. 2022, 14, 815347. [Google Scholar] [CrossRef]
- Sanjay; Shin, J.H.; Park, M.; Lee, H.J. Cyanidin-3-O-Glucoside Regulates the M1/M2 Polarization of Microglia via PPARgamma and Abeta42 Phagocytosis Through TREM2 in an Alzheimer’s Disease Model. Mol. Neurobiol. 2022, 59, 5135–5148. [Google Scholar] [CrossRef]
- Wang, Q.; Yao, H.; Liu, W.; Ya, B.; Cheng, H.; Xing, Z.; Wu, Y. Microglia Polarization in Alzheimer’s Disease: Mechanisms and a Potential Therapeutic Target. Front. Aging Neurosci. 2021, 13, 772717. [Google Scholar] [CrossRef]
- Zhang, Q.; Lenardo, M.J.; Baltimore, D. 30 Years of NF-kappaB: A Blossoming of Relevance to Human Pathobiology. Cell 2017, 168, 37–57. [Google Scholar] [CrossRef]
- Liu, T.; Zhang, L.; Joo, D.; Sun, S.C. NF-kappaB signaling in inflammation. Signal Transduct. Target. Ther. 2017, 2, 17023. [Google Scholar] [CrossRef]
- Akaishi, T.; Yamamoto, S.; Abe, K. 3′,4′-Dihydroxyflavonol Attenuates Lipopolysaccharide-Induced Neuroinflammatory Responses of Microglial Cells by Suppressing AKT-mTOR and NF-kappaB Pathways. Biol. Pharm. Bull. 2023, 46, 914–920. [Google Scholar] [CrossRef]
- Cianciulli, A.; Calvello, R.; Porro, C.; Trotta, T.; Salvatore, R.; Panaro, M.A. PI3k/Akt signalling pathway plays a crucial role in the anti-inflammatory effects of curcumin in LPS-activated microglia. Int. Immunopharmacol. 2016, 36, 282–290. [Google Scholar] [CrossRef] [PubMed]
- Dan, H.C.; Cooper, M.J.; Cogswell, P.C.; Duncan, J.A.; Ting, J.P.; Baldwin, A.S. Akt-dependent regulation of NF-kappaB is controlled by mTOR and Raptor in association with IKK. Genes. Dev. 2008, 22, 1490–1500. [Google Scholar] [CrossRef] [PubMed]
- Gao, J.; Wang, N.; Zong, F.; Dong, J.; Lin, Y.; Zhang, H.; Zhang, F. TIPE2 regulates the response of BV2 cells to lipopolysaccharide by the crosstalk between PI3K/AKT signaling and microglia M1/M2 polarization. Int. Immunopharmacol. 2023, 120, 110389. [Google Scholar] [CrossRef]
- Li, C.; Zhao, B.; Lin, C.; Gong, Z.; An, X. TREM2 inhibits inflammatory responses in mouse microglia by suppressing the PI3K/NF-kappaB signaling. Cell Biol. Int. 2019, 43, 360–372. [Google Scholar] [CrossRef]
- Saponaro, C.; Cianciulli, A.; Calvello, R.; Dragone, T.; Iacobazzi, F.; Panaro, M.A. The PI3K/Akt pathway is required for LPS activation of microglial cells. Immunopharmacol. Immunotoxicol. 2012, 34, 858–865. [Google Scholar] [CrossRef]
- Zhao, D.; Gu, M.Y.; Xu, J.L.; Zhang, L.J.; Ryu, S.Y.; Yang, H.O. Anti-neuroinflammatory Effects of 12-Dehydrogingerdione in LPS-Activated Microglia through Inhibiting Akt/IKK/NF-kappaB Pathway and Activating Nrf-2/HO-1 Pathway. Biomol Ther 2019, 27, 92–100. [Google Scholar] [CrossRef]
- Viatour, P.; Merville, M.P.; Bours, V.; Chariot, A. Phosphorylation of NF-kappaB and IkappaB proteins: Implications in cancer and inflammation. Trends Biochem. Sci. 2005, 30, 43–52. [Google Scholar] [CrossRef]
- Hou, Y.; Zhou, L.; Yang, Q.D.; Du, X.P.; Li, M.; Yuan, M.; Zhou, Z.W. Changes in hippocampal synapses and learning-memory abilities in a streptozotocin-treated rat model and intervention by using fasudil hydrochloride. Neuroscience 2012, 200, 120–129. [Google Scholar] [CrossRef]
- Rai, S.; Kamat, P.K.; Nath, C.; Shukla, R. Glial activation and post-synaptic neurotoxicity: The key events in Streptozotocin (ICV) induced memory impairment in rats. Pharmacol. Biochem. Behav. 2014, 117, 104–117. [Google Scholar] [CrossRef]
- Grunblatt, E.; Salkovic-Petrisic, M.; Osmanovic, J.; Riederer, P.; Hoyer, S. Brain insulin system dysfunction in streptozotocin intracerebroventricularly treated rats generates hyperphosphorylated tau protein. J. Neurochem. 2007, 101, 757–770. [Google Scholar] [CrossRef]
- Kamat, P.K.; Kalani, A.; Rai, S.; Tota, S.K.; Kumar, A.; Ahmad, A.S. Streptozotocin Intracerebroventricular-Induced Neurotoxicity and Brain Insulin Resistance: A Therapeutic Intervention for Treatment of Sporadic Alzheimer’s Disease (sAD)-Like Pathology. Mol. Neurobiol. 2016, 53, 4548–4562. [Google Scholar] [CrossRef] [PubMed]
- Newcombe, E.A.; Camats-Perna, J.; Silva, M.L.; Valmas, N.; Huat, T.J.; Medeiros, R. Inflammation: The link between comorbidities, genetics, and Alzheimer’s disease. J. Neuroinflamm. 2018, 15, 276. [Google Scholar] [CrossRef] [PubMed]
- Ozben, T.; Ozben, S. Neuro-inflammation and anti-inflammatory treatment options for Alzheimer’s disease. Clin. Biochem. 2019, 72, 87–89. [Google Scholar] [CrossRef]
- Dave, K.M.; Ali, L.; Manickam, D.S. Characterization of the SIM-A9 cell line as a model of activated microglia in the context of neuropathic pain. PLoS ONE 2020, 15, e0231597. [Google Scholar] [CrossRef]
- Nagamoto-Combs, K.; Kulas, J.; Combs, C.K. A novel cell line from spontaneously immortalized murine microglia. J. Neurosci. Methods 2014, 233, 187–198. [Google Scholar] [CrossRef]
- Ye, X.; Zhu, M.; Che, X.; Wang, H.; Liang, X.J.; Wu, C.; Xue, X.; Yang, J. Lipopolysaccharide induces neuroinflammation in microglia by activating the MTOR pathway and downregulating Vps34 to inhibit autophagosome formation. J. Neuroinflamm. 2020, 17, 18. [Google Scholar] [CrossRef]
- Zhang, X.; Subbanna, S.; Williams, C.R.O.; Canals-Baker, S.; Smiley, J.F.; Wilson, D.A.; Das, B.C.; Saito, M. Anti-inflammatory Action of BT75, a Novel RARalpha Agonist, in Cultured Microglia and in an Experimental Mouse Model of Alzheimer’s Disease. Neurochem. Res. 2023, 48, 1958–1970. [Google Scholar] [CrossRef]
- Frottin, F.; Bienvenut, W.V.; Bignon, J.; Jacquet, E.; Vaca Jacome, A.S.; Van Dorsselaer, A.; Cianferani, S.; Carapito, C.; Meinnel, T.; Giglione, C. MetAP1 and MetAP2 drive cell selectivity for a potent anti-cancer agent in synergy, by controlling glutathione redox state. Oncotarget 2016, 7, 63306–63323. [Google Scholar] [CrossRef]
- Badisa, R.B.; Wi, S.; Jones, Z.; Mazzio, E.; Zhou, Y.; Rosenberg, J.T.; Latinwo, L.M.; Grant, S.C.; Goodman, C.B. Cellular and molecular responses to acute cocaine treatment in neuronal-like N2a cells: Potential mechanism for its resistance in cell death. Cell Death Discov. 2018, 4, 13. [Google Scholar] [CrossRef]
- Shoham, S.; Bejar, C.; Kovalev, E.; Weinstock, M. Intracerebroventricular injection of streptozotocin causes neurotoxicity to myelin that contributes to spatial memory deficits in rats. Exp. Neurol. 2003, 184, 1043–1052. [Google Scholar] [CrossRef]
- Lacalle-Aurioles, M.; Iturria-Medina, Y. Fornix degeneration in risk factors of Alzheimer’s disease, possible trigger of cognitive decline. Cereb. Circ. Cogn. Behav. 2023, 4, 100158. [Google Scholar] [CrossRef] [PubMed]
- Craig, S.L.; Gault, V.A.; Flatt, P.R.; Irwin, N. The methionine aminopeptidase 2 inhibitor, TNP-470, enhances the antidiabetic properties of sitagliptin in mice by upregulating xenin. Biochem. Pharmacol. 2021, 183, 114355. [Google Scholar] [CrossRef] [PubMed]
- Singh, C.S.B.; Choi, K.B.; Munro, L.; Wang, H.Y.; Pfeifer, C.G.; Jefferies, W.A. Reversing pathology in a preclinical model of Alzheimer’s disease by hacking cerebrovascular neoangiogenesis with advanced cancer therapeutics. EBioMedicine 2021, 71, 103503. [Google Scholar] [CrossRef] [PubMed]
- Saito, M.; Smiley, J.F.; Hui, M.; Masiello, K.; Betz, J.; Ilina, M.; Saito, M.; Wilson, D.A. Neonatal Ethanol Disturbs the Normal Maturation of Parvalbumin Interneurons Surrounded by Subsets of Perineuronal Nets in the Cerebral Cortex: Partial Reversal by Lithium. Cereb. Cortex 2019, 29, 1383–1397. [Google Scholar] [CrossRef] [PubMed]


| Property | Characteristics | Value |
|---|---|---|
| Physicochemical Properties | Molecular Weight | 409.28 |
| TPSA | 47.56 | |
| logS (Aqueous Solubility) | −4.973 log mol/L (Poor) | |
| logP | 5.713 log mol/L | |
| logD | 4.263 log mol/L | |
| Medicinal Chemistry | Lipinski Rule | Accepted |
| Absorption | Caco-2 Permeability ** | −4.809 cm/s (Excellent) |
| HIA * | 0.008 (Excellent) | |
| F20% * | 0.006 (Excellent) | |
| F30% * | 0.043 (Excellent) | |
| Distribution | PPB (%) | 98.37 (Poor) |
| VD (L/kg) | 2.888 (Excellent) | |
| BBB penetration * | 0.018 cm/s (Excellent) | |
| Metabolism (CYP450 Inhibition) | CYP1A2 Inhibitor * | 0.251 (Active) |
| CYP2C19 Inhibitor * | 0.764 (Active) | |
| CYP2C9 Inhibitor * | 0.771 (Active) | |
| CYP2D6 Inhibitor * | 0.25 (Active) | |
| CYP3A4 Inhibitor * | 0.137 (Active) | |
| Excretion | CL (mL/min/kg) | 3.382 |
| t1/2 (hr) *** | 0.152 | |
| Toxicity | hERG Blockers * | 0.019 µM (Excellent) |
| H-HT * | 0.79 (Toxic) | |
| AMES Toxicity * | 0.543 (Moderately toxic) | |
| Respiratory Toxicity * | 0.019 (Non-Toxic) |
Disclaimer/Publisher’s Note: The statements, opinions and data contained in all publications are solely those of the individual author(s) and contributor(s) and not of MDPI and/or the editor(s). MDPI and/or the editor(s) disclaim responsibility for any injury to people or property resulting from any ideas, methods, instructions or products referred to in the content. |
© 2025 by the authors. Licensee MDPI, Basel, Switzerland. This article is an open access article distributed under the terms and conditions of the Creative Commons Attribution (CC BY) license (https://creativecommons.org/licenses/by/4.0/).
Share and Cite
Zhang, X.; Subbanna, S.; Williams, C.R.O.; Canals-Baker, S.; Hashim, A.; Wilson, D.A.; Weiss, L.M.; Shukla, S.; Chokkalingam, P.; Das, S.; et al. Methionine Aminopeptidase 2 (MetAP2) Inhibitor BL6 Attenuates Inflammation in Cultured Microglia and in a Mouse Model of Alzheimer’s Disease. Molecules 2025, 30, 620. https://doi.org/10.3390/molecules30030620
Zhang X, Subbanna S, Williams CRO, Canals-Baker S, Hashim A, Wilson DA, Weiss LM, Shukla S, Chokkalingam P, Das S, et al. Methionine Aminopeptidase 2 (MetAP2) Inhibitor BL6 Attenuates Inflammation in Cultured Microglia and in a Mouse Model of Alzheimer’s Disease. Molecules. 2025; 30(3):620. https://doi.org/10.3390/molecules30030620
Chicago/Turabian StyleZhang, Xiuli, Shivakumar Subbanna, Colin R. O. Williams, Stefanie Canals-Baker, Audrey Hashim, Donald A. Wilson, Louis M. Weiss, Srushti Shukla, Parthiban Chokkalingam, Sasmita Das, and et al. 2025. "Methionine Aminopeptidase 2 (MetAP2) Inhibitor BL6 Attenuates Inflammation in Cultured Microglia and in a Mouse Model of Alzheimer’s Disease" Molecules 30, no. 3: 620. https://doi.org/10.3390/molecules30030620
APA StyleZhang, X., Subbanna, S., Williams, C. R. O., Canals-Baker, S., Hashim, A., Wilson, D. A., Weiss, L. M., Shukla, S., Chokkalingam, P., Das, S., Das, B. C., & Saito, M. (2025). Methionine Aminopeptidase 2 (MetAP2) Inhibitor BL6 Attenuates Inflammation in Cultured Microglia and in a Mouse Model of Alzheimer’s Disease. Molecules, 30(3), 620. https://doi.org/10.3390/molecules30030620