Abstract
Synthesis of anionic metal–organic framework Na[Ce(BDC)2(DMF)2] based on cerium (III)–sodium terephthalate was performed. The crystal structure, studied by the Rietveld method, consists of anionic [Ce(BDC)2]− layers, connected by interlayer sodium cations in a 3D network. Variable-temperature PXRD, total X-ray scattering with pair distribution function analysis, and DFT calculations revealed framework structure stability upon DMF elimination and thermal treatment up to 300 °C. Modification with copper cations was performed using wetness impregnation with a Cu(NO3)2 methanol solution to obtain a catalyst for carbon monoxide oxidation. Cu2+@Na[Ce(BDC)2(DMF)2] in situ decomposition leads to the catalytic activity of the resulting CuO/CeO2 composite during CO gas oxidation by air.
1. Introduction
Metal–organic frameworks (MOFs) are a class of compounds consisting of inorganic nodes (ions or polynuclear clusters), typically linked by di- or polytopic organic linkers. MOFs have attracted researchers’ attention due to their high porosity, providing a wide range of possible applications: gas storage [1] and separation [2], drug delivery [3], magnetism [4], luminescent thermometers [5], sensors [6], catalysis [7], etc.
In catalysis, cerium MOFs are being intensively researched because of the well-known ability of cerium to switch between the +3 and +4 oxidation states and thus be a redox catalyst [8,9,10]. Ce4+ MOFs usually consist of [Ce6O4(OH)4]12+ nodes, connected by organic linkers [11]. The most-studied example is Ce-UiO-66, belonging to the UiO-66 structure type first discovered for zirconium, which consists of such nodes connected with terephthalic acid (H2BDC) [12]. It was shown that the mixture of Ce-UiO-66 and TEMPO is an effective catalyst for benzyl alcohol to benzaldehyde oxidation [13].
MOFs containing Ce3+ exhibit vast structural diversity due to more miscellaneous coordination numbers (6–12). In most cases, Ce3+ MOFs consist of 1D chains [14,15,16], connected in three dimensions by di- or polytopic ligands [17]. Inorganic building units (IBUs) are mono- [18] or polynuclear [19,20,21] clusters with cerium ions coordinated by carboxylate groups, oxo/hydroxo bridging oxygen atoms and/or solvent molecules.
However, in aerobic oxidation reactions, for example, CO oxidation to CO2, MOFs do not demonstrate exceptional catalytic activity [22]. In order to catalyze such reactions, nanoparticles of catalytically active metals or their oxides are usually deposited on the surface of MOFs [23,24,25]. Another widely utilized approach involves obtaining MOF-derived catalysts [26,27]. Such catalysts demonstrate higher specific surface areas, compared with nanodispersed CeO2 obtained by rapid precipitation or hydrothermal methods, and feature higher catalytic activity in contrast with the original MOF.
Although in most cases a framework is electrically neutral, there are examples of so-called anionic MOFs which consist of a negatively charged 3D framework and cations in the framework’s voids to compensate for the charge [28,29,30]. Recent studies have shown growing interest in using anionic MOFs in potassium ion capacitors [31], solid-state electrolytes for lithium-ion batteries [32], proton conductors [33], etc.
For catalytic applications, anionic MOFs are of particular interest due to the possibility of conducting ion exchange between cations in MOF voids and cations of a future catalyst’s active phase [34].
Anionic MOFs are often obtained serendipitously as a result of dimethylformamide decomposition with dimethylamine formation, templating the construction of the metal–organic framework. Thus, scientific data about the functional properties of anionic frameworks are scarce. Previously, we reported on tailored synthesis of a cerium anionic metal–organic framework [(CH3)2NH2]2[Ce2(BDC)4(DMF)]·2H2O [35]. The formation of this MOF is templated by dimethylamine present in the reaction mixture. Thermal decomposition of the MOF results in nanodispersed CeO2 formation with SBET = 182 m2/g.
In contrast, this work reports the ambient-condition synthesis of an anionic, layered sodium–cerium MOF. By replacing organic cations with interlayer sodium ions, we achieve enhanced structural robustness, a property which is typically absent in such frameworks. Further modification with copper cations allowed a CO oxidation catalyst to be obtained.
2. Results and Discussion
2.1. Synthesis
Metal–organic frameworks are usually synthesized under hydro- or solvothermal conditions due to necessity of overcoming kinetic factors during crystallization of coordination polymers with polytopic ligands. Such methods may lead to obtaining single crystals, significantly easing structure refinement. On the other hand, conducting the synthetic procedure in beakers is more convenient, scalable and reproducible. To obtain a high-crystalline product, slow ligand exchange must be ensured. Another obstacle is low scalability—it is challenging to synthesize large product quantities, needed for catalytic experiments. Our work proposes using a Ce4(OH)2(piv)10(H2O)2 polynuclear coordination polymer, which demonstrates low solubility in DMF, allowing slow exchange between pivalic and terephthalic acid in a beaker, with the desired product precipitating within several hours with high yield and product quantities.
Anionic MOFs are often obtained as a result of DMF decomposition accompanied by the formation of (CH3)2NH, which intercalates into the MOF voids and templates the framework topology. Serendipitous precipitation of several Na[La(BDC)2(DMF)2] crystals was previously achieved by mixing LaCl3 with H2BDC in the presence of NaOH [36]. In contrast to La3+, Ce3+ tends to be easily oxidized to Ce4+ in the presence of bases, which often leads to the precipitation of CeO2. In our case, an attempt to synthesize the target compound using NaOH as both the sodium source and base and CeCl3·7H2O as the cerium source resulted in the precipitation of a mixture of Na[Ce(BDC)2(DMF)2] and nanocrystalline CeO2 with an average grain size of 6.0 nm (Figure S1). Sodium hydroxide promotes hydrolysis of cerium salt used as a precursor and hinders the precipitation of the desired product.
Both methods 1 and 2 lead to the precipitation of the same product, Na[Ce(BDC)2(DMF)2]. It is essential to add a solution of Ce4(OH)2(piv)10(H2O)2 to a solution of H2BDC. Na[Ce(BDC)2(DMF)2] is a sodium–cerium terephthalate; therefore, synthesis in the presence of excess cerium leads to the precipitation of Ce2(BDC)3 with a one-dimensional chain structure. To obtain the desired product, an excess of H2BDC must be provided, which is achieved by adding the inorganic precursors into the solution of terephthalic acid.
The addition of (CH3)2NH provides binding of NO3− anions resulting in [(CH3)2NH2]NO3 and Na2BDC formation. The presence of (CH3)2NH in the reaction mixture leads to precipitation of [(CH3)2NH2]2[Ce2(BDC)4(DMF)2], reported previously [35]. Thus, an excess of sodium salt is needed to promote the formation of the desired product.
2.2. X-Ray Crystal Structure
Na[Ce(BDC)2(DMF)2] crystallizes in the C2/c space group. The crystal structure contains one symmetrically independent Ce1 atom located on a twofold axis and one Na1 atom situated on an inversion center (Figure 1A). Each Ce1 is coordinated by the oxygen atoms of one chelating group (O1–C–O1i) and three chelate-bridging carboxylate groups (κ1:μ3-O2ii–C–O2iii, κ1:μ2-O3–C–O4, κ1:μ2-O3i–C–O4i) from BDC2− linkers, as well as by two oxygen atoms (μ2-O5, μ2-O5i) from bridging DMF molecules (Table 1). The coordination environment of Ce1 with a coordination number (CN) of 10 is best described as a distorted tetradecahedron according to the Continuous Shape Measure (Table S1). The Na1 atom, situated in a distorted octahedral environment, is coordinated by six bridging oxygen atoms from four BDC2− linkers (O4, O2ii, O4iv, O1v) and two DMF molecules (O5, O5iv).
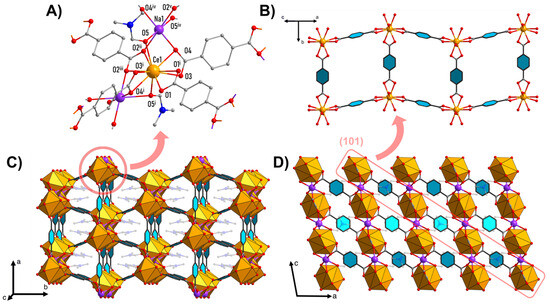
Figure 1.
Crystal structure of Na[Ce(BDC)2(DMF)2]: cerium and sodium coordination environment (A); isolated layer structure (sodium atoms and DMF molecules are omitted for clarity) (B); packing diagram showing channels along c axis (C); packing diagram along b axis, showing layers’ arrangement in crystal (D). Color code: orange—[CeO10]; purple—Na; gray—C; red—O. DMF molecules are semi-transparent, hydrogen atoms are omitted for clarity. Symmetry codes: i—1 − x, y, 1.5 − z; ii—1 − x, −1 + y, 1.5 − z; iii—x, −1 + y, z; iv—1 − x, −y, 1 − z; v—x, 1 − y, −0.5 + z.

Table 1.
Selected interatomic distances and bond energies in Na[Ce(BDC)2(DMF)2] and Na[Ce(BDC)2] according to XRD data and DFT calculations. Symmetry codes: i—1 − x, y, 1.5 − z; ii—1 − x, −1 + y, 1.5 − z; iii—x, −1 + y, z; iv—1 − x, −y, 1 − z; v—x, 1 − y, −0.5 + z.
Individual Ce1 ions are connected by four BDC2− linkers into [[Ce(BDC)2]−]∞ layers parallel to the (101) plane, forming a distorted square network with cavity apertures of 9.0 Å × 6.8 Å (Figure 1B). The cavities are occupied by DMF molecules coordinated by Ce atoms from adjacent layers (Figure 1C). The Na+ ions are located in the interlayer space and, through bridging coordination with the BDC2− ligands and DMF molecules, connect the layers into a three-dimensional framework (Figure 1D).
Secondary building units consist of 1D chains of [CeO10] and [NaO6] alternating polyhedrons with shared triangular faces along the c axis. One-dimensional chains are connected by BDC2− linkers in three dimensions, forming a metal–organic framework.
2.3. Periodic DFT Calculations
To shed light on the structural stability of the framework upon removal of DMF molecules and to identify the corresponding structural changes, a series of periodic DFT calculations was performed. The XRD-based initial structural models of Na[Ce(BDC)2(DMF)2] and Na[Ce(BDC)2] with artificially removed DMF molecules were used for atomic position optimization. The lattice parameters were not varied, since PXRD data indicated that DMF removal practically does not lead to a change in the unit-cell dimensions.
Analysis of the resulting geometry of Na[Ce(BDC)2(DMF)2] reveals that the DFT model agrees well with the XRD data: The respective Ce–O distances differ by approximately 0.04 Å. The most significant discrepancies correspond to the weakest Na–O ionic interactions (Table 1). The calculated bond energy values (Ebond) for the Ce–O contacts range from 40 to 60 kJ·mol−1, and the strongest bonds Ce–O1 are formed with only a chelate carboxyl group. The bond energy for the Ce–DMF contact (Ce–O5) is comparable to those for the Ce–O bonds involving the BDC2− ligands. Sodium cations show much weaker interactions with bridging ligands. The total energies of the Ce–O and Na–O coordination bonds are 490.6 kJ·mol−1 and 142.6 kJ·mol−1, respectively.
The DFT model of Na[Ce(BDC)2] demonstrates that the removal of DMF molecules induces structural relaxation. The Ce1–O1, Ce1–O3, and Ce1–O4 bonds become shorter by ca. 0.06 Å, while Ce1–O2 remains unchanged, and Na1–O2 shortens instead by 0.11 Å (Table 1). It is worth noting that shortening of the bonds leads to their noticeable strengthening. As a result, the total energies of the coordination bonds Ce–O and Na–O after the DMF elimination, 475.2 and 133.8 kJ·mol−1, respectively, are very close to those in the initial Na[Ce(BDC)2(DMF)2] structure.
Thus, despite the significant contribution of DMF to the formation of the framework, its removal is easily compensated for by the relaxation of the framework and has little effect on the total energy of the coordination bonds.
2.4. Thermal Behavior
Thermal decomposition of Na[Ce(BDC)2(DMF)2] in air proceeds in two main stages (Figure 2A). The first stage of weight loss, occurring at 190–295 °C, corresponds to the elimination of two coordinated solvent molecules. The experimental weight loss of 22.9% is in perfect agreement with the calculated value of 22.9%. During the second stage, the resulting Na[Ce(BDC)2] undergoes multistep combustion at 320–540 °C, leading to the formation of CeO2 and Na2CO3. The total weight loss of 65.7% at 700 °C agrees well with the calculated value of 66.4%. A further weight loss observed at 900–1000 °C is attributed to the evaporation of Na2CO3.
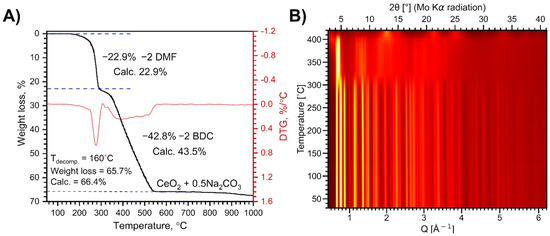
Figure 2.
Weight loss curve of Na[Ce(BDC)2(DMF)2] thermal decomposition in air (A) and VT-PXRD patterns during the same process (B).
VT-PXRD analysis reveals two phase transformations of the MOF upon heating in air up to 420 °C (Figure 2B). The XRD pattern of the MOF sample remains unchanged upon heating to 310 °C (Figure S2) and coincides with that of the as-synthesized Na[Ce(BDC)2(DMF)2], despite the elimination of DMF molecules according to the TGA data. Thus, the loss of coordinated DMF molecules does not lead to structural collapse. The refined lattice parameters show a gradual increase with rising temperature due to thermal expansion, while the growth of the a parameter slows above 160 °C as DMF molecules continue to depart (Figure S3).
At 310 °C, a structural reorganization occurs, resulting in the formation of a [Ce2(BDC)3] phase previously observed [35] upon heating the related anionic MOF [(CH3)2NH2]2[Ce2(BDC)4(DMF)2] to 350 °C. This phase remains stable up to 380 °C and decomposes upon further heating, forming nanocrystalline CeO2.
Moreover, ex situ experiments involving heating of Na[Ce(BDC)2(DMF)2] powder under dynamic vacuum at 250 and 300 °C for 12–14 h confirm the VT-PXRD results (Figure 3). Specifically, the PXRD pattern of the residue obtained after treatment at 300 °C differs from that of the as-synthesized MOF. The pattern of the Na[Ce(BDC)2] sample obtained after treatment at 250 °C is similar to that of Na[Ce(BDC)2(DMF)2], although the peaks become broader and less intense, indicating a reduction in crystallinity. The elimination of DMF at this stage was confirmed by CHN analysis and gravimetry. The Rietveld-refined unit-cell parameters of Na[Ce(BDC)2] are as follows: a = 16.918(4) Å, b = 11.694(3) Å, c = 12.705(3) Å, β = 100.876(17)°. The observed changes can be considered negligible compared with those of the as-synthesized sample (Δa = +0.004 Å, Δb = −0.005 Å, Δc = +0.007 Å, Δβ = −0.05°), indicating the rigidity of the framework.
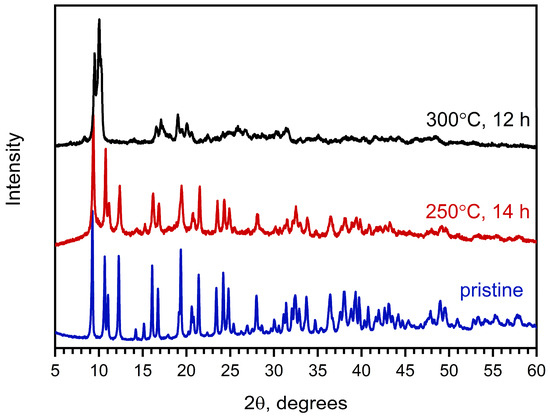
Figure 3.
PXRD patterns of as-obtained Na[Ce(BDC)2(DMF)2] (blue) and products of its activation at 250 °C for 14 h under dynamic vacuum (red) and at 300 °C under dynamic vacuum for 12 h (black).
Total X-ray scattering combined with pair distribution function (PDF) analysis was performed to examine changes in the local structure upon DMF elimination (Figure 4). The results indicate both local and long-range structure retention after DMF elimination with hardly noticeable interatomic distance changes. The Pearson correlation coefficient (PCC) between the PDFs of the as-synthesized sample and the same sample after DMF elimination is 0.934. After treatment at 250 °C for 14 h under dynamic vacuum, the PDF shows a noticeable damping relative to that of the as-synthesized sample, reflecting a reduction in structural order caused by DMF departure.

Figure 4.
Experimental PDF data of as-synthesized Na[Ce(BDC)2(DMF)2] and Na[Ce(BDC)2] (blue), and their fits using corresponding periodic models (red). Difference curves (gray) are offset for clarity. PCC stands for Pearson correlation coefficient.
The PDF of the as-synthesized Na[Ce(BDC)2(DMF)2] sample is well described by the corresponding structural model (PCC = 0.935), whereas the PDF of the heat-treated sample is best fitted using the Na[Ce(BDC)2] structural model with DMF molecules artificially removed (PCC = 0.921). It is worth noting that fitting the second PDF with the Na[Ce(BDC)2(DMF)2] structural model yields a lower correlation between the experimental and calculated data (PCC = 0.905) (Figure S4), confirming the elimination of DMF upon heating.
2.5. Specific Surface Area and Pore Size Distribution
The obtained adsorption–desorption isotherms (Figure 5) are Type-III (IUPAC classification), corresponding to nonporous materials. An increase in nitrogen uptake in the p/p0 < 0.1 region indicates the presence of micropores with diameters less than 2 nm. The specific surface areas, calculated using the BET model, were found to be 1 m2/g for Na[Ce(BDC)2(DMF)2] and 2 m2/g for Na[Ce(BDC)2].
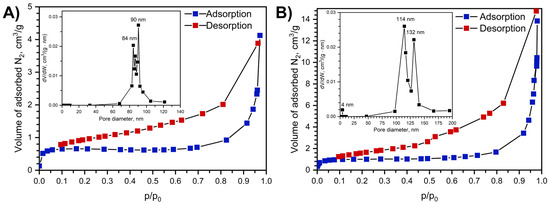
Figure 5.
Nitrogen adsorption isotherms at 77K before (A) and after sample treatment at 250 °C for 14 h (B) and adsorption–desorption isotherms and pore size distribution, calculated with BJH model using desorption isotherm branch shown as insets.
Crystallographic porosity and specific surface area after the artificial removal of guest molecules were calculated using the Zeo++ package [37] with probe radii of 1.2 Å and 1.77 Å. For a probe radius of 1.2 Å, the micropore volume is 0.0837 cm3·g−1 and the specific surface area is 1656.07 m2·g−1, which falls within the typical range for MOFs. When the probe radius is increased to 1.77 Å, corresponding to the radius of an N2 molecule, both the micropore volume and the specific surface area drop to zero. This behavior is attributed to cavities that are isolated from each other by narrow channels. The high rigidity of the metal–organic framework prevents nitrogen molecules from entering the cavities.
2.6. CO Oxidation
To obtain an effective catalyst for a heterogeneous redox process, it is reasonable to combine several chemical elements with variable oxidation states. Therefore, the cerium-based material was modified by impregnating Na[Ce(BDC)2(DMF)2] with a methanolic Cu(NO3)2 solution. The absorption of copper from the solution by the MOF is evidenced by the formation of a blue-colored precipitate. EDX analysis (Figure S5b) of the resulting Cu@Na[Ce(BDC)2(DMF)2] sample shows a relatively low copper content of 3.3 wt%. According to PXRD data (Figure 6), the MOF sample retains its structural integrity and crystallinity after modification. Moderate changes in the relative intensity of several peaks can be attributed to the incorporation of Cu2+ ions into the framework and the partial substitution of DMF by CH3OH molecules.
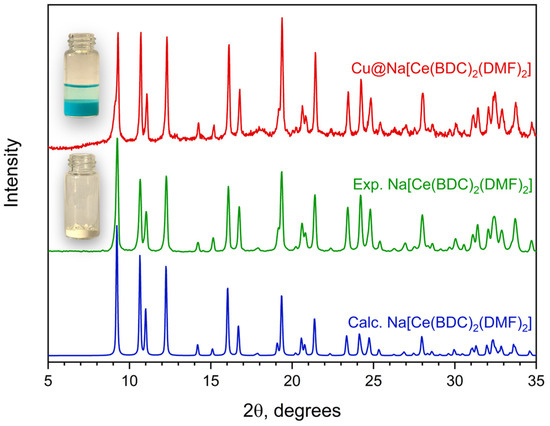
Figure 6.
PXRD patterns of Na[Ce(BDC)2(DMF)2] before (green) and after copper impregnation (red). (Blue) line represents calculated PXRD pattern for corresponding structure.
Figure 7 illustrates the TGA and DTG curves of Cu@Na[Ce(BDC)2(DMF)2]. Impregnation of the metal–organic framework with a methanolic Cu(NO3)2 solution leads to the substitution of DMF by MeOH molecules and results in pronounced changes in the thermal behavior. The DTG curve indicates two consecutive processes: the elimination of solvent molecules and the decomposition of the organic linker. The observed weight loss in the first stage is 4.9%, which corresponds to the removal of one MeOH molecule. The second stage of weight loss consists of two overlapping substages that occur consecutively. These stages correspond to the decomposition of the organic residues and the formation of CuO/CeO2 and Na2CO3. The XRD pattern of the sample heated to 400 °C shows the presence of two phases: CeO2 nanoparticles with an average grain size of 5 nm and CuO. The Na2CO3 phase was not detected because of its low scattering intensity compared with CeO2. The temperature of total decomposition decreases from 540 °C to 419 °C compared with the pristine Na[Ce(BDC)2(DMF)2]. This can be attributed to the presence of the CuO phase, which promotes low-temperature oxidation of the organic molecules.
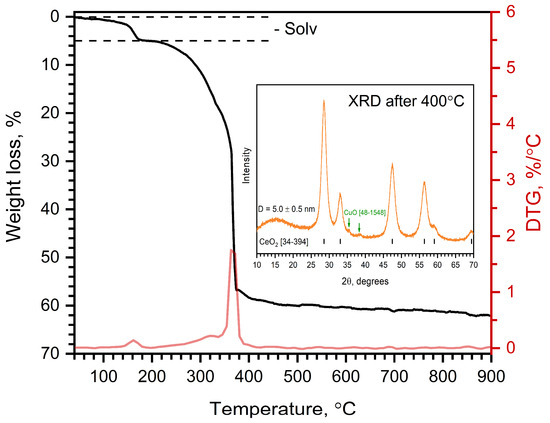
Figure 7.
TGA curve of Cu@Na[Ce(BDC)2(DMF)2] in air. XRD pattern of sample heated under same conditions up to 400 °C is shown as inset.
The fresh Cu@Na[Ce(BDC)2(DMF)2] catalyst exhibits modest activity in the CO oxidation reaction up to 340 °C, at which point MOF decomposition occurs, resulting in the formation of CeO2 on the catalyst surface and immediate increase in the reaction rate (Figure 8, black). The maximum reaction rate of the fresh Cu@Na[Ce(BDC)2(DMF)2] catalyst was 347.1 mmol CO g−1 cat h−1, and 100% CO conversion was reached at 380 °C.
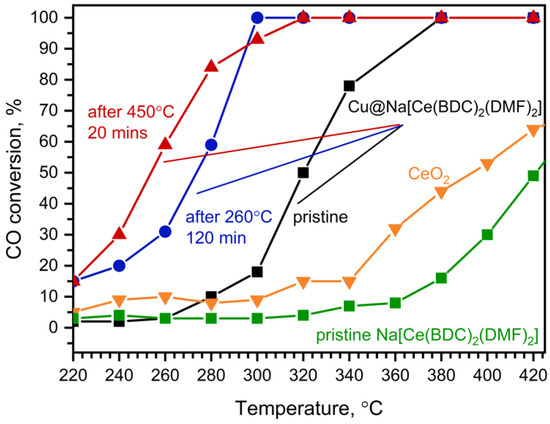
Figure 8.
CO conversion on Cu@Na[Ce(BDC)2(DMF)2]: pristine (black), after treatment in CO+O2 gas flow at 260 °C for 2 h (blue), after calcination in CO+O2 gas flow at 450 °C for 20 min (red), and on CeO2 (orange) and pristine Na[Ce(BDC)2(DMF)2] (green).
The catalyst underwent one subsequent test under the same conditions, which resulted in an increase in catalytic activity (Figure 8, blue): T100 decreased from 380 °C to 300 °C. The observed improvement in oxidative activity is attributed to MOF decomposition. The PXRD pattern of the catalyst treated at 260 °C for 2 h under the experimental conditions (Figure S6b) shows the presence of the Na[Ce(BDC)2(DMF)2] phase along with quartz. We assume that copper oxide is the active phase in this temperature range, promoting both CO and MOF oxidation with the formation of CeO2. After thermal decomposition, the catalyst composition was calculated to be 6 wt% CuO/CeO2.
Treatment of the fresh catalyst at 450 °C for 20 min resulted in a further increase in catalytic activity (Figure 8, red). Although T100 is higher than that of the catalyst treated at 260 °C for 2 h (T100 = 320 °C vs. 300 °C), 50% conversion was achieved at approximately 250 °C, which is about 20 °C lower. This may be attributed to the activation of copper species on the catalyst surface, which results in increased low-temperature oxidative activity. On the other hand, the increase in T100 might be due to CeO2 sintering, leading to a decrease in both surface area and high-temperature catalytic activity. The activated sample demonstrates stable performance for at least 20 h (Figure S7). All investigated Cu@Na[Ce(BDC)2(DMF)2] samples exhibit higher catalytic activity in CO oxidation than commercially available CeO2.
Table 2 summarizes the catalytic activity data for different metal–organic frameworks in the CO oxidation reaction. Although HKUST-1 [38] demonstrates superior catalytic performance in CO oxidation, among the listed cerium-based MOFs, Cu@Na[Ce(BDC)2(DMF)2] exhibits the lowest T50 value, presumably due to copper–cerium interactions that lead to the generation of catalytically active sites [39,40].
CeO2 nanoparticles are known to possess oxygen vacancies; thus, the surface of the CuO–CeO2 interface presumably consists of Ce3+–Vo–Cu+ active sites. The role of copper is to adsorb CO molecules on the surface, forming Cu+–CO species. The diffusion of lattice oxygen from CeO2 to the interface leads to formation of Ce4+–O2−–Cu2+–CO. Finally, CO is oxidized by lattice oxygen, CO2 is released, and the cerium and copper ions are reduced to +3 and +1, respectively. The resulting oxygen vacancies are then replenished by gaseous oxygen [41]. According to previous reports [42], CuO/CeO2 catalysts exhibit higher catalytic activity in CO oxidation than CuO–CeO2 solid solutions. Thus, the formation of a well-defined CuO–CeO2 interface is crucial for achieving high oxidative activity [43].
Table 2.
Catalytic activities of different cerium metal–organic frameworks in CO oxidation reaction.
Table 2.
Catalytic activities of different cerium metal–organic frameworks in CO oxidation reaction.
| System | Temperature of 50% CO Conversion (T50), °C | Activation Procedure | Reference |
|---|---|---|---|
| HKUST-1 | 235 | In reaction atmosphere during the first catalytic run | [38] |
| Ce-BTC | 310 | None | [44] |
| Cu@Na[Ce(BDC)2(DMF)2] | 253 | 450 °C for 20 min in reaction atmosphere | This work |
| MIL-53(Ce) | 275 | None | [45] |
After the CO oxidation performance test was completed, no traces of the MOF phase were detected in the catalyst. The PXRD pattern (Figure S6c) contains only reflections corresponding to quartz and CeO2. Because the scattering power of Na2CO3 is much lower than that of CeO2 and quartz, no diffraction peaks from this phase were observed.
3. Materials and Methods
Cerium nitrate, pivalic acid (2,2-dimethylpropionic acid, Hpiv), and terephthalic acid (1,4-benzenedicarboxylic acid, H2BDC) were purchased from Sigma-Aldrich (Darmstadt, Germany). N,N-dimethylformamide (DMF), sodium nitrate, copper nitrate, and dimethylamine (33% aqueous solution) were obtained from a local supplier (Rushim, Moscow, Russia). All reagents were of analytical grade and were used as received without further purification. The Ce4(OH)2(piv)10(H2O)2 powder was synthesized and characterized following the method described previously by our group [46].
The C, H, and N contents were measured using a PerkinElmer 2400 CHNS/O Organic Elemental Analyzer (PerkinElmer, Waltham, MA, USA); the Ce content was calculated from the weight residue of the TG-DTA analysis in air at 1000 °C. TG-DTA data were collected in an air atmosphere using a Derivatograph Q-1500 D (MOM, Budapest, Hungary) (heating rate: 10 °C·min−1; sample mass: 50 mg). FT-IR spectra were recorded on a PerkinElmer Spectrum 3 FTIR spectrometer (Perkin Elmer, Waltham, MA, USA) in the attenuated total reflectance (ATR) geometry in the wavenumber range of 550–4000 cm−1. Powder XRD data for phase analysis were collected on a Rigaku Miniflex 600 diffractometer (Rigaku, Tokyo, Japan) (600 W, CuKα radiation, λ = 1.54187 Å) equipped with D/tex Ultra 1D detector with Kβ filter.
Total X-ray scattering data for PDF analysis of Na[Ce(BDC)2(DMF)2] and Na[Ce(BDC)2] samples, placed in 0.5 mm Kapton capillaries, were collected on a Bruker D8 QUEST single-crystal X-ray diffractometer (Bruker AXS, Karlsruhe, Germany) equipped with a microfocus Incoatec IμS 3.0 Mo tube (λ = 0.71073 Å) and CMOS Photon III detector in the Q-range of 0.35–16.97 Å−1 [47]. The raw series of 2D frames were processed using the FormagiX 0.9.9b software [48] and transformed into PDFs with PDFgetX3 [49] employing a Q-range of 0.3–14.0 Å−1. Refinements were carried out with DiffPy-CMI 3.0.1 [50] using the crystal structure model of Na[Ce(BDC)2(DMF)2] and derived model of Na[Ce(BDC)2], obtained by artificial exclusion of DMF molecules from Na[Ce(BDC)2(DMF)2].
Textural characteristics were determined based on the nitrogen adsorption isotherms measured at 77K using an IMC ProSurf-V 1220 analyzer (IMC-systems, Moscow, Russia). Before the measurements, the samples were activated at 250 °C and 5 × 10⁻² mmHg for 2 h to remove physically adsorbed solvent molecules. The specific surface area was calculated according to the Brunauer–Emmett–Teller (BET) method, and the pore size distribution was derived from the desorption branch of the isotherm using Barrett–Joyner–Halenda (BJH) analysis. Additionally, sample activation was performed in dynamic conditions upon heating at 250 °C in nitrogen flow for 2 h using Sorbi-MS analyzer (Meta, Novosibirsk, Russia), and the following nitrogen adsorption experiment confirmed the same value of the specific surface area.
3.1. Synthesis of Na[Ce(BDC)2(DMF)2]
Method 1. Powders of H2BDC (1.478 g, 8.9 mmol), NaNO3 (0.3831 g, 4.5 mmol) and Ce4(OH)2(piv)10(H2O)2 (1.838 g, 1.3 mmol) were dispersed in 130 mL of DMF. Then, 3.7 mL of a 30% aqueous dimethylamine solution was added under stirring. The resulting solution was placed into a 250 mL Teflon-lined stainless-steel autoclave, sealed, and heated at 120 °C for 48 h. The white precipitate was filtered off, washed three times with 2 mL portions of DMF, and left to dry in air. The yield was 75%.
Method 2. Powders of Ce4(OH)2(piv)10(H2O)2 (1.838 g, 1.3 mmol), NaNO3 (0.3831 g, 4.5 mmol) and H2BDC (1.478 g, 8.9 mmol) were dissolved in 130 mL of DMF. The resulting clear solution was stirred in a glass beaker at room temperature for 2 h until a white-yellowish crystalline precipitate was obtained. The precipitate was filtered off and thoroughly washed several times with DMF, then dried in air. The yield was 55%.
Anal. Calc. for C22H22CeN2NaO10 (MW 637.53, wt%): 41.45 C; 3.48 H; 4.39 N; 21.98 Ce. Found: 40.82 C; 3.55 H; 4.72 N, 21.4 Ce. FT-IR (ATR, ν, cm−1): 670m, 747s, 763s, 821w, 834vs, 866w, 887w, 981w, 1003vw, 1016w, 1063w, 1097w, 1115m, 1149w, 1249w, 1309w, 1390vs, 1403vs, 1438m, 1505m, 1544m, 1571s, 1594m, 1650s, 2895vw, 2944vw, 2975vw. PXRD: C2/c, a = 16.9144(10) Å, b = 11.6992(6) Å, c = 12.6978(9) Å, β = 100.928(5)°.
3.2. Preparation of Na[Ce(BDC)2]
A sample of pristine Na[Ce(BDC)2(DMF)2] was heated at 250 °C under low pressure (5 × 10⁻² mmHg) for 14 h to remove coordinated DMF molecules.
Anal. Calc. for C16H8CeNaO8 (MW 490.92, wt %): 39.11 C; 1.64 H; 28.52 Ce. Found: 39.21 C; 1.81 H; 26.9 Ce. FT-IR (ATR, ν, cm−1): 670m, 747s, 763s, 821m, 833vs, 865w, 887w, 981w, 1005vw, 1017w, 1062w, 1098w, 1115m, 1152w, 1249w, 1310w, 1389vs, 1401vs, 1438m, 1506m, 1544s, 1568s, 1594m, 1651s, 2897vw, 2943vw, 2975vw. PXRD: C2/c, a = 16.918(4) Å, b = 11.694(3) Å, c = 12.705(3) Å, β = 100.876 (17)°.
3.3. Modification of Na[Ce(BDC)2(DMF)2] with Copper Ions
A powder sample of Na[Ce(BDC)2(DMF)2] (2.0 g, 3.1 mmol) was dispersed in 200 mL of a methanolic solution of Cu(NO3)2·3H2O (0.1038 g, 0.43 mmol). The resulting mixture was then stirred for 24 h at room temperature. The precipitate was filtered out and left undisturbed in air.
3.4. Catalytic Performance in Carbon Monoxide Oxidation
CO oxidation experiments were conducted in a CO + air flow (1:10 V/V) within the temperature range of 25–420 °C. The volume ratio of CO:O2 was 1:2. To prevent sample spilling during the experiment due to MOF oxidation and decrease in sample volume, the catalyst was mixed with α-quartz at a 1:1 (m/m) ratio.
Catalytic properties of formed MOF-derived CeO2 samples were studied in CO oxidation reactions at atmospheric pressure in the temperature range 25–420 °C in a flow catalytic setup with a steel reactor with an inside diameter of 4 mm. The reaction mixture CO + air was fed into the reactor with a CO/air ratio of 1:10 V/V, and the total flow rate of the gas mixture was 77 mL/min. To prevent sample spilling during the experiment due to MOF oxidation and a decrease in sample volume, the catalyst was mixed with α-quartz at a 2:3 (m/m) ratio. The catalysts were used without preliminary activation if not stated otherwise.
Cu@Na[Ce(BDC)2(DMF)2] or pristine Na[Ce(BDC)2(DMF)2] sample loading was 200 mg and 300 mg of quartz sand (grain size 0.25–0.5 mm). MOF-derived CeO2 was produced by preliminary heating of MOF within the catalytic setup at 450 °C for 20 min. On-line analysis of the reaction products was carried out using a Chromatec-Crystal 5000 gas chromatograph (Chromatec, Yoshkar-Ola, Russia) equipped with a thermal conductivity detector, SS316 3 m × 2 mm columns, Hayesep Q 80/100 mesh, and CaA molecular sieves. The temperature of the column was ramped according to the following program: 40 °C for 1.5 min, increasing to 100 °C at a rate of 15 °C/min. The quantitative analysis was carried out by the absolute calibration method.
3.5. X-Ray Crystallography
Powder XRD data of Na[Ce(BDC)2(DMF)2] for structure solution and Rietveld refinement were collected on a Tongda TD-3700 diffractometer (Dandong Tongda Science & Technology, Dandong City, China) operated in symmetrical reflection geometry (1200 W, CuKα radiation, λ = 1.54187 Å, Dectris Mythen2 R 1D detector with Kβ filter). The powder sample was placed in a glass sample holder and continuously spun around its normal during measurements to minimize preferred orientation and improve counting statistics.
The XRD pattern (Figure 9) was indexed in the monoclinic crystal system with F30 = 117 (|Δ2θ|= 0.006°, 45 theoretical peaks) by the dichotomy method as implemented in DICVOL91 [51]. Full-profile unit-cell refinement, peak-intensity extraction using the le Bail method, and final structure refinement using the Rietveld method were performed in JANA2006 [52]. The positions of Ce, Na and O atoms were solved using the Superflip method [53]. Other atoms were found from difference Fourier syntheses. The structure was refined with soft restraints on C–C, C–O, and C–N bond lengths and the corresponding valence angles. Four isotropic atomic displacement parameters were used—for Ce, Na, non-hydrogen atoms of BDC2− and non-hydrogen atoms of DMF. Hydrogen atoms were placed in idealized positions and treated in a riding mode. The pattern was fitted with an eleven-term Chebyshev polynomial background and a five-term pseudo-Voigt shape function with asymmetry corrected by axial divergence. The details of the data collection and refinement parameters are summarized in Table 3. Figure 9 shows the refined powder XRD profile. CCDC 2,461,298 contains crystallographic information associated with this paper.
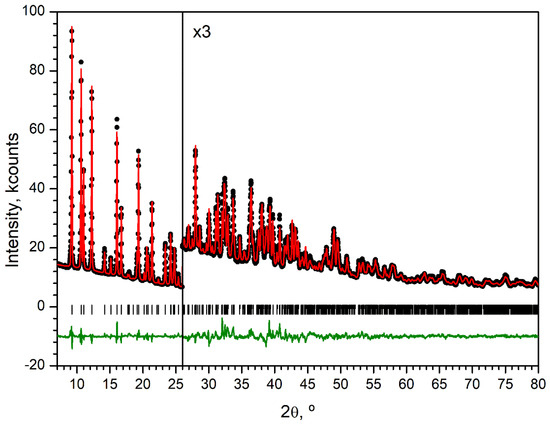
Figure 9.
PXRD pattern (λ = 1.5419 Å) of Ce-MOF at 293K (black circles), Rietveld refinement fit (red solid line), difference profile (offset green line), and positions of Bragg peaks (vertical bars).
Table 3.
Crystallographic and refinement data for Na[Ce(BDC)2(DMF)2].
3.6. DFT Calculations
DFT calculations with periodic boundary conditions were performed using the projector-augmented wave (PAW) method implemented in the VASP 5.4.4 software package using the PBE functional and the Gamma-centered Brillouin zone [54,55,56,57]. The energy cutoff of the plane wave in all calculations was set to 450 eV. The Grimme D3 dispersion correction was applied [58]. Geometry optimization was carried out using data obtained from a single-crystal X-ray experiment as an initial model. The electron density distribution function calculated in VASP was analyzed in terms of the QT-AIM theory [59] using the AIM-UC v.1.6.10 software package [60]. The values of the energy of coordination bonds EBond were estimated using the Espinosa–Molins–Lecomte correlation as ½v(rCP), where v(rCP) is the potential energy density at the bond critical point [61].
4. Conclusions
An approach to the synthesis of anionic metal–organic frameworks through the interaction of a metal salt with an acidic linker in the presence of additional cation species has been successfully applied to obtain a new cerium(III)-based metal–organic framework. The crystal structure of the obtained Na[Ce(BDC)2(DMF)2] compound consists of anionic [Ce(BDC)2]− layers with sodium ions in the interlayer space, forming a 3D network with DMF molecules occupying cavities.
According to TGA, VT-PXRD, and PDF data, the MOF releases DMF molecules upon thermal activation at 250 °C but retains its crystal structure up to 300 °C with minor changes in unit-cell parameters due to thermal expansion. PDF analysis of pristine and activated MOF samples confirms the structural rigidity after elimination of DMF molecules.
Periodic DFT calculations reveal that the coordination bonds between Ce ions and the BDC2− anions and DMF molecules possess comparable bonding energies. Despite this fact, elimination of DMF leads to enforcement of remaining coordination bonds; thus, the overall energy of Ce–O interactions virtually does not change, preventing structure collapse.
Modification of the Na[Ce(BDC)2(DMF)2] metal–organic framework by copper ions resulted in the formation of Cu@Na[Ce(BDC)2(DMF)2] catalyst with 3.3 wt% copper content. The catalyst was tested in a heterogeneous redox process of carbon monoxide oxidation by air. To achieve maximum catalytic activity, preliminary activation of the catalyst is needed to ensure total MOF conversion to a CuO/CeO2 composite. The latter demonstrates long-term catalytic stability.
Supplementary Materials
The following supporting information can be downloaded at https://www.mdpi.com/article/10.3390/molecules30214195/s1. Figure S1. PXRD pattern of product, obtained by using CeCl3 and NaOH to synthesize Na[Ce(BDC)2(DMF)2]. Figure S2. PXRD patterns, obtained in situ during heating the Na[Ce(BDC)2(DMF)2] sample, and Pearson correlation coefficients between adjacent VT-PXRD patterns. Figure S3. Temperature dependence of experimental unit-cell parameter obtained by Rietveld refinement of VT-PXRD data. Figure S4. PDFs of as-obtained Na[Ce(BDC)2(DMF)2] and the same sample after DMF elimination in dynamic vacuum at 250 °C. Figure S5. SEM picture of Cu@Na[Ce(BDC)2(DMF)2] and overview EDX spectrum. Figure S6. PXRD patterns of Na[Ce(BDC)2(DMF)2] after impregnation with Cu2+ and after CO oxidation experiments. Figure S7. Results of catalytic experiments; Table S1: Continuous Shape Measures.
Author Contributions
Conceptualization, methodology, supervision, D.T.; investigation, formal analysis, S.S., N.N. and M.T.; visualization, S.S. and N.N.; validation, N.N., D.T. and A.K.; writing—original draft, N.N.; writing—review and editing, D.T. and A.K.; funding acquisition, D.T. All authors have read and agreed to the published version of the manuscript.
Funding
This research was funded by Russian Science Foundation, grant number 22-73-10089.
Institutional Review Board Statement
Not applicable.
Informed Consent Statement
Not applicable.
Data Availability Statement
The primary data presented in this study are available on request from the corresponding author.
Acknowledgments
The authors acknowledge support from the M.V. Lomonosov Moscow State University Program of Development. Bruker D8 QUEST and Tongda TD-3700 laboratory diffractometers, IMC ProSurf-V 1220 and Meta Sorbi-MS sorbtometers, and PerkinElmer Spectrum 3 FTIR spectrometer were purchased using funding from the M.V. Lomonosov Moscow State University Program of Development.
Conflicts of Interest
The authors declare no conflicts of interest.
References
- Alezi, D.; Belmabkhout, Y.; Suyetin, M.; Bhatt, P.M.; Weselinski, L.J.; Solovyeva, V.; Adil, K.; Spanopoulos, I.; Trikalitis, P.N.; Emwas, A.H.; et al. MOF Crystal Chemistry Paving the Way to Gas Storage Needs: Aluminum-Based soc-MOF for CH4, O2, and CO2 Storage. J. Am. Chem. Soc. 2015, 137, 13308–13318. [Google Scholar] [CrossRef] [PubMed]
- Qian, Q.; Asinger, P.A.; Lee, M.J.; Han, G.; Rodriguez, K.M.; Lin, S.; Benedetti, F.M.; Wu, A.X.; Chi, W.S.; Smith, Z.P. MOF-Based Membranes for Gas Separations. Chem. Rev. 2020, 120, 8161–8266. [Google Scholar] [CrossRef]
- Cao, J.; Li, X.; Tian, H. Metal-Organic Framework (MOF)-Based Drug Delivery. Curr. Med. Chem. 2020, 27, 5949–5969. [Google Scholar] [CrossRef]
- Zhao, X.; Liu, S.; Tang, Z.; Niu, H.; Cai, Y.; Meng, W.; Wu, F.; Giesy, J.P. Synthesis of Magnetic Metal-Organic Framework (MOF) for Efficient Removal of Organic Dyes from Water. Sci. Rep. 2015, 5, 11849. [Google Scholar] [CrossRef]
- Zhao, D.; Rao, X.; Yu, J.; Cui, Y.; Yang, Y.; Qian, G. Design and Synthesis of an MOF Thermometer with High Sensitivity in the Physiological Temperature Range. Inorg. Chem. 2015, 54, 11193–11199. [Google Scholar] [CrossRef]
- Jo, Y.; Jo, Y.K.; Lee, J.; Jang, H.W.; Hwang, I.; Yoo, D.J. MOF-Based Chemiresistive Gas Sensors: Toward New Functionalities. Adv. Mater. 2023, 35, 2370308. [Google Scholar] [CrossRef]
- Doonan, C.J.; Sumby, C.J. Metal–Organic Framework Catalysis. CrystEngComm 2017, 19, 4044–4048. [Google Scholar] [CrossRef]
- Machida, M.; Murata, Y.; Kishikawa, K.; Zhang, D.; Ikeue, K. On the Reasons for High Activity of CeO2 Catalyst for Soot Oxidation. Chem. Mater. 2008, 20, 4489–4494. [Google Scholar] [CrossRef]
- Montini, T.; Melchionna, M.; Monai, M.; Fornasiero, P. Fundamentals and Catalytic Applications of CeO2-Based Materials. Chem. Rev. 2016, 116, 5987–6041. [Google Scholar] [CrossRef]
- Thammachart, M.; Meeyoo, V.; Risksomboon, T.; Osuwan, S. Catalytic Activity of CeO2–ZrO2 Mixed Oxide Catalysts Prepared via Sol–Gel Technique: CO Oxidation. Catal. Today 2001, 68, 53–61. [Google Scholar] [CrossRef]
- Jacobsen, J.; Wegner, L.; Reinsch, H.; Stock, N. Ce-MIL-140: Expanding the Synthesis Routes for Cerium(IV) Metal–Organic Frameworks. Dalton Trans. 2020, 49, 11396–11402. [Google Scholar] [CrossRef]
- Cavka, J.H.; Jakobsen, S.; Olsbye, U.; Guillou, N.; Lamberti, C.; Bordiga, S.; Lillerud, K.P. A New Zirconium Inorganic Building Brick Forming Metal Organic Frameworks with Exceptional Stability. J. Am. Chem. Soc. 2008, 130, 13850–13851. [Google Scholar] [CrossRef] [PubMed]
- Lammert, M.; Wharmby, M.T.; Smolders, S.; Bueken, B.; Lieb, A.; Lomachenko, K.A.; Vos, D.D.; Stock, N. Cerium-Based Metal Organic Frameworks with UiO-66 Architecture: Synthesis, Properties and Redox Catalytic Activity. Chem. Commun. 2015, 51, 12578–12581. [Google Scholar] [CrossRef] [PubMed]
- Weng, S.-F.; Wang, Y.-H.; Lee, C.-S. New Metal-Organic Frameworks of [M(C6H5O7)(C6H6O7)(C6H7O7)(H2O)]⋅H2O (M=La, Ce) and [Ce2(C2O4)(C6H6O7)2]⋅4H2O. J. Solid State Chem. 2012, 188, 77–83. [Google Scholar] [CrossRef]
- Atzori, C.; Lomachenko, K.A.; Øien-Ødegaard, S.; Lamberti, C.; Stock, N.; Barolo, C.; Bonino, F. Disclosing the Properties of a New Ce(III)-Based MOF: Ce2(NDC)3(DMF)2. Cryst. Growth Des. 2019, 19, 787–796. [Google Scholar] [CrossRef]
- Han, Y.-F.; Zhou, X.-H.; Zheng, Y.-X.; Shen, Z.; Song, Y.; You, X.-Z. Syntheses, Structures, Photoluminescence, and Magnetic Properties of Nanoporous 3D Lanthanide Coordination Polymers with 4,4′-Biphenyldicarboxylate Ligand. CrystEngComm 2008, 10, 1237. [Google Scholar] [CrossRef]
- Jacobsen, J.; Ienco, A.; D’Amato, R.; Costantino, F.; Stock, N. The Chemistry of Ce-Based Metal–Organic Frameworks. Dalton Trans. 2020, 49, 16551–16586. [Google Scholar] [CrossRef]
- Gil-Hernández, B.; Maclaren, J.K.; Höppe, H.A.; Pasán, J.; Sanchiz, J.; Janiak, C. Homochiral Lanthanoid(III) Mesoxalate Metal–Organic Frameworks: Synthesis, Crystal Growth, Chirality, Magnetic and Luminescent Properties. CrystEngComm 2012, 14, 2635. [Google Scholar] [CrossRef]
- Qi, J.-L.; Zheng, Y.-Q.; Xu, W.; Zhu, H.-L.; Lin, J.-L.; Chang, H.-S. New Ce(Iii) Sulfate–Tartrate-Based MOFs: An Insight into the Controllable Self-Assembly of Acentric Metal–Organic Complexes. CrystEngComm 2013, 15, 10618. [Google Scholar] [CrossRef]
- Han, Y.; Li, X.; Li, L.; Ma, C.; Shen, Z.; Song, Y.; You, X. Structures and Properties of Porous Coordination Polymers Based on Lanthanide Carboxylate Building Units. Inorg. Chem. 2010, 49, 10781–10787. [Google Scholar] [CrossRef]
- D’Arras, L.; Sassoye, C.; Rozes, L.; Sanchez, C.; Marrot, J.; Marre, S.; Aymonier, C. Fast and Continuous Processing of a New Sub-Micronic Lanthanide-Based Metal–Organic Framework. New J. Chem. 2014, 38, 1477–1483. [Google Scholar] [CrossRef]
- Lin, A.; Ibrahim, A.A.; Arab, P.; El-Kaderi, H.M.; El-Shall, M.S. Palladium Nanoparticles Supported on Ce-Metal–Organic Framework for Efficient CO Oxidation and Low-Temperature CO2 Capture. ACS Appl. Mater. Interfaces 2017, 9, 17961–17968. [Google Scholar] [CrossRef] [PubMed]
- Xu, J.; Liu, J.; Li, Z.; Wang, X.; Wang, Z. Synthesis, Structure and Properties of Pd@MOF-808. J. Mater. Sci. 2019, 54, 12911–12924. [Google Scholar] [CrossRef]
- Jiang, H.-L.; Liu, B.; Akita, T.; Haruta, M.; Sakurai, H.; Xu, Q. Au@ZIF-8: CO Oxidation over Gold Nanoparticles Deposited to Metal−Organic Framework. J. Am. Chem. Soc. 2009, 131, 11302–11303. [Google Scholar] [CrossRef]
- Qian, L.; Zhen, Z.; Jian, L.; Yue-Chang, W.; Gui-Yuan, J.; Ai-Jun, D. Pd Nanoparticles Deposited on Metal-Organic Framework of MIL-53(Al): An Active Catalyst for CO Oxidation. Acta Phys.-Chim. Sin. 2014, 30, 129–134. [Google Scholar] [CrossRef]
- Bai, C.; Li, A.; Yao, X.; Liu, H.; Li, Y. Efficient and Selective Aerobic Oxidation of Alcohols Catalysed by MOF-Derived Co Catalysts. Green Chem. 2016, 18, 1061–1069. [Google Scholar] [CrossRef]
- Gong, X.; Wang, W.-W.; Fu, X.-P.; Wei, S.; Yu, W.-Z.; Liu, B.; Jia, C.-J.; Zhang, J. Metal-Organic-Framework Derived Controllable Synthesis of Mesoporous Copper-Cerium Oxide Composite Catalysts for the Preferential Oxidation of Carbon Monoxide. Fuel 2018, 229, 217–226. [Google Scholar] [CrossRef]
- Al-Maythalony, B.A.; Shekhah, O.; Swaidan, R.; Belmabkhout, Y.; Pinnau, I.; Eddaoudi, M. Quest for Anionic MOF Membranes: Continuous Sod-ZMOF Membrane with CO2 Adsorption-Driven Selectivity. J. Am. Chem. Soc. 2015, 137, 1754–1757. [Google Scholar] [CrossRef]
- Li, P.; Vermeulen, N.A.; Gong, X.; Malliakas, C.D.; Stoddart, J.F.; Hupp, J.T.; Farha, O.K. Design and Synthesis of a Water-Stable Anionic Uranium-Based Metal–Organic Framework (MOF) with Ultra Large Pores. Angew. Chem. 2016, 128, 10514–10518. [Google Scholar] [CrossRef]
- Bhattacharyya, S.; Chakraborty, A.; Jayaramulu, K.; Hazra, A.; Maji, T.K. A Bimodal Anionic MOF: Turn-off Sensing of Cu II and Specific Sensitization of Eu III. Chem. Commun. 2014, 50, 13567–13570. [Google Scholar] [CrossRef]
- Aphirakaramwong, C.; Akintola, O.; Plass, C.T.; Sawangphruk, M.; Plass, W.; Balducci, A. Improving the Performance of an Anionic MOF by Counter Cation Replacement as Electrode Material in a Full Cell Setup of a Potassium Ion Capacitor. RSC Adv. 2023, 13, 12277–12284. [Google Scholar] [CrossRef]
- Hou, T.; Xu, W. Deep Dive into Anionic Metal-Organic Frameworks Based Quasi-Solid-State Electrolytes. J. Energy Chem. 2023, 81, 313–320. [Google Scholar] [CrossRef]
- Sun, H.-X.; Wang, H.-N.; Fu, Y.-M.; Meng, X.; He, Y.-O.; Yang, R.-G.; Zhou, Z.; Su, Z.-M. A Multifunctional Anionic Metal–Organic Framework for High Proton Conductivity and Photoreduction of CO2 Induced by Cation Exchange. Dalton Trans. 2022, 51, 4798–4805. [Google Scholar] [CrossRef] [PubMed]
- Chakraborty, A.; Bhattacharyya, S.; Hazra, A.; Ghosh, A.C.; Maji, T.K. Post-Synthetic Metalation in an Anionic MOF for Efficient Catalytic Activity and Removal of Heavy Metal Ions from Aqueous Solution. Chem. Commun. 2016, 52, 2831–2834. [Google Scholar] [CrossRef]
- Grebenyuk, D.; Shaulskaya, M.; Shevchenko, A.; Zobel, M.; Tedeeva, M.; Kustov, A.; Sadykov, I.; Tsymbarenko, D. Tuning the Cerium-Based Metal–Organic Framework Formation by Template Effect and Precursor Selection. ACS Omega 2023, 8, 48394–48404. [Google Scholar] [CrossRef] [PubMed]
- Long, L.-S.; Hu, J.-Y.; Ren, Y.-P.; Sun, Z.-G.; Huang, R.-B.; Zheng, L.-S. Crystal structure of a 3D coordination polymer: Sodium lanthanide terephthalate N, N-dimethylformamide solvate. Main Group Met. Chem. 2002, 25, 749–750. [Google Scholar] [CrossRef]
- Willems, T.F.; Rycroft, C.H.; Kazi, M.; Meza, J.C.; Haranczyk, M. Algorithms and Tools for High-Throughput Geometry-Based Analysis of Crystalline Porous Materials. Micropor. Mesopor. Mat. 2012, 149, 134–141. [Google Scholar] [CrossRef]
- Zamaro, J.M.; Pérez, N.C.; Miró, E.E.; Casado, C.; Seoane, B.; Téllez, C.; Coronas, J. HKUST-1 MOF: A Matrix to Synthesize CuO and CuO–CeO2 Nanoparticle Catalysts for CO Oxidation. Chem. Eng. J. 2012, 195–196, 180–187. [Google Scholar] [CrossRef]
- Stawowy, M.; Jagódka, P.; Matus, K.; Samojeden, B.; Silvestre-Albero, J.; Trawczyński, J.; Łamacz, A. HKUST-1-Supported Cerium Catalysts for CO Oxidation. Catalysts 2020, 10, 108. [Google Scholar] [CrossRef]
- Rojas-Buzo, S.; Salusso, D.; Le, T.-H.T.; Ortuño, M.A.; Lomachenko, K.A.; Bordiga, S. Unveiling the Role and Stabilization Mechanism of Cu + into Defective Ce-MOF Clusters during CO Oxidation. J. Phys. Chem. Lett. 2024, 15, 3962–3967. [Google Scholar] [CrossRef]
- Martínez-Arias, A.; Fernández-García, M.; Gálvez, O.; Coronado, J.M.; Anderson, J.A.; Conesa, J.C.; Soria, J.; Munuera, G. Comparative Study on Redox Properties and Catalytic Behavior for CO Oxidation of CuO/CeO2 and CuO/ZrCeO4 Catalysts. J. Catal. 2000, 195, 207–216. [Google Scholar] [CrossRef]
- Hossain, S.T.; Azeeva, E.; Zhang, K.; Zell, E.T.; Bernard, D.T.; Balaz, S.; Wang, R. A Comparative Study of CO Oxidation over Cu-O-Ce Solid Solutions and CuO/CeO2 Nanorods Catalysts. Appl. Surf. Sci. 2018, 455, 132–143. [Google Scholar] [CrossRef]
- Shang, H.; Zhang, X.; Xu, J.; Han, Y. Effects of Preparation Methods on the Activity of CuO/CeO2 Catalysts for CO Oxidation. Front. Chem. Sci. Eng. 2017, 11, 603–612. [Google Scholar] [CrossRef]
- Zhang, X.; Hou, F.; Li, H.; Yang, Y.; Wang, Y.; Liu, N.; Yang, Y. A Strawsheave-like Metal Organic Framework Ce-BTC Derivative Containing High Specific Surface Area for Improving the Catalytic Activity of CO Oxidation Reaction. Micropor. Mesopor. Mat. 2018, 259, 211–219. [Google Scholar] [CrossRef]
- Tan, H.-Y.; Zhou, Y.; Yan, Y.-F.; Wu, D.-Y.; Hu, W.-B.; Shi, X.-Y. Metal Organic Framework Cu/MIL-53(Ce)-Mediated Synthesis of Highly Active and Stable CO Oxidation Catalysts. Inorg. Chem. Commun. 2017, 79, 74–77. [Google Scholar] [CrossRef]
- Grebenyuk, D.; Zobel, M.; Polentarutti, M.; Ungur, L.; Kendin, M.; Zakharov, K.; Degtyarenko, P.; Vasiliev, A.; Tsymbarenko, D. A Family of Lanthanide Hydroxo Carboxylates with 1D Polymeric Topology and Ln4 Butterfly Core Exhibits Switchable Supramolecular Arrangement. Inorg. Chem. 2021, 60, 8049–8061. [Google Scholar] [CrossRef]
- Tsymbarenko, D.; Grebenyuk, D.; Burlakova, M.; Zobel, M. Quick and Robust PDF Data Acquisition Using a Laboratory Single-Crystal X-Ray Diffractometer for Study of Polynuclear Lanthanide Complexes in Solid Form and in Solution. J. Appl. Crystallogr. 2022, 55, 890–900. [Google Scholar] [CrossRef]
- Tsymbarenko, D. FormagiX v.0.9.9b. 2D XRD Processing Software. 2025. Available online: https://formagix.org/. (accessed on 20 April 2025).
- Juhás, P.; Davis, T.; Farrow, C.L.; Billinge, S.J.L. PDFgetX3: A Rapid and Highly Automatable Program for Processing Powder Diffraction Data into Total Scattering Pair Distribution Functions. J. Appl. Crystallogr. 2013, 46, 560–566. [Google Scholar] [CrossRef]
- Juhás, P.; Farrow, C.L.; Yang, X.; Knox, K.R.; Billinge, S.J.L. Complex Modeling: A Strategy and Software Program for Combining Multiple Information Sources to Solve Ill Posed Structure and Nanostructure Inverse Problems. Acta Crystallogr. A Found. Adv. 2015, 71, 562–568. [Google Scholar] [CrossRef] [PubMed]
- Boultif, A.; Louër, D. Indexing of Powder Diffraction Patterns for Low-Symmetry Lattices by the Successive Dichotomy Method. J. Appl. Crystallogr. 1991, 24, 987–993. [Google Scholar] [CrossRef]
- Petříček, V.; Dušek, M.; Palatinus, L. Crystallographic Computing System JANA2006: General Features. Z. Kristallogr. Cryst. Mater. 2014, 229, 345–352. [Google Scholar] [CrossRef]
- Palatinus, L.; Chapuis, G. SUPERFLIP–A Computer Program for the Solution of Crystal Structures by Charge Flipping in Arbitrary Dimensions. J. Appl. Crystallogr. 2007, 40, 786–790. [Google Scholar] [CrossRef]
- Kresse, G.; Furthmüller, J. Efficiency of Ab-Initio Total Energy Calculations for Metals and Semiconductors Using a Plane-Wave Basis Set. Comput. Mater. Sci. 1996, 6, 15–50. [Google Scholar] [CrossRef]
- Kresse, G.; Hafner, J. Ab Initio Molecular-Dynamics Simulation of the Liquid-Metal–Amorphous-Semiconductor Transition in Germanium. Phys. Rev. B 1994, 49, 14251–14269. [Google Scholar] [CrossRef]
- Kresse, G.; Furthmüller, J. Efficient Iterative Schemes for Ab Initio Total-Energy Calculations Using a Plane-Wave Basis Set. Phys. Rev. B 1996, 54, 11169–11186. [Google Scholar] [CrossRef]
- Kresse, G.; Hafner, J. Ab Initio Molecular Dynamics for Liquid Metals. Phys. Rev. B 1993, 47, 558–561. [Google Scholar] [CrossRef] [PubMed]
- Grimme, S.; Antony, J.; Ehrlich, S.; Krieg, H. A Consistent and Accurate Ab Initio Parametrization of Density Functional Dispersion Correction (DFT-D) for the 94 Elements H-Pu. J. Chem. Phys. 2010, 132, 154104. [Google Scholar] [CrossRef]
- Bader, R.F.W. Atoms in Molecules. Acc. Chem. Res. 1985, 18, 9–15. [Google Scholar] [CrossRef]
- Vega, D.; Almeida, D. AIM-UC: An Application for QTAIM Analysis. J. Comput. Methods Sci. Eng. 2014, 14, 131–136. [Google Scholar] [CrossRef]
- Espinosa, E.; Molins, E.; Lecomte, C. Hydrogen Bond Strengths Revealed by Topological Analyses of Experimentally Observed Electron Densities. Chem. Phys. Lett. 1998, 285, 170–173. [Google Scholar] [CrossRef]
Disclaimer/Publisher’s Note: The statements, opinions and data contained in all publications are solely those of the individual author(s) and contributor(s) and not of MDPI and/or the editor(s). MDPI and/or the editor(s) disclaim responsibility for any injury to people or property resulting from any ideas, methods, instructions or products referred to in the content. |
© 2025 by the authors. Licensee MDPI, Basel, Switzerland. This article is an open access article distributed under the terms and conditions of the Creative Commons Attribution (CC BY) license (https://creativecommons.org/licenses/by/4.0/).