Abstract
As a conceptual study for low-energy hydrogen production, potentially coupled with off-grid photovoltaics, this work focuses on overcoming the constraint of the oxygen evolution reaction (OER), which features a high anode potential and significant overpotential. To reduce energy consumption, the Fe2+ oxidation reaction is employed to replace OER, coupled with Fe2+ regeneration using natural biomass. Experimental results reveal that Fe2+ oxidation reaction is an effective substitute, with an initial oxidation potential of 0.5 V (vs. Hg/Hg2SO4), much lower than that of OER. Fe2+ regeneration is notably influenced by both biomass type and reaction temperature. Chlorella pyrenoidosa (CP) achieves the highest Fe3+ reduction rate of 90.5% at 190 °C. Water-soluble organic compounds generated during biomass oxidation exert a negative impact on Fe2+ electrooxidation by accumulating on or coating the electrode surface, and the compounds derived from CP exert a less detrimental effect. Moreover, enhancing magnetic stirring, elevating temperature, and selecting an appropriate anode material can significantly boost the oxidation reaction. Under optimized conditions, the current density during electrolysis of CP filtrate at 1.1 V reaches 280 mA/cm2, much higher than values reported in similar studies. This highlights the great potential of this co-electrolysis approach for efficient hydrogen production driven by off-grid photovoltaic power.
1. Introduction
With the acceleration of industrialization and urbanization, China’s energy consumption has gradually increased in recent years [1]. Currently, fossil fuels meet the vast majority of energy demand; however, massive carbon dioxide emissions into the atmosphere have a significant impact on the environment and human health [2]. Thus, large-scale development and utilization of renewable energy sources have become increasingly urgent [3]. Solar energy is recognized as a promising solution due to its abundant availability, wide distribution and environmental friendliness [4]. The radiant energy of sunlight can be directly converted into electrical energy via the photovoltaic (PV) effect, the most widely used solar energy utilization technology to date. Consequently, China’s installed solar power capacity has shown robust growth in recent years [5]. Nevertheless, light intensity and light duration are susceptible to season, climate, weather and other factors, leading to significant fluctuations in the output power of PV systems. To ensure the safety and stability of the power grid, large-capacity energy storage devices are essential. Unfortunately, meeting this demand remains challenging at present [6].
Hydrogen is another attractive energy carrier for the future, characterized by high energy density and zero carbon emissions [7]. Industrial hydrogen production technologies primarily include fossil fuel-based routes such as coal gasification [8] and methane reforming [9,10]. These routes currently dominate the market but generate substantial greenhouse gas emissions [11]. An alternative fossil-based approach is the purification of industrial by-products (e.g., from the chlor-alkali or steel industry), which offers a transitional pathway for hydrogen production [12]. However, the fluctuating composition and complex impurities of the feedstock gas result in high purification costs. Hydrogen carrier decomposition is a highly promising hydrogen production technology, among which ammonia [13] and formic acid [14] are the most common hydrogen carriers. This technology enables the safe and efficient storage and transport of hydrogen, but the decomposition process is often energy-intensive and may generate carbon-containing byproducts. Photocatalytic water splitting directly utilizes solar energy to produce hydrogen from water using semiconductor catalysts, with recent advances focusing on low-cost and stable materials [15]. Water electrolysis is a highly environmentally friendly and mature technology, as its only inputs are water and electricity, and its only decomposition products are high-purity hydrogen and oxygen. Despite its high energy consumption, water electrolysis offers distinct advantages for large-scale applications: it provides exceptionally high-purity hydrogen, is highly scalable, and most importantly, can be directly and efficiently coupled with intermittent renewable power sources like PV to produce truly green hydrogen [16,17]. The integration of PV power and water electrolysis can simultaneously produce abundant green hydrogen and provide large-scale energy storage for fluctuating power, attracting widespread global attention [18,19]. However, the high energy consumption of water electrolysis (up to 4.5~5.0 kWh/Nm3 H2) makes this integrated energy system economically uncompetitive [20].
The reversible voltage (E0rev) for conventional water electrolysis is calculated as 1.23 V according to Equation (1) [21]:
where ΔG0 denotes the standard Gibbs free energy change of the reaction, while n and F represent the number of electrons transferred and Faraday’s constant, respectively.
E0rev = −ΔG0/(nF)
In acidic electrolytes, the oxygen evolution reaction (OER) and hydrogen evolution reaction (HER) are expressed by the following equations, with the standard equilibrium electrode potentials (at 25 °C and 1 atm) of 1.23 V and 0 V, respectively [22]:
OER: H2O = 2H+ + 0.5O2 + 2e− Eaθ = 1.23 V
HER: 2H+ + 2e− = H2 Ecθ = 0.00 V
In practical water electrolysis for hydrogen production, the operating voltage is much higher than 1.23 V to achieve a considerable hydrogen yield, due to various additional overpotentials [23]. Approximately 40% of potential losses are attributed to OER, regarded as the primary cause of the high operating voltage [24]. Currently, the main strategies to reduce energy consumption in water splitting include synthesizing highly active OER catalysts and optimizing water electrolysis systems [25]. Although high-performance anode catalysts can reduce OER overpotential, the operating voltage of water electrolysis cannot break through the limitation of the reversible potential (1.23 V) [26]. Thus, replacing the low-activity OER with the oxidation of other easily oxidizable substances has been proposed [27]. Additionally, proton-dependent redox mediators, such as Fe3+/Fe2+ [28], Fe(CN)63−/Fe(CN)64− [29], POM(Ox)/POM(Red) [30], and vanadium species, have been considered to be reliable alternatives [31,32]. Among common redox pairs, the Fe3+/Fe2+ redox couple has been widely studied owing to its suitable electrode potential (0.77 V), high solubility in acidic solutions, low toxicity, and low cost [33]. Fe3+ generated via electrooxidation can be easily reduced to Fe2+ by coal, biomass, organic waste, etc. [34]. This regeneration process produces a certain amount of water-soluble organic compounds (WSOCs), some of which may affect Fe2+ electrooxidation. However, related research in this area is rarely reported. In this study, four types of natural biomass were used as reductants for Fe2+ regeneration, and hydrogen was produced at low operation voltages by replacing OER with the Fe2+ oxidation reaction.
2. Results and Discussion
2.1. Electrooxidation of Fe2+
The primary focus of this study is biomass-assisted Fe3+/Fe2+ mediated co-electrolysis for hydrogen production, making hydrogen yield a key technical parameter. Given the extremely low actual hydrogen production in the experiments, online measurement of hydrogen volume poses significant challenges. Since hydrogen production is directly correlated with the number of electrons, it can be indirectly reflected by current magnitude. Therefore, accurate estimation of Faradaic efficiency becomes particularly important.
To evaluate the Faraday efficiency, an i-t test was performed at 70 °C using a 0.4 M Fe2+ standard solution as the anolyte, with the resulting i-t curve presented in Figure 1a. Based on the test data, the theoretical hydrogen production V0 (mL) can be calculated using Equation (4) [35]:
where i(t) denotes the current value from the i-t curve, n (n = 2) represents the number of electrons transferred, and F is Faraday’s constant.
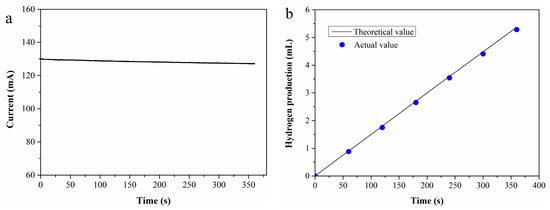
Figure 1.
(a) I-t curve of 0.4 M Fe2+ solution; (b) theoretical vs. experimental hydrogen production.
The actual hydrogen production (V1) was determined by water displacement collection, with Faraday efficiency defined as the ratio of V1 to V0. Figure 1b shows the comparison between theoretical and actual hydrogen production across different durations. As observed in the figure, the actual hydrogen production closely approximates the theoretical value, resulting in a high Faraday efficiency of 98.5%.
Using the standard Fe2+ solution (Fe2+ concentration: 0.1, 0.2, 0.3 and 0.4 mol/L, respectively) and 0.5 mol/L sulfuric acid as the anolyte, the LSV curves obtained with a scan rate of 10 mV/s and an anode potential range of 0.2–2.0 V (vs. Hg/Hg2SO4) is shown in Figure 2a.
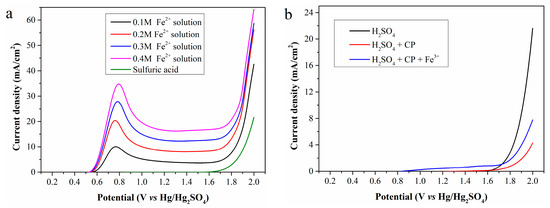
Figure 2.
LSV curves of (a) the standard Fe2+ solutions and (b) the mixture of CP and Fe3+.
As shown in the figure, no current is generated during electrolysis of the sulfuric acid even when the anode potential increases to 1.6 V, mainly due to high anodic overpotential. Thus, OER is ignored when the anode potential is below 1.6 V in subsequent studies. For electrolysis of the standard Fe2+ solution, oxidation current can be detected when the anode potential exceeds 0.5 V, attributed to Fe2+ oxidation. Therefore, Fe2+ electrooxidation behavior is discussed only within the anode potential range of 0.5–1.6 V. As the anode potential increased, the current density first rises sharply, reaches a maximum at about 0.8 V, and then slowly stabilizes. Furthermore, a high Fe2+ concentration in the anolyte significantly improves the current density, ultimately enhancing hydrogen production efficiency.
According to Figure 2b, electrolysis of sulfuric acid with 5 g of CP added to the anode chamber still generates no current at the anode potentials below 1.6 V. Unfortunately, the presence of CP even reduces the current density at high anode potential. However, when 0.02 mol of iron (III) sulfate is further added to the anode chamber containing CP, a small current is detected at low anode potentials, caused by electrooxidation of regenerated Fe2+. In general, CP cannot be directly oxidized on the Pt electrode within the selected anode potential range but can be indirectly oxidized via Fe2+ regeneration. The low current density indicates a low Fe2+ concentration in the anolyte, further reflecting a low Fe3+ reduction rate at room temperature.
2.2. Regeneration of Fe2+
Reaction temperature is the most critical factor in Fe2+ regeneration. Figure 3a shows Fe2+ concentrations in filtrates prepared at 90, 110, 130, 150, 170, and 190 °C, estimated as 0.13, 0.15, 0.20, 0.31, 0.63, and 0.72 mol/L, respectively. High reaction temperatures clearly accelerate Fe3+ reduction, ultimately increasing the cumulative Fe2+ amount in the filtrate. The Fe3+ reduction rate in the filtrate prepared at 190 °C reaches 90.5%, much higher than that at 170 °C. It can be inferred that a near-100% reduction rate might be achieved at higher temperatures. However, temperatures above 200 °C were not tested due to limitations of the reactor lining material.
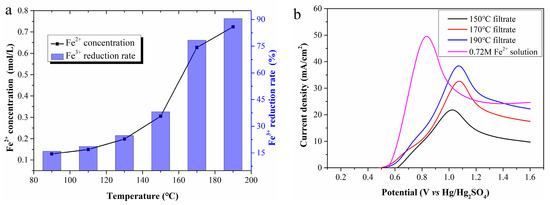
Figure 3.
(a) The Fe2+ concentration in the filtrates; (b) LSV curves of the filtrates.
Figure 3b presents LSV curves using filtrates prepared at different temperatures as the anolyte. As Fe2+ concentration increases, the current density rises greatly, and the anode potential corresponding to the peak current density also presents an upward trend. Compared with the LSV curves in Figure 2a, the peak current density potential shifts to approximately 1.05 V, with a continuous decrease in current density after reaching the maximum. To clarify this, a 0.72 mol/L standard Fe2+ solution was electrolyzed, and its LSV curve was compared with that of the 190 °C filtrate. Despite identical Fe2+ concentration, the peak current density of the former is significantly lower than that of the latter, and the corresponding anode potential is approximately 0.2 V higher. These differences are initially attributed to WSOCs in the anolyte formed by the CP oxidation.
Since current density largely depends on Fe2+ concentration, enhancing the Fe3+ reduction rate is crucial for improving hydrogen production efficiency. Table 1 summarizes cumulative Fe2+ concentrations in filtrates after reducing 0.4 mol/L iron (III) sulfate solution (Fe3+ concentration of 0.8 mol/L) with CP, RS, PS, and BD at 190 °C.

Table 1.
Fe2+ concentration in the filtrate reduced by different types of biomass.
It can be seen from Table 1 that Fe2+ concentration is highly dependent on biomass type. CP achieves a high reduction rate of 90.5%, while RS reduces only 75.4% of Fe3+. CP contains relatively high levels of proteins and lipids, which provide abundant dissociable active groups (e.g., sulfhydryl and carboxyl groups) that readily release electrons, endowing CP with strong reducibility. Although lignin typically exhibits a stronger reducing ability than proteins and lipids. Since RS contains approximately 15% lignin, it should have achieved a higher Fe3+ reduction rate. However, the lignin structure in RS contains more p-hydroxyphenylpropane units, and the unit has relatively high stability and generally does not participate in reduction reactions, resulting in poor reduction ability of RS.
Figure 4 illustrates the LSV curves of the four filtrates. All curves exhibit a similar profile and an almost identical initial oxidation potential of 0.5 V (vs. Hg/Hg2SO4), which is attributed to the oxidation of Fe2+. The peak current densities for the filtrates produced by CP, RS, PS, and BD are calculated as 38.4, 35.6, 39.8 and 33.6 mA/cm2, respectively. The filtrates from CP and PS have higher Fe2+ concentrations than those from RS and BD, generating larger current densities. However, the PS filtrate exhibits significantly lower current density in the low anode potential range, suggesting that WSOCs formed by PS oxidation exert a more negative impact on Fe2+ electrooxidation.
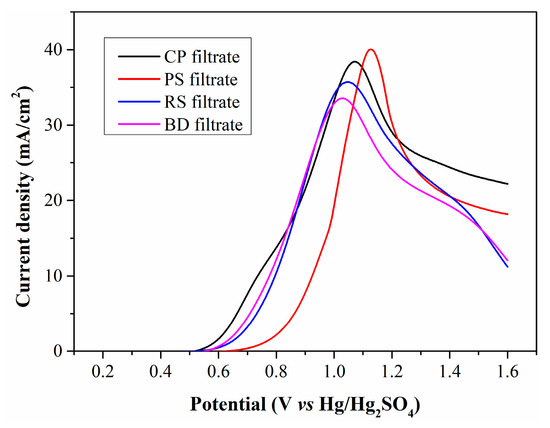
Figure 4.
LSV curves of filtrates produced from different types of biomass.
WSOCs in the filtrates from CP and PS were extracted with ethyl acetate, and the resulting extracts were analyzed by GC-MS. The total ion chromatogram in Figure 5 reveals that the typical components with high relative peak area in CP filtrate include diethyl succinate, ethyl levulinate, isobutyl acrylate, and ethyl 2-hydroxypropionate. In contrast, PS filtrate primarily contains levulinic acid, ethyl propionate, methoxyacetic anhydride, and 3-furaldehyde.
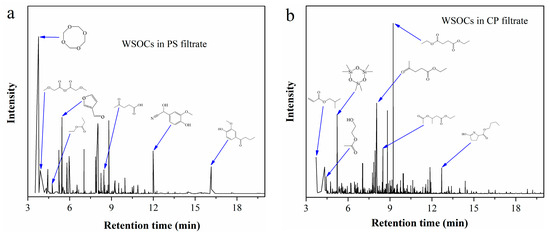
Figure 5.
Total ion chromatogram of the extracts from (a) PS filtrate; (b) CP filtrate.
To confirm whether Fe2+ electrooxidation is restricted by WSOCs, simulated solutions were prepared by adding diethyl succinate, ethyl levulinate, levulinic acid, and 3-furaldehyde to a 0.4 mol/L standard Fe2+ solution, then electrolyzed in the anode chamber. The resulting LSV curves (Figure 6) show that the initial oxidation potential of the simulated solutions matches that of the standard Fe2+ solution, indicating these organic substances are not oxidized at low potentials. However, the peak current density of the simulated solutions is significantly lower than that of the standard Fe2+ solution, confirming the harmful effect of WSOCs on Fe2+ electrooxidation. Some organic substances exhibit high surface activity, reducing solution surface tension and facilitating their accumulation on the electrode surface. This accumulation decreases contact efficiency between Fe2+ and the anode surface, lowering current density.
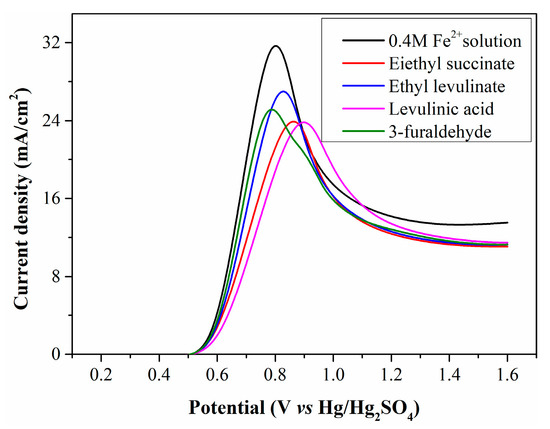
Figure 6.
LSV curves of simulated solutions containing typical organic substances.
Figure 7a shows i-t measurement results using CP and PS filtrates as the anolyte. The current density of CP filtrate initially drops drastically and then stabilizes at a constant value. The sharp decrease in current density may be attributed to the rapid accumulation of organic substances on the electrode surface, while the subsequent constant current density indicates that the hydrogen production system can operate stably. In contrast, the current density of the PS filtrate continues to decrease throughout the i-t test, dropping almost to zero after 1000 s of continuous testing. Post-test observations revealed a thin layer of viscous organic substances adhering to the electrode surface when using PS filtrate as the anolyte, whereas this phenomenon did not occur when electrolyzing CP filtrate. Whether these viscous coatings cause the continuous decrease in current density requires further confirmation.
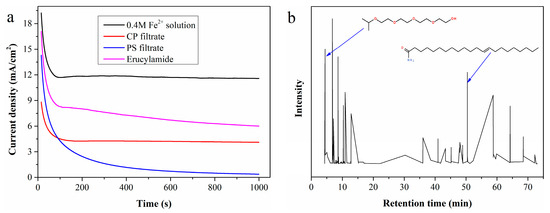
Figure 7.
(a) I-t curves of simulated solutions containing typical organic substances; (b) total ion chromatogram of the viscous organic substances coated on the electrode surface.
The viscous organic substances coated on the electrode surface were dissolved with ethyl acetate, and the resulting solution was analyzed by GC-MS. According to the total ion chromatogram in Figure 7b, 3,6,9,12-tetraoxatetradecan-1-ol and erucylamide are easily identified as key components. A simulated solution prepared by adding 5 mL of erucylamide to 95 mL of 0.4 mol/L standard Fe2+ solution was electrolyzed, with the LSV curve (Figure 7a) confirming that erucylamide reduces the Fe2+ electrooxidation rate. Additionally, the clean surface was recoated with erucylamide after electrolysis of the simulated solution.
2.3. Optimization of Experimental Conditions
LSV curves of the standard Fe2+ solutions and the filtrates exhibit significant oxidation peaks, indicating the electrochemical reaction is severely constrained by the diffusion of Fe2+ to the electrode surface. To enhance the mass transfer of Fe2+, magnetic stirring was implemented during electrolysis, and the LSV curves obtained at rotation speeds of 400, 600, 800, and 1000 r/min are presented in Figure 8a. As the rotation speed increases, the current density rises rapidly, and the oxidation peak disappears. At the anode potential of 1.6 V, the maximum current densities at 400, 600, 800, and 1000 r/min are 140.7, 170.5, 188.1, and 201.5 mA/cm2, which are significantly higher than the initial value of 38.4 mA/cm2. Magnetic stirring enhances Fe2+ diffusion from the bulk solution to the electrode surface and Fe3+ diffusion in the reverse direction, greatly increasing electrooxidation rate and current density. Strong agitation also partially detaches WSOCs previously accumulated on the anode surface, enabling more sufficient contact between Fe2+ and the anode and further increasing current density. Higher rotation speed reduces ion diffusion resistance and accelerates chemical reaction rate. However, when the mass transfer resistance is sufficiently low, the reaction rate is no longer limited by mass transfer, and excessively high rotation speed will deteriorate the contact between the electrode and electrolyte.
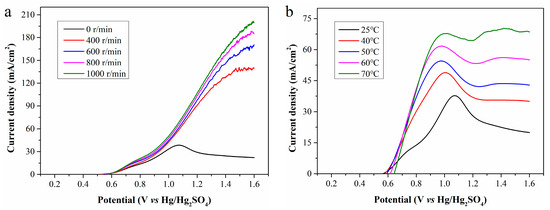
Figure 8.
LSV curves of CP filtrate at (a) different rotation speeds; and (b) different temperatures.
Besides mass transfer, reaction temperature is another key parameter affecting the electrooxidation of Fe2+. As is shown in Figure 8b, electrolysis conducted at different temperatures without magnetic stirring reveals that increasing temperature enormously enhances the current density and causes the peak current density to shift toward the lower potential region. In other words, a higher temperature enables the electrolysis system to achieve a higher current density at a lower anode potential. At temperatures of 25, 40, 50, 60, and 70 °C, the maximum achievable current densities are 37.8, 48.9, 54.5, 61.7, and 70.3 mA/cm2, respectively. Although increasing temperature does not directly reduce the reaction activation energy, it endows molecules have higher energy, which is equivalent to lowering the relative height of the activation energy barrier. This allows more molecules to more easily cross the energy barrier, facilitating reaction progression and accelerating the electrochemical reaction rate. Furthermore, high temperature increases the kinetic energy of ions, promotes ion mobility in the electrolyte, and thereby improves the conductivity of the electrolyte.
The type of anode material plays a crucial role in reducing anodic overpotential. The oxidation characteristics of Fe2+ on common precious metal electrodes are discussed, and the results are demonstrated in Figure 9. When the filtrate is electrolyzed using Pt and Ir-Ta electrodes, there is no significant difference in peak current density, and the LSV curves exhibit a high degree of overlap at low potentials. In contrast, the peak current density obtained with the Ru-Ir electrode is relatively low, while this electrode enables a higher current density at low potentials.
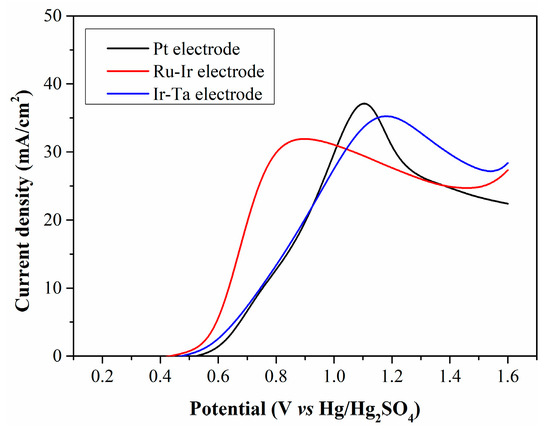
Figure 9.
LSV curves of CP filtrate electrolyzed with different anode electrodes.
With a rotation speed of 1000 r/min and a temperature of 70 °C, the filtrate from CP was electrolyzed using a Ru-Ir electrode, and the resulting LSV curve is presented in Figure 10. Under the optimized conditions, the current density increases enormously, reaching up to 280 mA/cm2 at 1.1 V. To compare the current density of our process with literature-reported values, three types of biomass (cornstalk, glucose and starch) reported in literature for hydrogen evolution are shown in Table 2. It can be seen that using the method proposed by us, a relatively high current density can be directly obtained with raw biomass as the reductant, which highlights that this hydrogen production system has certain advantages in terms of hydrogen production cost.
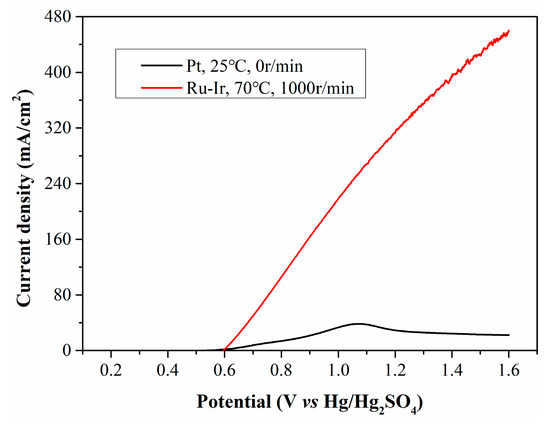
Figure 10.
LSV curves of CP filtrate electrolyzed at opimized conditions.
Table 2.
Comparison of different reductants for hydrogen evolution.
3. Experimental
3.1. Chemicals and Materials
Iron (II) sulfate (FeSO4·7H2O, 99.95%) and iron (III) sulfate (Fe2(SO4)3·xH2O, 99.95%) were used as sources of Fe2+ and Fe3+, respectively, both purchased from Shanghai Aladdin Biochemical Technology Co., Ltd. (Shanghai, China). Cerium (IV) sulfate (Ce(SO4)2, 99.9%, Shanghai Aladdin Biochemical Technology Co., Ltd., Shanghai, China) was employed to determine the Fe2+ concentration in solution. Sulfuric acid (98%, GR, Sinopharm Chemical Reagent Co., Ltd., Shanghai, China) and deionized water (18.2 MΩ·cm) were used for aqueous solution preparation. Four types of biomass, including chlorella pyrenoidosa (CP), rice straw (RS), pine sawdust (PS) and bean dregs (BD), were washed with 0.5 mol/L sulfuric acid and then used as reductants for Fe2+ regeneration.
3.2. Fe2+ Regeneration Process
For Fe2+ regeneration, 5 g of biomass and 0.04 mol of iron (III) sulfate were added into 100 mL of 0.5 mol/L sulfuric acid. The mixture was thoroughly stirred and transferred to a high-pressure reactor that was heated to a preset temperature and maintained at that temperature for 6 h. After reaction, the reactor was naturally cooled to room temperature, and the product was filtered to produce the primary filtrate. The obtained filter residue was fully washed with 100 mL of deionized water, followed by filtration again to obtain the secondary filtrate. The secondary filtrate was combined with the primary filtrate, and the mixture was evaporated and concentrated to 100 mL in a water bath. Finally, the biomass-regenerated filtrate was obtained. Fe2+ concentration in the filtrate was measured via redox titration using an automatic potentiometric titrator (ZDJ-4B, Yidian Scientific Instrument, Shanghai, China).
3.3. Characterization Analysis
The chromatographic analysis (GC) was conducted using an Agilent 5977A series GC/MSD system (Agilent Technologies, Santa Clara, CA, USA). Separation was achieved on an HP-5MS capillary column. The oven temperature was programmed as follows: initial temperature of 60 °C (held for 1 min), increased to 300 °C at a rate of 10 °C/min, and finally held at 300 °C for 5 min. High-purity helium (99.999%, Nanjing Shangyuan Industrial Gases, Nanjing, China) was used as the carrier gas at a constant flow rate of 1.0 mL/min. The sample (1 μL) was injected in the splitless mode. The injector temperature was set at 280 °C. The mass spectrometer (MS) was operated in the electron ionization (EI) mode at 70 eV. The temperatures of the ion source and the transfer line were set at 230 °C and 280 °C, respectively. Data were acquired in the full scan mode over a mass range of m/z 50–550.
3.4. Electrolysis Experiments
Electrolysis experiments were carried out in an H-type electrolyzer (Gaossunion, Tianjin, China) coupled with an electrochemical workstation (CHI660E, Chinstruments, Shanghai, China). The anode chamber contained a platinum (Pt) sheet electrode (2 cm × 2 cm) immersed in either a standard Fe2+ solution (0.5 mol/L sulfuric acid with a specific Fe2+ concentration) or the filtrate as the anolyte. The cathode chamber contained another Pt sheet electrode of the same size immersed in 0.5 mol/L sulfuric acid. The two chambers were separated by a Nafion 115 membrane to prevent iron ions from migrating to the cathode chamber. A Hg/Hg2SO4 electrode in saturated K2SO4 solution served as the reference electrode. In the electrolysis tests, the volume of electrolyte in both chambers was 100 mL. Linear sweep voltammetry (LSV) was performed at a scan rate of 10 mV/s. Amperometric i-t curve measurements were conducted at 0.8 V (vs. Hg/Hg2SO4) and terminated after 1000 s. The Nafion 115 membrane was pretreated by immersion in a mixed solution of 0.5 mol/L sulfuric acid and 3%wt H2O2 at 80 °C for 30 min, followed by washing and soaking in deionized water. All glassware was cleaned with 0.5 mol/L sulfuric acid and rinsed three times with deionized water before use.
4. Conclusions
This study explored hydrogen production via co-electrolysis of biomass and water, focusing on replacing OER with Fe2+ oxidation reaction to reduce energy consumption. Fe2+ oxidation reaction, with an initial oxidation potential of 0.5 V (vs. Hg/Hg2SO4), can effectively replace OER (1.6 V), enabling hydrogen production at a lower voltage and thus enhancing economic viability when coupled with off-grid PV power. Biomass-driven Fe2+ regeneration is critical, with temperature and biomass type being the key influencing factors. Higher temperatures promote Fe3+ reduction; among the tested biomass types, CP achieves the highest rate (90.5%) due to the rich active groups in its proteins and lipids, whereas RS (75.4%) is limited by stable lignin structures. WSOCs derived from biomass oxidation hinder Fe2+ electrooxidation through accumulation on the electrode surface. PS-derived WSOCs are most detrimental, causing near-zero current density after 1000 s of testing due to viscous coatings. Magnetic stirring enhances mass transfer; elevated temperature increases current density; and the Ru-Ir electrode outperforms Pt or Ir-Ta at low potentials. Under the optimal conditions (1000 r/min, 70 °C, Ru-Ir electrode, CP filtrate), current density reaches 280 mA/cm2 at anode potential of 1.1 V, which is much higher than values reported in similar studies, demonstrating the great potential of this co-electrolysis approach for efficient hydrogen production driven by off-grid PV power.
Author Contributions
Conceptualization, J.Y. (Jie Yao) and J.Z.; methodology, C.Z.; validation, M.D. and H.X.; formal analysis, J.Y. (Jie Yao) and Z.Z.; investigation, M.D. and H.Z.; resources, H.X.; data curation, J.Y. (Jintao Yu); writing—original draft preparation, J.Y. (Jie Yao) and C.Z.; writing—review and editing, C.Z. and J.Z.; visualization, C.Z.; supervision, J.Z. All authors have read and agreed to the published version of the manuscript.
Funding
This research was funded by grants from The Science and Technology Project of Guodian Environmental Protection Research Institute Co., Ltd. (HBPI2024Y02).
Institutional Review Board Statement
Not applicable.
Informed Consent Statement
Not applicable.
Data Availability Statement
The data presented in this study are available on request from the corresponding author.
Conflicts of Interest
Chunhua Zhu, Jie Yao, Meng Du, Henghui Xu and Jintao Yu were employed by Guodian Environmental Protection Research Institute Co., Ltd. Zeyu Zhou was employed by Huaneng Jiangyin Gas Turbine Cogeneration Co., Ltd. The remaining authors declare that the research was conducted in the absence of any commercial or financial relationships that could be construed as a potential conflict of interest.
Abbreviations
The following abbreviations are used in this manuscript:
| OER | oxygen evolution reaction |
| HER | hydrogen evolution reaction |
| PV | photovoltaic |
| WSOCs | water-soluble organic compounds |
| CP | chlorella pyrenoidosa |
| RS | rice straw |
| PS | pine sawdust |
| BD | bean dregs |
| GC-MS | gas chromatography-mass spectrometry |
| LSV | Linear sweep voltammetry |
References
- Raimi, D.; Zhu, Y.; Newell, R.G.; Prest, B.C.; Bergman, A. Global Energy Outlook 2023: Sowing the Seeds of an Energy Transition; Resources for the Future: Washington, DC, USA, 2023. [Google Scholar]
- Amir, N.; Hussin, F.; Aroua, M.K.; Gozan, M. Exploring Seaweed as a Sustainable Solution for Carbon Dioxide Adsorption: Trends, Opportunities, and Future Research Prospects. Renew. Sustain. Energy Rev. 2025, 213, 115458. [Google Scholar] [CrossRef]
- Schwietzke, S.; Sherwood, O.A.; Bruhwiler, L.M.P.; Miller, J.B.; Etiope, G.; Dlugokencky, E.J.; Michel, S.E.; Arling, V.A.; Vaughn, B.H.; White, J.W.C. Upward Revision of Global Fossil Fuel Methane Emissions Based on Isotope Database. Nature 2016, 538, 88–91. [Google Scholar] [CrossRef] [PubMed]
- Kishore, T.S.; Kumar, P.U.; Ippili, V. Review of Global Sustainable Solar Energy Policies: Significance and Impact. Innov. Green Dev. 2025, 4, 100224. [Google Scholar] [CrossRef]
- Yang, J.; Lam, T.Y.; Luo, Z.; Cheng, Q.; Wang, G.; Yao, H. Renewable Energy Driven Electrolysis of Water for Hydrogen Production, Storage, and Transportation. Renew. Sustain. Energy Rev. 2025, 218, 115804. [Google Scholar] [CrossRef]
- Asim, A.M.; Awad, A.S.A.; Attia, M.A. Integrated Optimization of Energy Storage and Green Hydrogen Systems for Resilient and Sustainable Future Power Grids. Sci. Rep. 2025, 15, 25656. [Google Scholar] [CrossRef]
- Madadi Avargani, V.; Habibzadeh, M.; Abdlla Maarof, H.; Zendehboudi, S.; Duan, X. Harnessing Renewable Energy for Hydrogen Production: Advances, Challenges, and Opportunities. Ind. Eng. Chem. Res. 2025, 64, 12368–12418. [Google Scholar] [CrossRef]
- Dai, F.; Zhang, S.; Luo, Y.; Wang, K.; Liu, Y.; Ji, X. Recent Progress on Hydrogen-Rich Syngas Production from Coal Gasification. Processes 2023, 11, 1765. [Google Scholar] [CrossRef]
- Taherian, Z.; Khataee, A.; Han, N.; Orooji, Y. Hydrogen Production through Methane Reforming Processes Using Promoted-Ni/Mesoporous Silica: A review. J. Ind. Eng. Chem. 2022, 107, 20–30. [Google Scholar] [CrossRef]
- Szablowski, L.; Wojcik, M.; Dybinski, O. Review of Steam Methane Reforming as a Method of Hydrogen Production. Energy 2025, 316, 134540. [Google Scholar] [CrossRef]
- Megía, P.J.; Vizcaíno, A.J.; Calles, J.A.; Carrero, A. Hydrogen Production Technologies: From Fossil Fuels toward Renewable Sources. A Mini Review. Energy Fuels 2021, 35, 16403–16415. [Google Scholar] [CrossRef]
- Zhang, X.Y.; Qian, X.M.; Xiao, C.B.; Yin, X.; Wang, X.; Wang, Z.; Yu, H.; Han, Z.Y.; Lin, L.T. Advancements in Purification and Holistic Utilization of Industrial by-Product Hydrogen: Progress, Challenges, and Prospects. Green Energy Resour. 2024, 2, 100098. [Google Scholar] [CrossRef]
- Ghoreishian, S.M.; Norouzi, M.; Lauterbach, J. Recent Progress in the Decomposition of Ammonia as a Potential Hydrogen-Carrier Using Green Technologies. Chem. Commun. 2025, 61, 8969–8983. [Google Scholar] [CrossRef] [PubMed]
- Mousavi-Salehi, S.; Keshipour, S.; Ahour, F. Gold Supported on Graphene Oxide/Silica Photocatalyst for Hydrogen Generation from Formic Acid. J. Phys. Chem. Solids. 2023, 176, 111239. [Google Scholar]
- Reza, M.S.; Ahmad, N.B.H.; Afroze, S.; Taweekun, J.; Sharifpur, M.; Azad, A. Hydrogen Production from Water Splitting through Photocatalytic Activity of Carbon-Based Materials. Chem. Eng. Technol. 2023, 46, 420–434. [Google Scholar]
- Hassan, N.S.; Jalil, A.A.; Rajendran, S.; Khusnun, N.F.; Bahari, M.B.; Johari, A.; Kamaruddin, M.J.; Ismail, M. Recent Review and Evaluation of Green Hydrogen Production via Water Electrolysis for a Sustainable and Clean Energy Society. Int. J. Hydrogen Energy 2024, 52, 420–441. [Google Scholar]
- Anwar, S.; Khan, F.; Zhang, Y.H.; Djire, A. Recent Development in Electrocatalysts for Hydrogen Production through Water Electrolysis. Int. J. Hydrogen Energy 2021, 46, 32284–32317. [Google Scholar]
- Gutierrez-Martín, F.; Amodio, L.; Pagano, M. Hydrogen Production by Water Electrolysis and Off-Grid Solar PV. Int. J. Hydrogen Energy 2021, 46, 29038–29048. [Google Scholar] [CrossRef]
- Chen, G.; Sun, R.; Wang, B. Solar-Powered Hydrogen: Exploring Production, Storage, and Energy Integration Strategies. Clean Energy 2025, 9, 123–146. [Google Scholar] [CrossRef]
- Xie, H.; Zhao, Z.; Liu, T.; Wu, Y.; Lan, C.; Jiang, W.; Zhu, L.; Wang, Y.; Yang, D.; Shao, Z. A Membrane-Based Seawater Electrolyser for Hydrogen Generation. Nature 2022, 612, 673–678. [Google Scholar] [CrossRef]
- Elmaihy, A.; Amin, M.I.; Bennaya, M.; Rashad, A. Thermodynamic Modeling of Alkaline Water Electrolyzer and Assessment of Reported Cell Voltages Correlations at Low Temperature and Atmospheric Pressure: Critical Review. J. Energy Storage 2024, 96, 112674. [Google Scholar] [CrossRef]
- Choi, J.; Lim, H.; Shim, J.; Jeong, G.H.; Sim, U.; Surendran, S.; Park, S. Harnessing Electrochemical CO2 Reduction and Assisted Water Electrolysis via Constrained Thermodynamic Modeling. Phys. Chem. Chem. Phys. 2025, 27, 17198. [Google Scholar] [CrossRef] [PubMed]
- Li, A.; Qiliang, Z.; Mi, Y.; Ur Rehman, H.; Shoaib, M.; Cao, X.; Wang, N. Triboelectric Nanogenerator Drives Electrochemical Water Splitting for Hydrogen Production: Fundamentals, Progress, and Challenges. Small 2025, 21, 2407043. [Google Scholar] [CrossRef]
- Xiang, K.; Wu, D.; Deng, X.; Li, M.; Chen, S.; Hao, P.; Guo, X.; Luo, J.-L.; Fu, X.-Z. Boosting H2 Generation Coupled with Selective Oxidation of Methanol into Value-Added Chemical over Cobalt Hydroxide@hydroxysulfide Nanosheets Electrocatalysts. Adv. Funct. Mater. 2020, 30, 1909610. [Google Scholar] [CrossRef]
- Wang, Z.; You, J.; Zhao, Y.; Yao, R.; Liu, G.; Lu, J.; Zhao, S. Research Progress on High Entropy Alloys and High Entropy Derivatives as OER Catalysts. J. Environ. Chem. Eng. 2023, 11, 109080. [Google Scholar] [CrossRef]
- Li, J.; Ma, Y.; Mu, X.; Wang, X.; Li, Y.; Ma, H.; Guo, Z. Recent Advances and Perspectives on Coupled Water Electrolysis for Energy-Saving Hydrogen Production. Adv. Sci. 2025, 12, 2411964. [Google Scholar] [CrossRef]
- Guo, W.L.; Li, L.; Li, L.L.; Tian, S.; Liu, S.L.; Wu, Y.P. Hydrogen Production via Electrolysis of Aqueous Formic Acid Solutions. Int. J. Hydrogen Energy 2011, 36, 9415–9419. [Google Scholar] [CrossRef]
- Chen, C.; Fu, Z.; Qi, F.; Chen, Y.; Meng, G.; Chang, Z.; Kong, F.; Zhu, L.; Tian, H.; Huang, H.; et al. Fe2+/Fe3+ Cycling for Coupling Self-Powered Hydrogen Evolution and Preparation of Electrode Catalysts. Angew. Chem. Int. Ed. 2022, 61, e202207226. [Google Scholar] [CrossRef] [PubMed]
- Gan, T.; Yang, Z.; Li, S.; Qian, H.; Li, Z.; Liu, J.; Peng, P.; Bai, J.; Liu, H.; Wang, Z.; et al. Unveiling Janus Chemical Processes in Contact-Electro-Chemistry through Oxygen Reduction Reactions. J. Am. Chem. Soc. 2025, 147, 25407–25416. [Google Scholar] [CrossRef]
- Cui, L.-P.; Zhang, S.; Zhao, Y.; Ge, X.-Y.; Yang, L.; Li, K.; Feng, L.-B.; Li, R.-G.; Chen, J.-J. Tunable Multi-Electron Redox Polyoxometalates for Decoupled Water Splitting Driven by Sunlight. Nat. Commun. 2025, 16, 3674. [Google Scholar] [CrossRef]
- Du, X.; Liu, W.; Zhang, Z.; Mulyadi, A.; Brittain, A.; Gong, J.; Deng, Y. Low-Energy Catalytic Electrolysis for Simultaneous Hydrogen Evolution and Lignin Depolymerization. ChemSusChem 2017, 10, 847–854. [Google Scholar] [CrossRef]
- Oh, H.; Choi, Y.; Shin, C.; Nguyen, T.V.T.; Han, Y.; Kim, H.; Kim, Y.H.; Lee, J.-W.; Jang, J.-W.; Ryu, J. Phosphomolybdic Acid as a Catalyst for Oxidative Valorization of Biomass and Its Application as an Alternative Electron Source. ACS Catal. 2020, 10, 2060–2068. [Google Scholar] [CrossRef]
- Naik, T.S.S.K.; Varshney, R.; Ramamurthy, P.C. Biomimetic Iron-Doped Polydopamine Sensor for Selective Detection of Polystyrene Nanoplastics. ACS EST Water 2025, 5, 3241–3250. [Google Scholar] [CrossRef]
- Hesenov, A.; Kınık, H.; Puli, G.; Gözmen, B.; Irmak, S.; Erbatur, O. Electrolysis of Coal Slurries to Produce Hydrogen Gas: Relationship between CO2 and H2 Formation. Int. J. Hydrogen Energy 2011, 36, 5361–5368. [Google Scholar] [CrossRef]
- Yang, L.; Liu, W.; Zhang, Z.; Du, X.; Gong, J.; Dong, L.C.; Deng, Y.L. Hydrogen Evolution from Native Biomass with Fe3+/Fe2+ Redox Couple Catalyzed Electrolysis. Electrochim. Acta 2017, 246, 1163–1173. [Google Scholar] [CrossRef]
- Wang, Y.; Zhao, M.; Wang, T.; Li, M.; Lu, X.; Li, B. Study on Hydrogen Generation and Cornstalk Degradation by Redox Coupling of Non-Noble Metal Fe3+/Fe2+. Int. J. Hydrogen Energy 2021, 46, 27409–27421. [Google Scholar] [CrossRef]
- Umer, M.; Brandoni, C.; Jaffar, M.; Hewitt, N.J.; Dunlop, P.; Zhang, K.; Huang, Y. An Experimental Investigation of Hydrogen Production through Biomass Electrolysis. Processes 2024, 12, 112. [Google Scholar] [CrossRef]


Disclaimer/Publisher’s Note: The statements, opinions and data contained in all publications are solely those of the individual author(s) and contributor(s) and not of MDPI and/or the editor(s). MDPI and/or the editor(s) disclaim responsibility for any injury to people or property resulting from any ideas, methods, instructions or products referred to in the content. |
© 2025 by the authors. Licensee MDPI, Basel, Switzerland. This article is an open access article distributed under the terms and conditions of the Creative Commons Attribution (CC BY) license (https://creativecommons.org/licenses/by/4.0/).