

A Theoretical Investigation of the Selectivity of Aza-Crown Ether Structures Chelating Alkali Metal Cations for Potential Biosensing Applications


Abstract
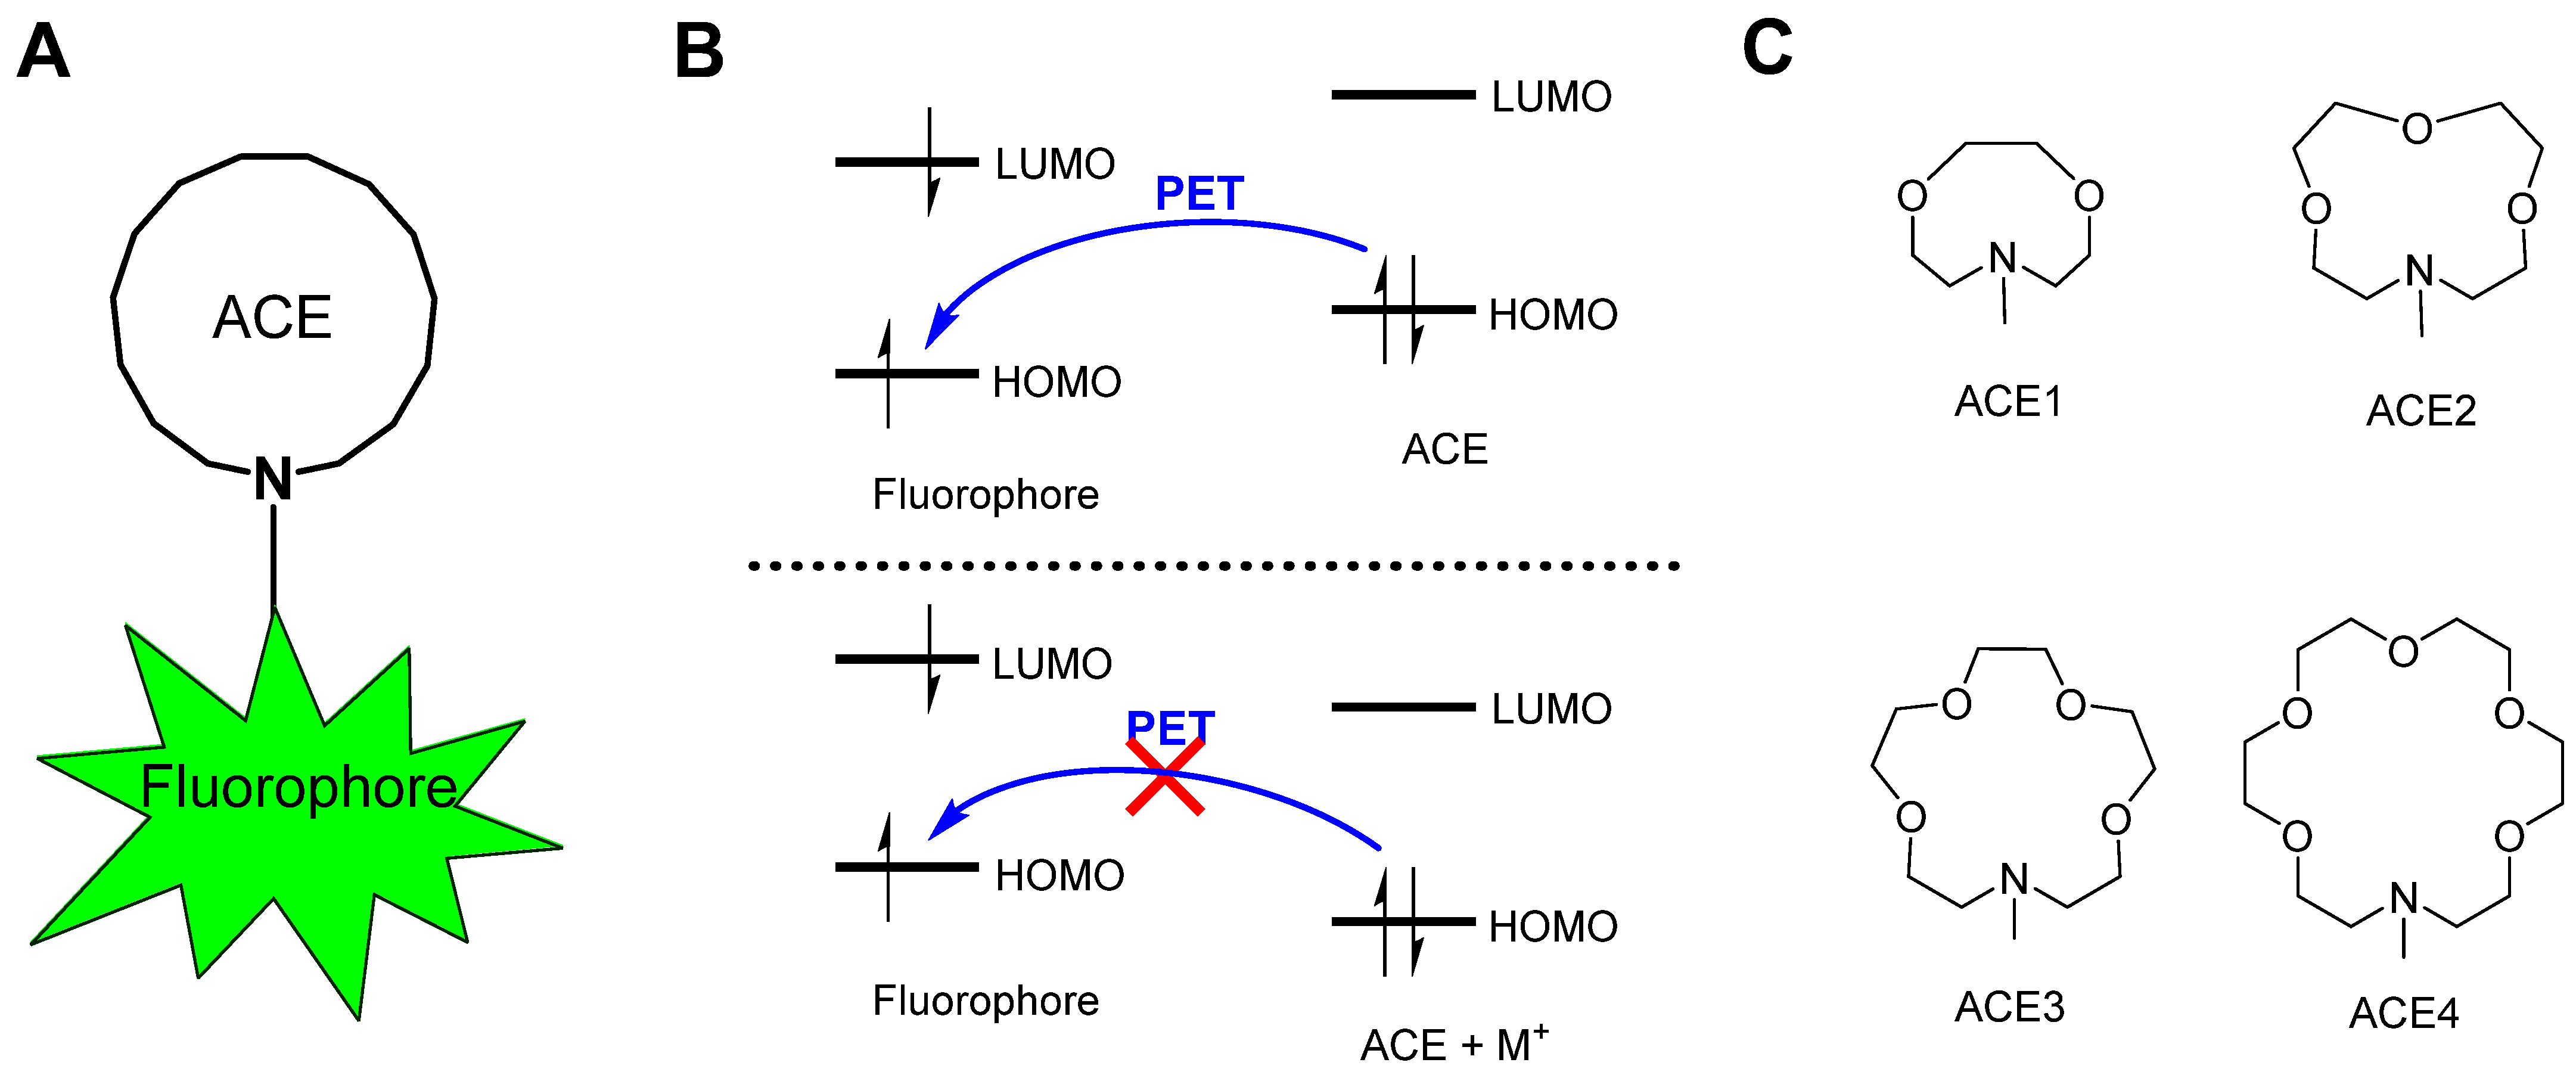
1. Introduction
2. Results and Discussion
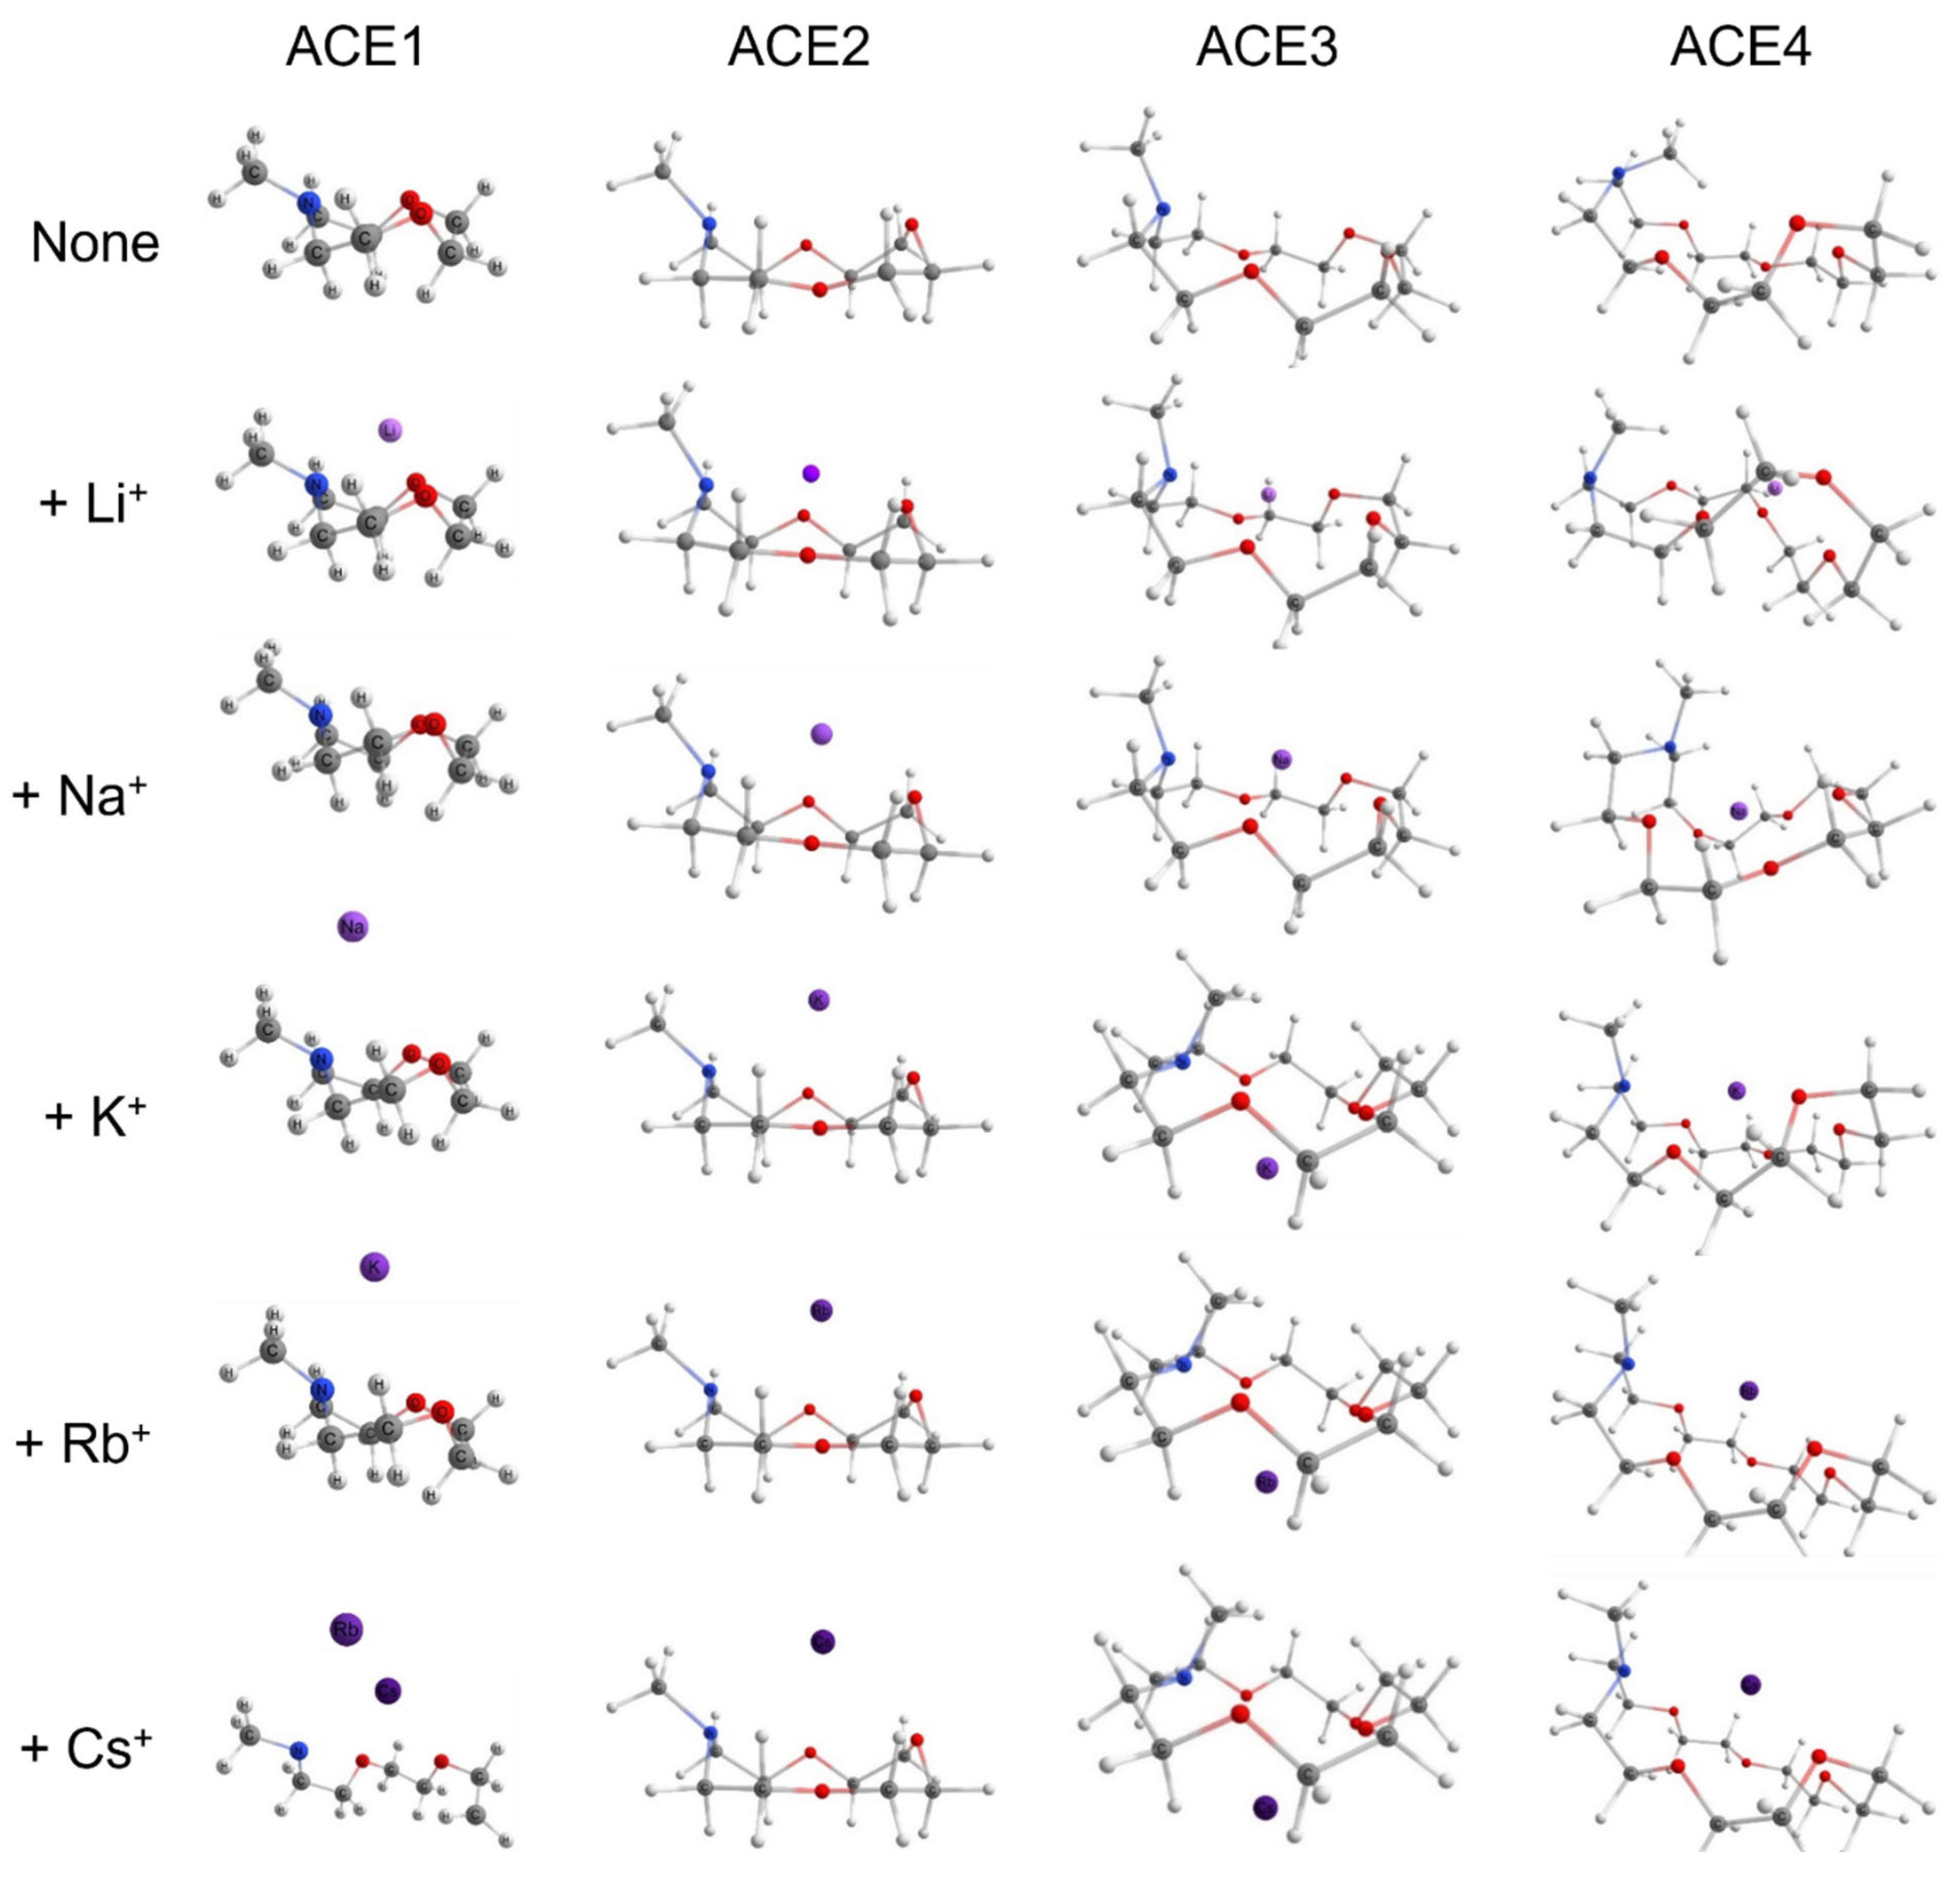
2.1. Structural Geometries of Metal-Complexed ACEs
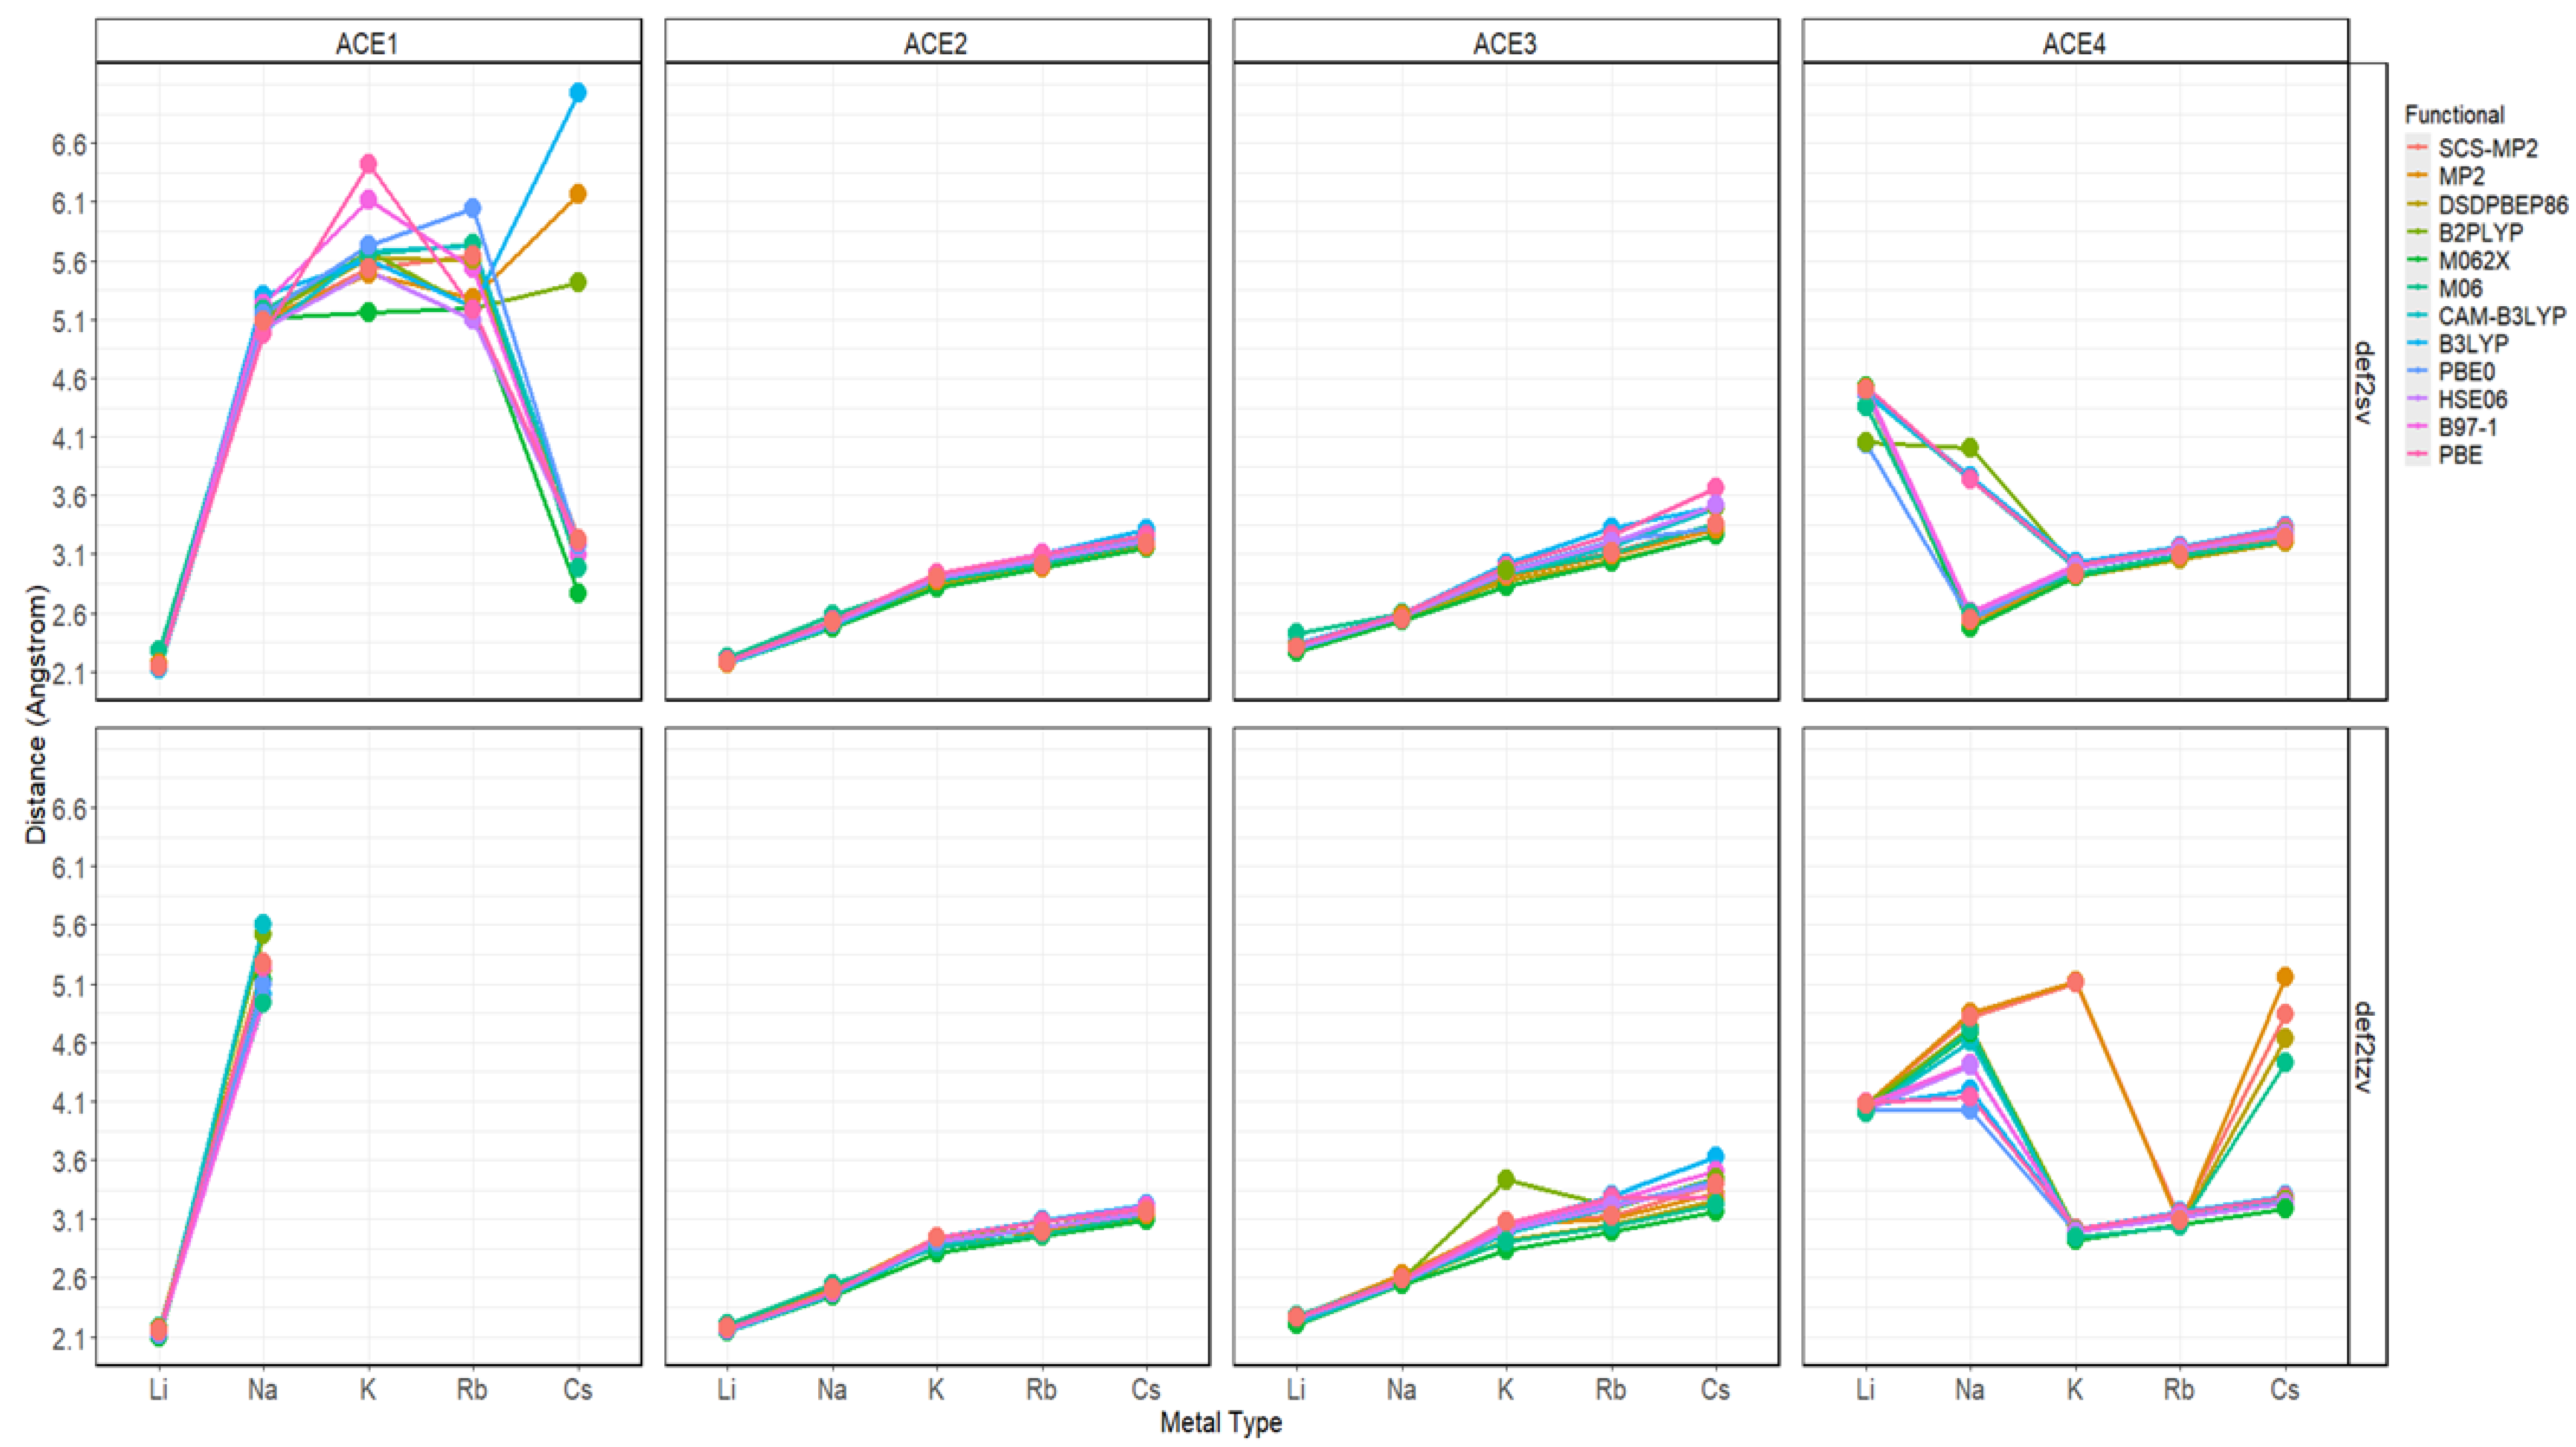
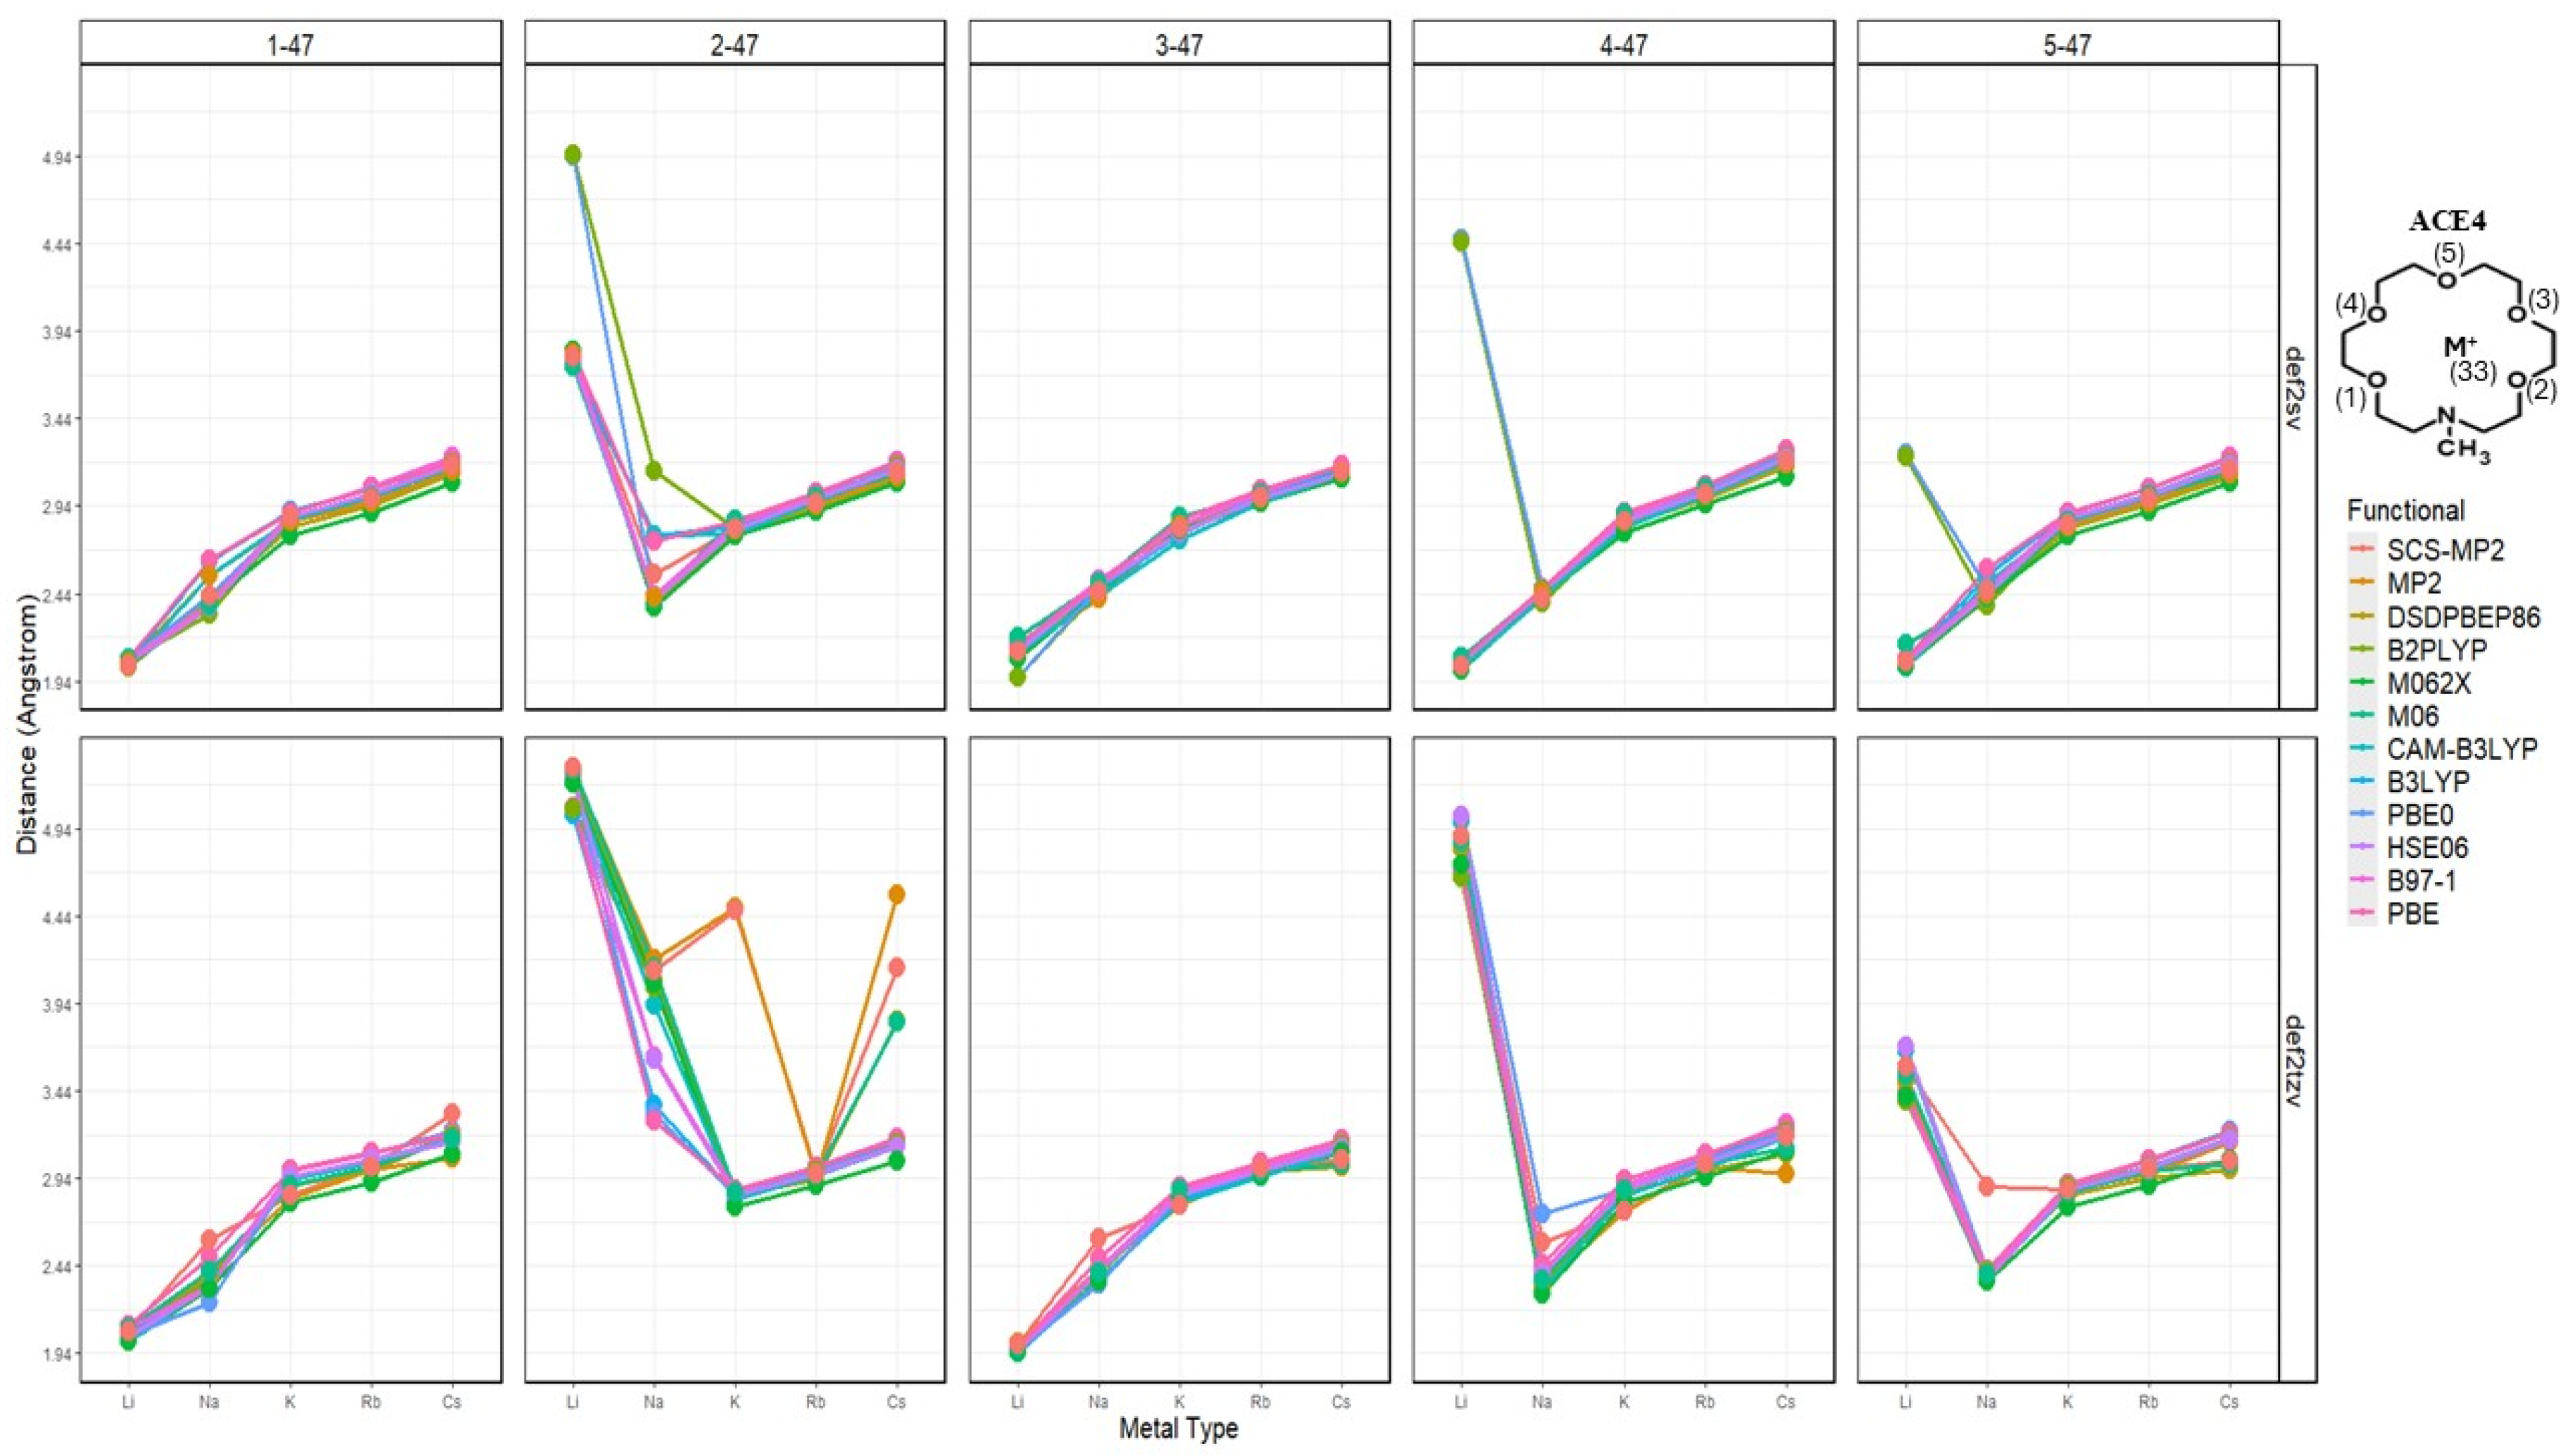
2.2. Atomic Distances of ACE Heteroatoms and Metal Ions
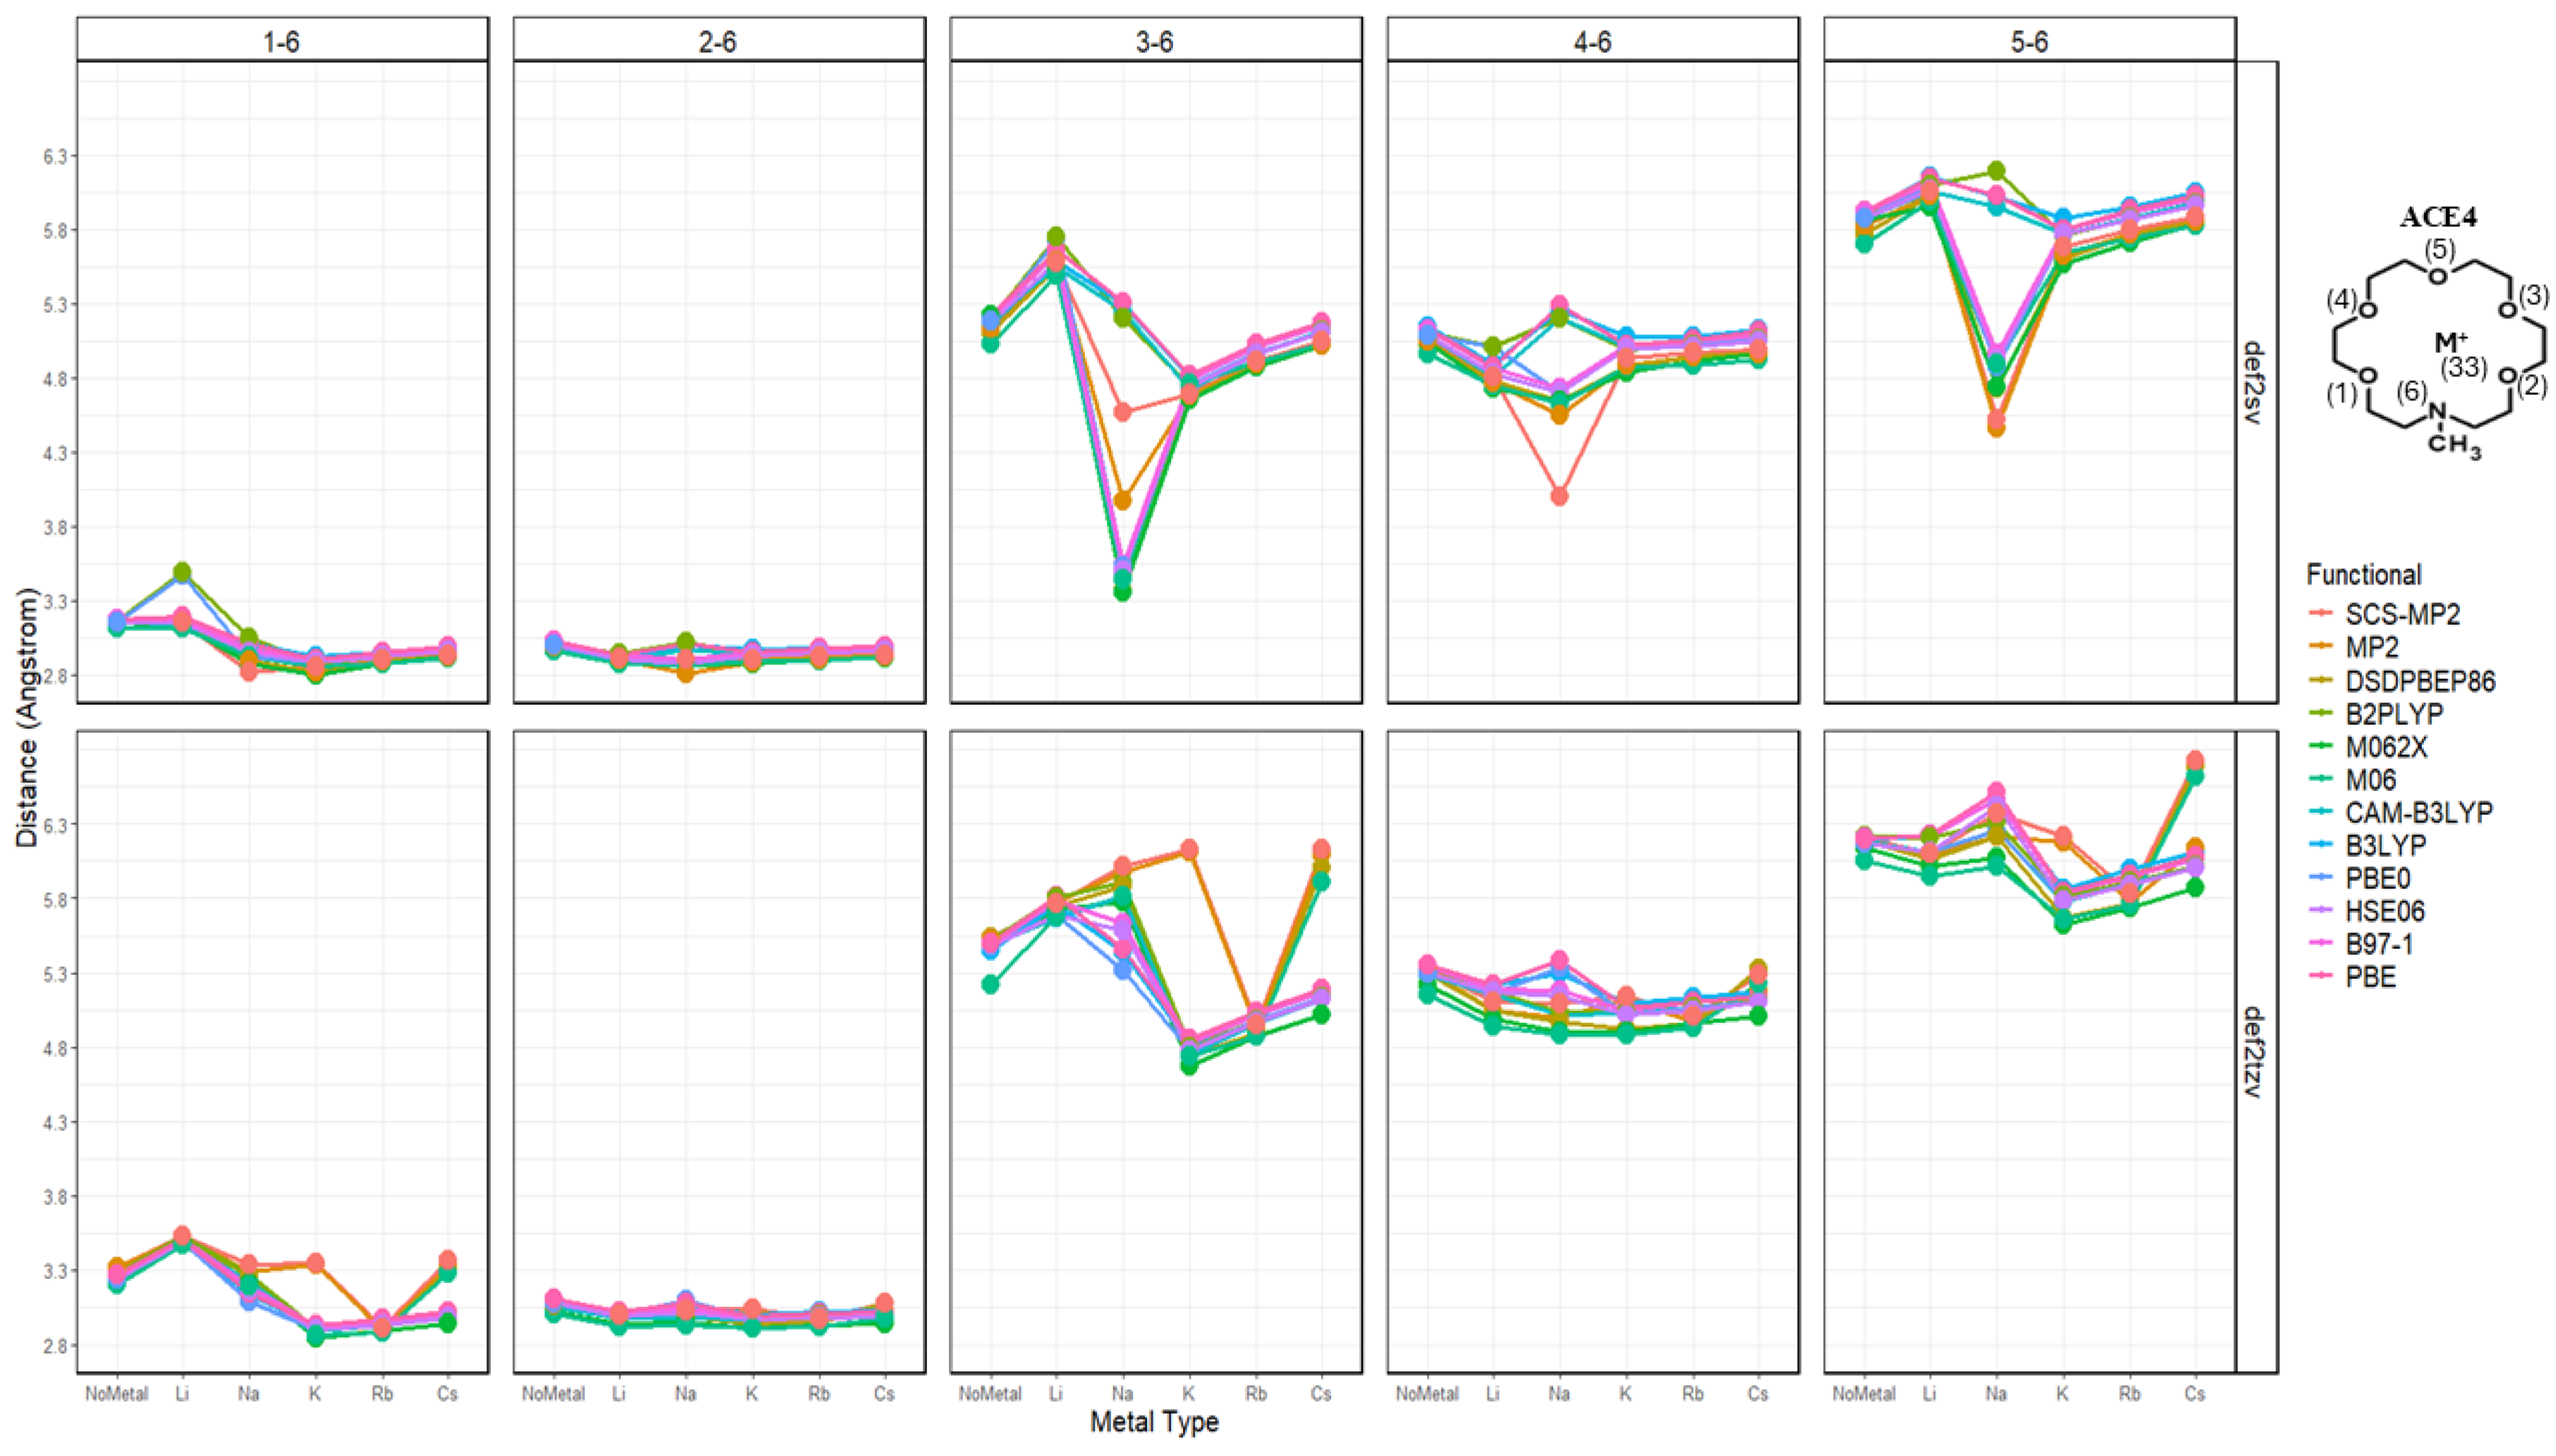
2.3. Nitrogen Distances with Metal Ions and Bonded Oxygen Atoms
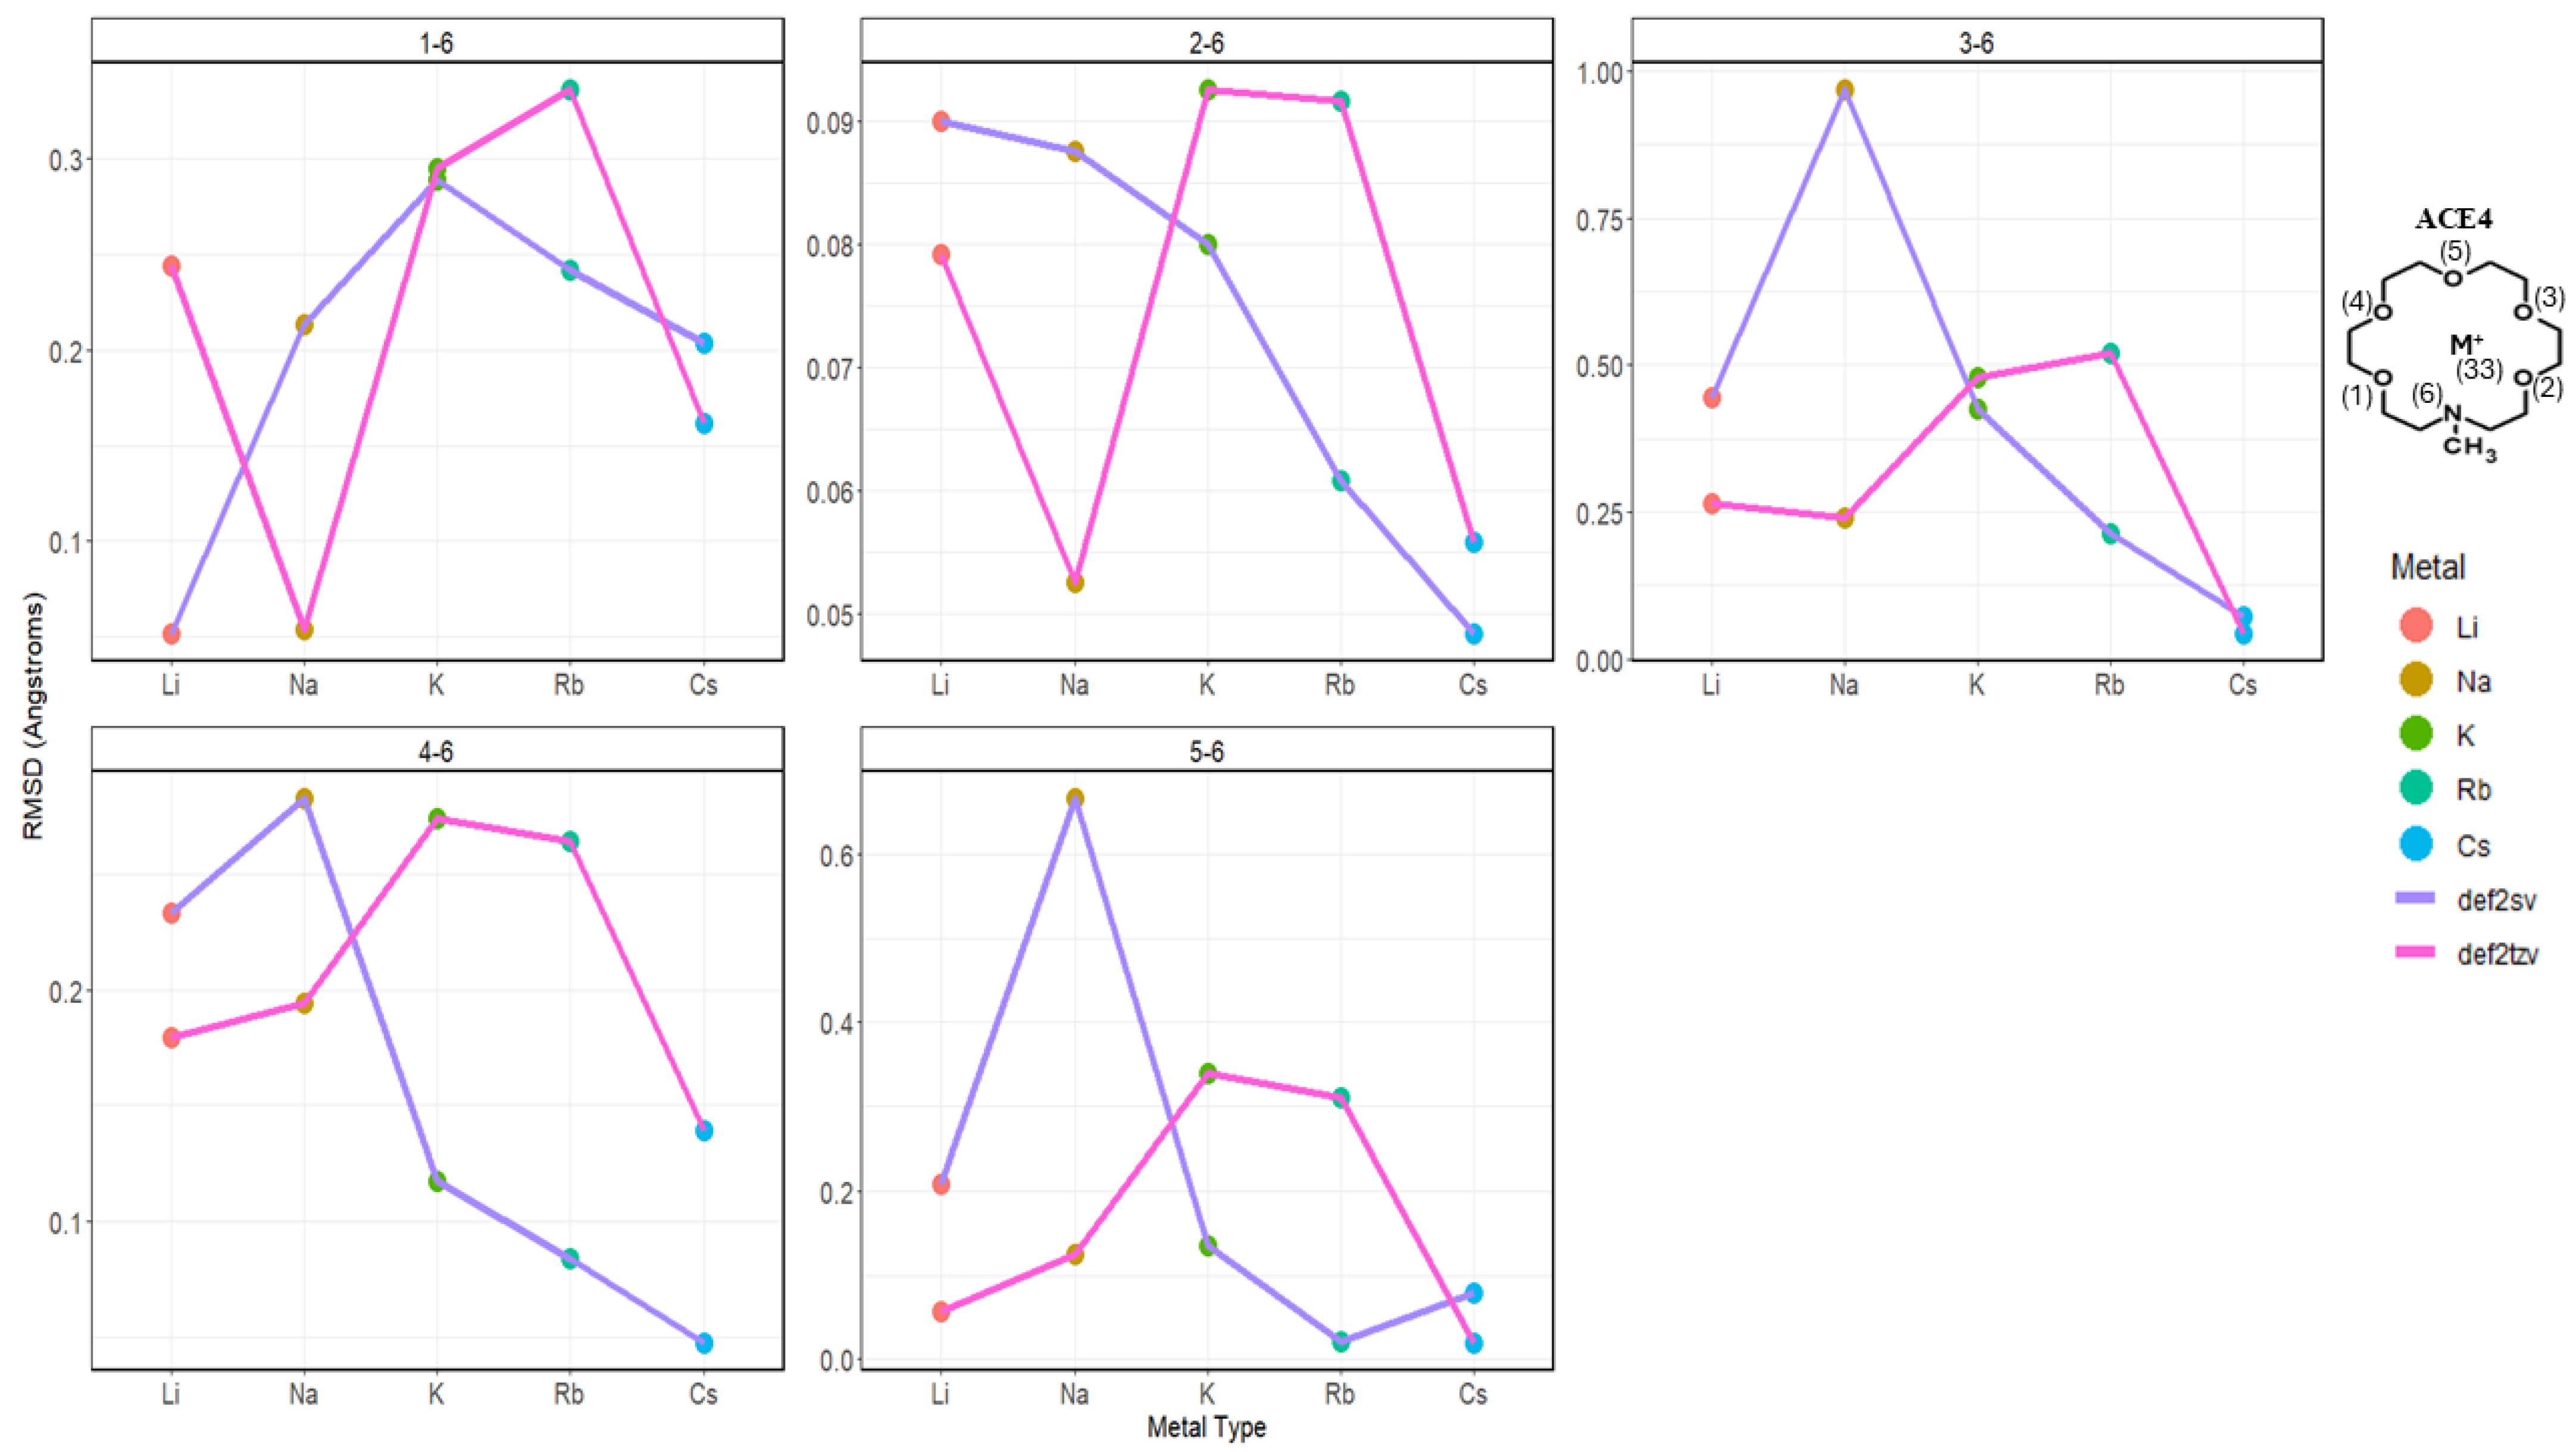
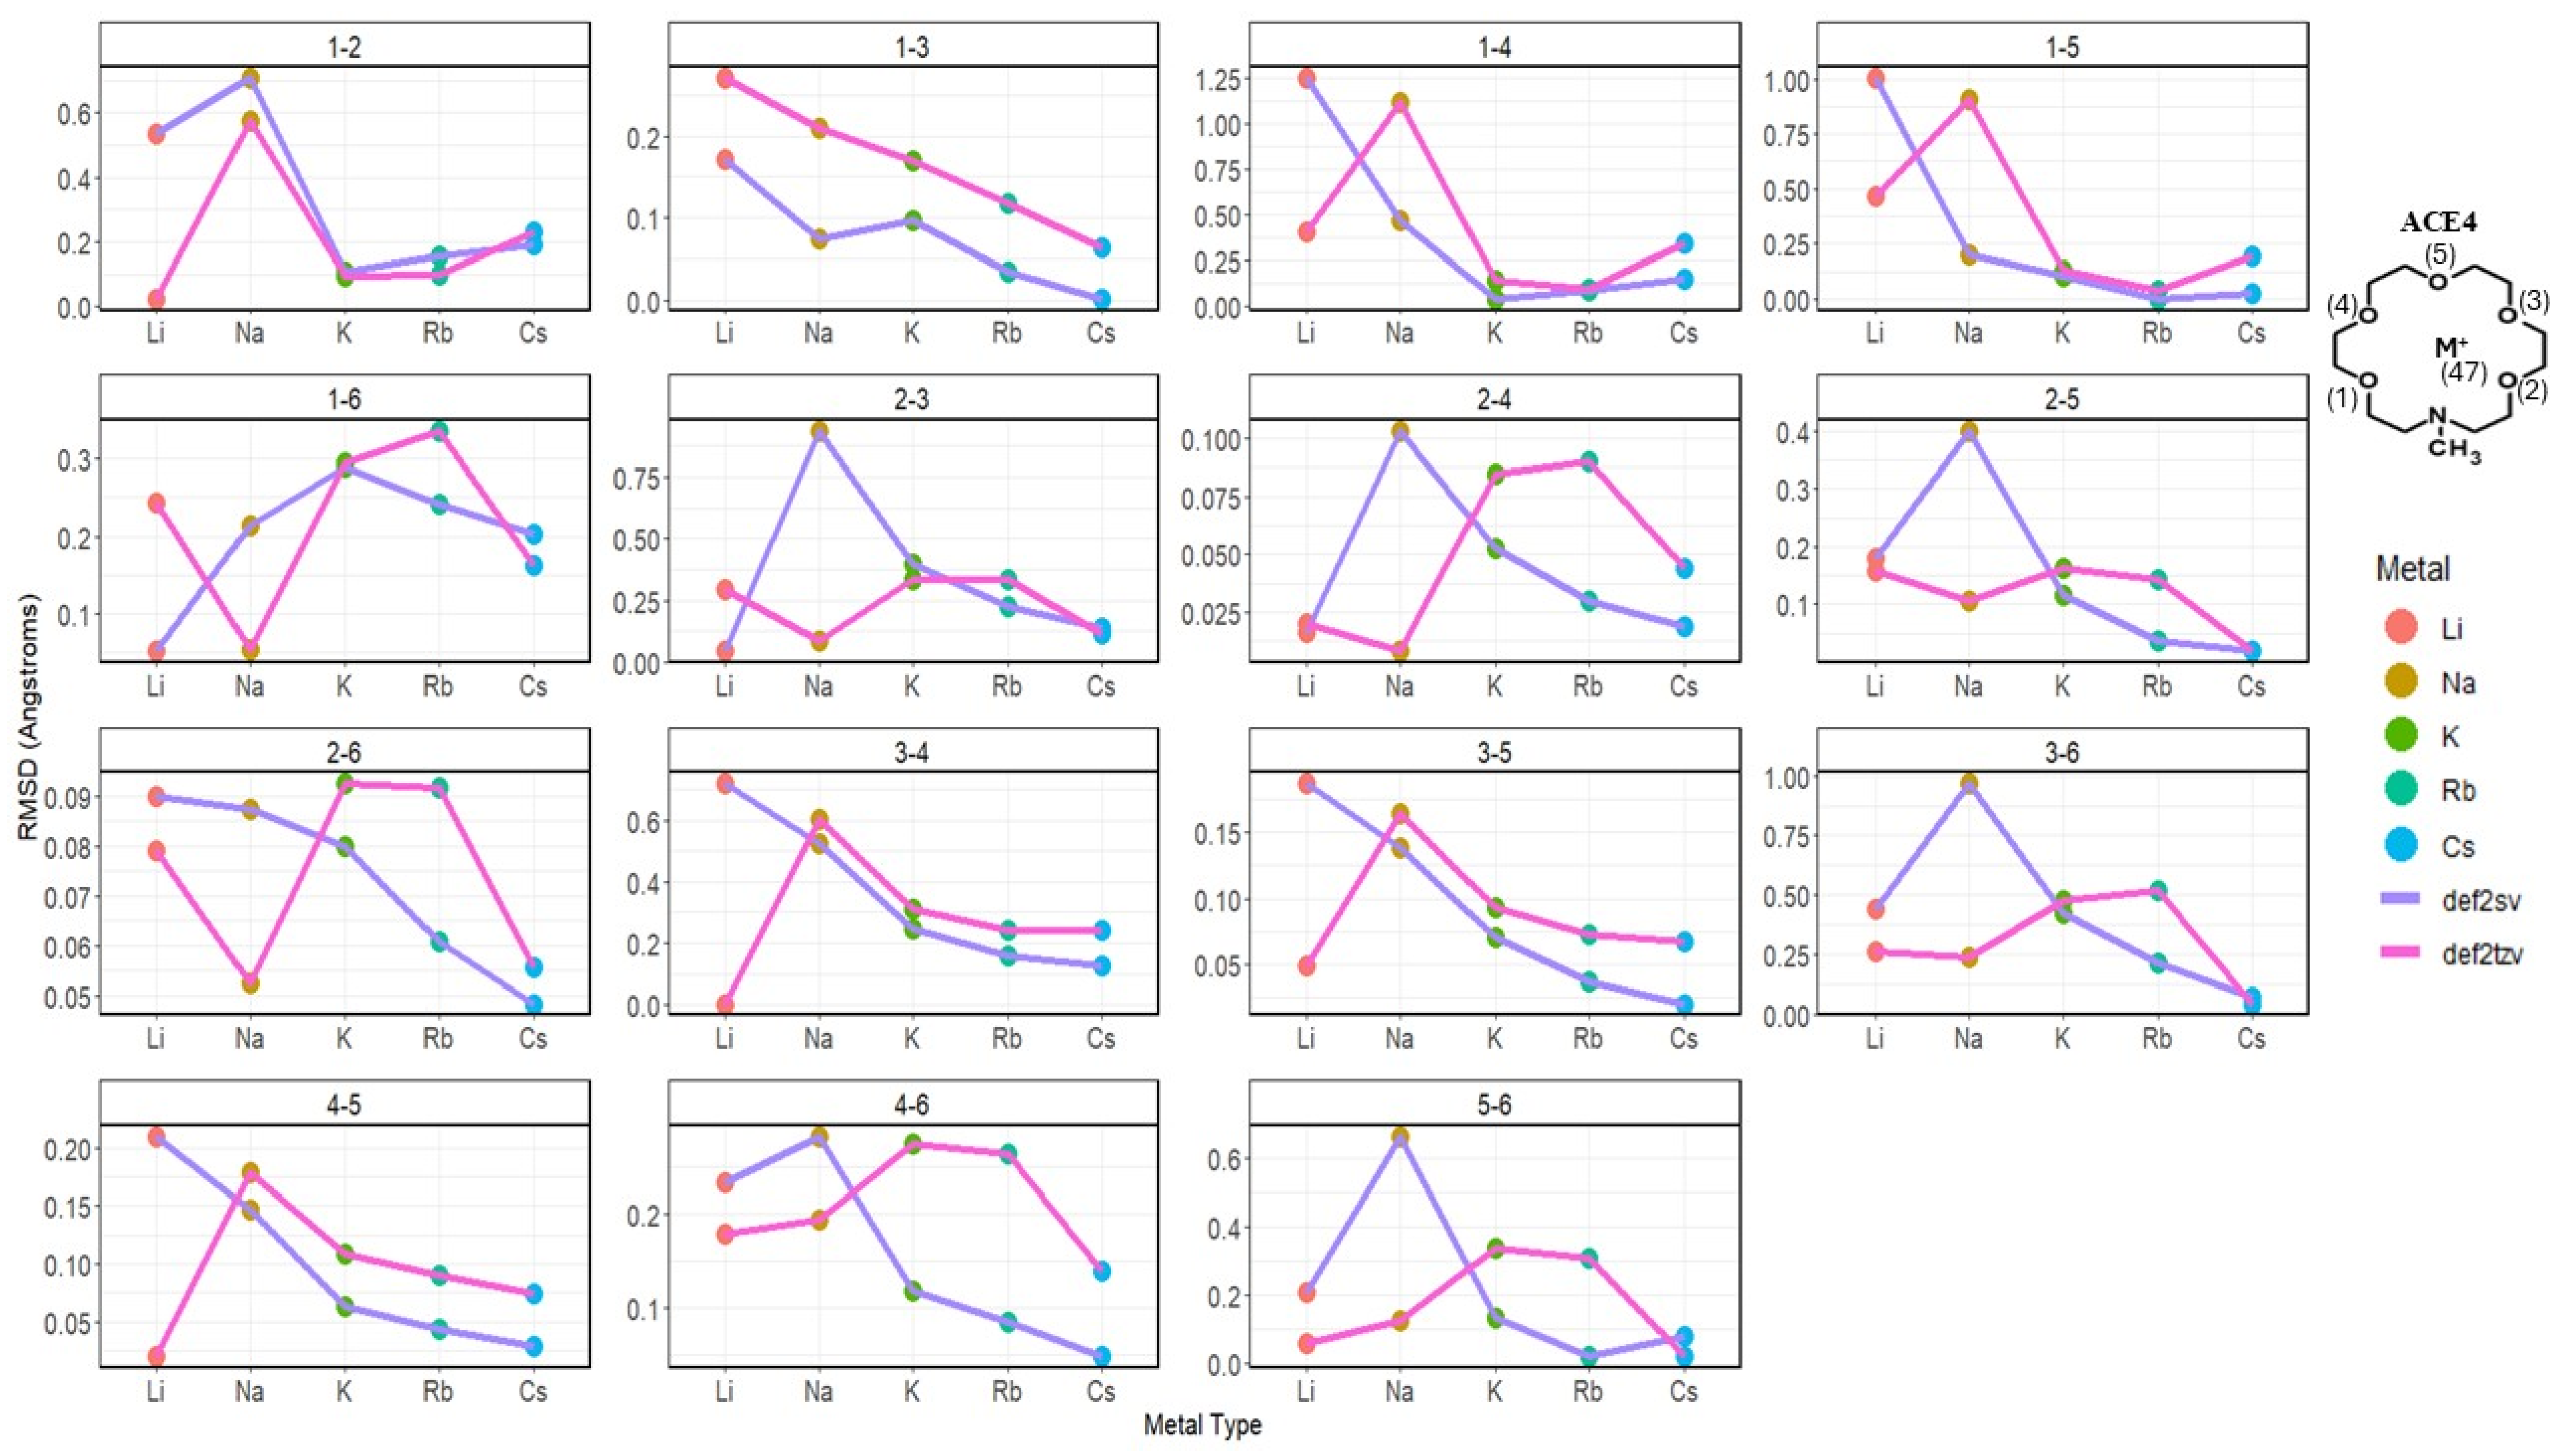
2.4. Oxygen Pairs Distances
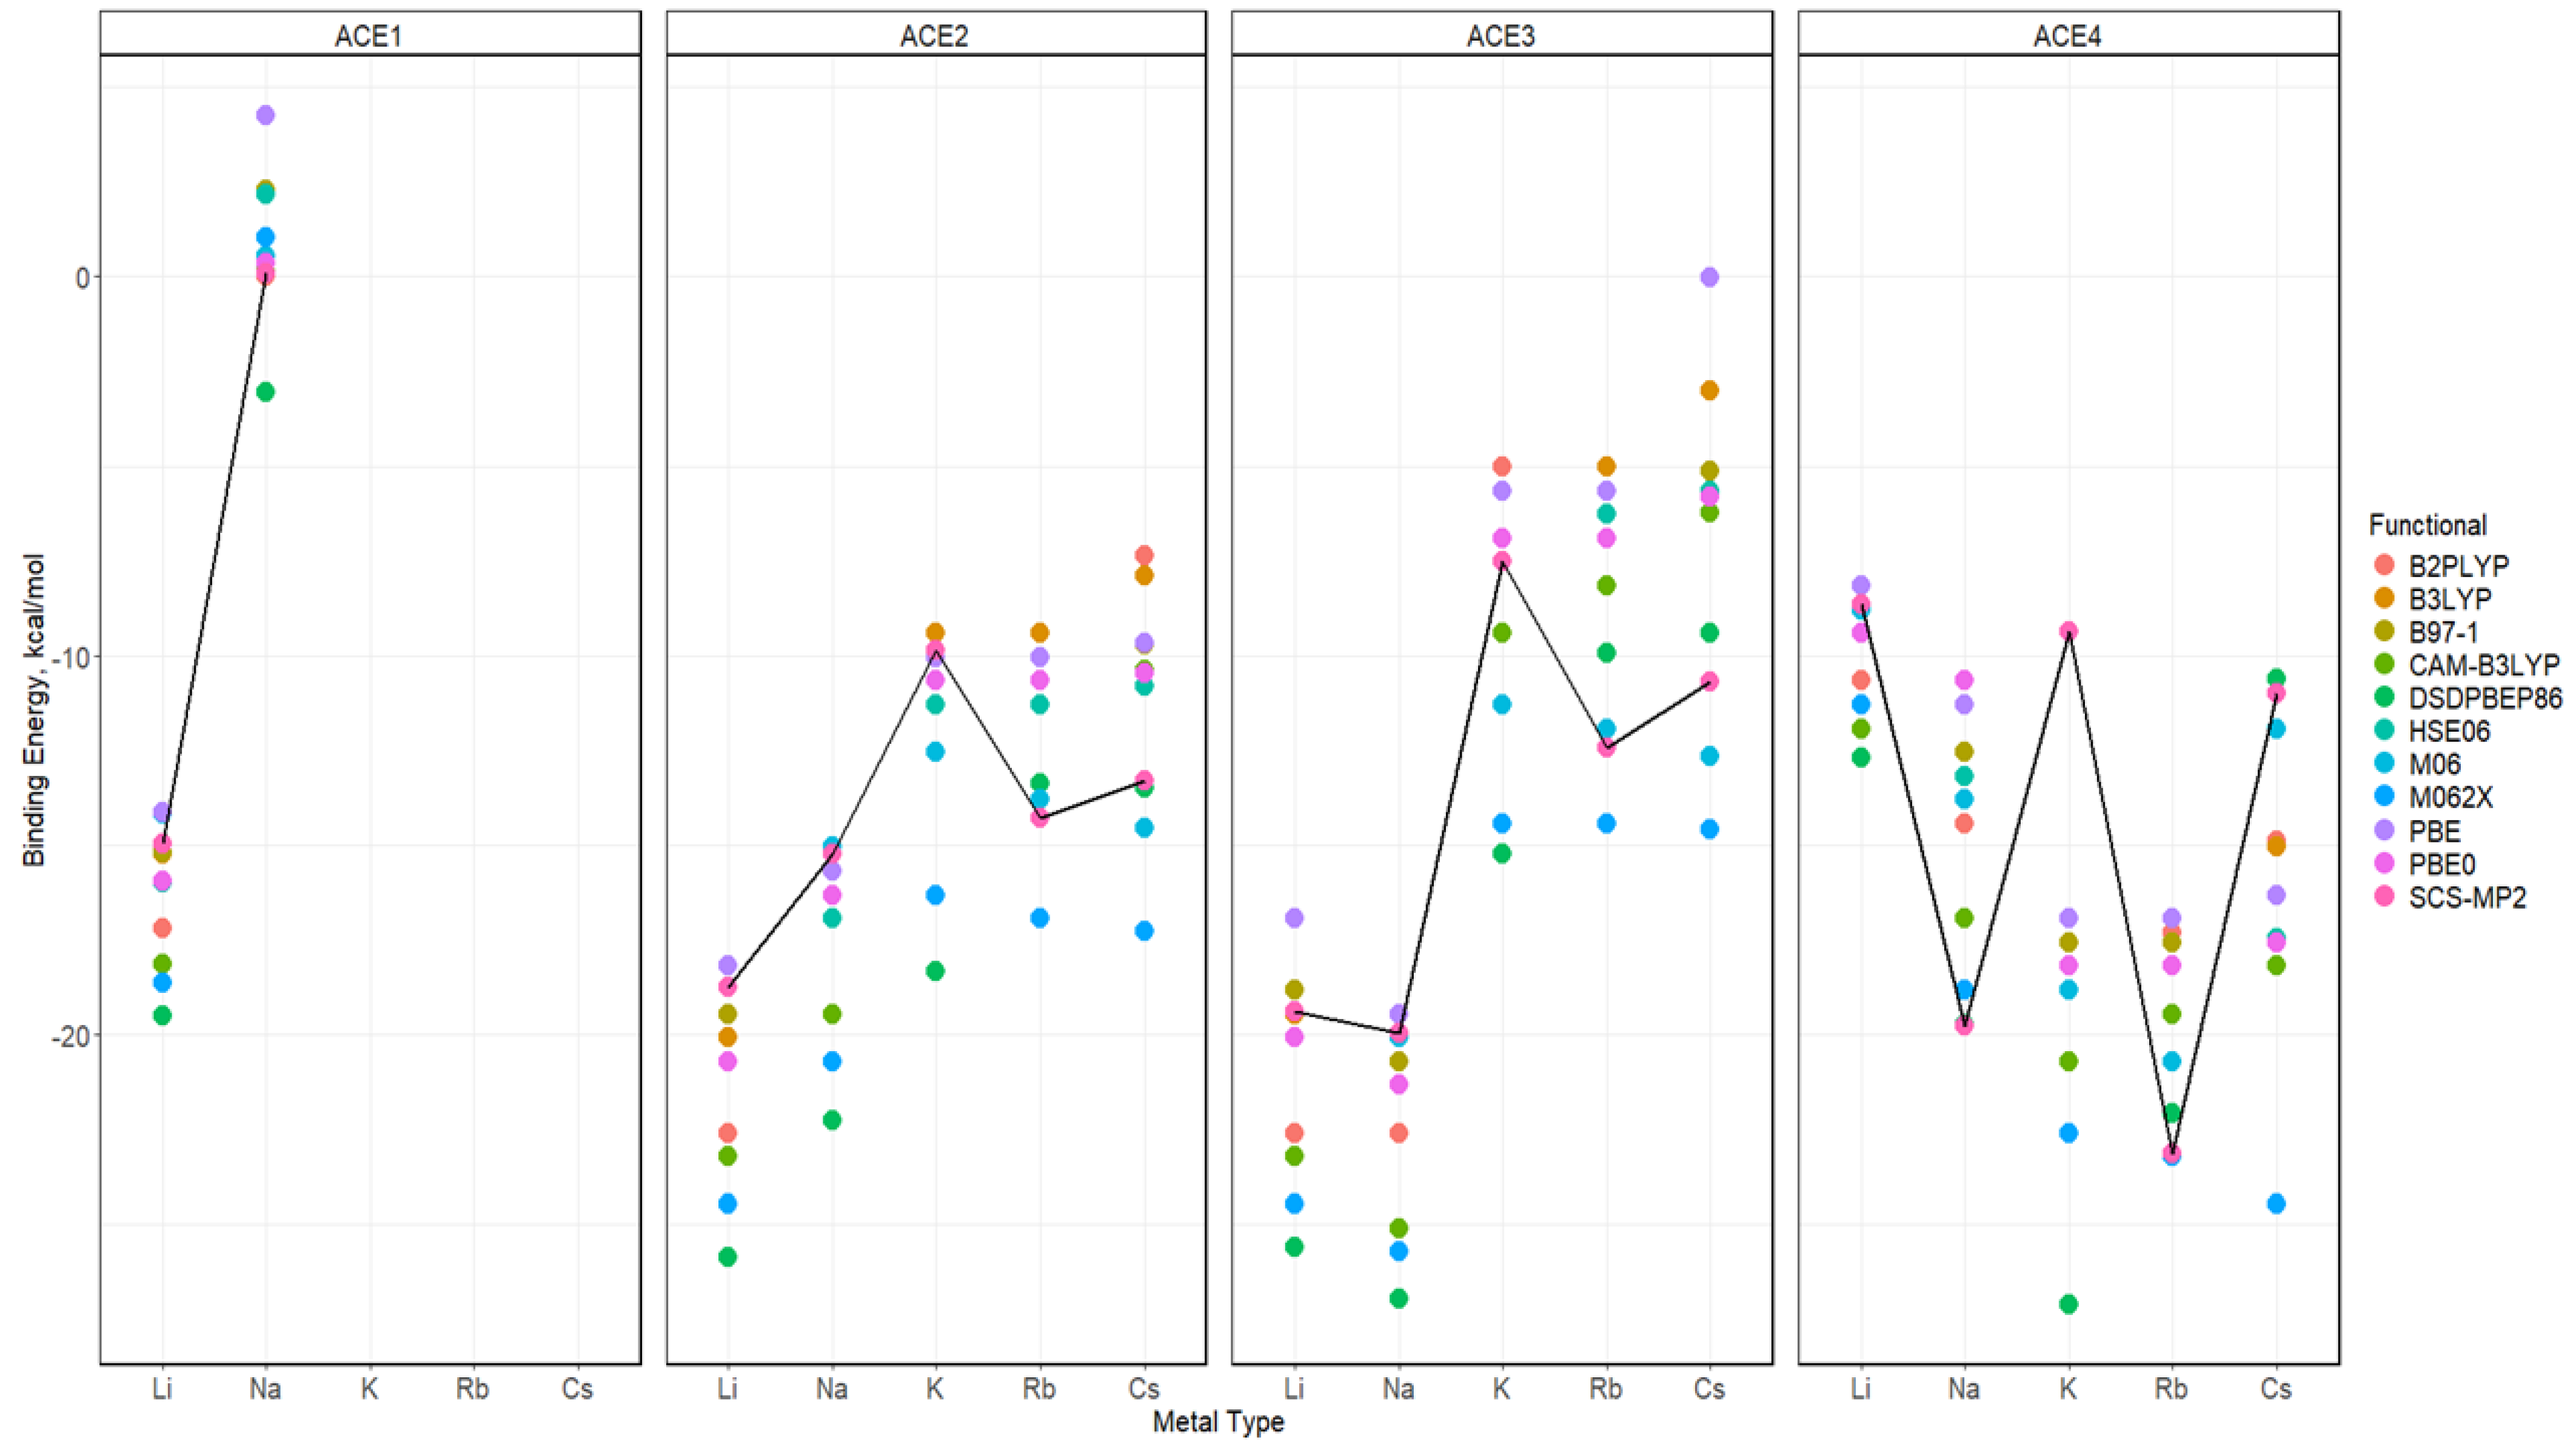
2.5. Binding Energy of ACE-M+ Complexations Based on def2sv
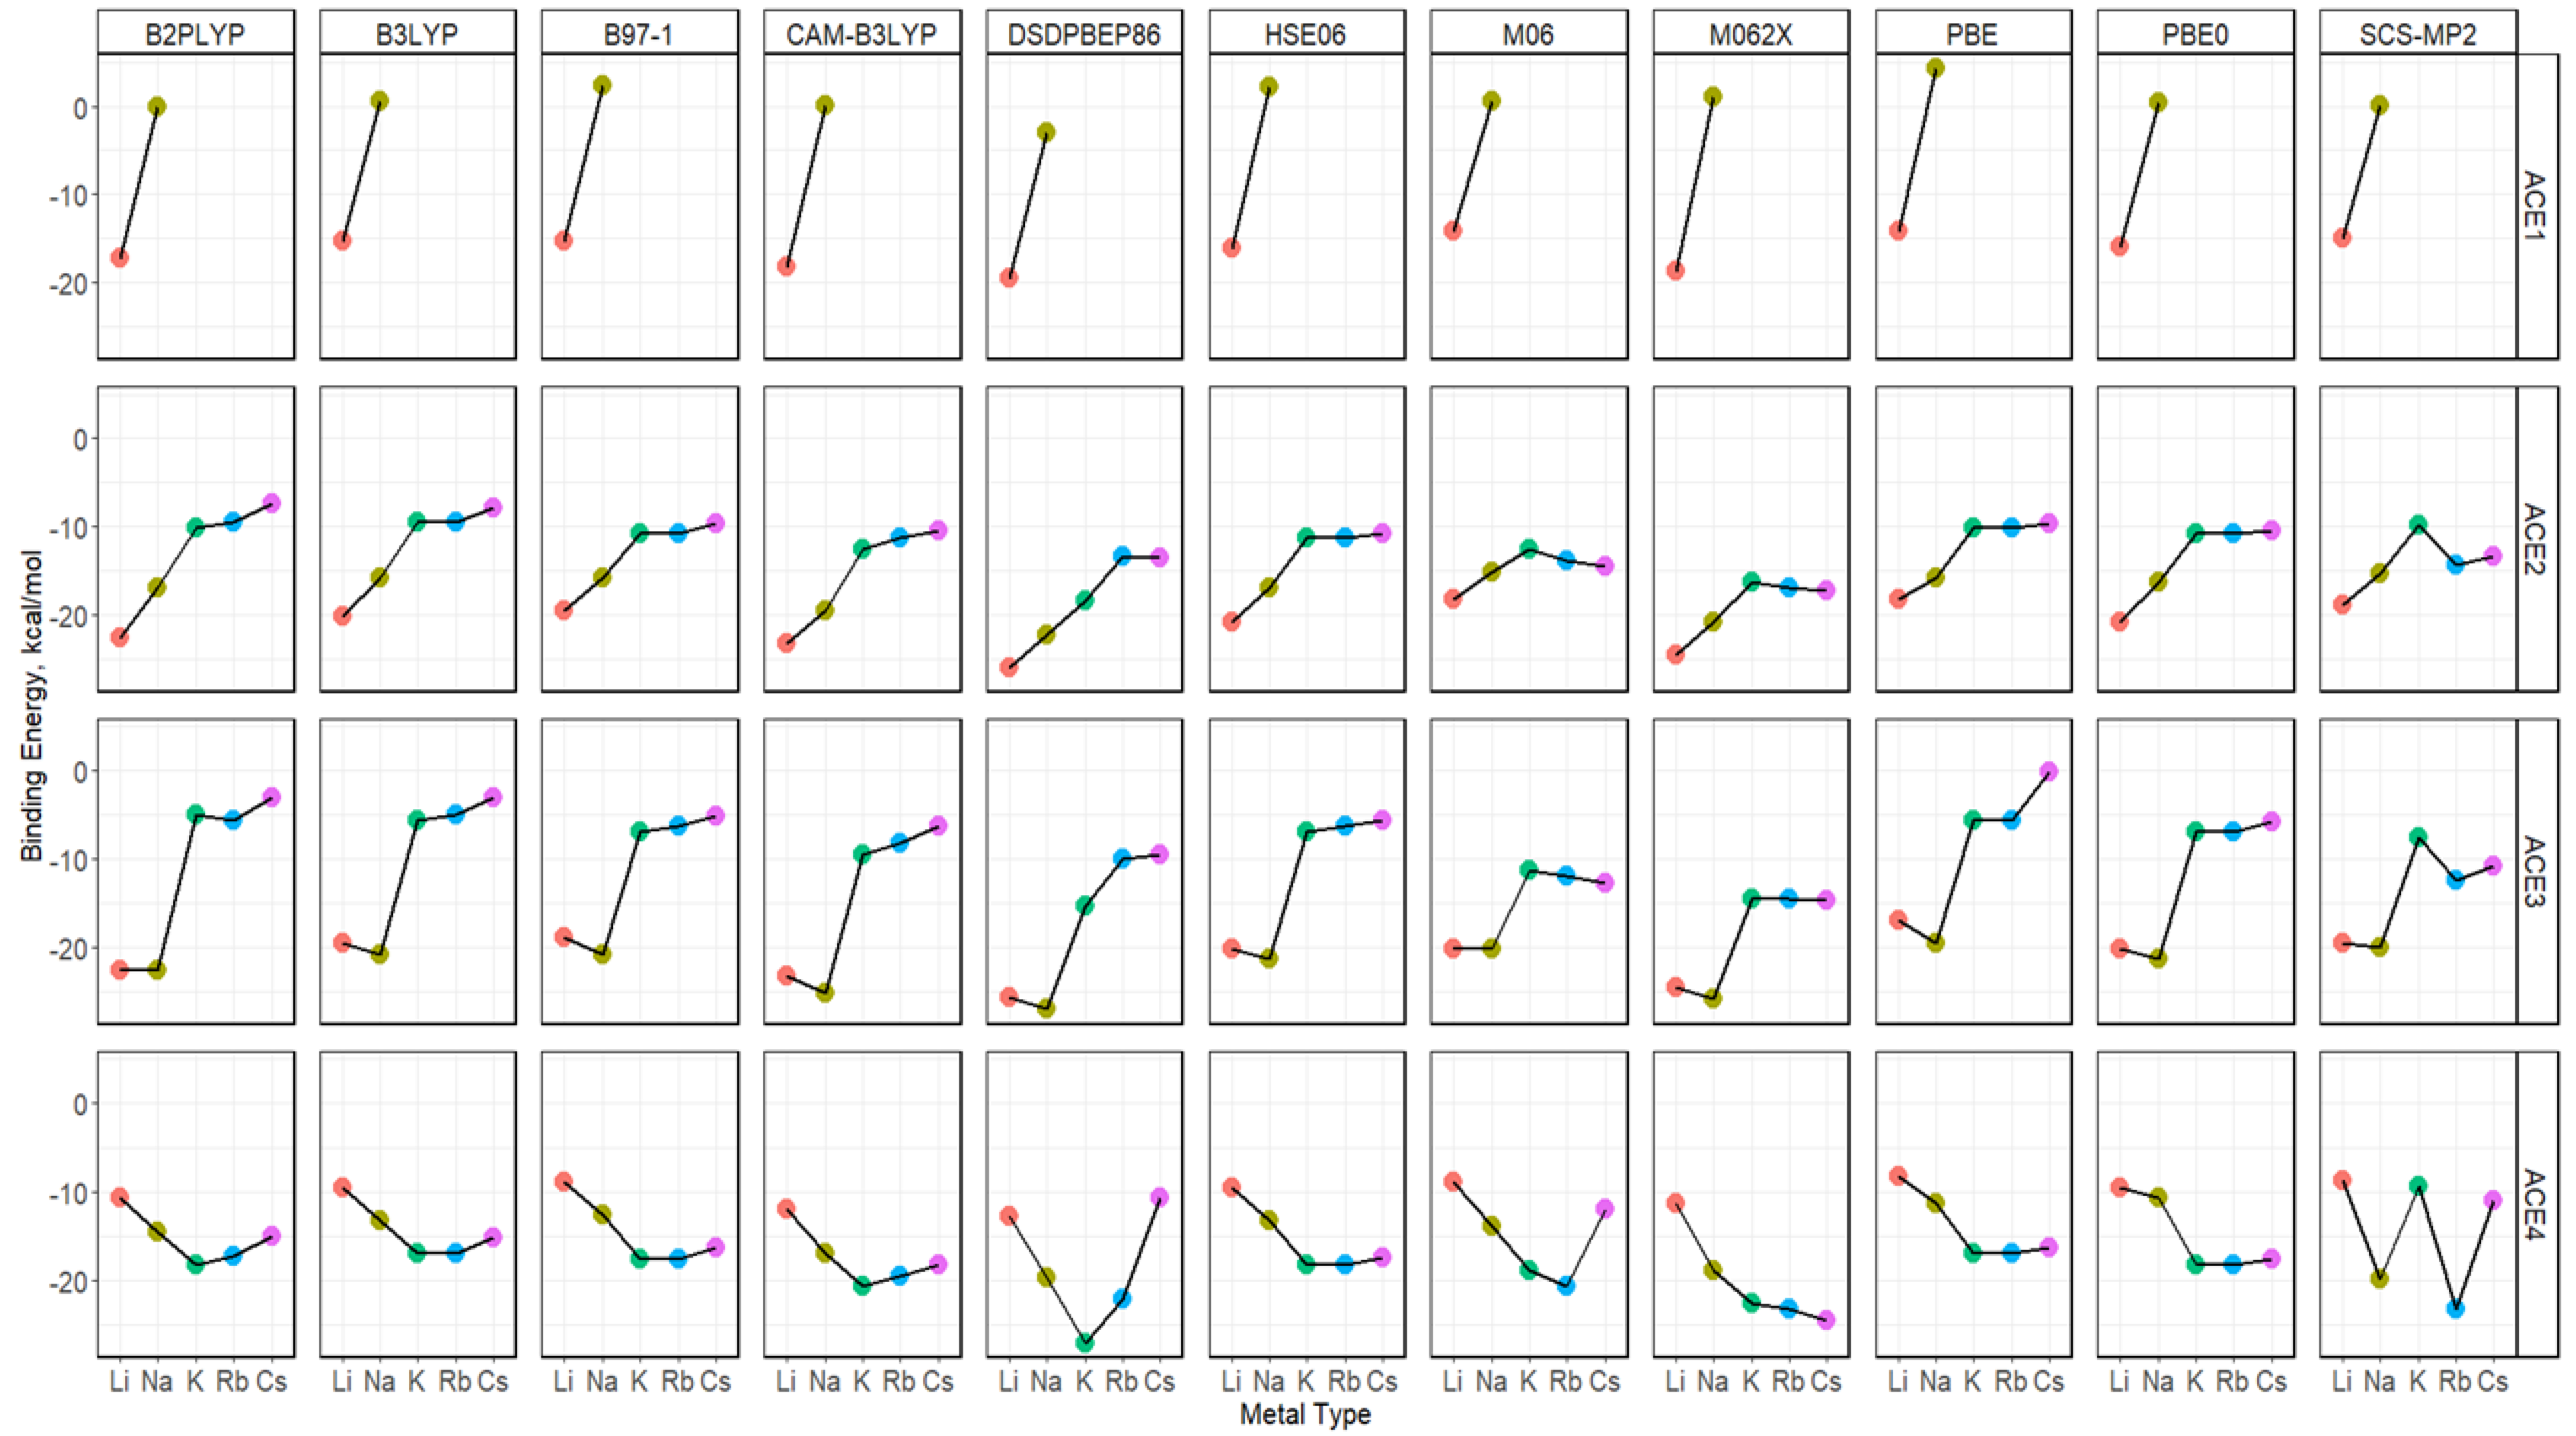
2.6. Binding Energy of ACE-M+ Complexations Based on def2tzv
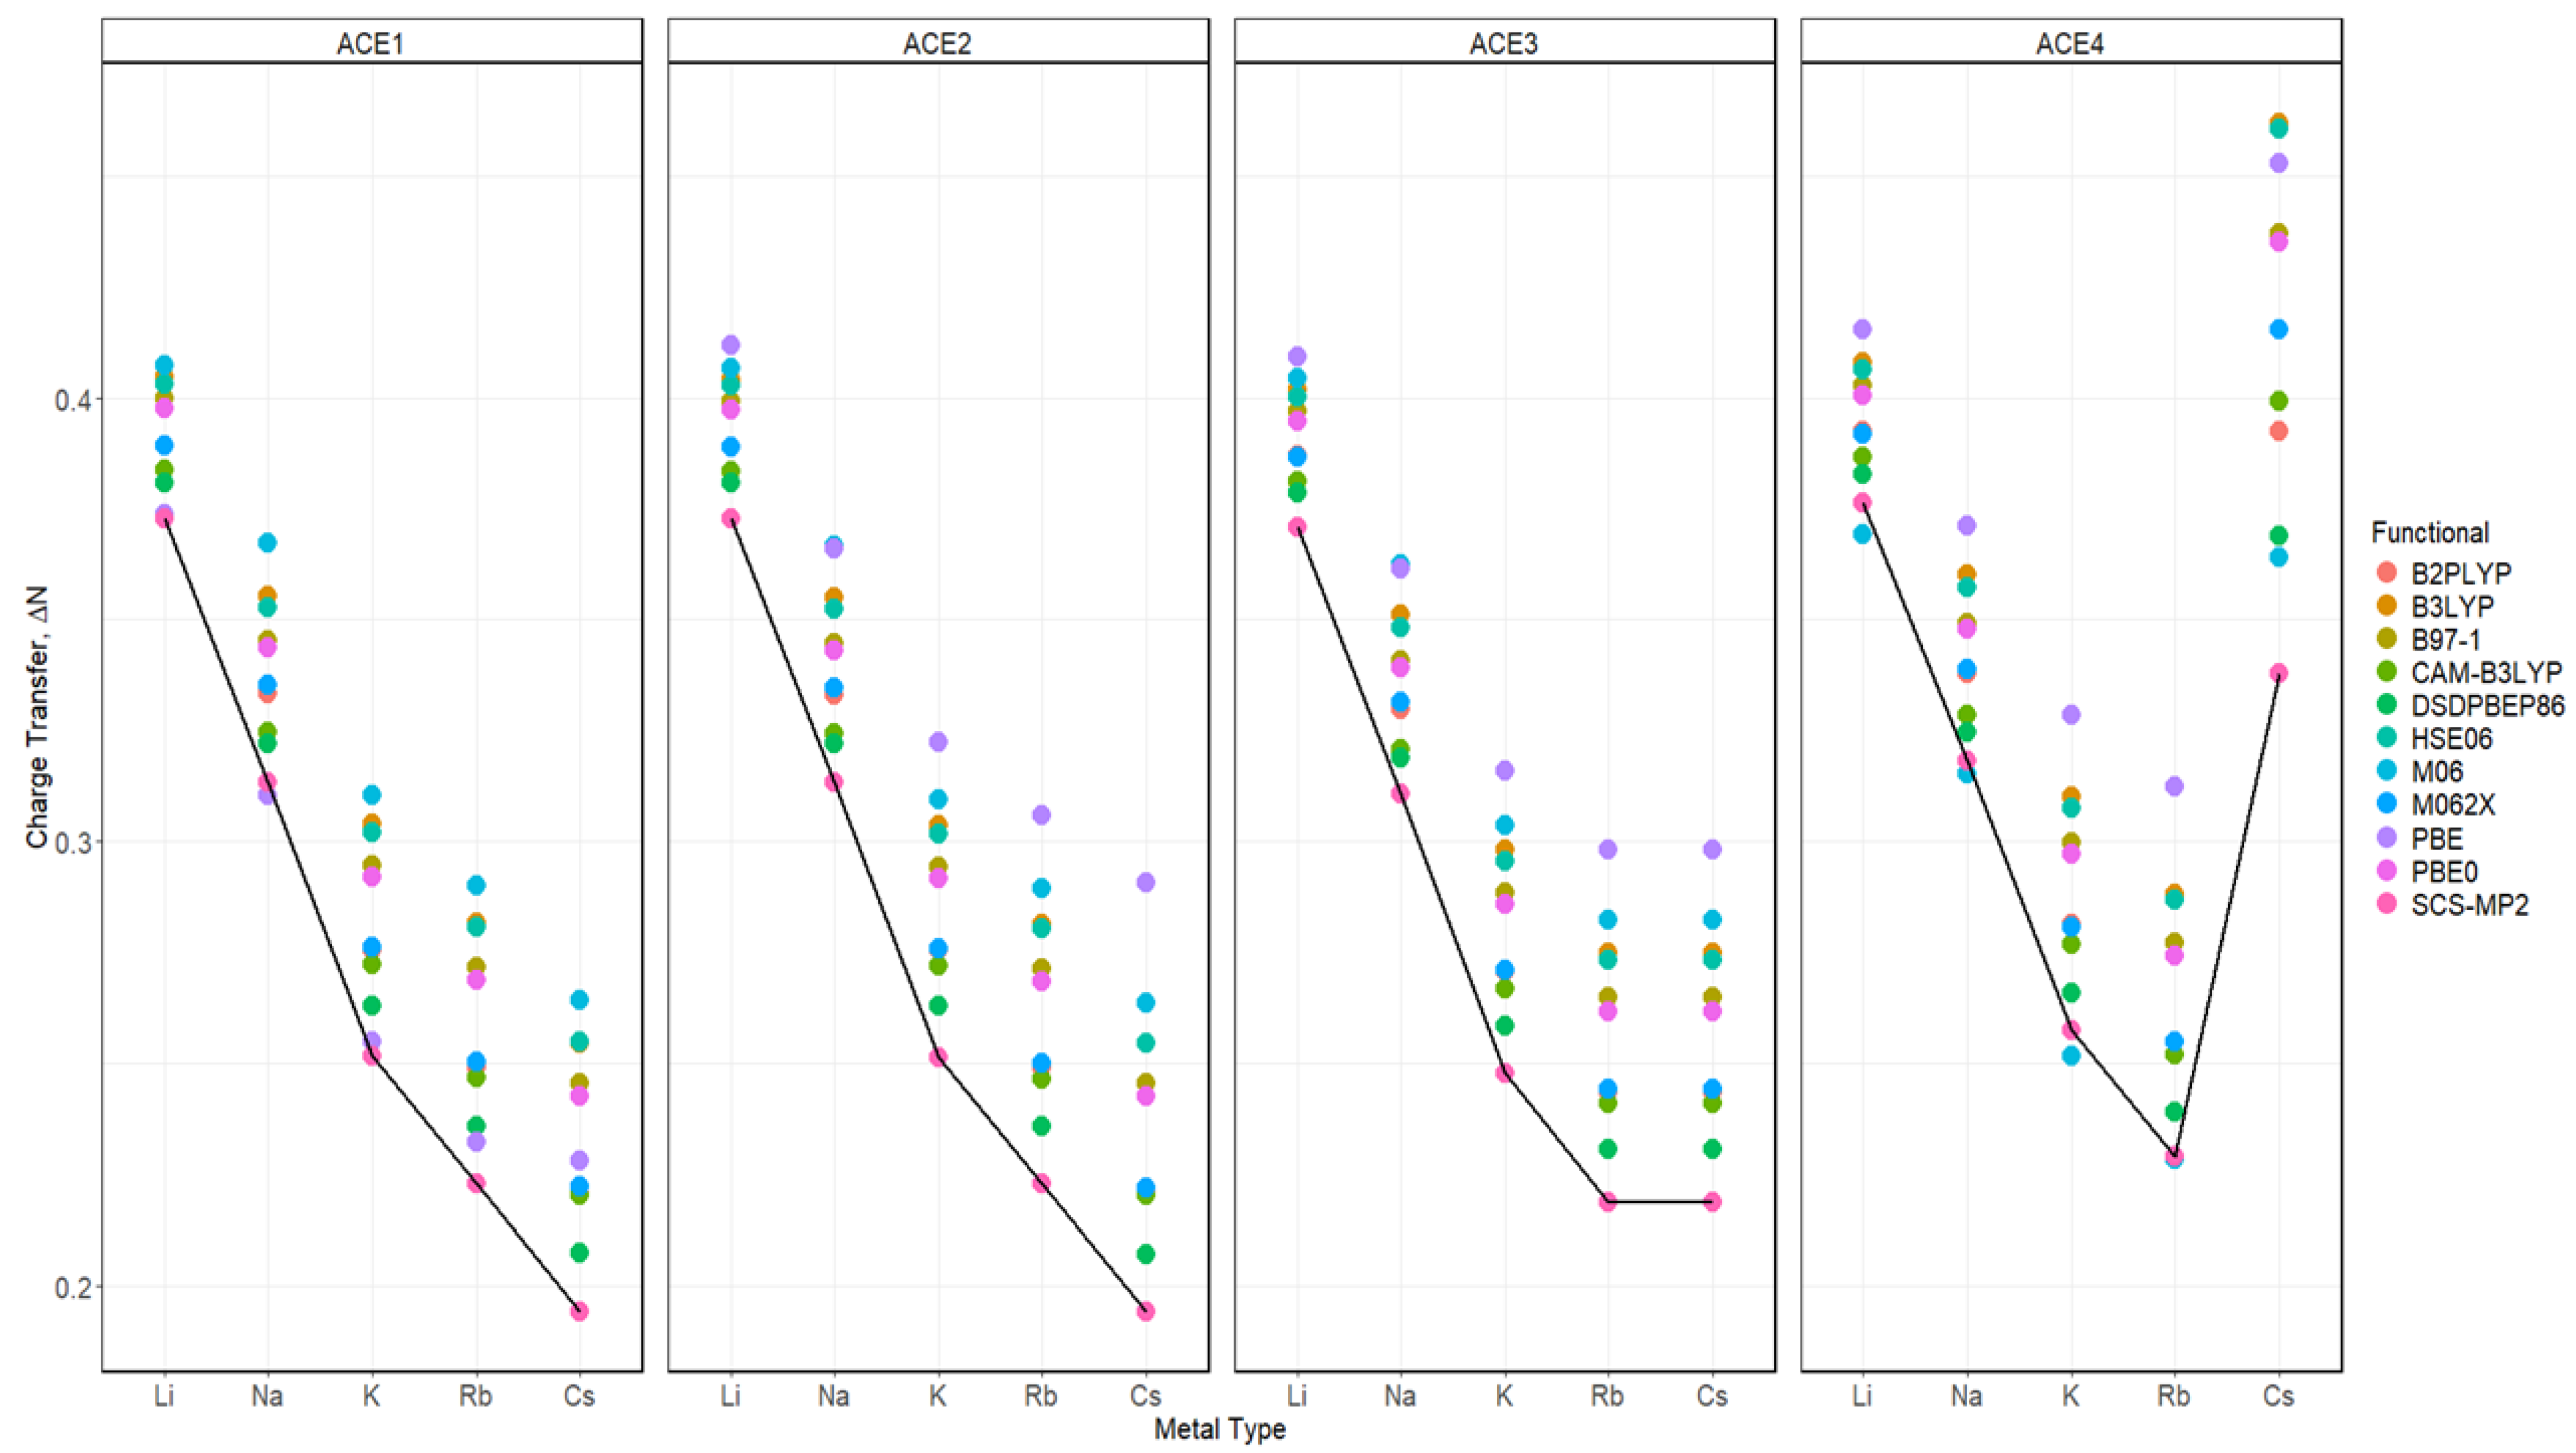
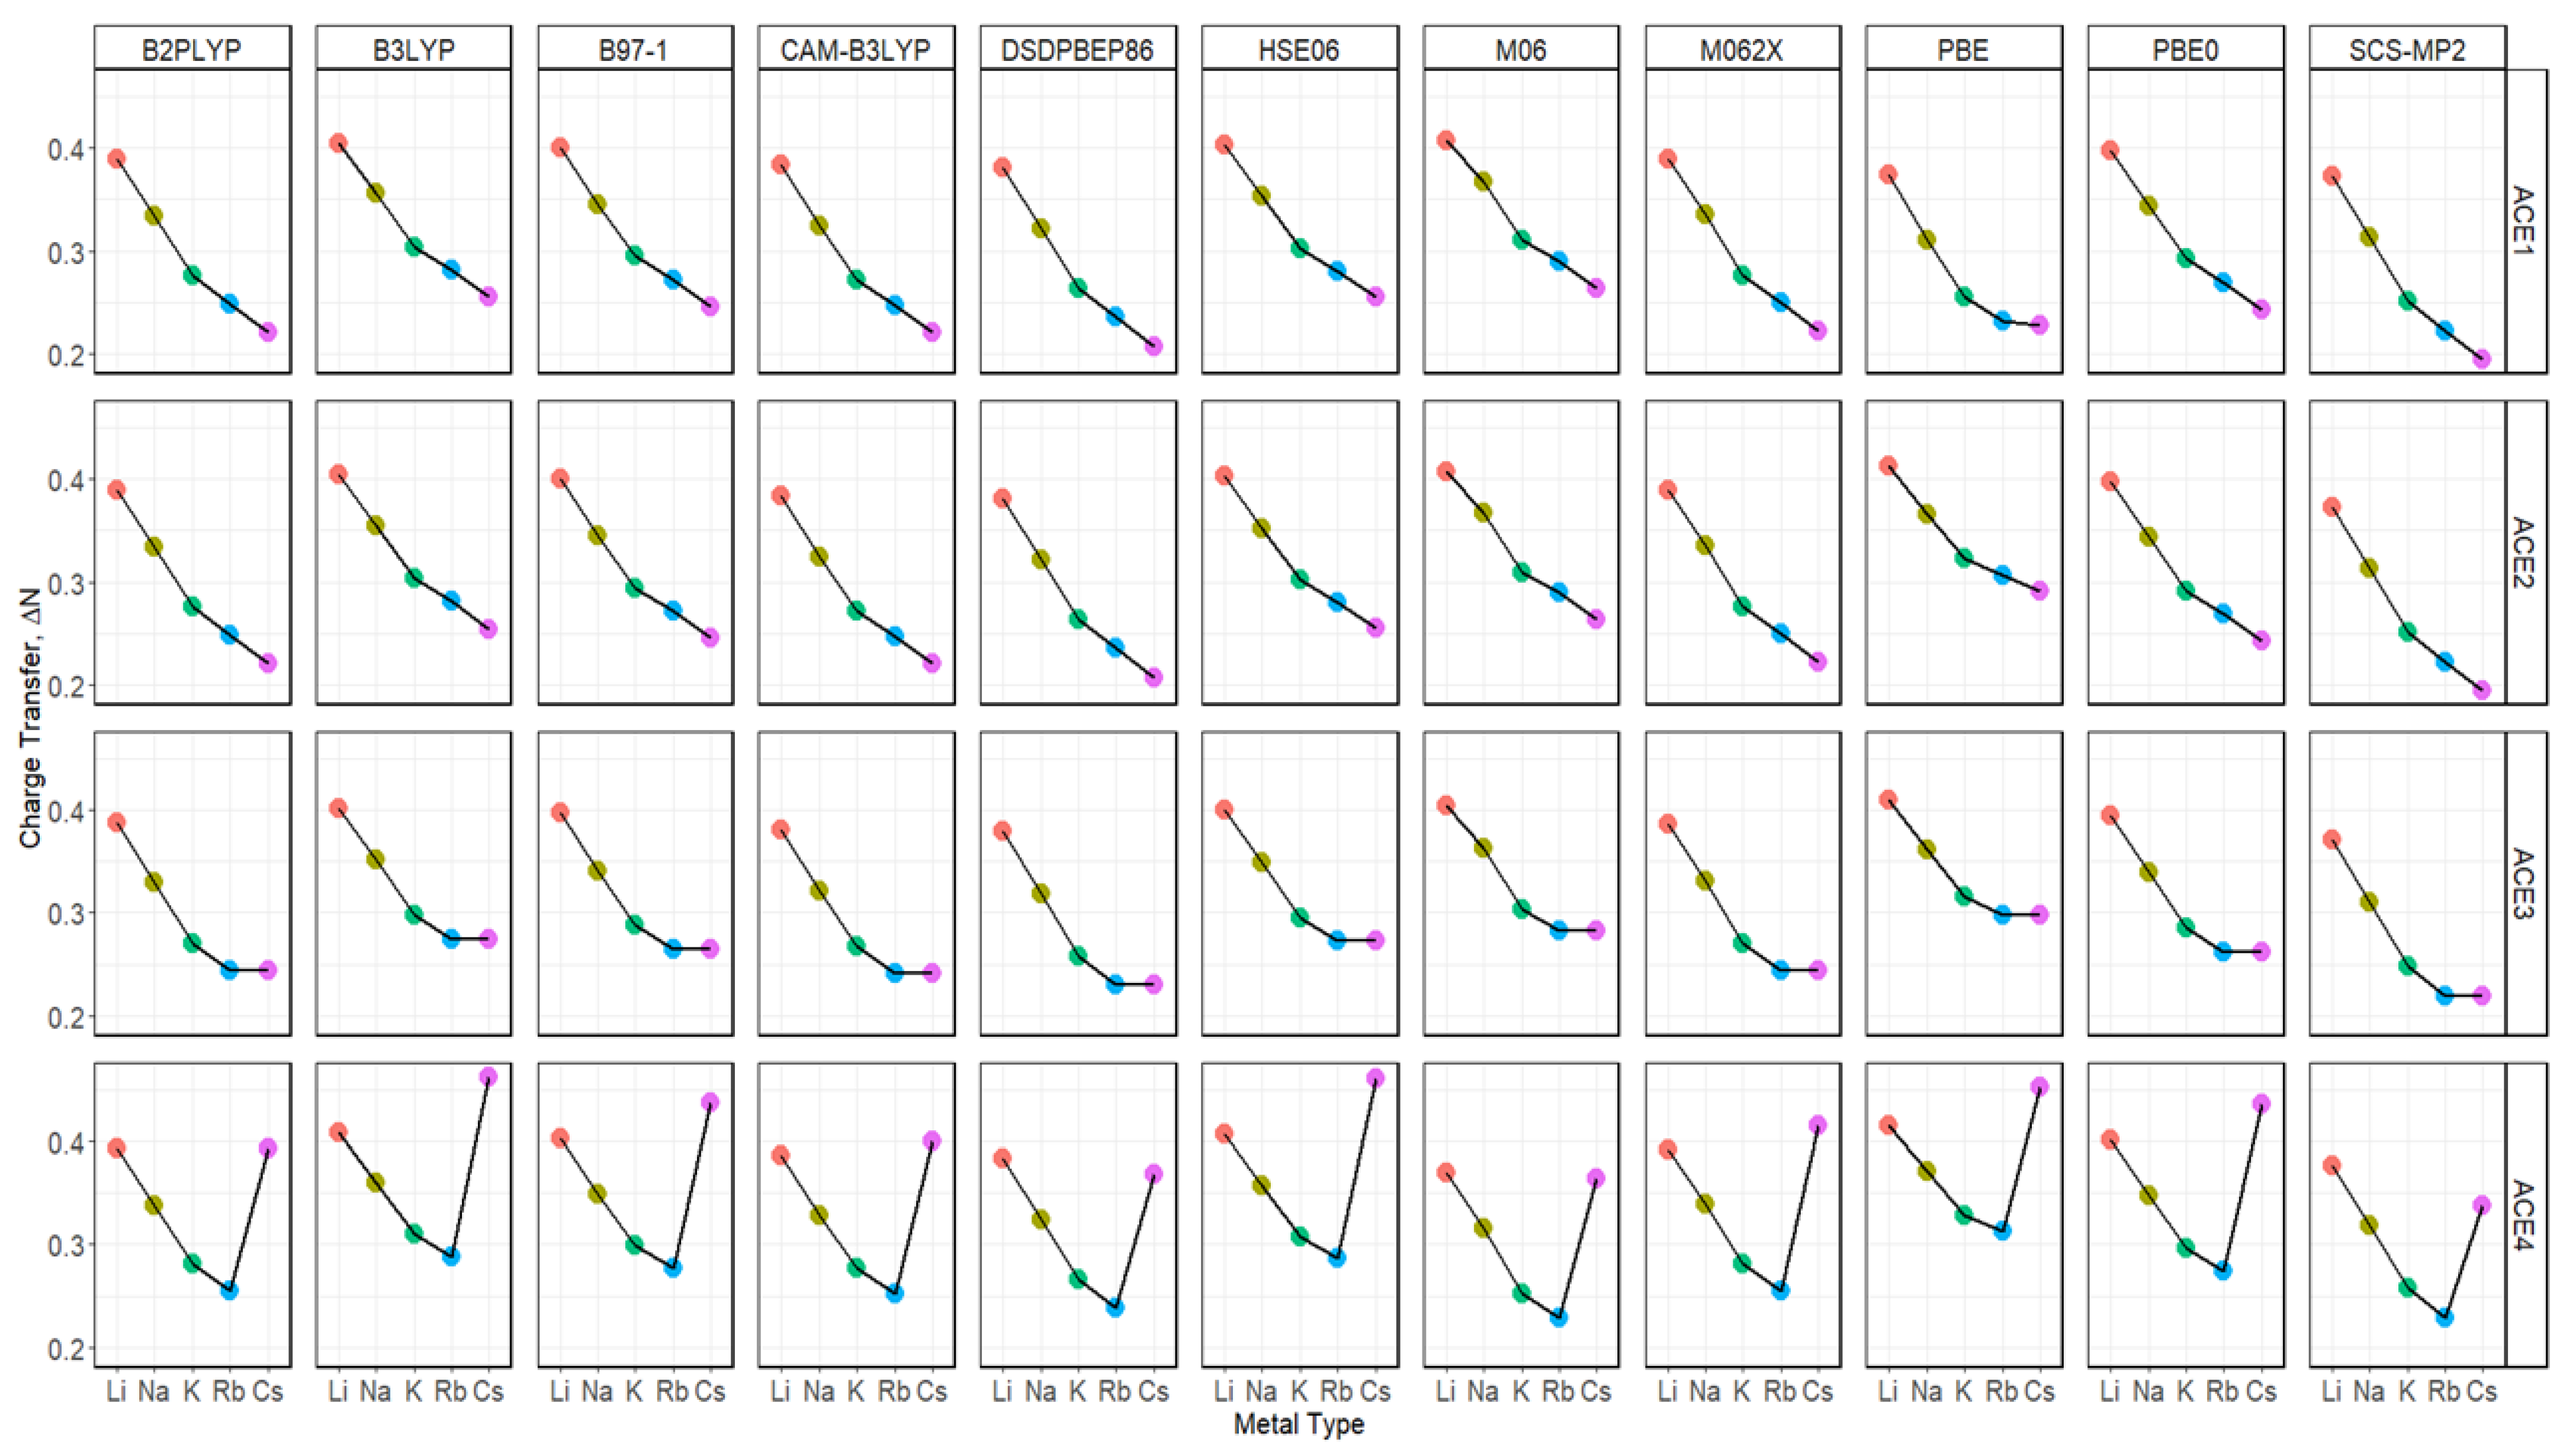
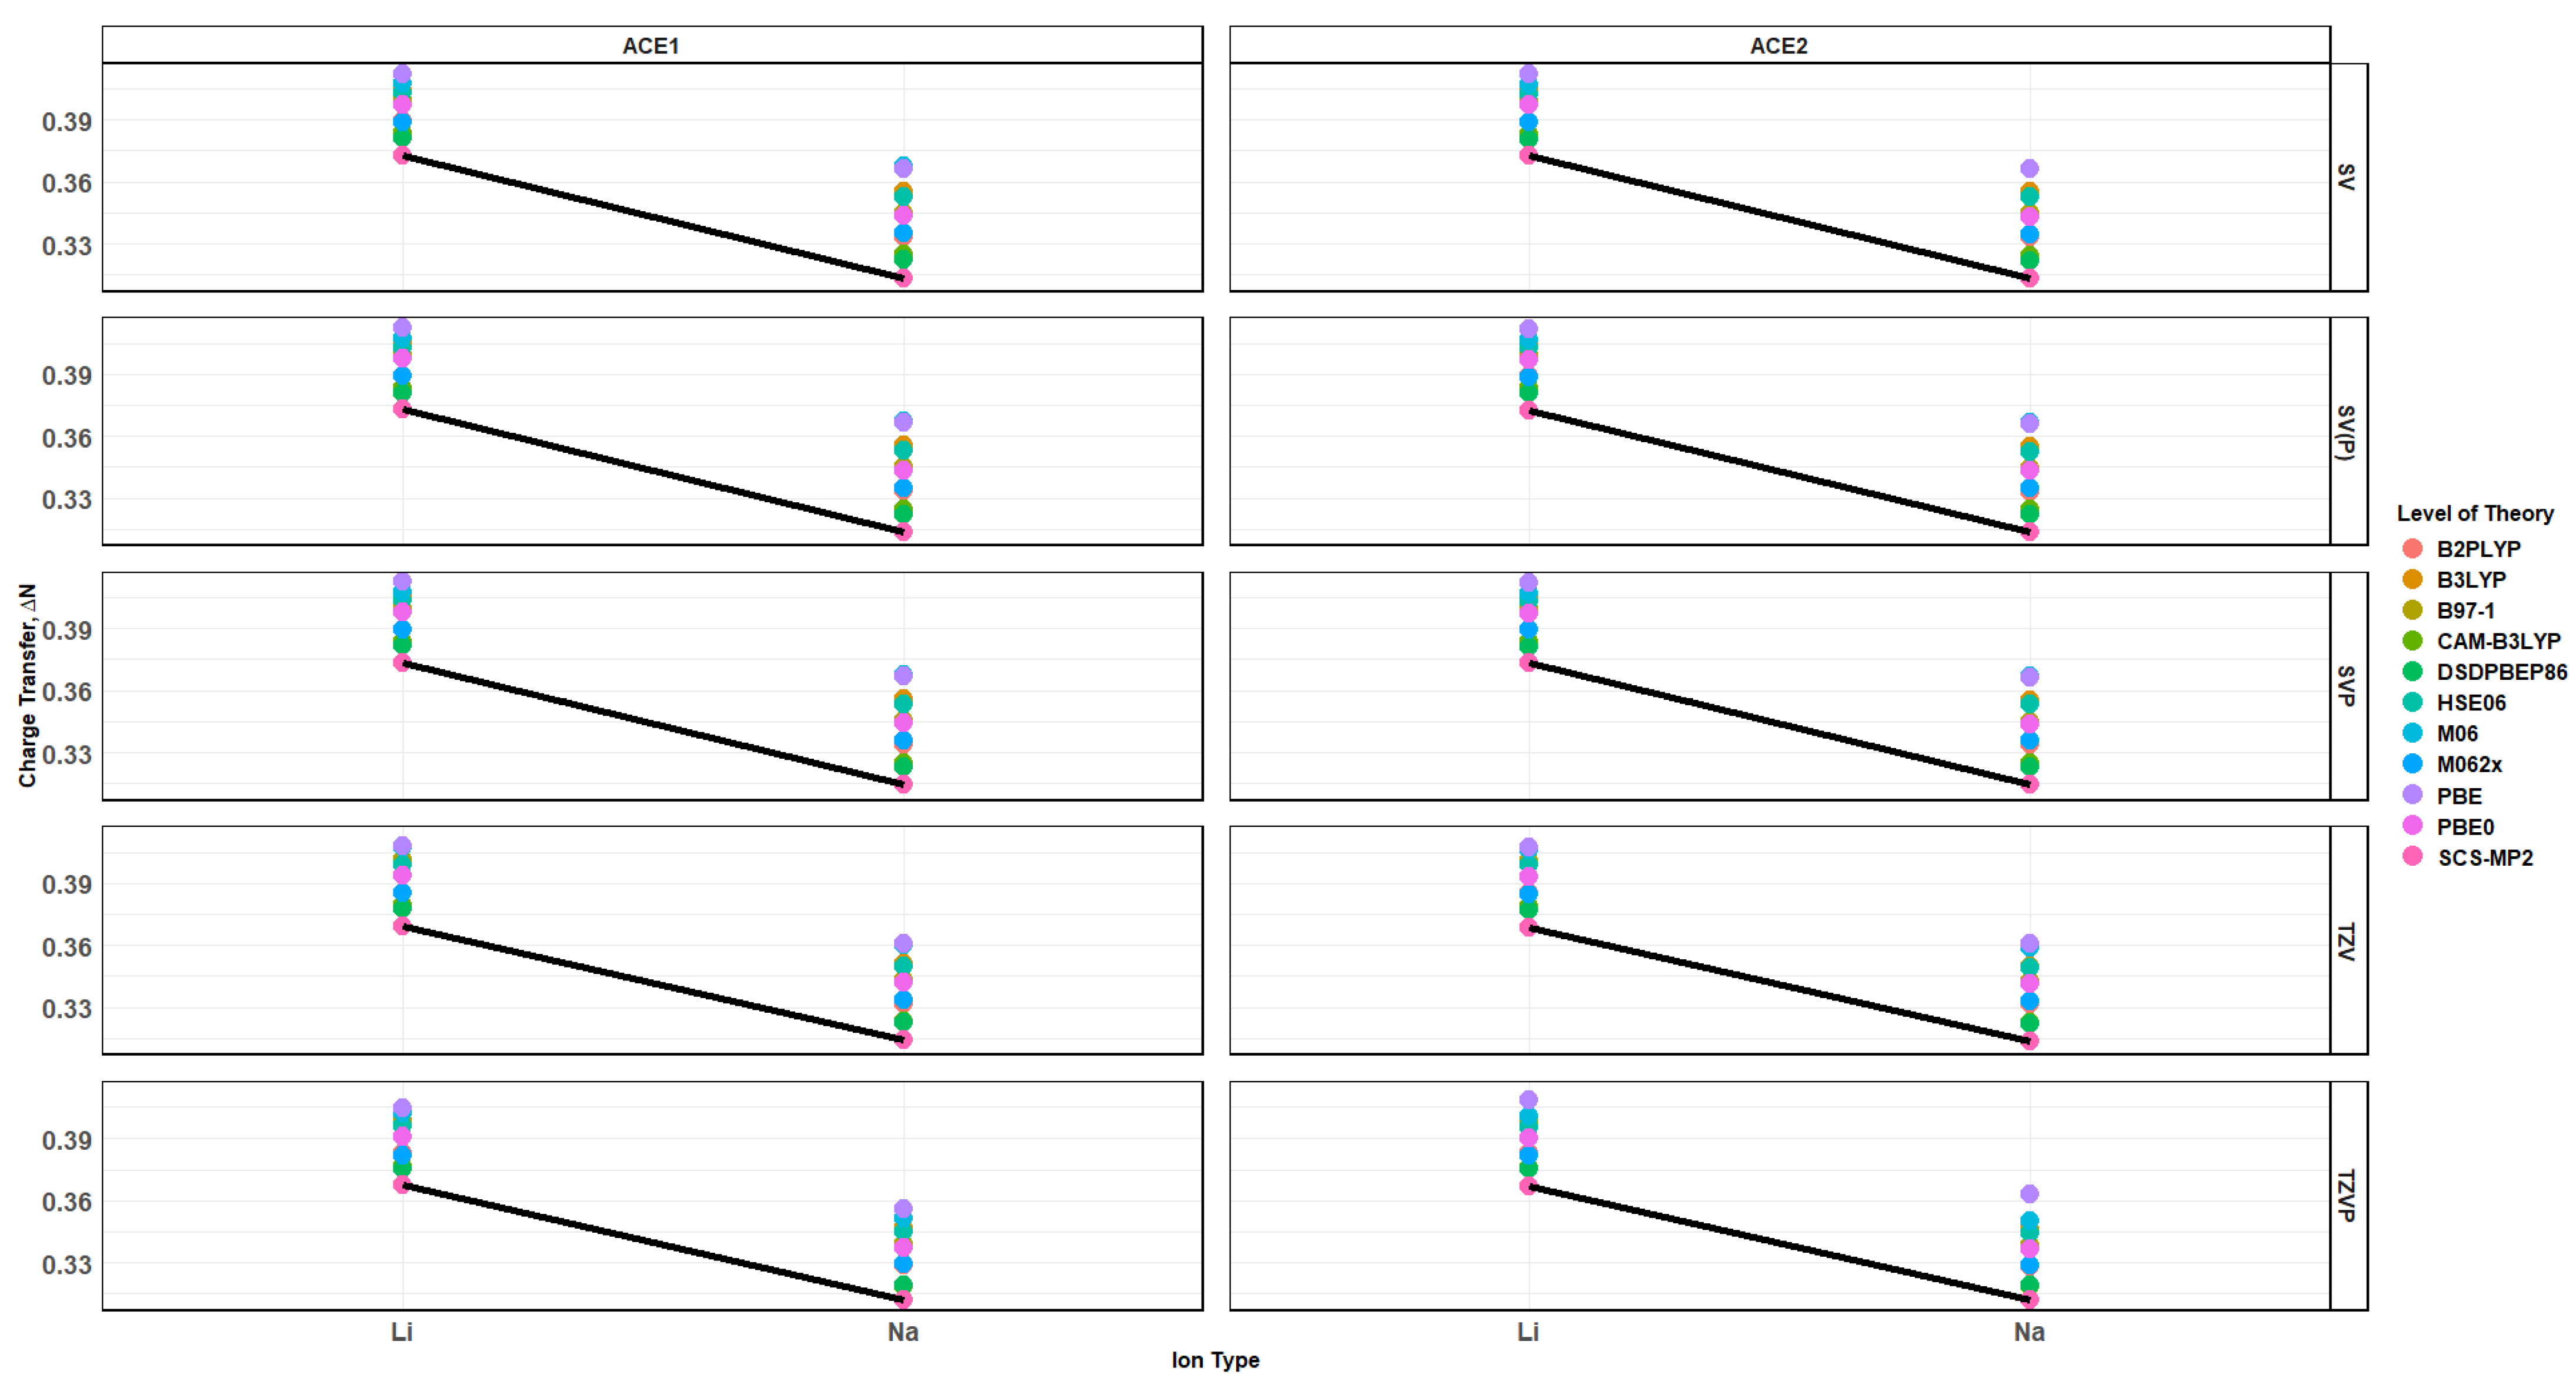
2.7. Charge Transfer of ACE-M+ Complexations Based on def2sv and def2tzv
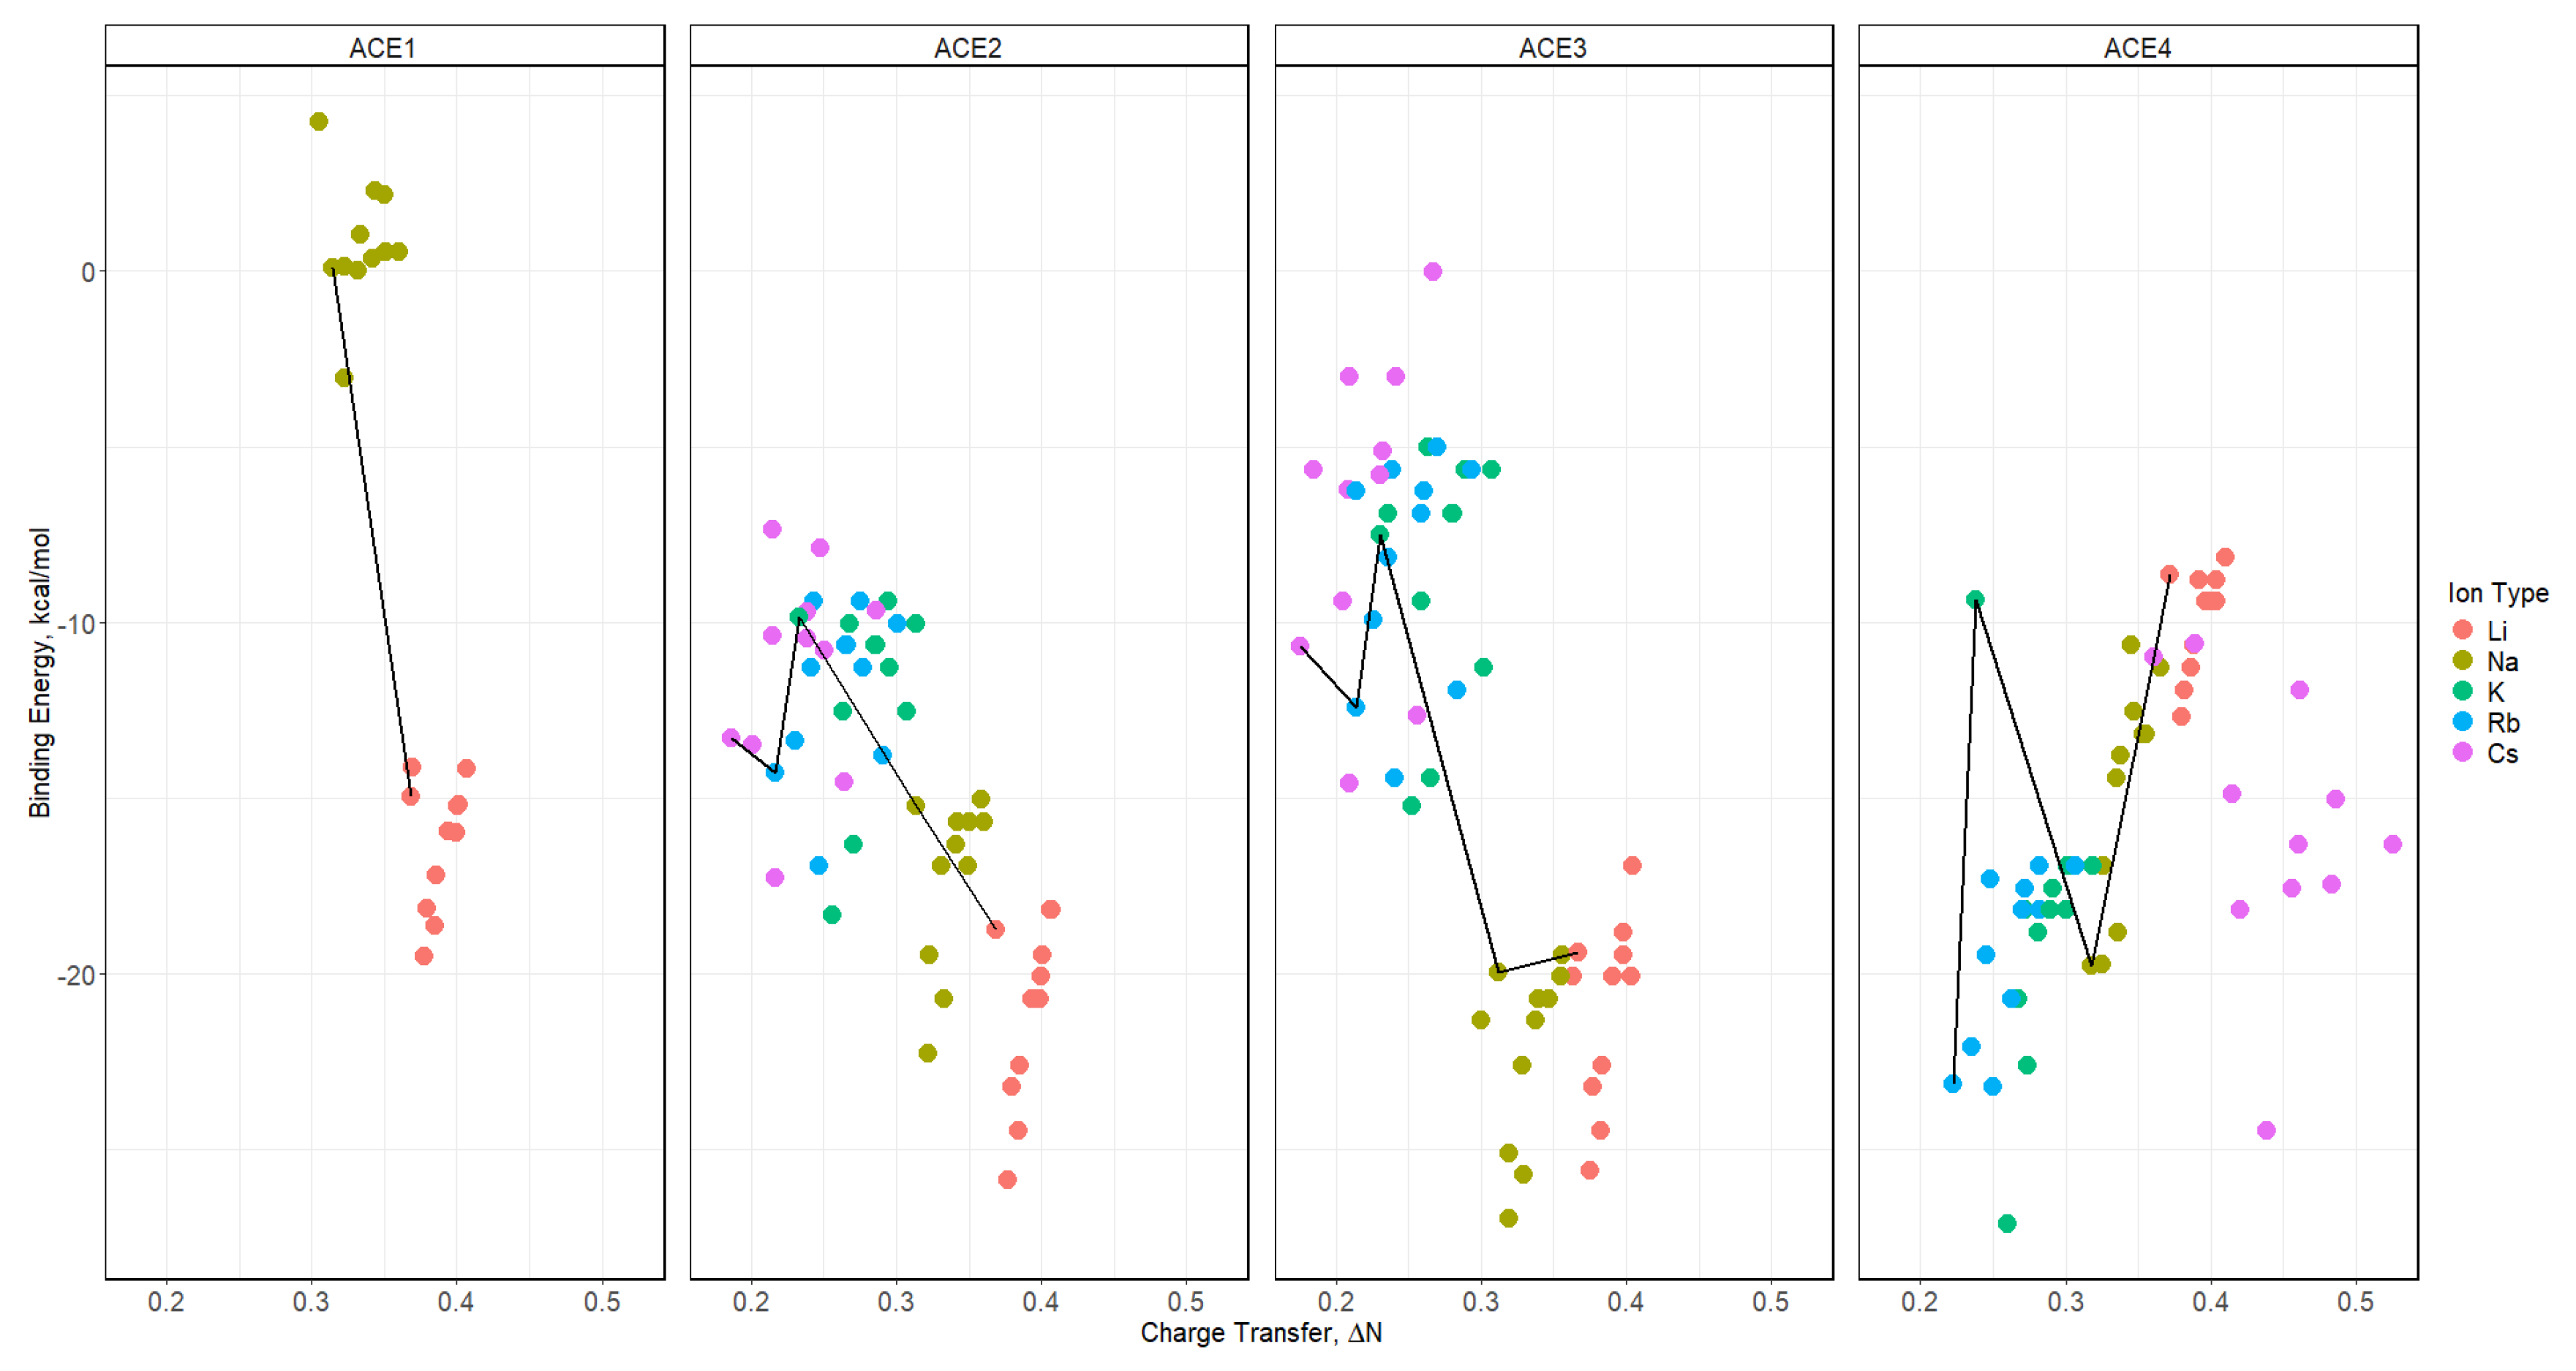
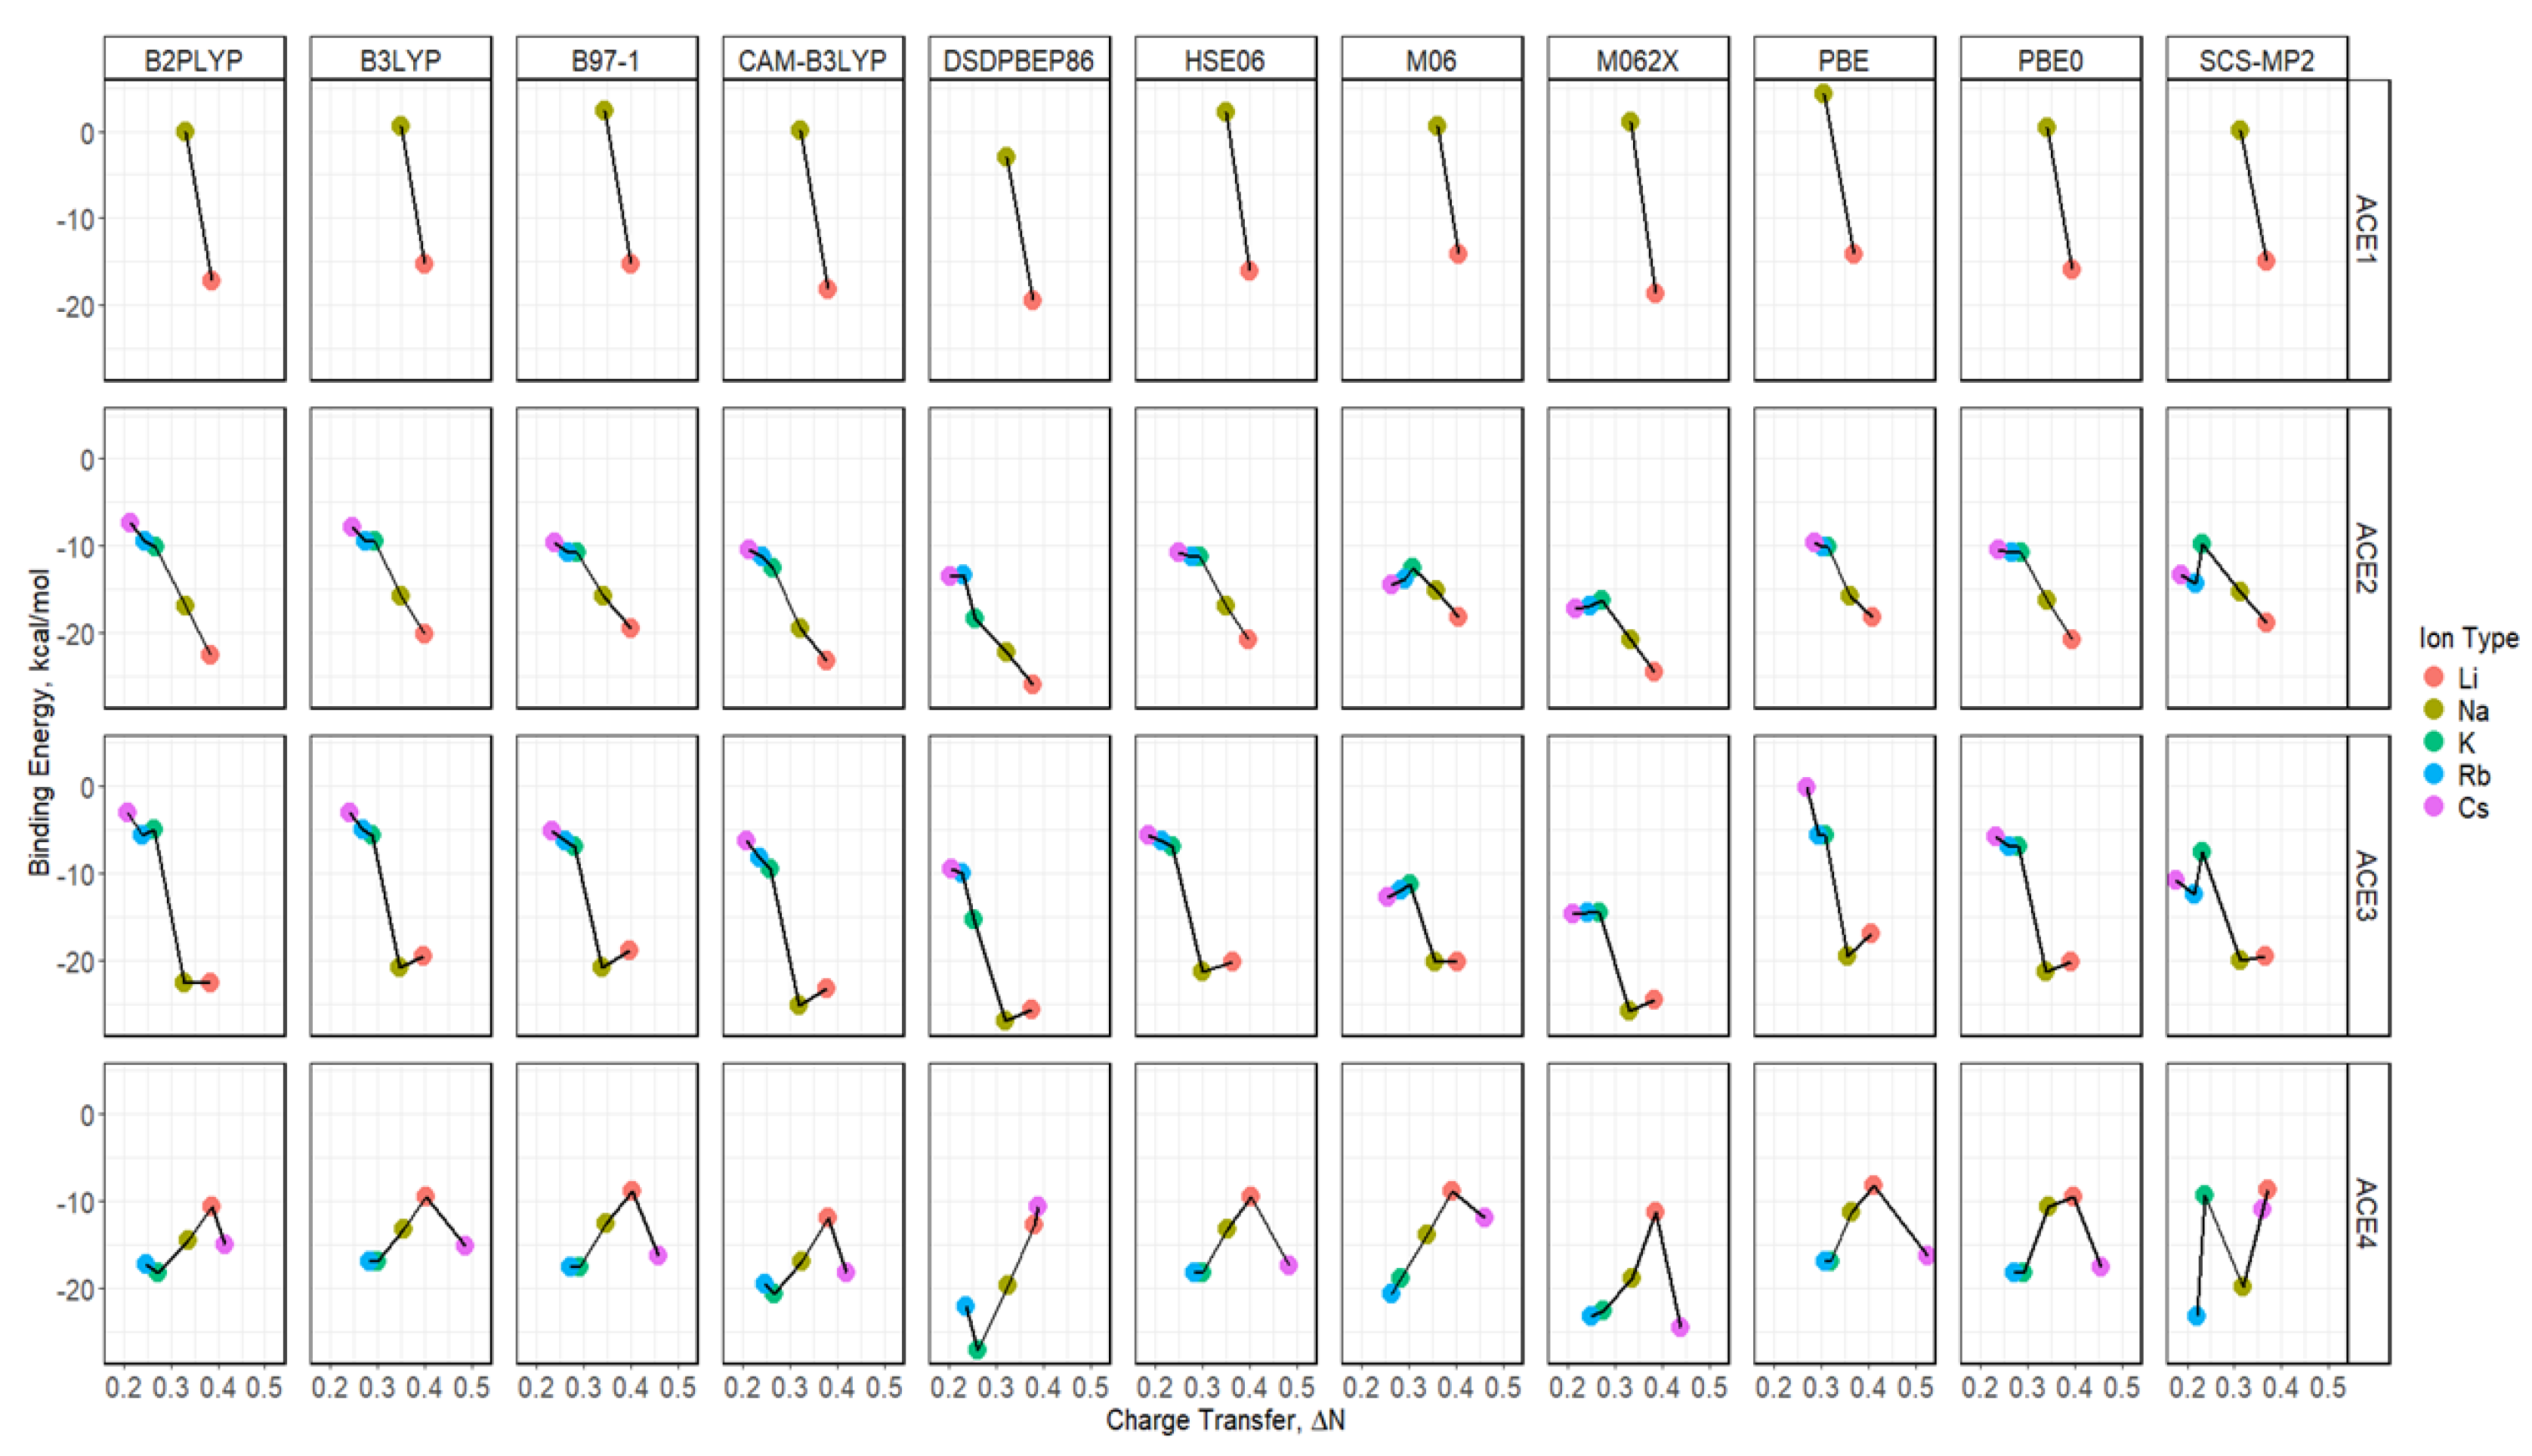
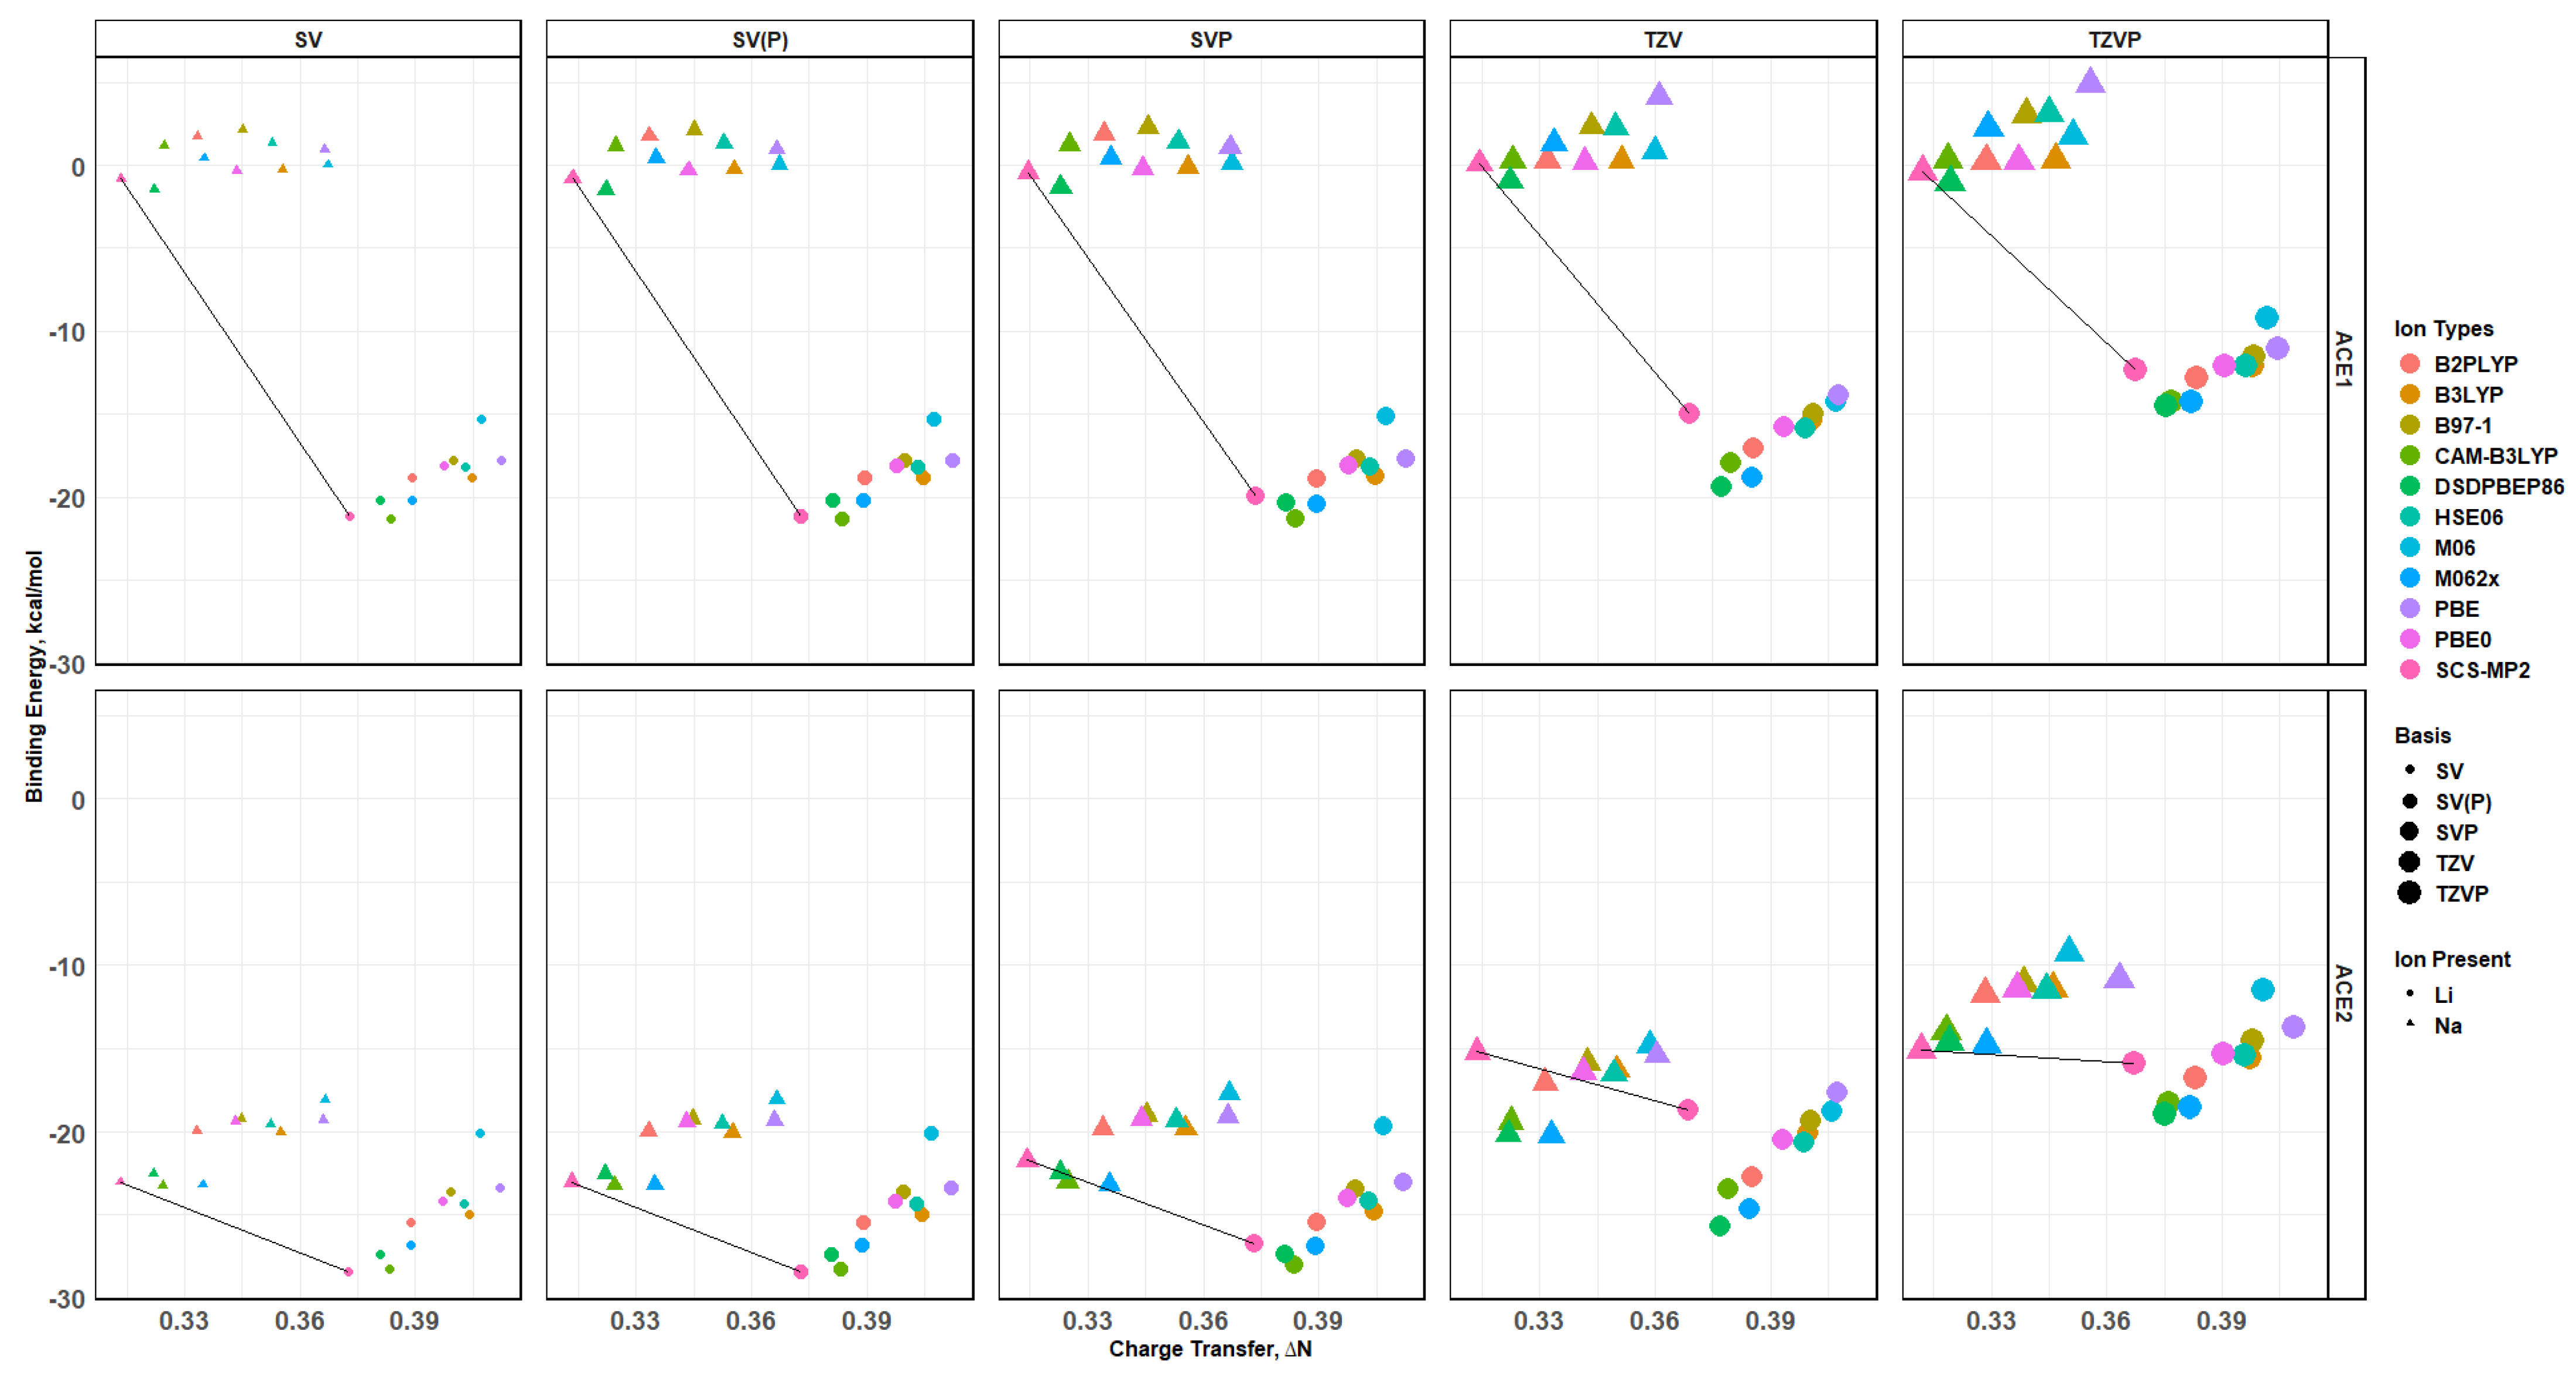
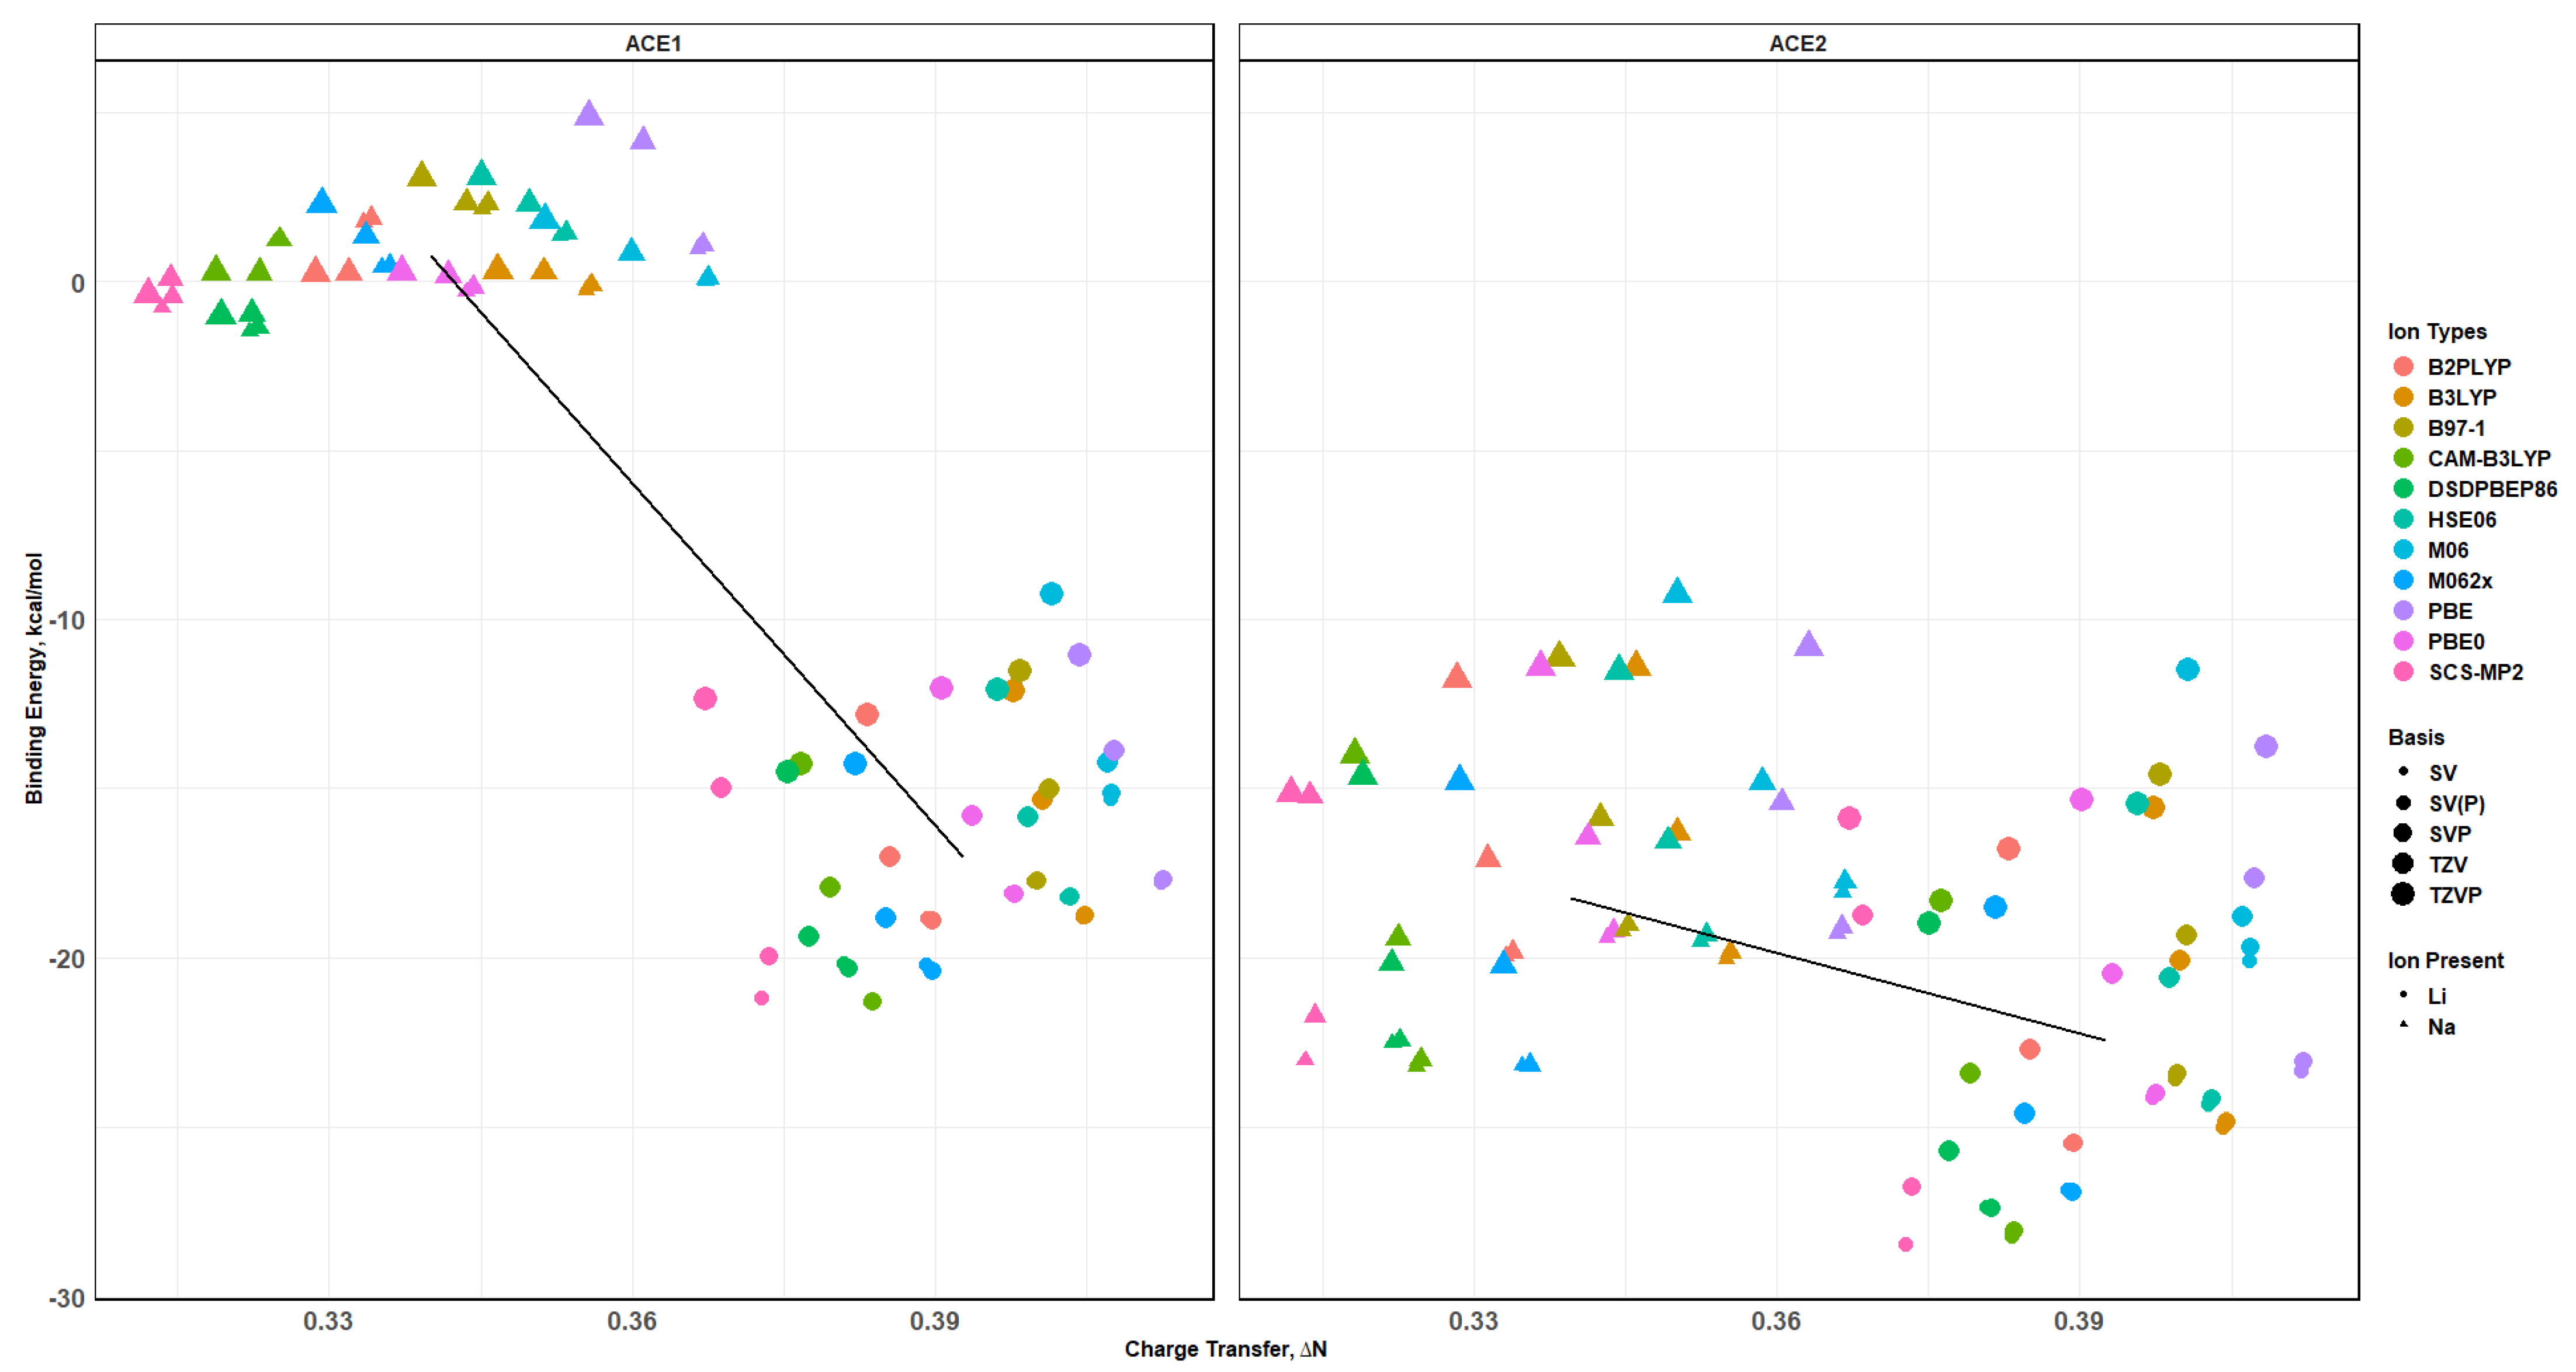
2.8. Binding Energy vs. Charge Transfer Based on def2sv
2.9. Binding Energy vs. Charge Transfer Based on def2tzv
2.10. Effects of Basis Set Polarization on ACE+M+ Systems
2.11. Excited State Calculation of ACE+M+ Systems
3. Computational Details
3.1. Binding Energy Calculations
3.2. Charge Transfer and Electronegativity Calculations
3.3. Chemical Hardness Calculations
3.4. Geometric Analysis
4. Conclusions
Supplementary Materials
Author Contributions
Funding
Institutional Review Board Statement
Informed Consent Statement
Data Availability Statement
Conflicts of Interest
References
- Kim, Y.; Thi, T.; Churchill, D.G. Bioinorganic Chemistry of the Alkali Metal Ions. In The Alkali Metal Ions: Their Role for Life. Metal Ions in Life Sciences; Springer: Cham, Switzerland, 2016; Volume 16, pp. 1–10. [Google Scholar] [CrossRef]
- Jomova, K.; Makova, M.; Alomar, S.Y.; Alwasel, S.H.; Nepovimova, E.; Kuca, K.; Rhodes, C.J.; Valko, M. Essential Metals in Health and Disease. Chem. Biol. Interact. 2022, 367, 110173. [Google Scholar] [CrossRef] [PubMed]
- Shearer, A.; Molinaro, M.; Montazerian, M.; Sly, J.J.; Miola, M.; Baino, F.; Mauro, J.C. The Unexplored Role of Alkali and Alkaline Earth Elements (ALAEs) on the Structure, Processing, and Biological Effects of Bioactive Glasses. Biomater. Sci. 2024, 12, 2521–2560. [Google Scholar] [CrossRef] [PubMed]
- Crichton, R.; Ward, R.; Hider, R. Metal Chelation in Medicine; The Royal Society of Chemistry: London, UK, 2016; pp. 1–23. [Google Scholar] [CrossRef]
- Jing, Z.; Wang, G.; Zhou, Y.; Pang, D.; Zhu, F.; Liu, H. Selectivity of 18-Crown-6 Ether to Alkali Ions by Density Functional Theory and Molecular Dynamics Simulation. J. Mol. Liq. 2020, 311, 113305. [Google Scholar] [CrossRef]
- Sui, B.; Yue, X.; Tichy, M.G.; Liu, T.; Belfield, K.D. Improved Synthesis of the Triazacryptand (TAC) and Its Application in the Construction of a Fluorescent TAC-BODIPY Conjugate for K+Sensing in Live Cells. EurJOC 2015, 2015, 1189–1192. [Google Scholar] [CrossRef]
- Behjatmanesh-Ardakani, R. DFT-B3LYP and SMD Study on the Interactions between Aza-, Diaza-, and Triaza-12-Crown-4 (a N -12-Crown-4, N = 1, 2, 3) with Na+ in the Gas Phase and Acetonitrile Solution. Struct. Chem. 2013, 25, 919–929. [Google Scholar] [CrossRef]
- Kise, K.; Lee, Y.J.; Tanaka, T.; Kim, D.; Osuka, A. Axially- and Meso-Substituted Aza-Crown-Ether-Incorporated BIII Subporphyrins: Control of Electron-Donating Ability by Metal Ion Chelation. Eur. J. Inorg. Chem. 2021, 2021, 3272–3276. [Google Scholar] [CrossRef]
- Kim, H.; Koo, B. Lithium Sensors Based on Photophysical Changes of 1-Aza-12-Crown-4 Naphthalene Derivatives Synthesized Via Buchwald–Hartwig Amination. RSC Adv. 2022, 12, 31976–31984. [Google Scholar] [CrossRef]
- Kavarnos, G.J. Fundamental Concepts of Photoinduced Electron Transfer. Top. Curr. Chem. 1990, 156, 21–58. [Google Scholar] [CrossRef]
- Santoro, A.; Bella, G.; Cancelliere, A.M.; Serroni, S.; Lazzaro, G.; Campagna, S. Photoinduced Electron Transfer in Organized Assemblies—Case Studies. Molecules 2022, 27, 2713. [Google Scholar] [CrossRef]
- Briggs, E.A.; Besley, N.A. Density Functional Theory Based Analysis of Photoinduced Electron Transfer in a Triazacryptand Based K+ Sensor. J. Phys. Chem A 2015, 119, 2902–2907. [Google Scholar] [CrossRef]
- Sui, B.; Yue, X.; Kim, B.; Belfield, K.D. Near-IR Two-Photon Fluorescent Sensor for K+ Imaging in Live Cells. ACS Appl. Mater. Interfaces 2015, 7, 17565–17568. [Google Scholar] [CrossRef] [PubMed]
- Voßnacker, P.; Wüst, A.; Keilhack, T.; Carsten, M.; Steinhauer, S.; Beckers, H.; Yogendra, S.; Schiesser, Y.; Weber, R.; Reimann, M.; et al. Novel Synthetic Pathway for the Production of Phosgene. Sci. Adv. 2021, 7, eabj5186. [Google Scholar] [CrossRef]
- Vidal Vidal, Á.; de Vicente Poutás, L.; Nieto Faza, O.; López, C.S. On the Use of Popular Basis Sets: Impact of the Intramolecular Basis Set Superposition Error. Molecules 2019, 24, 3810. [Google Scholar] [CrossRef] [PubMed]
- Zhang, I.Y.; Xu, X. On the Top Rung of Jacob’s Ladder of Density Functional Theory: Toward Resolving the Dilemma of SIE and NCE. Wiley Interdiscip. Rev. Comput. Mol. Sci. 2020, 11, e1490. [Google Scholar] [CrossRef]
- Peng, C.; Calvin, J.A.; Valeev, E.F. Coupled-Cluster Singles, Doubles and Perturbative Triples with Density Fitting Approximation for Massively Parallel Heterogeneous Platforms. Int. J. Quantum Chem. 2019, 119, e25894. [Google Scholar] [CrossRef]
- Tamukong, P.; Khait, Y.G.; Hoffmann, M.R. Density Differences in Embedding Theory with External Orbital Orthogonality. J. Phys. Chem. A 2014, 118, 9182–9200. [Google Scholar] [CrossRef]
- Grinvald, I.I.; Kapustin, R.V.; Agrba, A.I.; Agrba, M.D. DFT Simulation of Cluster Structures in Organic Systems. Russian J. Phys. Chem. A 2023, 97, 2749–2754. [Google Scholar] [CrossRef]
- Zhao, Y.; Truhlar, D.G. The M06 Suite of Density Functionals for Main Group Thermochemistry, Thermochemical Kinetics, Noncovalent Interactions, Excited States, and Transition Elements: Two New Functionals and Systematic Testing of Four M06-Class Functionals and 12 Other Functionals. Theor. Chem. Acc. 2007, 120, 215–241. [Google Scholar] [CrossRef]
- Yanai, T.; Tew, D.P.; Handy, N.C. A New Hybrid Exchange–Correlation Functional Using the Coulomb-Attenuating Method (CAM-B3LYP). Chem. Phys. Lett. 2004, 393, 51–57. [Google Scholar] [CrossRef]
- White, A.F.; McCurdy, C.W.; Head-Gordon, M. Restricted and Unrestricted Non-Hermitian Hartree-Fock: Theory, Practical Considerations, and Applications to Metastable Molecular Anions. J. Chem. Phys. 2015, 143, 074103. [Google Scholar] [CrossRef]
- Grimme, S.; Goerigk, L.; Fink, R.F. Spin-Component-Scaled Electron Correlation Methods. Wiley Interdiscip. Rev. Comput. Mol. Sci. 2012, 2, 886–906. [Google Scholar] [CrossRef]
- Takatani, T.; Hohenstein, E.G.; Sherrill, C.D. Improvement of the Coupled-Cluster Singles and Doubles Method via Scaling Same- and Opposite-Spin Components of the Double Excitation Correlation Energy. J. Chem. Phys. 2008, 128, 124111. [Google Scholar] [CrossRef] [PubMed]
- Hohenstein, E.G.; Sherrill, C.D. Wavefunction Methods for Noncovalent Interactions. Wiley Interdiscip. Rev. Comput. Mol. Sci. 2011, 2, 304–326. [Google Scholar] [CrossRef]
- Weigend, F.; Ahlrichs, R. Balanced Basis Sets of Split Valence, Triple Zeta Valence and Quadruple Zeta Valence Quality for H to Rn: Design and Assessment of Accuracy. Phys. Chem. Chem. Phys. 2005, 7, 3297. [Google Scholar] [CrossRef] [PubMed]
- Basok, S.S.; Schepetkin, I.A.; Khlebnikov, A.I.; Lutsyuk, A.F.; Kirichenko, T.I.; Kirpotina, L.N.; Pavlovsky, V.I.; Leonov, K.A.; Vishenkova, D.A.; Quinn, M.T. Synthesis, Biological Evaluation, and Molecular Modeling of Aza-Crown Ethers. Molecules 2021, 26, 2225. [Google Scholar] [CrossRef]
- Hou, H.; Zeng, X.; Liu, X. DFT Study of a Series of Crown-4 Ethers and Their Selectivity Trend for Alkali Metal Cations: Li+ and Na+. J. Mol. Model. 2008, 15, 105–111. [Google Scholar] [CrossRef]
- Pitteloud, Q.; Wind, P.; Jensen, S.R.; Frediani, L.; Jensen, F. Quantifying Intramolecular Basis Set Superposition Errors. J. Chem. Theory Comput. 2023, 19, 5863–5871. [Google Scholar] [CrossRef]
- Alvarez-Idaboy, J.R.; Galano, A. Counterpoise Corrected Interaction Energies Are Not Systematically Better than Uncorrected Ones: Comparison with CCSD(T) CBS Extrapolated Values. Theor. Chem. Acc. 2010, 126, 75–85. [Google Scholar] [CrossRef]
- Nguan, H.; Ahmadi, S.; Hashim, R. DFT Study of Glucose Based Glycolipid Crown Ethers and Their Complexes with Alkali Metal Cations Na+ and K+. J. Mol. Model. 2012, 18, 5041–5050. [Google Scholar] [CrossRef]
- Lewars, E.G. Computational Chemistry; Springer: Dordrecht, The Netherlands, 2011; pp. 491–509. [Google Scholar] [CrossRef]
- Jones, M.M.; Vaughn, W.K. HSAB Theory and Acute Metal Ion Toxicity and Detoxification Processes. J. Inorg. Nucl. Chem. 1978, 40, 2081–2088. [Google Scholar] [CrossRef]
- Pearson, R.G. Hard and Soft Acids and Bases, HSAB, Part 1: Fundamental Principles. J. Chem. Ed. 1968, 45, 581. [Google Scholar] [CrossRef]


| GGA | Hybrid GGA | Hybrid Meta-GGA | Double Hybrid | Wavefunction |
|---|---|---|---|---|
| Pure Perdew–Burke–Ernzerhof (PBE) | Becke 3-parameter Lee–Yang–Parr (B3LYP) | Minnesota 06 (M06) | Virtual Orbital-Dependent (B2PLYP) | 2nd Order Møller–Plesset (MP2) |
| Coulomb-Attenuating Method of B3LYP (CAM-B3LYP) | Minnesota 06-2X (M06-2X) | Empirical Dispersion Correction (DSDPBEP86) | Spin-Component-Scaled MP2 (SCS-MP2) ** | |
| Hybrid Perdew–Burke–Ernzerhof (PBE0) | ||||
| Becke 97 (B97-1) | ||||
| Heyd–Scuseria–Ernzerhof (HSE06) |
| ACE1 + Li | ACE2 + Li | ||||||||||
| Level of Theory | SV | SVP | SV(P) | TZV | TZVP | TZVPP | SV | SVP | SV(P) | TZV | TZVP |
| B2PLYP | −18.821 | −18.925 | −18.821 | −17.024 | −12.843 | −12.888 | −25.462 | −25.467 | −25.462 | −22.699 | −16.785 |
| B3LYP | −18.788 | −18.757 | −18.788 | −15.344 | −12.126 | −12.151 | −25.007 | −24.821 | −25.007 | −20.075 | −15.576 |
| B971 | −17.752 | −17.737 | −17.752 | −15.008 | −11.525 | −11.543 | −23.586 | −23.421 | −23.586 | −19.359 | −14.58 |
| CAM-B3LYP | −21.318 | −21.294 | −21.318 | −17.932 | −14.293 | −14.327 | −28.218 | −28.04 | −28.218 | −23.428 | −18.318 |
| DSDPBEP86 | −20.173 | −20.324 | −20.174 | −19.365 | −14.529 | −14.58 | −27.352 | −27.406 | −27.352 | −25.714 | −18.985 |
| HSE06 | −18.208 | −18.211 | −18.208 | −15.848 | −12.1 | −12.12 | −24.323 | −24.174 | −24.323 | −20.601 | −15.445 |
| M06 | −15.317 | −15.153 | −15.317 | −14.253 | −9.247 | −9.557 | −20.076 | −19.707 | −20.076 | −18.799 | −11.509 |
| M062X | −20.195 | −20.398 | −20.195 | −18.825 | −14.295 | −14.258 | −26.846 | −26.924 | −26.846 | −24.611 | −18.532 |
| MP2 | −18.595 | −17.411 | −18.595 | −6.566 | 7.646 | 7.716 | −28.353 | −26.682 | −28.353 | −18.201 | −15.814 |
| PBE | −17.773 | −17.695 | −17.773 | −13.875 | −11.07 | −11.083 | −23.328 | −23.082 | −23.328 | −17.646 | −13.771 |
| PBE0 | −18.096 | −18.118 | −18.096 | −15.813 | −12.056 | −12.084 | −24.143 | −24.019 | −24.143 | −20.495 | −15.323 |
| SCS-MP2 | −21.185 | −19.969 | −21.185 | −14.98 | −12.347 | −12.388 | −28.427 | −26.743 | −28.427 | −18.753 | −15.89 |
| ACE1 + Na | ACE2 + Na | ||||||||||
| Level of Theory | SV | SVP | SV(P) | TZV | TZVP | TZVPP | SV | SVP | SV(P) | TZV | TZVP |
| B2PLYP | 1.75 | 1.844 | 1.749 | 0.26 | 0.235 | 0.219 | −25.462 | −19.849 | −19.945 | −17.091 | −11.784 |
| B3LYP | −0.248 | −0.119 | −0.248 | 0.274 | 0.307 | 0.31 | −25.007 | −19.85 | −20.043 | −16.315 | −11.41 |
| B971 | 2.136 | 2.301 | 2.136 | 2.314 | 3.049 | 3.043 | −23.586 | −19.034 | −19.223 | −15.883 | −11.132 |
| CAM-B3LYP | 1.177 | 1.231 | 1.177 | 0.257 | 0.298 | 0.301 | −28.218 | −23.019 | −23.21 | −19.418 | −14.011 |
| DSDPBEP86 | −1.483 | −1.364 | −1.483 | −0.964 | −1.021 | −1.053 | −27.352 | −22.449 | −22.529 | −20.174 | −14.647 |
| HSE06 | 1.337 | 1.413 | 1.338 | 2.291 | 3.119 | 3.118 | −24.323 | −19.335 | −19.521 | −16.555 | −11.518 |
| M06 | 0.03 | 0.094 | 0.026 | 0.836 | 1.81 | 1.791 | −20.076 | −17.748 | −18.071 | −14.826 | −9.266 |
| M062X | 0.424 | 0.437 | 0.424 | 1.339 | 2.279 | 2.277 | −26.846 | −23.171 | −23.197 | −20.223 | −14.807 |
| MP2 | −14.82 | −17.355 | −14.82 | −94.75 | −113.244 | −117.004 | −28.353 | −21.911 | −23.198 | −15.069 | −15.587 |
| PBE | 0.973 | 1.073 | 0.971 | 4.141 | 4.872 | 4.874 | −23.328 | −19.084 | −19.313 | −15.428 | −10.846 |
| PBE0 | −0.314 | −0.178 | −0.314 | 0.188 | 0.271 | 0.191 | −24.143 | −19.22 | −19.393 | −16.443 | −11.396 |
| SCS-MP2 | −0.789 | −0.463 | −0.789 | 0.073 | −0.39 | −0.358 | −28.427 | −21.709 | −23.03 | −15.231 | −15.15 |
Disclaimer/Publisher’s Note: The statements, opinions and data contained in all publications are solely those of the individual author(s) and contributor(s) and not of MDPI and/or the editor(s). MDPI and/or the editor(s) disclaim responsibility for any injury to people or property resulting from any ideas, methods, instructions or products referred to in the content. |
© 2025 by the authors. Licensee MDPI, Basel, Switzerland. This article is an open access article distributed under the terms and conditions of the Creative Commons Attribution (CC BY) license (https://creativecommons.org/licenses/by/4.0/).
Share and Cite
Elayyan, M.; Hoffmann, M.R.; Sui, B. A Theoretical Investigation of the Selectivity of Aza-Crown Ether Structures Chelating Alkali Metal Cations for Potential Biosensing Applications. Molecules 2025, 30, 2571. https://doi.org/10.3390/molecules30122571
Elayyan M, Hoffmann MR, Sui B. A Theoretical Investigation of the Selectivity of Aza-Crown Ether Structures Chelating Alkali Metal Cations for Potential Biosensing Applications. Molecules. 2025; 30(12):2571. https://doi.org/10.3390/molecules30122571
Chicago/Turabian StyleElayyan, Mouhmad, Mark R. Hoffmann, and Binglin Sui. 2025. "A Theoretical Investigation of the Selectivity of Aza-Crown Ether Structures Chelating Alkali Metal Cations for Potential Biosensing Applications" Molecules 30, no. 12: 2571. https://doi.org/10.3390/molecules30122571
APA StyleElayyan, M., Hoffmann, M. R., & Sui, B. (2025). A Theoretical Investigation of the Selectivity of Aza-Crown Ether Structures Chelating Alkali Metal Cations for Potential Biosensing Applications. Molecules, 30(12), 2571. https://doi.org/10.3390/molecules30122571