
An Innovative Strategy for Untargeted Mass Spectrometry Data Analysis: Rapid Chemical Profiling of the Medicinal Plant Terminalia chebula Using Ultra-High-Performance Liquid Chromatography Coupled with Q/TOF Mass Spectrometry–Key Ion Diagnostics–Neutral Loss Filtering

Abstract

1. Introduction
2. Results and Discussion
2.1. Research Strategy
2.2. Establishing a Diagnostic Ion Database
2.3. Chemical Composition Analysis of T. chebula by Key Ion Diagnostics and Neutral Loss Filtering Using UPLC-Q-TOF/MS
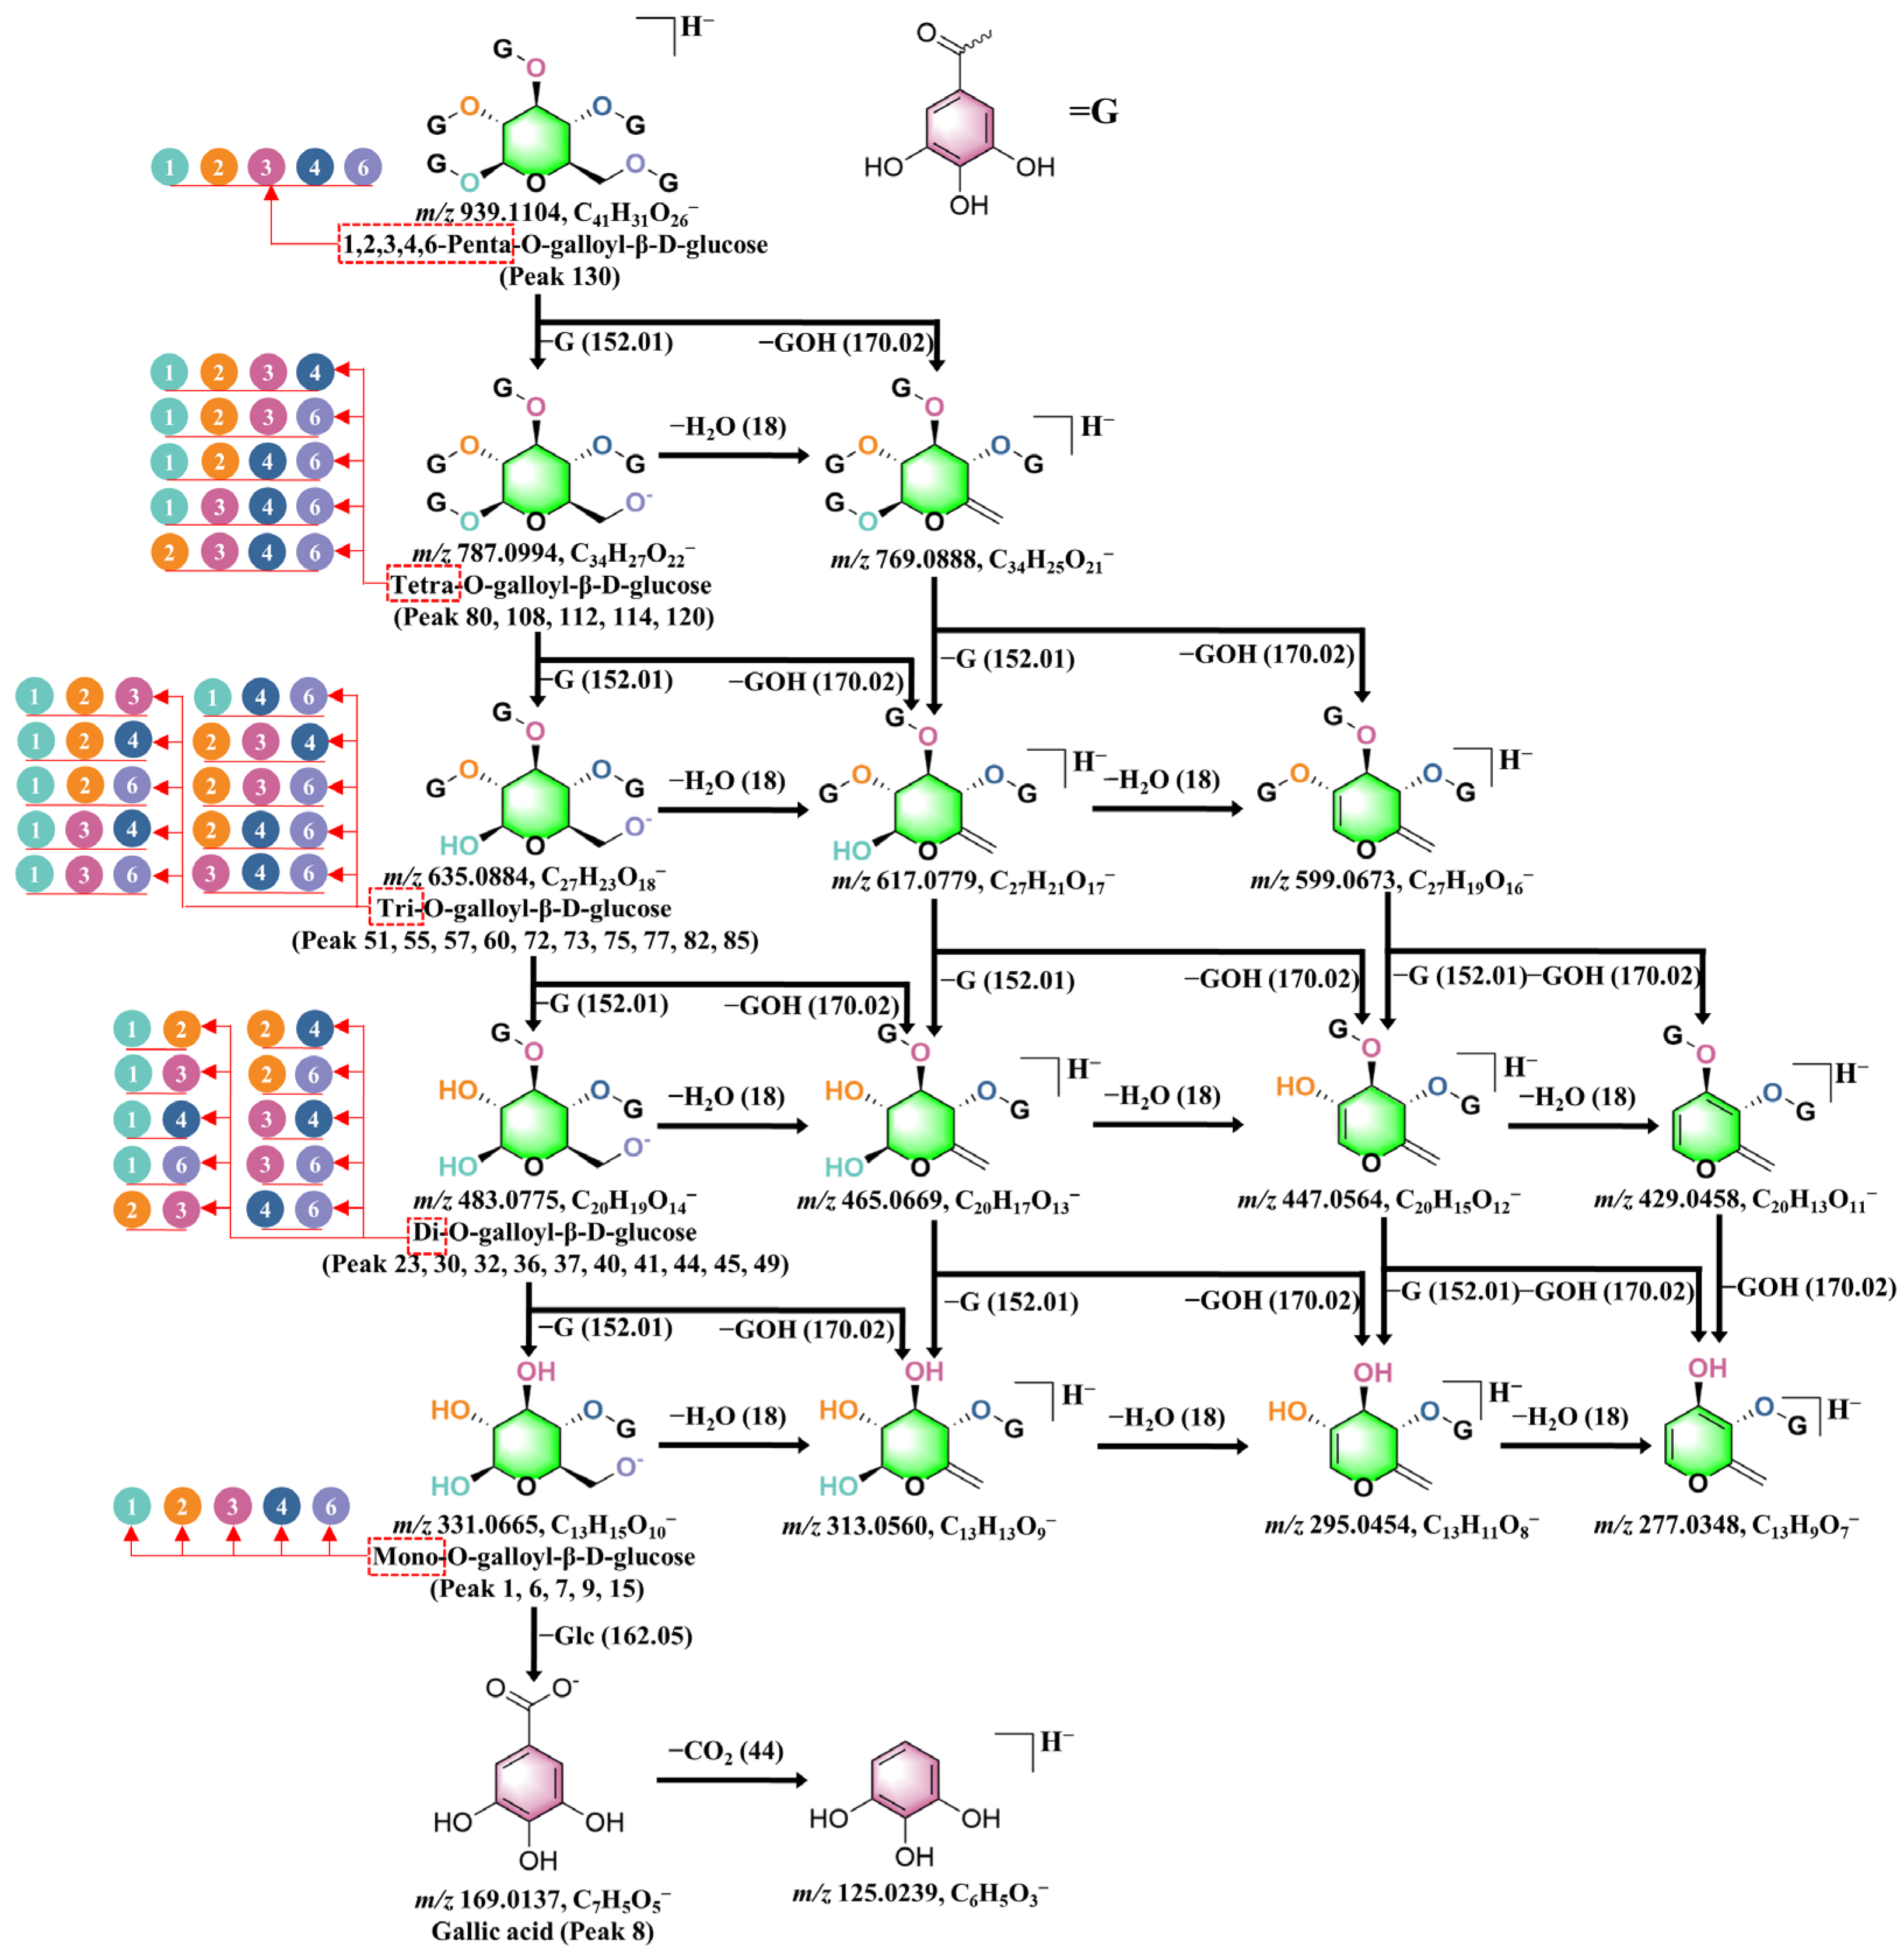
2.3.1. Gallic Acid Derivatives
2.3.2. Ellagitannins
Ellagic Acid and Its Simple Derivatives
Simple Tannins Containing a Single HHDP Group
Chebulic Acid and Its Simple Derivatives
Simple Tannins Containing a Single Chebuloyl or Neoche Group
Tannins Containing HHDP, Chebuloyl, Neoche, and Other Groups
2.3.3. Terpenoids
2.3.4. Other Components
2.4. The Applicability of the KID-NLF Strategy
3. Experimental
3.1. Chemicals, Reagents, and Plant Materials
3.2. Sample Preparation
3.3. UHPLC Analysis
3.4. UPLC-Q-TOF/MS Analysis
4. Conclusions
Supplementary Materials
Author Contributions
Funding
Institutional Review Board Statement
Informed Consent Statement
Data Availability Statement
Conflicts of Interest
References
- Klein-Junior, L.C.; de Souza, M.R.; Viaene, J.; Bresolin, T.M.B.; de Gasper, A.L.; Henriques, A.T.; Heyden, Y.V. Quality Control of Herbal Medicines: From Traditional Techniques to State-of-the-art Approaches. Planta Med. 2021, 87, 964–988. [Google Scholar] [CrossRef] [PubMed]
- Li, X.; Wen, D.; He, Y.; Liu, Y.; Han, F.; Su, J.; Lai, S.; Zhuang, M.; Gao, F.; Li, Z. Progresses and Prospects on Glucosinolate Detection in Cruciferous Plants. Foods 2024, 13, 4141. [Google Scholar] [CrossRef] [PubMed]
- Ye, C.X.; Huang, W.J.; Qin, S.Y.; Mai, Z.Y.; Wang, L.Q.; Li, S.S.; Xu, H.R.; Wang, D.H.; Yan, S.K.; Xiao, X. Application Progress of 2D-LC in Analysis and Quality Control of Traditional Chinese Medicine. Chem. Reag. 2022, 44, 1103–1110. [Google Scholar] [CrossRef]
- Hong, L.L.; Wang, H.D.; Xu, X.Y.; Hu, W.D.; Liu, J.Y.; Wang, X.Y.; Gao, X.M.; Yang, W.Z. Systematic characterization and identification of the chemical constituents of the Schisandra chinensis decoction based on a hybrid scanning technique of UHPLC/IM-QTOF-MS. Acta Pharm. Sin. 2024, 59, 678–692. [Google Scholar] [CrossRef]
- Qiao, X.; Li, R.; Song, W.; Miao, W.J.; Liu, J.; Chen, H.B.; Guo, D.A.; Ye, M. A targeted strategy to analyze untargeted mass spectral data: Rapid chemical profiling of Scutellaria baicalensis using ultra-high performance liquid chromatography coupled with hybrid quadrupole orbitrap mass spectrometry and key ion filtering. J. Chromatogr. A 2016, 1441, 83–95. [Google Scholar] [CrossRef]
- Chen, J.; Wang, X.; Xin, X.; Zheng, Y.; Hou, F.; Li, C.; Guo, L.; Wang, L. Comprehensive comparison of two colour varieties of Perillae folium by UHPLC-Q-TOF/MS analysis combining with feature-based molecular networking. Food Chem. 2025, 463, 141293. [Google Scholar] [CrossRef]
- Schmid, R.; Petras, D.; Nothias, L.F.; Wang, M.X.; Aron, A.T.; Jagels, A.; Tsugawa, H.; Rainer, J.; Garcia-Aloy, M.; Dührkop, K.; et al. Ion identity molecular networking for mass spectrometry-based metabolomics in the GNPS environment. Nat. Commun. 2021, 12, 3832. [Google Scholar] [CrossRef]
- Duhrkop, K.; Fleischauer, M.; Ludwig, M.; Aksenov, A.A.; Melnik, A.V.; Meusel, M.; Dorrestein, P.C.; Rousu, J.; Bocker, S. SIRIUS 4: A rapid tool for turning tandem mass spectra into metabolite structure information. Nat. Methods 2019, 16, 299–302. [Google Scholar] [CrossRef]
- Wang, C.; Zhang, H.; Wang, X.; Wang, X.; Li, X.; Li, C.; Wang, Y.; Zhang, M. Comprehensive Review on Fruit of Terminalia chebula: Traditional Uses, Phytochemistry, Pharmacology, Toxicity, and Pharmacokinetics. Molecules 2024, 29, 5547. [Google Scholar] [CrossRef]
- Dhar, A.; Maurya, S.K.; Mishra, A.; Singh, G.K.; Singh, M.K.; Seth, A. Preliminary Screening of a Classical Ayurvedic Formulation for Anticonvulsant Activity. Anc. Sci. Life 2016, 36, 28–34. [Google Scholar] [CrossRef]
- Nigam, M.; Mishra, A.P.; Adhikari-Devkota, A.; Dirar, A.I.; Hassan, M.M.; Adhikari, A.; Belwal, T.; Devkota, H.P. Fruits of Terminalia chebula Retz.: A review on traditional uses, bioactive chemical constituents and pharmacological activities. Phytother. Res. 2020, 34, 2518–2533. [Google Scholar] [CrossRef] [PubMed]
- Gao, H.; Lu, H.; Fang, N.; Su, J.; Li, R.; Wang, W.; Zhang, Y. The potential of Terminalia chebula in alleviating mild cognitive impairment: A review. Front. Pharmacol. 2024, 15, 1484040. [Google Scholar] [CrossRef]
- Kim, H.L.; Choi, B.K.; Yang, S.H. Terminalia chebula Medicinal Uses: A Review of in vitro and in vivo Studies. Biotechnol. Bioprocess Eng. 2022, 27, 703–713. [Google Scholar] [CrossRef]
- Zhang, Y.X.; Zhang, Y.S.; Zhang, G.X.; Sun, Y.; Yang, W.L.; Zhang, C.Y. Research Progress and Application Prospects of Medicinal and Edible Tibetan Medicine Terminalia chebula. Chin. Wild Plant Res. 2024, 43, 49–59. [Google Scholar] [CrossRef]
- Tiwari, M.; Barooah, M.S. A comprehensive review on the ethno-medicinal and pharmacological properties of Terminalia chebula fruit. Phytochem. Rev. 2024, 23, 125–145. [Google Scholar] [CrossRef]
- Singh, A.; Bajpai, V.; Kumar, S.; Sharma, K.R.; Kumar, B. Profiling of Gallic and Ellagic Acid Derivatives in Different Plant Parts of Terminalia arjuna by HPLC-ESI-QTOF-MS/MS. Nat. Prod. Commun. 2016, 11, 239–244. [Google Scholar] [CrossRef]
- Kaunda, J.S.; Zhang, Y.J. Two New Phenolic Constituents from the Stems of Euphorbia griffithii. Nat. Prod. Bioprospect. 2019, 9, 405–410. [Google Scholar] [CrossRef]
- Li, K.; Han, X.; Li, R.; Xu, Z.; Pan, T.; Liu, J.; Li, B.; Wang, S.; Diao, Y.; Liu, X. Composition, Antivirulence Activity, and Active Property Distribution of the Fruit of Terminalia chebula Retz. J. Food Sci. 2019, 84, 1721–1729. [Google Scholar] [CrossRef]
- Ding, G.; Liu, Y.Z.; Yan, Z.; Lu, Y.R.; Sheng, L.S. Two new isomers of chebulic acid from Terminalia chebula. J. Chin Pharma Univ. 2000, 32, 333–335. [Google Scholar]
- Lee, D.Y.; Kim, H.W.; Yang, H.; Sung, S.H. Hydrolyzable tannins from the fruits of Terminalia chebula Retz and their α-glucosidase inhibitory activities. Phytochemistry 2017, 137, 109–116. [Google Scholar] [CrossRef]
- Bouchet, N.; Levesque, J.; Blond, A.; Bodo, B.; Poisset, J.L. 1,3-di-O-galloylquinic acid from Guiera senegalensis. Phytochemistry 1996, 42, 189–190. [Google Scholar] [CrossRef]
- Ahn, M.J.; Kim, C.Y.; Lee, J.S.; Kim, T.G.; Kim, S.H.; Lee, C.K.; Lee, B.B.; Shin, C.G.; Huh, H.; Kim, J. Inhibition of HIV-1 integrase by galloyl glucoses from Terminalia chebula and flavonol glycoside gallates from Euphorbia pekinensis. Planta Med. 2002, 68, 457–459. [Google Scholar] [CrossRef] [PubMed]
- Li, Y.J.; He, F.Q.; Zhao, H.H.; Li, Y.; Chen, J. Screening and identification of acetylcholinesterase inhibitors from Terminalia chebula fruits by immobilized enzyme on cellulose filter paper coupled with ultra-performance liquid chromatography-quadrupole time-of-flight mass spectrometry and molecular docking. J. Chromatogr. A 2022, 1663, 462784. [Google Scholar] [CrossRef] [PubMed]
- Liang, C.C.; Zhang, F.Q.; Chen, J. Screening and characterization of cosmetic efficacy components of Terminalia chebula based on biological activity-guided methodology. Biomed. Chromatogr. 2024, 38, e5974. [Google Scholar] [CrossRef]
- Tang, Y.; Yin, L.; Zhang, Y.; Huang, X.; Zhao, F.; Cui, X.; Shi, L.; Xu, L. Study on anti-inflammatory efficacy and correlative ingredients with pharmacodynamics detected in acute inflammation rat model serum from Caulis Lonicerae japonicae. Phytomedicine 2016, 23, 597–610. [Google Scholar] [CrossRef]
- Saha, S.; Imran, I.B.B. Sensitive lanthanide label array method for rapid fingerprint analysis of plant polyphenols based on time-resolved luminescence. Anal. Methods 2019, 11, 5044–5054. [Google Scholar] [CrossRef]
- Ajala, O.S.; Jukov, A.; Ma, C.M. Hepatitis C virus inhibitory hydrolysable tannins from the fruits of Terminalia chebula. Fitoterapia 2014, 99, 117–123. [Google Scholar] [CrossRef]
- Chen, H.F.; Zhang, C.; Yao, Y.; Li, J.M.; Du, W.D.; Li, M.L.; Wu, B.; Yang, S.L.; Feng, Y.L.; Zhang, W.G. Study on anti-hyperuricemia effects and active ingredients of traditional Tibetan medicine TongFengTangSan (TFTS) by ultra-high-performance liquid chromatography coupled with quadrupole time-of-flight mass spectrometry. J. Pharm. Biomed. Anal. 2019, 165, 213–223. [Google Scholar] [CrossRef]
- Wang, Z.; Zhang, Y.; Fu, Z.; Jin, T.; Zhao, C.; Zhao, M. A comprehensive strategy for quality evaluation of Changan powder by fingerprinting combined with rapid qualitative and quantitative multi-ingredients profiling. Phytochem. Anal. 2024, 35, 840–859. [Google Scholar] [CrossRef]
- Han, N.; Ye, Q.; Guo, Z.; Liang, X. Metabolomics analysis of differential chemical constituents and α-glucosidase inhibiting activity of Phyllanthus urinaria L. root, stem, leaf and fruit. Nat. Prod. Res. 2023, 37, 642–645. [Google Scholar] [CrossRef]
- Tanaka, T.; Jiang, Z.H.; Kouno, I. Structures and biogenesis of rhoipteleanins, ellagitannins formed by stereospecific intermolecular C-C oxidative coupling, isolated from Rhoiptelea chiliantha. Chem. Pharm. Bull. 1997, 45, 1915–1921. [Google Scholar] [CrossRef]
- Jha, A.K.; Sit, N. Effect of ultrasound, microwave, and enzymatically pre-treated Terminalia chebula pulp on extraction of bioactive compounds using supercritical CO2. Sustain. Chem. Pharm. 2023, 33, 101098. [Google Scholar] [CrossRef]
- Li, C.W.; Dong, H.J.; Cui, C.B. The synthesis and antitumor activity of twelve galloyl glucosides. Molecules 2015, 20, 2034–2060. [Google Scholar] [CrossRef] [PubMed]
- de Oliveira, F.M.G.; Lyrio, M.V.V.; Filgueiras, P.R.; de Castro, E.V.R.; Kuster, R.M. ESI(-)FT-ICR MS for the determination of best conditions for producing extract abundant in phenolic compounds from leaves of E. uniflora and FTIR-PCA as a sample screening method. Anal. Methods 2024, 16, 3701–3713. [Google Scholar] [CrossRef] [PubMed]
- Zheng, Y.; Zhao, L.; Yi, J.; Cai, S. Effects and Mechanisms of Rhus chinensis Mill. Fruits on Suppressing RANKL-Induced Osteoclastogenesis by Network Pharmacology and Validation in RAW264.7 Cells. Nutrients 2022, 14, 1020. [Google Scholar] [CrossRef]
- Zheng, W.; Zhang, M.; Zhao, Y.; Miao, K.; Jiang, H. NMR-based metabonomic analysis on effect of light on production of antioxidant phenolic compounds in submerged cultures of Inonotus obliquus. Bioresour. Technol. 2009, 100, 4481–4487. [Google Scholar] [CrossRef]
- Li, M.; Zhang, Y.; Yan, J.; Ding, F.; Chen, C.; Zhong, S.; Li, M.; Zhu, Y.; Yue, P.; Li, P.; et al. Comparative Metabolomic Analysis Reveals the Differences in Nonvolatile and Volatile Metabolites and Their Quality Characteristics in Beauty Tea with Different Extents of Punctured Leaves by Tea Green Leafhopper. J. Agric. Food Chem. 2023, 71, 16233–16247. [Google Scholar] [CrossRef]
- Xu, M.; Zhu, H.T.; Cheng, R.R.; Wang, D.; Yang, C.R.; Tanaka, T.; Kouno, I.; Zhang, Y.J. Antioxidant and hyaluronidase inhibitory activities of diverse phenolics in Phyllanthus emblica. Nat. Prod. Res. 2016, 30, 2726–2729. [Google Scholar] [CrossRef]
- Chang, C.W.; Lin, M.T.; Lee, S.S.; Liu, K.C.; Hsu, F.L.; Lin, J.Y. Differential inhibition of reverse transcriptase and cellular DNA polymerase-alpha activities by lignans isolated from Chinese herbs, Phyllanthus myrtifolius Moon, and tannins from Lonicera japonica Thunb and Castanopsis hystrix. Antiviral. Res. 1995, 27, 367–374. [Google Scholar] [CrossRef]
- Zhang, X.R.; Qiao, Y.J.; Zhu, H.T.; Kong, Q.H.; Wang, D.; Yang, C.R.; Zhang, Y.J. Multiple in vitro biological effects of phenolic compounds from Terminalia chebula var. tomentella. J. Ethnopharmacol. 2021, 275, 114135. [Google Scholar] [CrossRef]
- Przybylska, D.; Kucharska, A.Z.; Cybulska, I.; Sozański, T.; Piórecki, N.; Fecka, I. Cornus mas L. Stones: A Valuable By-Product as an Ellagitannin Source with High Antioxidant Potential. Molecules 2020, 25, 4646. [Google Scholar] [CrossRef] [PubMed]
- Shimozu, Y.; Kuroda, T.; Tsuchiya, T.; Hatano, T. Structures and Antibacterial Properties of Isorugosins H-J, Oligomeric Ellagitannins from Liquidambar formosana with Characteristic Bridging Groups between Sugar Moieties. J. Nat. Prod. 2017, 80, 2723–2733. [Google Scholar] [CrossRef] [PubMed]
- Liu, J.B.; Ding, Y.S.; Zhang, Y.; Chen, J.B.; Cui, B.S.; Bai, J.Y.; Lin, M.B.; Hou, Q.; Zhang, P.C.; Li, S. Anti-inflammatory Hydrolyzable Tannins from Myricaria bracteata. J. Nat. Prod. 2015, 78, 1015–1025. [Google Scholar] [CrossRef]
- Sehgal, R.; Sharma, A.K.; Singh, B.J.; Saini, R.V.; Saini, A.K.; Beniwal, V. Augmenting the antioxidant, anti-bacterial and anti-carcinogenic potential of Terminalia chebula and Terminalia bellirica after tannin acyl hydrolase mediated biotransformation. Biocatal. Agric. Biotechnol. 2024, 56, 103045. [Google Scholar] [CrossRef]
- Avula, B.; Wang, Y.H.; Isaac, G.; Yuk, J.; Wrona, M.; Yu, K.; Khan, I.A. Metabolic Profiling of Hoodia, Chamomile, Terminalia Species and Evaluation of Commercial Preparations Using Ultrahigh-Performance Liquid Chromatography Quadrupole-Time-of-Flight Mass Spectrometry. Planta Med. 2017, 83, 1297–1308. [Google Scholar] [CrossRef]
- Takemoto, M.; Kawamura, Y.; Hirohama, M.; Yamaguchi, Y.; Handa, H.; Saitoh, H.; Nakao, Y.; Kawada, M.; Khalid, K.; Koshino, H.; et al. Inhibition of protein SUMOylation by davidiin, an ellagitannin from Davidia involucrata. J. Antibiot. 2014, 67, 335–338. [Google Scholar] [CrossRef]
- Haramiishi, R.; Okuyama, S.; Yoshimura, M.; Nakajima, M.; Furukawa, Y.; Ito, H.; Amakura, Y. Identification of the characteristic components in walnut and anti-inflammatory effect of glansreginin A as an indicator for quality evaluation. Biosci. Biotechnol. Biochem. 2020, 84, 187–197. [Google Scholar] [CrossRef]
- Spinelli, L.V.; Anzanello, M.J.; Areze da Silva Santos, R.; Carboni Martins, C.; Freo Saggin, J.; Aparecida Silva Da Silva, M.; Rodrigues, E. Uncovering the phenolic diversity of Guabiju fruit: LC-MS/MS-based targeted metabolomics approach. Food Res. Int. 2023, 173, 113236. [Google Scholar] [CrossRef]
- Pfundstein, B.; El Desouky, S.K.; Hull, W.E.; Haubner, R.; Erben, G.; Owen, R.W. Polyphenolic compounds in the fruits of Egyptian medicinal plants (Terminalia bellerica, Terminalia chebula and Terminalia horrida): Characterization, quantitation and determination of antioxidant capacities. Phytochemistry 2010, 71, 1132–1148. [Google Scholar] [CrossRef]
- Engström, M.T.; Arvola, J.; Nenonen, S.; Virtanen, V.T.J.; Leppä, M.M.; Tähtinen, P.; Salminen, J.P. Structural Features of Hydrolyzable Tannins Determine Their Ability to Form Insoluble Complexes with Bovine Serum Albumin. J. Agric. Food Chem. 2019, 67, 6798–6808. [Google Scholar] [CrossRef]
- Liu, L.; Jia, W.; Jiang, S.; Zhang, G.; Zhao, J.; Xu, J.; Wang, L.; Wu, D.; Tao, J.; Yue, H.; et al. Inhibitory activities and rules of plant gallotannins with different numbers of galloyl moieties on sucrase, maltase and α-amylase in vitro and in vivo. Phytomedicine 2023, 120, 155063. [Google Scholar] [CrossRef]
- Pradeep, S.; Patil, S.M.; Dharmashekara, C.; Jain, A.; Ramu, R.; Shirahatti, P.S.; Mandal, S.P.; Reddy, P.; Srinivasa, C.; Patil, S.S.; et al. Molecular insights into the in silico discovery of corilagin from Terminalia chebula as a potential dual inhibitor of SARS-CoV-2 structural proteins. J. Biomol. Struct. Dyn. 2023, 41, 10869–10884. [Google Scholar] [CrossRef] [PubMed]
- Kashiwada, Y.; Nonaka, G.; Nishioka, I.; Lee, K.J.; Bori, I.; Fukushima, Y.; Bastow, K.F.; Lee, K.H. Tannins as potent inhibitors of DNA topoisomerase II in vitro. J. Pharm. Sci. 1993, 82, 487–492. [Google Scholar] [CrossRef] [PubMed]
- Quan, S.; Wen, M.; Xu, P.; Chu, C.; Zhang, H.; Yang, K.; Tong, S. Efficient screening of pancreatic lipase inhibitors from Rheum palmatum by affinity ultrafiltration-high-performance liquid chromatography combined with high-resolution inhibition profiling. Phytochem. Anal. 2024, 35, 540–551. [Google Scholar] [CrossRef] [PubMed]
- Lee, D.Y.; Yang, H.; Kim, H.W.; Sung, S.H. New polyhydroxytriterpenoid derivatives from fruits of Terminalia chebula Retz. and their α-glucosidase and α-amylase inhibitory activity. Bioorg. Med. Chem. Lett. 2017, 27, 34–39. [Google Scholar] [CrossRef]
- Xu, P.; Xiang, H.; Wen, W.; Quan, S.; Qiu, H.; Chu, C.; Tong, S. Application of two-dimensional reversed phase countercurrent chromatography × high-performance liquid chromatography to bioactivity-guided screening and isolation of α-glucosidase inhibitors from Rheum palmatum L. J. Chromatogr. A 2024, 1717, 464667. [Google Scholar] [CrossRef]
- Xu, Y.; Zhang, L.; Wang, Q.; Luo, G.; Gao, X. An integrated strategy based on characteristic fragment filter supplemented by multivariate statistical analysis in multi-stage mass spectrometry chromatograms for the large-scale detection and identification of natural plant-derived components in rat: The rhubarb case. J. Pharm. Biomed. Anal. 2019, 174, 89–103. [Google Scholar] [CrossRef]
- Kim, M.S.; Lee, D.Y.; Sung, S.H.; Jeon, W.K. Anti-cholinesterase activities of hydrolysable tannins and polyhydroxytriterpenoid derivatives from Terminalia chebula Retz. fruit. Rec. Nat. Prod. 2018, 13, 284–289. [Google Scholar] [CrossRef]
- Wang, Z.F.; Sun, W.Y.; Yu, D.H.; Zhao, Y.; Xu, H.M.; He, Y.F.; Li, H.J. Rotundic acid enhances the impact of radiological toxicity on MCF-7 cells through the ATM/p53 pathway. Int. J. Oncol. 2018, 53, 2269–2277. [Google Scholar] [CrossRef]
- Moilanen, J.; Sinkkonen, J.; Salminen, J.P. Characterization of bioactive plant ellagitannins by chromatographic, spectroscopic and mass spectrometric methods. Chemoecology 2013, 23, 165–179. [Google Scholar] [CrossRef]
- Avula, B.; Wang, Y.H.; Wang, M.; Shen, Y.H.; Khan, I.A. Simultaneous determination and characterization of tannins and triterpene saponins from the fruits of various species of Terminalia and Phyllantus emblica using a UHPLC-UV-MS method: Application to triphala. Planta Med. 2013, 79, 181–188. [Google Scholar] [CrossRef] [PubMed]
- Hernández-Corroto, E.; Marina, L.; García, C. Extraction and identification by high resolution mass spectrometry of bioactive substances in different extracts obtained from pomegranate peel. J. Chromatogr. A 2019, 1594, 82–92. [Google Scholar] [CrossRef] [PubMed]
- Mi, Y.G.; Xu, X.Y.; Hong, L.L.; Jiang, M.T.; Chen, B.X.; Li, X.H.; Wang, H.D.; Zou, Y.D.; Zhao, X.; Li, Z.; et al. Comparative Characterization of the Ginsenosides from Six Panax Herbal Extracts and Their In Vitro Rat Gut Microbial Metabolites by Advanced Liquid Chromatography-Mass Spectrometry Approaches. J. Agric. Food Chem. 2023, 71, 9391–9403. [Google Scholar] [CrossRef] [PubMed]
- Tang, C.; Li, H.J.; Fan, G.; Kuang, T.T.; Meng, X.L.; Zou, Z.M.; Zhang, Y. Network pharmacology and UPLC-Q-TOF/MS studies on the anti-arthritic mechanism of Pterocephalus hookeri. Trop. J. Pharm. Res. 2018, 17, 1095–1110. [Google Scholar] [CrossRef]
- Geng, Z.; Wang, J.; Zhu, L.; Yu, X.; Zhang, Q.; Li, M.; Hu, B.; Yang, X. Metabolomics provide a novel interpretation of the changes in flavonoids during sea buckthorn (Hippophae rhamnoides L.) drying. Food. Chem. 2023, 413, 135598. [Google Scholar] [CrossRef] [PubMed]


| No. | Identification | Formula | tR (min) | Experimental (m/z) | Adducts | Error (ppm) | MS/MS Fragment Ions (m/z) |
|---|---|---|---|---|---|---|---|
| 1 b,#,♠ | 3-O-galloyl-glucose [17] | C13H16O10 | 0.71 | 331.0662 | [M–H]− | −0.9 | 663.1391, 271.0435, 211.0234, 169.0134, 125.0235 |
| 2 a,*,♦ | Shikimic acid [18] | C7H10O5 | 0.75 | 173.0445 | [M–H]− | −2.9 | 155.0342, 137.0235, 93.0341 |
| 3 a,#,♣ | Neochebulic acid [19] | C14H12O11 | 0.76 | 355.0298 | [M–H]− | −0.8 | 711.0679, 337.0191, 293.0295, 249.0401, 205.0497− |
| 4 a,#,♣ | Chebulic acid [20] | C14H12O11 | 0.93 | 355.0303 | [M–H]− | 0.6 | 711.0682, 337.0194, 293.0297, 249.0402, 205.0501− |
| 5 b,#,♠ | 3-galloylquinic acid [21] | C14H16O10 | 1.05 | 343.0661 | [M–H]− | −1.2 | 389.0355, 191.0572, 169.0141, 125.0240 |
| 6 a,#,♠ | 1-O-galloyl-glucose [22] | C13H16O10 | 1.17 | 331.0665 | [M–H]− | 0.0 | 663.1403, 271.0457−, 211.0239, 169.0140, 125.0238 |
| 7 a,#,♠ | 6-O-galloyl-glucose [20] | C13H16O10 | 1.38 | 331.0666 | [M–H]− | 0.3 | 663.1408, 271.0455, 211.0244, 169.0135, 125.0238 |
| 8 a,*,♠ | Gallic acid [22] | C7H6O5 | 1.53 | 169.0139 | [M–H]− | 1.2 | 125.0238 |
| 9 a,#,♠ | 2-O-galloyl-glucose [23] | C13H16O10 | 1.55 | 331.0665 | [M–H]− | 0.0 | 663.1407, 271.0455, 211.0244, 169.0134, 125.0236 |
| 10 a,#,♣ | Gemin D [20] | C27H22O18 | 1.59 | 633.0726 | [M–H]− | −0.3 | 463.0544, 300.9984, 275.0194, 169.0135, 125.0234 |
| 11 b,#,♠ | 5-galloylquinic acid [21] | C14H16O10 | 1.72 | 343.0662 | [M–H]− | −0.9 | 389.0356, 191.0542, 169.0138, 125.0236 |
| 12 a,#,♣ | Isochebulic acid [19] | C14H12O11 | 1.78 | 355.0299 | [M–H]− | −0.6 | 711.0686, 337.0196, 293.0303, 249.0401, 205.0499 |
| 13 a,#,♣ | Punicalin α [24] | C34H22O22 | 1.78 | 781.0529 | [M–H]− | 0.6 | 600.9893, 448.9792, 300.9988 |
| 14 a,#,♣ | Punicalin β [24] | C34H22O22 | 1.85 | 781.0524 | [M–H]− | −0.4 | 600.9888, 448.9778, 300.9974 |
| 15 a,#,♠ | 4-O-galloyl-glucose [23] | C13H16O10 | 1.88 | 331.06663 | [M–H]− | −0.6 | 663.1405, 271.0455, 211.0242, 169.0132, 125.0232 |
| 16 b,#,♦ | Caffeic acid 3,4-O-Di glucuronide [25] | C21H24O16 | 1.93 | 531.0993 | [M–H]− | 1.3 | 1063.2059, 355.0307, 337.0200, 179.0710, 161.0603, 135.0446 |
| 17 b,#,♠ | 4-galloylquinic acid [21] | C14H16O10 | 2.19 | 343.0665 | [M–H]− | 0 | 709.0888, 687.1402, 389.0350, 191.0535, 169.0132, 125.0238 |
| 18 b,#,♣ | Isostrictinin [26] | C27H22O18 | 2.19 | 633.0728 | [M–H]− | 0.2 | 463.0517, 300.9981, 275.0190, 169.0136, 125.0235 |
| 19 a,#,♣ | Punicacortein C [20] | C48H28O30 | 2.33 | 1083.0585 | [M–H]− | −0.2 | 541.0242, 1065.0491, 1021.0580, 600.9891, 499.0722, 300.9983, 169.0136, 125.0235 |
| 20 a,#,♣ | Punicacortein D [20] | C48H28O30 | 2.52 | 1083.0599 | [M–H]− | 1.1 | 541.0250, 1065.0491, 1021.0573, 600.9891, 499.0722, 300.9983, 169.0136, 125.0235 |
| 21 a,#,♣ | 7′-O-methyl chebulate [20] | C15H14O11 | 2.57 | 369.0460 | [M–H]− | 0.5 | 739.1009, 351.0338, 325.0563, 307.0460 |
| 22 a,#,♠ | 4-O-galloyl-shikimic acid [20] | C14H14O9 | 2.74 | 325.0557 | [M–H]− | −0.9 | 651.1190, 307.0451−, 173.0440, 169.0136, 155.0342, 125.0235 |
| 23 a,#,♠ | 1,4-di-O-galloyl-β-D-glucose [23] | C20H20O14 | 2.78 | 483.0778 | [M–H]− | 0.6 | 967.1592, 331.0670, 313.0560, 211.0242, 193.0137, 169.0135, 125.0234 |
| 24 a,#,♣ | Chebumeinin A [27] | C27H26O20 | 2.78 | 669.0943 | [M–H]− | 0.6 | 691.0753, 517.0834, 499.0733, 337.0200, 293.0300, 249.0397, 205.0500 |
| 25 a,#,♠ | 5-O-galloyl-shikimic acid [20] | C14H14O9 | 2.92 | 325.0559 | [M–H]− | −0.3 | 651.1192, 307.0451, 173.0440, 169.0136, 155.0342, 125.0235 |
| 26 a,#,♠ | 3-O-galloyl-shikimic acid [20] | C14H14O9 | 3.04 | 325.0559 | [M–H]− | −0.3 | 651.1185, 307.0451−, 173.0440, 169.0136, 155.0342, 125.0235 |
| 27 a,#,♣ | Chebumeinin B [27] | C27H26O20 | 3.21 | 669.0939 | [M–H]− | 0.0 | 691.0773, 517.0753, 499.0724, 337.0219, 293.0300, 249.0402, 205.0500 |
| 28 a,#,♣ | 6′-O-methyl chebulate [20] | C15H14O11 | 3.45 | 369.0453 | [M–H]− | −1.4 | 739.0991, 351.0316, 325.0558, 307.0438 |
| 29 a,#,♣ | Valoneic acid dilactone [28] | C21H10O13 | 3.57 | 469.0050 | [M–H]− | −0.6 | 939.0164, 425.0144, 407.0038, 300.9969, 299.9902, 169.0137, 125.0237 |
| 30 a,#,♠ | 2,4-di-O-galloyl-β-D-glucose [29] | C20H20O14 | 3.77 | 483.0780 | [M–H]− | 1.0 | 967.1611, 331.0666, 313.0543, 211.0245, 193.0131, 169.0134, 125.0236 |
| 31 a,*,♣ | Punicalagin α [20] | C48H28O30 | 3.84 | 1083.0583 | [M–H]− | −0.4 | 541.0252, 781.0526, 600.9891, 300.9983, 169.0136, 125.0235 |
| 32 b,#,♠ | 3,4-di-O-galloyl-β-D-glucose [30] | C20H20O14 | 3.92 | 483.0771 | [M–H]− | −0.8 | 967.1619, 331.0651, 313.0544, 271.0446, 211.0243, 193.0128, 169.0134, 125.0235 |
| 33 a,#,♣ | Phyllanemblinin D [24] | C27H26O20 | 4.10 | 669.0940 | [M–H]− | 0.1 | 691.0770, 517.0822, 499.0734, 337.0210, 293.0293, 249.0396, 205.0501 |
| 34 b,#,♣ | Rhoipteleanin G [31] | C48H30O30 | 4.39 | 1085.0745 | [M–H]− | 0.1 | 542.0319, 783.0687, 631.0569, 450.9943, 300.9985 |
| 35 a,#,♣ | Phyllanemblinin F [20] | C27H26O20 | 4.45 | 669.0939 | [M–H]− | 0.0 | 691.0776, 499.0734, 337.0196, 293.0295, 249.0397, 205.0500 |
| 36 a,#,♠ | 2,6-di-O-galloyl-β-D-glucose [32] | C20H20O14 | 4.59 | 483.0778 | [M–H]− | 0.6 | 967.1616, 331.0658, 313.0567, 271.0459, 211.0241, 193.0138, 169.0134, 125.0239 |
| 37 a,#,♠ | 4,6-di-O-galloyl-β-D-glucose [23] | C20H20O14 | 4.92 | 483.0776 | [M–H]− | 0.2 | 967.1622, 331.0672, 313.0565, 271.0455, 211.0243, 193.0134, 169.0134, 125.0236 |
| 38 a,#,♣ | Strictinin [26] | C27H22O18 | 5.08 | 633.0728 | [M–H]− | 0.0 | 463.0482, 300.9982, 275.0190, 169.0135, 125.0237 |
| 39 a,#,♠ | Methyl gallate [20] | C8H8O5 | 5.41 | 183.0290 | [M–H]− | −1.6 | 169.0134, 168.0053, 125.0230, 124.0160 |
| 40 b,#,♠ | 1,2-di-O-galloyl-β-D-glucose [33] | C20H20O14 | 5.69 | 483.0776 | [M–H]− | 0.2 | 967.1614, 331.0665, 313.0554, 271.0451, 211.0243, 193.0136, 169.0134, 125.0237 |
| 41 a,#,♠ | 2,3-di-O-galloyl-β-D-glucose [23] | C20H20O14 | 6.01 | 483.0776 | [M–H]− | 0.2 | 967.1624, 331.0657, 313.0558, 271.0454, 211.0242, 193.0136, 169.0133, 125.0237 |
| 42 a,#,♣ | Phyllanemblinin E [20] | C27H26O20 | 6.23 | 669.0933 | [M–H]− | −0.9 | 691.0761, 499.0725, 337.0203, 293.0300, 249.0397, 205.0497 |
| 43 a,*,♣ | Punicalagin β [20] | C48H28O30 | 6.43 | 1083.0586 | [M–H]− | −0.1 | 541.0252, 781.0526, 600.9891, 300.9983, 169.0136 |
| 44 a,#,♠ | 1,6-di-O-galloyl-β-D-glucose [20] | C20H20O14 | 6.79 | 483.0780 | [M–H]− | 1.0 | 967.1631, 331.0668, 313.0558, 271.0455, 211.0242, 193.0136, 169.0134, 125.0237 |
| 45 a,#,♠ | 3,6-di-O-galloyl-β-D-glucose [20] | C20H20O14 | 7.21 | 483.0782 | [M–H]− | 1.4 | 967.1636, 331.0666, 313.0560, 271.0458, 211.0243, 169.0135, 125.0238 |
| 46 a,#,♣ | Terflavin a [20] | C48H30O30 | 7.73 | 1085.0756 | [M–H]− | 1.1 | 542.0331, 783.0696, 631.0578, 450.9946, 300.9987 |
| 47 a,#,♦ | Brevifolin carboxylic acid [20] | C13H8O8 | 7.73 | 291.0145 | [M–H]− | 1.4 | 337.0199, 247.0232, 203.0342 |
| 48 a,#,♠ | 3,4-di-O-galloylshikimic acid [29] | C21H18O13 | 8.03 | 477.0672 | [M–H]− | 0.6 | 499.0485, 325.0577, 307.0452, 169.0135, 137.0237, 125.0238 |
| 49 a,#,♠ | 1,3-di-O-galloyl-β-D-glucose [32] | C20H20O14 | 8.21 | 483.0777 | [M–H]− | 0.4 | 967.1615, 331.0655, 313.0557, 271.0454, 211.0240, 169.0136, 125.0237 |
| 50 b,#,♣ | Hippomanin A [34] | C27H22O18 | 8.35 | 633.0732 | [M–H]− | 0.6 | 463.0542, 300.9984, 275.0194, 169.0138, 125.0237 |
| 51 b,#,♠ | 1,2,4-tri-O-galloyl-β-D-glucose [35] | C27H24O18 | 8.57 | 635.0885 | [M–H]− | 0.2 | 317.0391, 657.0715, 483.0771, 465.0676, 313.0557, 295.0457, 169.0135, 125.0235 |
| 52 a,#,♣ | Amlaic acid [32] | C27H24O19 | 9.48 | 651.0836 | [M–H]− | 0.3 | 325.0374, 633.0739, 481.0624, 337.0210, 319.0083, 275.0190, 169.0135 |
| 53 a,#,♣ | Methyl neochebulanin [20](4-O-methyl neochebulate-1-O-galloyl-glucose) | C28H28O20 | 9.48 | 683.1100 | [M–H]− | 0.6 | 705.0916, 341.0500, 513.0892, 351.0351, 307.0457, 263.0559, 219.0293, 204.0395, |
| 54 b,#,♦ | Phelligridin J [36] | C13H6O8 | 9.98 | 288.9984 | [M–H]− | 1.4 | 245.0086 |
| 55 b,#,♠ | 1,3,4-tri-O-galloyl-β-D-glucose [37] | C27H24O18 | 10.19 | 635.0891 | [M–H]− | 1.1 | 657.0726, 317.0398, 483.0783, 465.0667, 313.0562, 295.0447, 169.0134, 125.0237 |
| 56 c,♣ | 2-O-methyl neochebulate-1-O-galloyl-glucose | C28H28O20 | 10.48 | 683.1098 | [M–H]− | 0.3 | 705.0890, 341.0493, 513.0911, 351.0357, 307.0466, 263.0541, 219.0296, 204.0395 |
| 57 a,#,♠ | 1,2,6-tri-O-galloyl-β-D-glucose [23] | C27H24O18 | 10.90 | 635.0886 | [M–H]− | 0.3 | 657.0710, 317.0399, 483.0784, 465.0669, 313.0558, 295.0454, 169.0134, 125.0239 |
| 58 b,#,♣ | Carpinusnin [38] | C41H34O29 | 11.10 | 989.1116 | [M–H]− | 0.8 | 494.0514, 651.0831, 481.0624, 337.0194 |
| 59 a,#,♣ | Tercatain [20] | C34H26O22 | 11.56 | 785.0833 | [M–H]− | −0.5 | 807.0775, 392.0367, 615.0608, 483.0765, 463.0505, 445.0401, 300.9980 |
| 60 a,#,♠ | 3,4,6-tri-O-galloyl-β-D-glucose [20] | C27H24O18 | 11.69 | 635.0884 | [M–H]− | 0 | 657.0705, 317.0396, 483.0775, 465.0668, 313.0557, 295.0449, 169.0133, 125.0237 |
| 61 b,#,♠ | 3,5-di-O-galloylshikimic acid [39] | C21H18O13 | 11.92 | 477.0671 | [M–H]− | 0.4 | 499.0492, 325.0577, 307.0466, 169.0133, 137.0235, 125.0236 |
| 62 a,#,♣ | Chebulanin [20] | C27H24O19 | 12.17 | 651.0833 | [M–H]− | −0.2 | 325.0369, 633.0728, 481.0620, 337.0202, 319.0089, 275.0195, 169.0136, 125.0236 |
| 63 c,♣ | 6-O-methyl neochebulate-1-O-galloyl-glucose | C28H28O20 | 12.17 | 683.1091 | [M–H]− | −0.7 | 705.0886, 341.0510, 513.0881, 351.0343, 307.0459, 263.0560, 219.0291, 204.0392 |
| 64 c,♣ | 4-galloyl-6-neochebuloyl-2,3-HHDP-glucose | C41H32O28 | 12.17 | 971.1006 | [M–H]− | 0.4 | 485.0460, 953.0898, 935.0793, 801.0782, 669.0914, 633.0727, 499.0726, 463.0513, 337.0202, 300.9981 |
| 65 b,#,♠ | 4,5-di-O-galloylshikimic acid [39] | C21H18O13 | 12.89 | 477.0672 | [M–H]− | 0.6 | 499.0485, 325.0577, 307.0452, 169.0135, 137.0237, 125.0238 |
| 66 c,♣ | 3-O-methyl neochebulate-1-O-galloyl-glucose | C28H28O20 | 13.02 | 683.1088 | [M–H]− | −1.2 | 705.0922, 341.0499, 513.0967, 351.0341, 307.0438, 263.0558, 219.0274, 204.0385 |
| 67 c,♣ | 1-galloyl-2-neochebuloyl-4,6-HHDP-glucose | C41H32O28 | 13.29 | 971.1009 | [M–H]− | 0.7 | 485.0450, 953.0893, 935.0793, 801.0742, 669.0939, 633.0729, 499.0729, 463.0508, 337.0195, 300.9981 |
| 68 a,#,♣ | Tellimagrandin I [20] | C34H26O22 | 13.32 | 785.0848 | [M–H]− | 1.4 | 807.0668, 392.0373, 633.0729, 483.0779, 463.0504, 445.0413, 300.9980 |
| 69 a,#,♦ | Urolithin M5 [40] | C13H8O7 | 13.32 | 275.0195 | [M–H]− | 1.1 | 551.0461, 257.0085, 229.0139, 201.0183 |
| 70 c,♣ | 1-galloyl-3-neochebuloyl-4,6-HHDP-glucose | C41H32O28 | 13.67 | 971.1014 | [M–H]− | 1.2 | 485.0457, 953.0887, 935.0786, 801.0779, 669.0923, 633.0719, 499.0723, 463.0506, 337.0191, 300.9980 |
| 71 a,*,♣ | Corilagin [20] | C27H22O18 | 14.07 | 633.0724 | [M–H]− | −0.6 | 463.0514, 300.9985, 275.0189, 169.0135, 125.0235 |
| 72 a,#,♠ | 1,4,6-tri-O-galloyl-β-D-glucose [23] | C27H24O18 | 15.17 | 635.0880 | [M–H]− | −0.6 | 317.0391, 657.0696, 483.0782, 465.0675, 313.0558, 295.0453, 169.0134, 125.0236 |
| 73 b,#,♠ | 2,3,4-tri-O-galloyl-β-D-glucose [41] | C27H24O18 | 15.71 | 635.0881 | [M–H]− | −0.5 | 317.0393, 657.0696, 483.0773, 465.0668, 313.0555, 295.0451, 169.0133, 125.0238 |
| 74 c,♣ | 1-galloyl-2-neochebuloyl-3,6-HHDP-glucose | C41H32O28 | 15.96 | 971.1000 | [M–H]− | −0.2 | 485.0450, 953.0904, 935.0748, 801.0808, 669.1053, 633.0721, 499.0756, 463.0502, 337.0193, 300.9983 |
| 75 b,#,♠ | 2,4,6-tri-O-galloyl-β-D-glucose [42] | C27H24O18 | 16.16 | 635.0881 | [M–H]− | −0.5 | 317.0395, 657.0709, 483.0776, 465.0690, 313.0558, 295.0443, 169.0134, 125.0240 |
| 76 b,#,♣ | 1,3-di-O-galloyl-4,6-HHDP-glucose [43] | C34H26O22 | 16.25 | 785.0848 | [M–H]− | 1.4 | 807.0668, 392.0373, 633.0729, 483.0779, 463.0504, 445.0413, 300.9980 |
| 77 a,#,♠ | 1,3,6-tri-O-galloyl-β-D-glucose [22] | C27H24O18 | 16.68 | 635.0872 | [M–H]− | −1.9 | 317.0391, 657.0693, 483.0772, 465.0667, 313.0555, 295.0449, 169.0134, 125.0234 |
| 78 a,#,♣ | 1,3-di-O-galloyl-2,4-chebuloyl-D-glucose [44] | C34H28O23 | 17.10 | 803.0942 | [M–H]− | −0.1 | 825.0756, 401.0424, 785.0836, 633.0723, 589.0815,533.0569, 483.0198, 313.0563 |
| 79 a,#,♣ | Neochebulagic acid [20](1-galloyl-4-neochebuloyl-3,6-HHDP-glucose) | C41H32O28 | 17.57 | 971.0999 | [M–H]− | −0.3 | 485.0457, 953.0826, 935.0793, 801.0682, 669.1024, 633.0735, 499.0777, 463.0483, 337.0194, 300.9984 |
| 80 a,#,♠ | 1,2,3,6-tetra-O-galloyl-β-D-glucose [20] | C34H28O22 | 17.62 | 787.0999 | [M–H]− | 0.6 | 809.0811, 393.0450, 635.0889, 617.0783, 483.0782, 465.0676, 447.0562, 313.0555, 295.0450 |
| 81 a,#,♣ | Tellimagrandin II [18] | C41H30O26 | 17.82 | 937.0959 | [M–H]− | 1.3 | 468.0425, 767.0801, 635.0894, 465.0661, 313.0561, 300.9982 |
| 82 b,#,♠ | 2,3,6-tri-O-galloyl-β-D-glucose [35] | C27H24O18 | 17.97 | 635.0879 | [M–H]− | −0.8 | 317.0401, 657.0699, 483.0765, 465.0678, 313.0568, 295.0454, 169.0136, 125.0237 |
| 83 c,♣ | 1,2,3-tri-O-galloyl-4-neochebuloyl-D-glucose | C41H34O28 | 18.15 | 973.1159 | [M–H]− | 0.1 | 486.0532, 803.0942, 635.0881, 633.0729, 483.0779, 465.0667, 463.0511, 337.0193, 300.9985 |
| 84 a,#,♣ | Terchebulin [45] | C48H28O30 | 19.00 | 1083.0604 | [M–H]− | 1.6 | 541.0252, 781.0580, 600.9910, 448.9790, 300.9985, 169.0136, 125.0236 |
| 85 a,#,♠ | 1,2,3-tri-O-galloyl-β-D-glucose [23] | C27H24O18 | 19.24 | 635.0880 | [M–H]− | −0.6 | 657.0691, 317.0393, 483.0773, 465.0668, 313.0558, 295.0443, 169.0133, 125.0238 |
| 86 c,♣ | 1-O-galloyl-3,4-chebuloyl-2,6-HHDP-D-glucose | C41H30O27 | 19.65 | 953.0919 | [M–H]− | 2.4 | 476.0416, 783.0739, 651.0840, 633.0735, 481.0611, 463.0504, 337.0199, 331.0665, 319.0095, 300.9988 |
| 87 c,♣ | 1-galloyl-4-neochebuloyl-2,3-HHDP-glucose | C41H32O28 | 19.92 | 971.1003 | [M–H]− | 0.1 | 485.0459, 953.0898, 935.0773, 801.0789, 669.0975, 633.0717, 499.0704, 463.0513, 337.0197, 300.9984 |
| 88 a,*,♣ | Ellagic acid [20] | C14H6O8 | 20.04 | 300.9987 | [M–H]− | 1.0 | 283.9958, 257.0087, 229.0122, 201.0182, 185.0236, 173.0223, 145.0288, 117.0326 |
| 89 c,♣ | 1-O-galloyl-3,4-THDP-2,6-HHDP-D-glucose | C40H30O26 | 20.13 | 925.0954 | [M–H]− | 0.8 | 462.0426, 773.0887, 755.0728, 633.0735, 463.0518, 300.9986 |
| 90 c,♣ | 1-O-galloyl-3,6-chebuloyl-2,4-HHDP-D-glucose | C41H30O27 | 20.27 | 953.0895 | [M–H]− | −0.1 | 476.0406, 783.0743, 651.0848, 633.0744, 481.0629, 463.0519, 337.0198, 331.0643, 319.0092, 300.9991 |
| 91 b,#,♣ | Punicafolin [38] | C41H30O26 | 20.29 | 937.0961 | [M–H]− | 1.5 | 468.0435, 767.0743, 635.0884, 465.0688, 313.0545, 300.9987 |
| 92 c,♣ | 1,6-di-O-galloyl-2,4-chebuloyl-D-glucose | C34H28O23 | 20.37 | 803.0957 | [M–H]− | 1.7 | 401.0431, 825.0756, 785,0836, 633.0723, 589.0815, 533.0569, 483.0198, 313.0563 |
| 93 b,#,♣ | Phyllantusiin C [30] | C40H30O26 | 20.37 | 925.0955 | [M–H]− | −0.3 | 462.0449, 773.0849, 755.0762, 633.0731, 463.0514, 300.9985 |
| 94 a,♣ | 1,3,6-tri-O-galloyl-4-neochebuloyl-D-glucose [29] | C41H34O28 | 20.50 | 973.1162 | [M–H]− | 0.4 | 486.0536, 803.0956, 635.0879, 633.0724, 483.0755, 465.0685, 463.0514, 337.0192, 300.9984 |
| 95 c,♣ | 1-O-galloyl-4,6-chebuloyl-2,3-HHDP-D-glucose | C41H30O27 | 20.60 | 953.0893 | [M–H]− | −0.3 | 476.0412, 783.0712, 651.0827, 633.0726, 481.0653, 463.0526, 337.0191, 331.0658, 319.0093, 300.9987 |
| 96 c,♣ | 1-O-galloyl-3,6-THDP-2,4-HHDP-D-glucose | C40H30O26 | 20.77 | 925.0959 | [M–H]− | 1.3 | 462.0430, 773.0862, 755.0744, 633.0735, 463.0521, 300.9988 |
| 97 b,#,♣ | Davidiin [46] | C41H30O26 | 20.86 | 937.0964 | [M–H]− | 1.8 | 468.0435, 767.0731, 635.0885, 465.0673, 313.0563, 300.9987 |
| 98 c,♣ | 3,6-di-O-galloyl-2,4-chebuloyl-D-glucose | C34H28O23 | 20.90 | 803.0961 | [M–H]− | 2.2 | 825.0776, 401.0432, 785.0864, 633.0743, 589.0851, 533.0582, 483.0163, 313.0558 |
| 99 c,♠ | 3,4,5-tri-O-galloyl shikimic acid | C28H22O18 | 20.90 | 629.0789 | [M–H]− | 1.6 | 477.0655, 459.0561, 325.0501, 307.0443, 289.0357, 169.0138 |
| 100 c,♣ | 1,2,6-tri-O-galloyl-4-neochebuloyl-D-glucose | C41H34O28 | 20.94 | 973.1168 | [M–H]− | 1.0 | 486.0546, 803.0958, 635.0894, 633.0729, 483.0772, 465.0677, 463.0529, 337.0198, 300.9986 |
| 101 c,♣ | 2-galloyl-3-neochebuloyl-4,6-HHDP-glucose | C41H32O28 | 20.94 | 971.1013 | [M–H]− | 1.1 | 485.0463, 953.0900, 935.0801, 801.0813, 669.0943, 633.0731, 499.0749, 463.0515, 337.0198, 300.9986 |
| 102 a,#,♣ | Eschweilenol C [20] | C20H16O12 | 21.01 | 447.0573 | [M–H]− | 2.0 | 895.1224, 300.9984 |
| 103 c,♣ | 1-O-galloyl-4,6-THDP-2,3-HHDP-D-glucose | C40H30O26 | 21.07 | 925.0956 | [M–H]− | 1.0 | 462.0424, 773.0867, 755.0684, 633.0731, 463.0518, 300.9983 |
| 104 c,♣ | 1,3,4-tri-O-galloyl-2,6-HHDP-glucose | C41H30O26 | 21.10 | 937.0964 | [M–H]− | 1.8 | 468.0437, 767.0753, 635.0886, 465.0679, 313.0557, 300.9991 |
| 105 a,*,♣ | Chebulagic acid [22] | C41H30O27 | 21.15 | 953.0896 | [M–H]− | 1.7 | 476.0415, 783.0693, 651.0840, 633.0735, 481.0627, 463.0518, 337.0198, 331.0667, 319.0092, 300.9990 |
| 106 c,♣ | 2,3,6-tri-O-galloyl-4-neochebuloyl-D-glucose | C41H34O28 | 21.29 | 973.1172 | [M–H]− | 1.4 | 486.0541, 803.0955, 635.0891, 633.07235, 483.0763, 465.0677, 463.0523, 337.0198, 300.9992 |
| 107 b,#,♣ | Pterocarinin C [47] | C41H30O26 | 21.34 | 937.0959 | [M–H]− | 1.3 | 468.0432, 767.0742, 635.0887, 465.0670, 313.0559, 300.9989 |
| 108 a,#,♠ | 1,2,3,4-tetra-O-galloyl-β-D-glucose [23] | C34H28O22 | 21.35 | 787.0999 | [M–H]− | 0.6 | 809.0834, 393.0457, 635.0889, 617.0782, 483.0770, 465.0676, 447.0555, 313.0556, 295.0450 |
| 109 c,♣ | 1-galloyl-6-neochebuloyl-2,3-HHDP-glucose | C41H32O28 | 21.39 | 971.1014 | [M–H]− | 1.2 | 485.0464, 953.0909, 935.0782, 801.0809, 669.1044, 633.0738, 499.0724, 463.0503, 337.0197, 300.9990 |
| 110 b,#,♣ | 1,6-di-O-galloyl-2,3-HHDP-glucose [48] | C34H26O22 | 21.47 | 785.0848 | [M–H]− | 1.4 | 807.0668, 392.0373, 633.0729, 483.0779, 463.0504, 445.0413, 300.9980 |
| 111 c,♣ | 1,2,3-tri-O-galloyl-4-methyl neochebuloyl-glucose | C42H36O28 | 21.74 | 987.1318 | [M–H]− | 0.3 | 493.0620, 817.1097, 635.0881, 465.0668, 351.0352, 295.0450 |
| 112 a,#,♠ | 1,2,4,6-tetra-O-galloyl-β-D-glucose [23] | C34H28O22 | 21.85 | 787.0994 | [M–H]− | 0.0 | 809.0809, 393.0447, 635.0881, 617.0773, 483.0768, 465.0674, 447.0560, 313.0555, 295.0451 |
| 113 a,#,♣ | 1-O-galloyl-3,6-HHDP-4-6′ methyl neochebuloyl-glucose [49] | C42H34O28 | 21.94 | 985.1156 | [M–H]− | −0.2 | 492.0533, 815.0938, 683.0846, 633.0719, 513.0870, 463.0513, 351.0342, 300.9983 |
| 114 a,#,♠ | 1,3,4,6-tetra-O-galloyl-β-D-glucose [20] | C34H28O22 | 22.00 | 787.0995 | [M–H]− | 0.1 | 809.0819, 393.0447, 635.0874, 617.0775, 483.0771, 465.0668, 447.0558, 313.0556, 295.0449 |
| 115 c,♣ | 2-O-galloyl-3,6-HHDP-4-6′ methyl neochebuloyl-glucose | C42H34O28 | 22.13 | 985.1154 | [M–H]− | −0.4 | 492.0534, 815.0939, 683.0846, 633.0718, 513.0867, 463.0512, 351.0346, 300.9983 |
| 116 c,♣ | 1-O-galloyl-2,3-THDP-4,6-HHDP-D-glucose | C40H30O26 | 22.20 | 925.0941 | [M–H]− | −0.6 | 462.0423, 773.0825, 755.0762, 633.0716, 463.0508, 300.9982 |
| 117 a,#,♣ | 1,2-di-O-galloyl-4,6-HHDP-glucose [50] | C34H26O22 | 22.29 | 785.0833 | [M–H]− | −0.5 | 807.0775, 392.0367, 615.0608, 483.0765, 463.0505, 445.0401, 300.9980 |
| 118 c,♣ | 2-galloyl-4-neochebuloyl-3,6-HHDP-glucose | C41H32O28 | 22.49 | 971.1006 | [M–H]− | 0.4 | 485.0472, 953.0893, 935.0806, 801.0945, 669.0826, 633.0731, 499.0716, 463.0505, 337.0193, 300.9982 |
| 119 c,♣ | 1-O-galloyl-2,6-chebuloyl-3,4-HHDP-D-glucose | C41H30O27 | 22.65 | 953.0883 | [M–H]− | −1.4 | 476.0383, 783.0655, 651.0851, 633.0722, 481.0618, 463.0501, 337.0194, 331.0634, 319.0079, 300.9979 |
| 120 b,#,♠ | 2,3,4,6-tetra-O-galloyl-β-D-glucose [51] | C34H28O22 | 22.66 | 787.0986 | [M–H]− | −1.0 | 809.0819, 393.0447, 635.0871, 617.0767, 483.0764, 465.0662, 447.0559, 313.0554, 295.0446 |
| 121 c,♣ | 6-galloyl-4-neochebuloyl-2,3-HHDP-glucose | C41H32O28 | 22.84 | 971.0999 | [M–H]− | −0.3 | 485.0458, 953.0894, 935.0800, 801.0879, 669.0791, 633.0726, 499.0721, 463.0498, 337.0190, 300.9981 |
| 122 c,♣ | 1,2,3-tri-O-galloyl-4,6-neochebuloyl-glucose | C41H32O27 | 23.03 | 955.1048 | [M–H]− | −0.5 | 477.0480, 785.0828, 617.0756, 465.0661, 447.0555, 337.0194 |
| 123 c,♣ | 1-O-galloyl-2,3-chebuloyl-4,6-HHDP-D-glucose | C41H30O27 | 23.76 | 953.0882 | [M–H]− | −1.5 | 476.0395, 783.0699, 651.0839, 633.0712, 481.0641, 463.0492, 337.0190, 331.0685, 319.0087, 300.9981 |
| 124 c,♣ | 1,2,4-tri-O-galloyl-3,6-neochebuloyl-glucose | C41H32O27 | 23.82 | 955.1045 | [M-H]− | −0.8 | 477.0481, 785.0828, 617.0765, 465.0669, 447.0562, 337.0189 |
| 125 a,#,♣ | 1,3,6-tri-O-galloyl-4-methyl neochebuloyl-glucose [20] | C42H36O28 | 23.93 | 987.1302 | [M–H]− | 1.1 | 493.0611, 817.1092, 635.0872, 465.0662, 351.0343, 295.0445 |
| 126 c,♣ | 1,2,6-tri-O-galloyl-4-methyl neochebuloyl-glucose | C42H36O28 | 24.36 | 987.1313 | [M–H]− | −0.2 | 493.5631, 817.1094, 635.0876, 465.0673, 351.0338, 295.0440 |
| 127 a,*,♣ | Chebulinic acid [20](1,3,6-tri-O-galloyl-2,4-chebuloyl-glucose) | C41H32O27 | 24.57 | 955.1054 | [M–H]− | 0.1 | 477.0486, 785.0839, 635.0873, 617.0771, 465.0668, 447.0558, 337.0190 |
| 128 c,♣ | 2,3,6-tri-O-galloyl-4-methyl neochebuloyl-glucose | C42H36O28 | 25.47 | 987.1324 | [M–H]− | 0.9 | 493.0623, 817.1107, 635.0883, 465.0674, 351.0348, 295.0458 |
| 129 c,♣ | 1,4,6-tri-O-galloyl-2,3-neochebuloyl-glucose | C41H32O27 | 25.47 | 955.1041 | [M–H]− | −1.3 | 477.0491, 785.0850, 617.0781, 465.0674, 447.0564, 337.0197 |
| 130 a,*,♠ | 1,2,3,4,6-penta-O-galloyl-β-D-glucose [22] | C41H32O26 | 26.73 | 939.1113 | [M–H]− | 1.0 | 469.0515, 787.1005, 769.0900, 617.0784, 599.0676, 465.0677, 447.0568, 429.0460, 313.0565, 295.0456, 277.0352, 259.0245, 169.0136, 125.0237 |
| 131 a,#,♣ | Terchebin [52] | C41H30O27 | 28.19 | 953.0901 | [M–H]− | 0.5 | 935.0799, 917.0695, 617.0781, 465.0671, 316.9932, 295.0452 |
| 132 a,#,♣ | 4-O-(4″-O-galloyl-α-rhamnopyranosyl) ellagic acid [49] | C27H20O16 | 28.94 | 599.0673 | [M–H]− | 0.0 | 1199.1431, 621.0486, 447.0560, 429.0441, 300.9985 |
| 133 c,♣ | 1-O-galloyl-2,6-THDP-3,4-HHDP-D-glucose | C40H30O26 | 29.04 | 925.0959 | [M–H]− | 1.3 | 462.0432, 773.0815, 755.0752, 633.0731, 463.0506, 300.9982 |
| 134 a,#,♣ | 4-O-(2″,3″-di-O-galloyl-α-L-rhamnosyl) ellagic acid [20] | C34H24O20 | 29.31 | 751.0782 | [M–H]− | −0.1 | 375.0342, 599.0668, 581.0553, 449.0718, 411.0366, 300.9985 |
| 135 b,#,♣ | Nupharin A [53] | C41H30O26 | 29.35 | 937.0955 | [M–H]− | 0.9 | 468.0433, 767.0732, 635.0894, 465.0674, 313.0573, 300.9988 |
| 136 c,♠ | 1-O-cinnamoyl-6-O-galloyl-glucose | C22H22O11 | 29.39 | 461.1084 | [M–H]− | 0 | 313.0558, 169.0135, 147.0436 |
| 137 a,#,♣ | 4-O-(2″,4″-di-O-galloyl-α-L-rhamnosyl) ellagic acid [20] | C34H24O20 | 29.42 | 751.0782 | [M–H]− | −0.1 | 375.0342, 599.0668, 581.0553, 449.0718, 411.0366, 300.9985 |
| 138 a,#,♣ | 4-O-(3″,4″-di-O-galloyl-α-rhamnopyranosyl) ellagic acid [49] | C34H24O20 | 29.50 | 751.0776 | [M–H]− | −0.9 | 375.0338, 599.0660, 581.0549, 449.0713, 411.0292, 300.9977 |
| 139 c,♥ | Arjungenin-24-O-glucoheptonic acid | C37H60O13 | 29.59 | 711.3952 | [M–H]− | −0.6 | 503.3379 |
| 140 b,#,♠ | 1-O-galloyl-2-O-cinnamoyl-glucose [54] | C22H22O11 | 29.73 | 461.1092 | [M–H]− | 1.7 | 923.2247, 313.0561, 169.0133, 147.0443 |
| 141 a,#,♥ | Quercotriterpenoside I [55] | C43H62O15 | 29.73 | 817.4018 | [M–H]− | 1.0 | 655.3484, 503.3366 |
| 142 b,#,♠ | 1-O-galloyl-6-O-cinnamoyl-glucose [54] | C22H22O11 | 29.81 | 461.1077 | [M–H]− | −1.5 | 313.0562, 169.0132, 147.0443 |
| 143 a,#,♠ | 1,2-O-galloyl-6-O-cinnamoyl-glucose [20] | C29H26O15 | 29.82 | 613.1190 | [M–H]− | −0.5 | 465.0682, 461.1077, 313.0560, 169.0131, 147.0443 |
| 144 b,#,♠ | 1-O-cinnamoyl-2-O-galloyl-glucose [56] | C22H22O11 | 29.95 | 461.10978 | [M–H]− | −1.3 | 313.0549, 169.0132, 147.0434 |
| 145 c,♥ | Madecassic acid-24-galloyl-28-glucose | C43H62O15 | 30.13 | 817.4008 | [M–H]− | −0.2 | 655.3470, 503.3369 |
| 146 b,#,♠ | 1-O-cinnamoyl-2,6-O-galloyl-glucose [57] | C29H26O15 | 30.19 | 613.1190 | [M–H]− | −0.5 | 465.0667, 461.1085, 313.0558, 169.0131, 147.0441 |
| 147 a,#,♥ | Terminolic acid-24-galloyl-28-glucose [56] | C43H62O15 | 30.27 | 817.3998 | [M–H]− | −1.5 | 655.3473, 503.3361 |
| 148 c,♥ | Rotundic acid-24-galloyl-28-glucose | C43H62O14 | 30.30 | 801.4066 | [M–H]− | 0.6 | 639.3536, 487.3401 |
| 149 c,♥ | Madecassic acid-24-O-glucoheptonic acid | C37H60O13 | 30.34 | 711.3954 | [M–H]− | −0.3 | 503.3372 |
| 150 c,♥ | Rotundic acid-24-O-glucoheptonic acid | C37H60O12 | 30.37 | 695.3983 | [M–H]− | −3.5 | 487.3413 |
| 151 c,♥ | Asiatic acid-24-galloyl-28-glucose | C43H62O14 | 30.39 | 801.4073 | [M–H]− | 1.5 | 639.3538, 487.3424 |
| 152 a,#,♠ | 1,6-O-galloyl-2-O-cinnamoyl-glucose [20] | C29H26O15 | 30.39 | 613.1200 | [M–H]− | 1.1 | 465.0645, 461.1104, 313.0572, 169.0134, 147.0451 |
| 153 c,♥ | Terminolic acid-24-O-glucoheptonic acid | C37H60O13 | 30.43 | 711.3954 | [M–H]− | −0.3 | 503.3377 |
| 154 c,♥ | Asiatic acid-24-O-glucoheptonic acid | C37H60O12 | 30.47 | 695.4011 | [M–H]− | 0.6 | 487.3428 |
| 155 c,♥ | Arjunolic acid-24-galloyl-28-glucose | C43H62O14 | 30.51 | 801.4060 | [M–H]− | 1–0.1 | 639.3539, 487.3427 |
| 156 c,♥ | Arjunolic acid-24-O-glucoheptonic acid | C37H60O12 | 30.57 | 695.4019 | [M–H]− | 0.6 | 487.3432 |
| 157 a,#,♠ | 1,2,3-tri-O-galloyl-6-O-cinnamoyl-β- D-glucose [20] | C36H30O19 | 30.57 | 765.1310 | [M–H]− | 0.9 | 811.4279, 787.1131, 635.0932, 617.0841, 613.1192, 595.1093, 443.0975 |
| 158 a,#,♥ | Arjungenin [40] | C30H48O6 | 31.12 | 503.3384 | [M–H]− | 2.2 | 1007.6838, 549.3438 |
| 159 a,#,♥ | Madecassic acid [28] | C30H48O6 | 31.56 | 503.3387 | [M–H]− | 2.8 | 1007.6841, 549.3439 |
| 160 a,#,♥ | 23-galloyl-arjunolic acid [58] | C37H52O9 | 31.71 | 639.3547 | [M–H]− | 2.2 | 487.3378 |
| 161 a,#,♥ | Terminolic acid [55] | C30H48O6 | 31.77 | 503.3387 | [M–H]− | 2.8 | 1007.6847, 549.3439 |
| 162 b,#,♥ | Rotundic acid [59] | C30H48O5 | 31.90 | 487.3437 | [M–H]− | 2.9 | 975.6937 |
| 163 a,#,♥ | Asiatic acid [32] | C30H48O5 | 32.09 | 487.3438 | [M–H]− | 3.1 | 975.6949 |
| 164 a,#,♥ | Arjunolic acid [18] | C30H48O5 | 32.35 | 487.3434 | [M–H]− | 2.3 | 975.6979 |
Disclaimer/Publisher’s Note: The statements, opinions and data contained in all publications are solely those of the individual author(s) and contributor(s) and not of MDPI and/or the editor(s). MDPI and/or the editor(s) disclaim responsibility for any injury to people or property resulting from any ideas, methods, instructions or products referred to in the content. |
© 2025 by the authors. Licensee MDPI, Basel, Switzerland. This article is an open access article distributed under the terms and conditions of the Creative Commons Attribution (CC BY) license (https://creativecommons.org/licenses/by/4.0/).
Share and Cite
Yu, J.; Zhao, X.; He, Y.; Zhang, Y.; Tang, C. An Innovative Strategy for Untargeted Mass Spectrometry Data Analysis: Rapid Chemical Profiling of the Medicinal Plant Terminalia chebula Using Ultra-High-Performance Liquid Chromatography Coupled with Q/TOF Mass Spectrometry–Key Ion Diagnostics–Neutral Loss Filtering. Molecules 2025, 30, 2451. https://doi.org/10.3390/molecules30112451
Yu J, Zhao X, He Y, Zhang Y, Tang C. An Innovative Strategy for Untargeted Mass Spectrometry Data Analysis: Rapid Chemical Profiling of the Medicinal Plant Terminalia chebula Using Ultra-High-Performance Liquid Chromatography Coupled with Q/TOF Mass Spectrometry–Key Ion Diagnostics–Neutral Loss Filtering. Molecules. 2025; 30(11):2451. https://doi.org/10.3390/molecules30112451
Chicago/Turabian StyleYu, Jia, Xinyan Zhao, Yuqi He, Yi Zhang, and Ce Tang. 2025. "An Innovative Strategy for Untargeted Mass Spectrometry Data Analysis: Rapid Chemical Profiling of the Medicinal Plant Terminalia chebula Using Ultra-High-Performance Liquid Chromatography Coupled with Q/TOF Mass Spectrometry–Key Ion Diagnostics–Neutral Loss Filtering" Molecules 30, no. 11: 2451. https://doi.org/10.3390/molecules30112451
APA StyleYu, J., Zhao, X., He, Y., Zhang, Y., & Tang, C. (2025). An Innovative Strategy for Untargeted Mass Spectrometry Data Analysis: Rapid Chemical Profiling of the Medicinal Plant Terminalia chebula Using Ultra-High-Performance Liquid Chromatography Coupled with Q/TOF Mass Spectrometry–Key Ion Diagnostics–Neutral Loss Filtering. Molecules, 30(11), 2451. https://doi.org/10.3390/molecules30112451