

Development and Validation of a Simple and Cost-Effective LC-MS/MS Method for the Quantitation of the Gut-Derived Metabolite Trimethylamine N-Oxide in Human Plasma of Healthy and Hyperlipidemic Volunteers

 ,
,  , ,
, ,  and
and 
Abstract

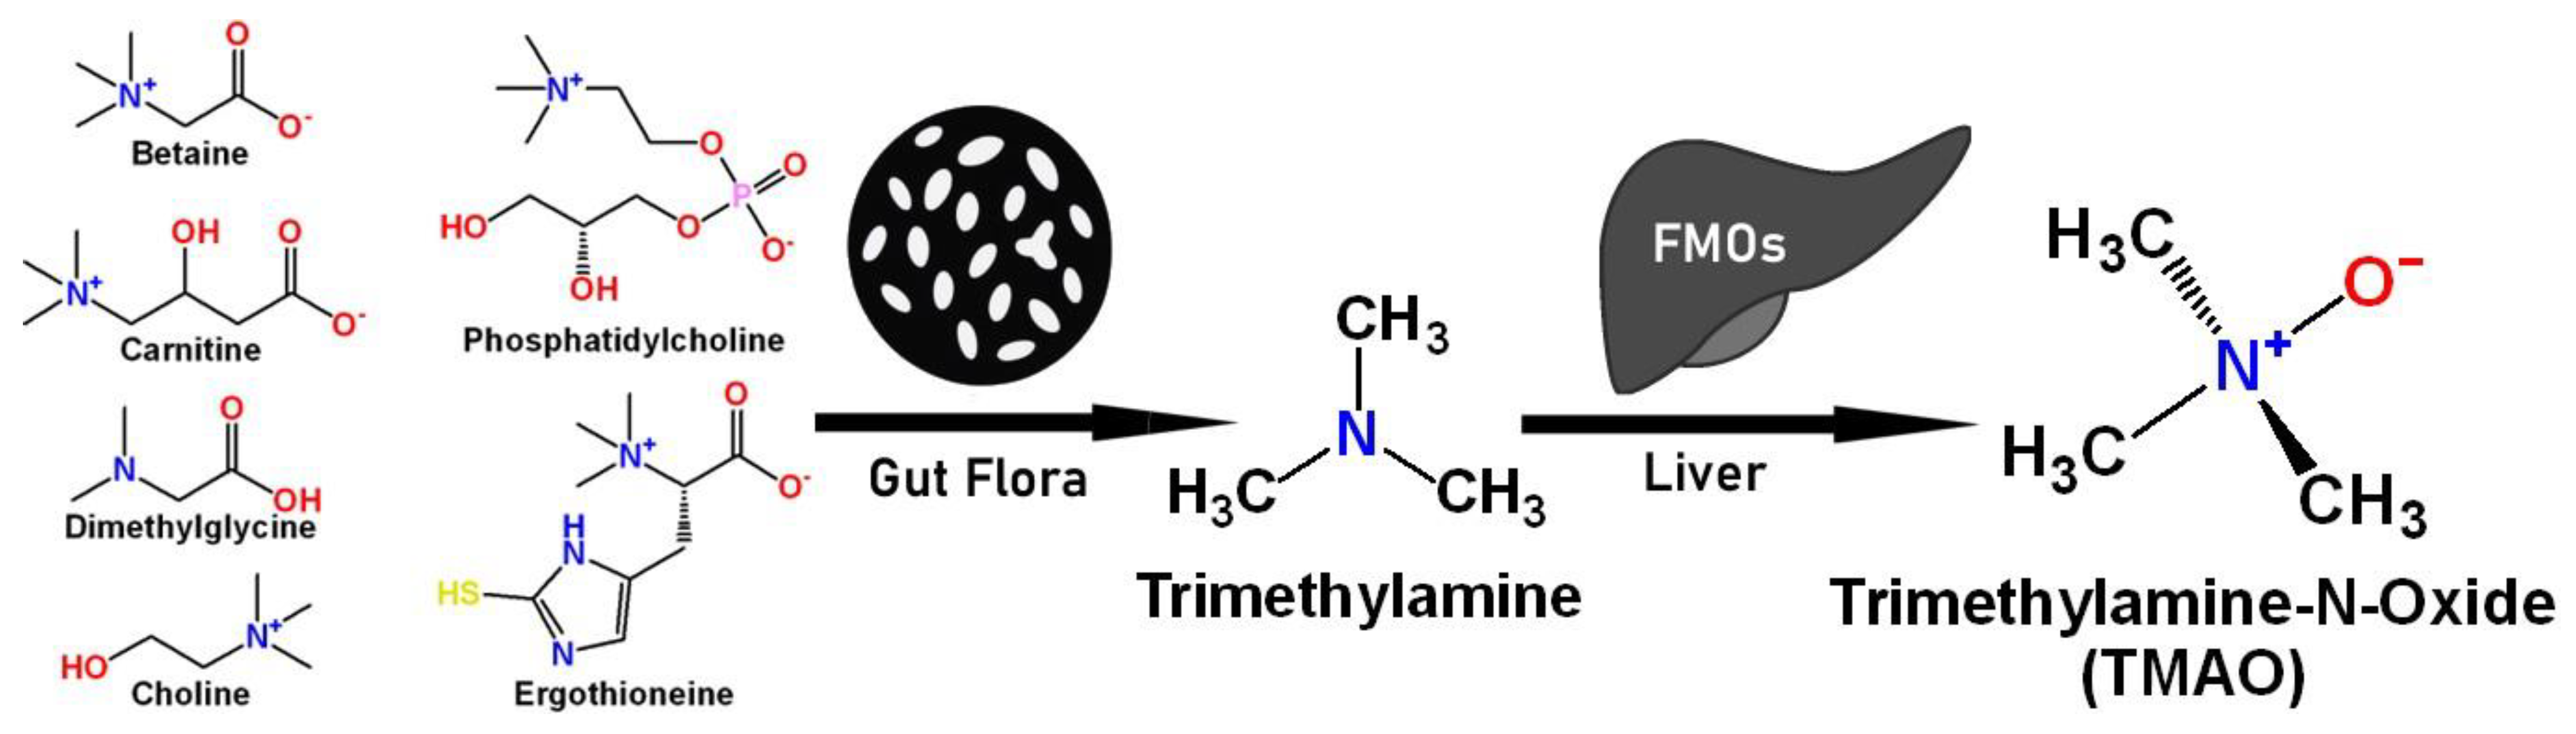
1. Introduction
2. Results
2.1. Optimization of the LC-MS/MS Conditions
2.2. Method Validation
2.2.1. Linearity and Sensitivity
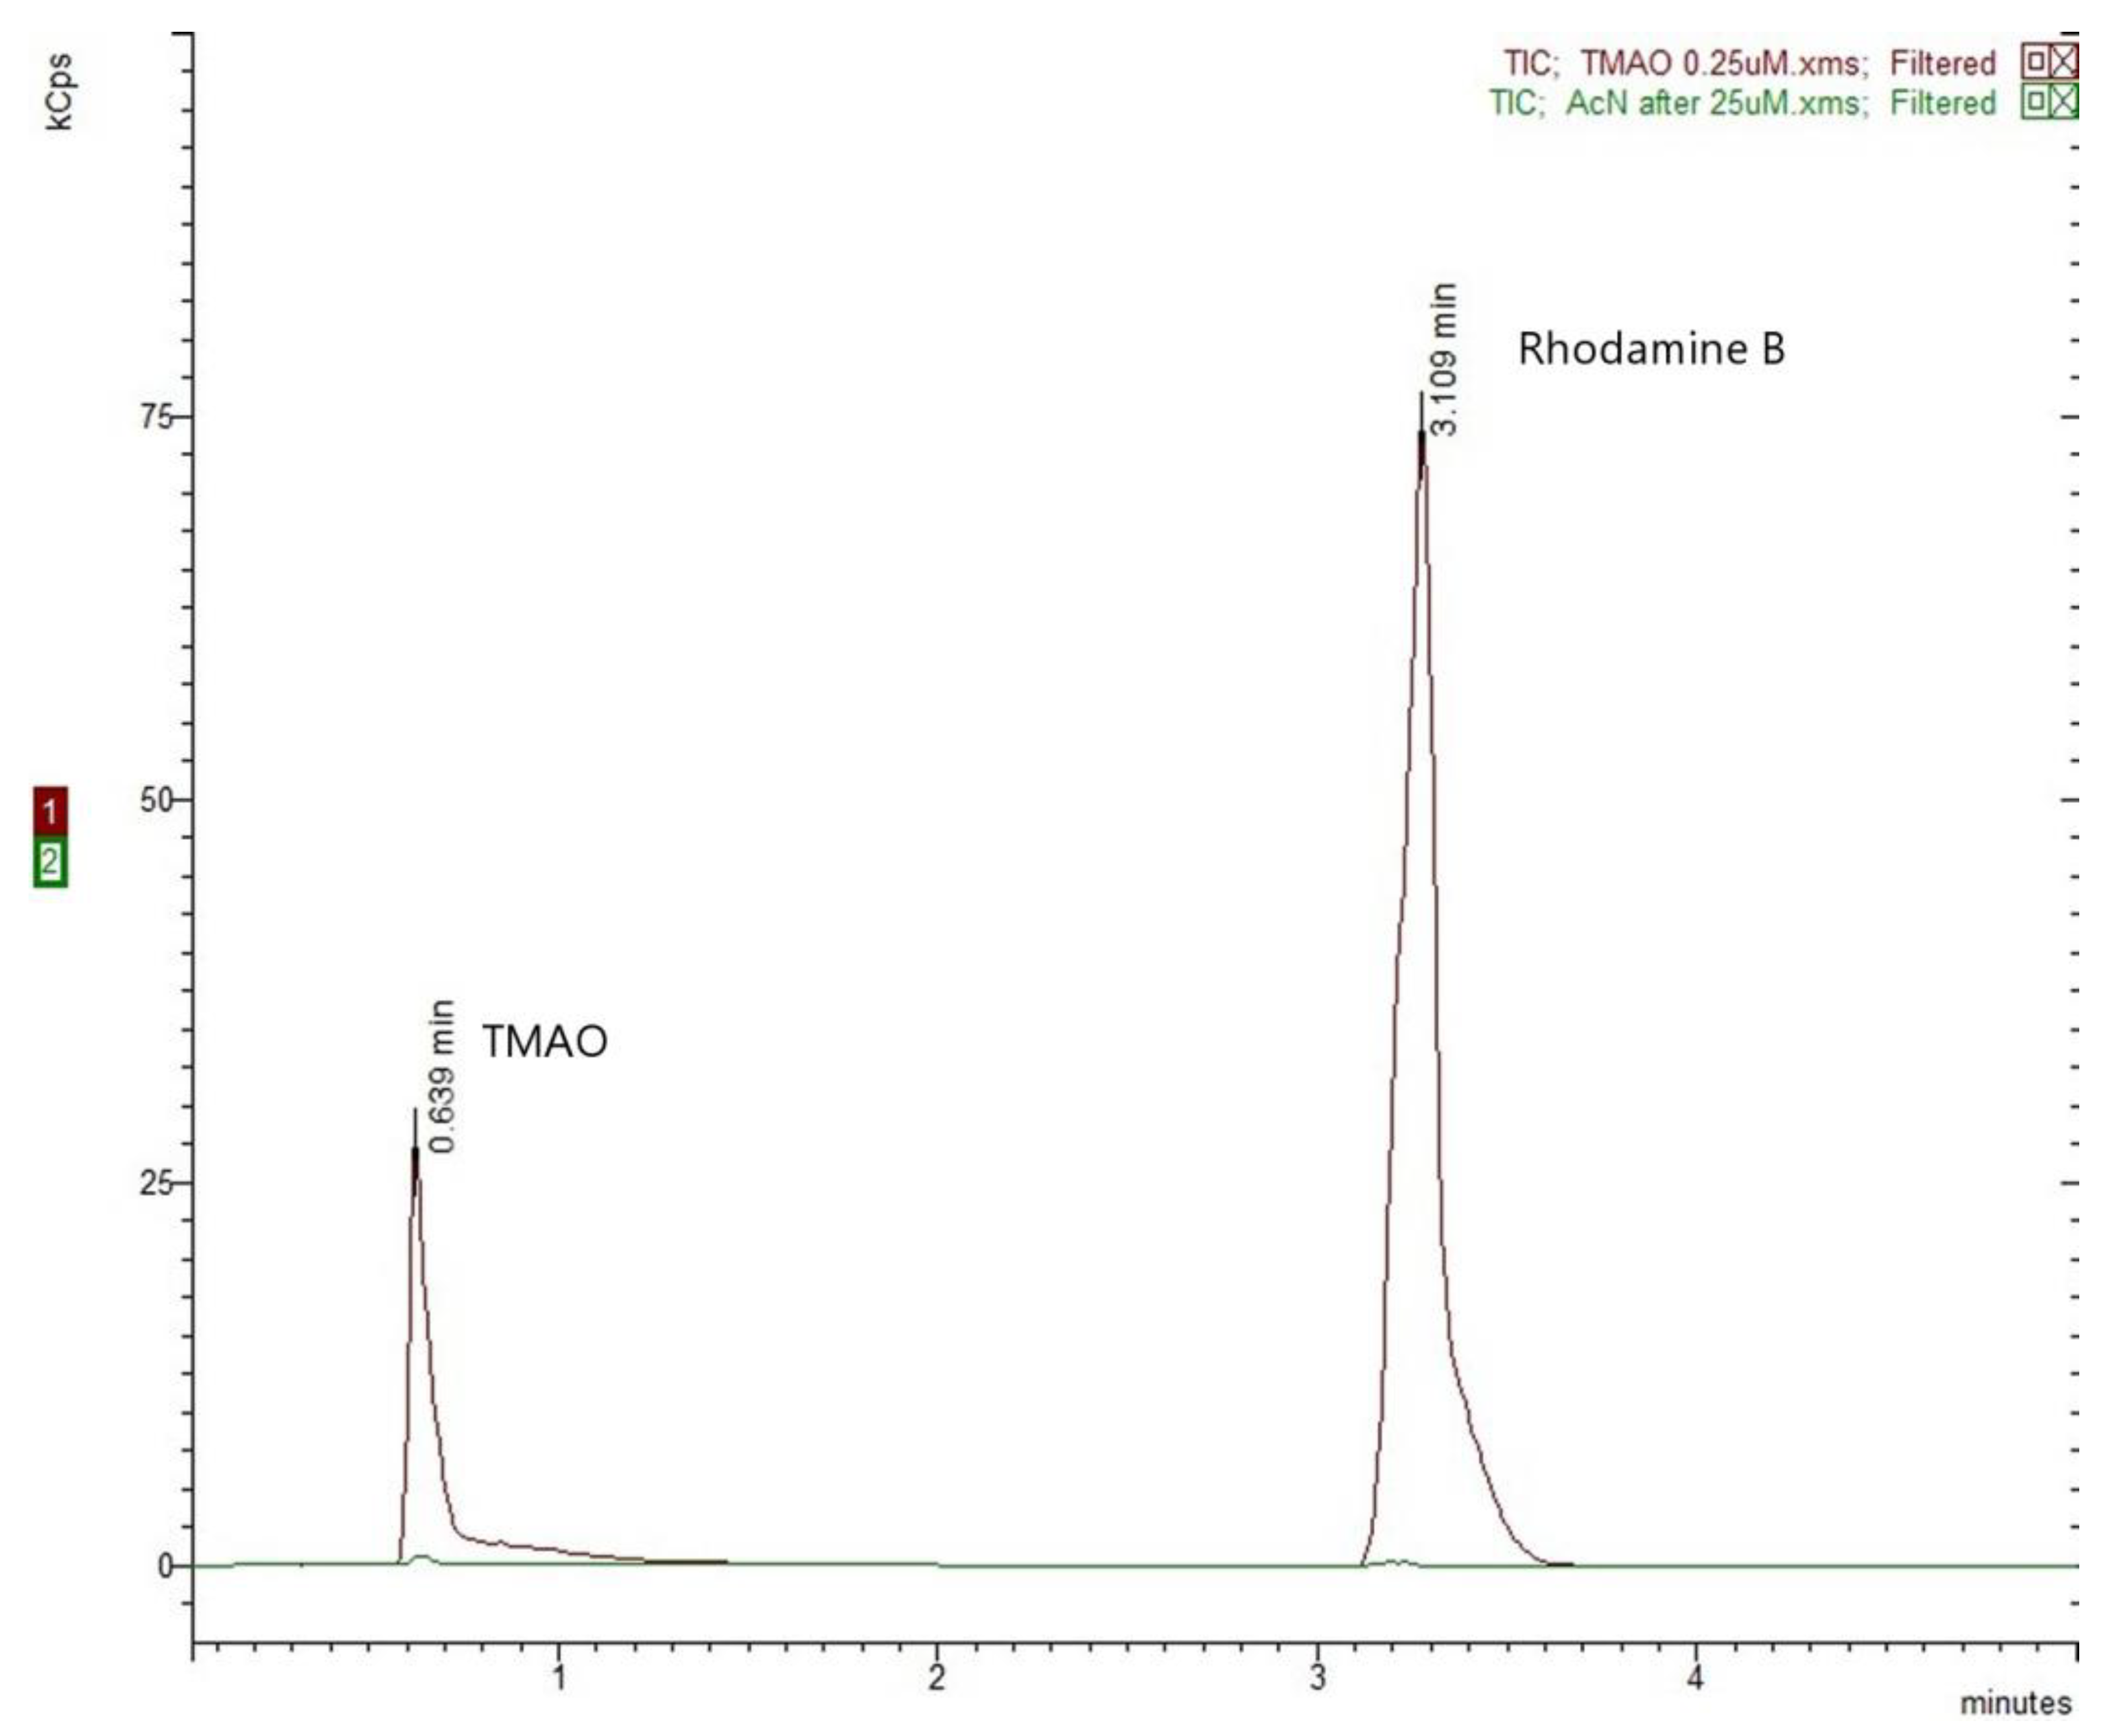
2.2.2. Selectivity and Carry-Over
2.2.3. Recovery and Matrix Effect
2.2.4. Accuracy in Terms of Trueness and Precision
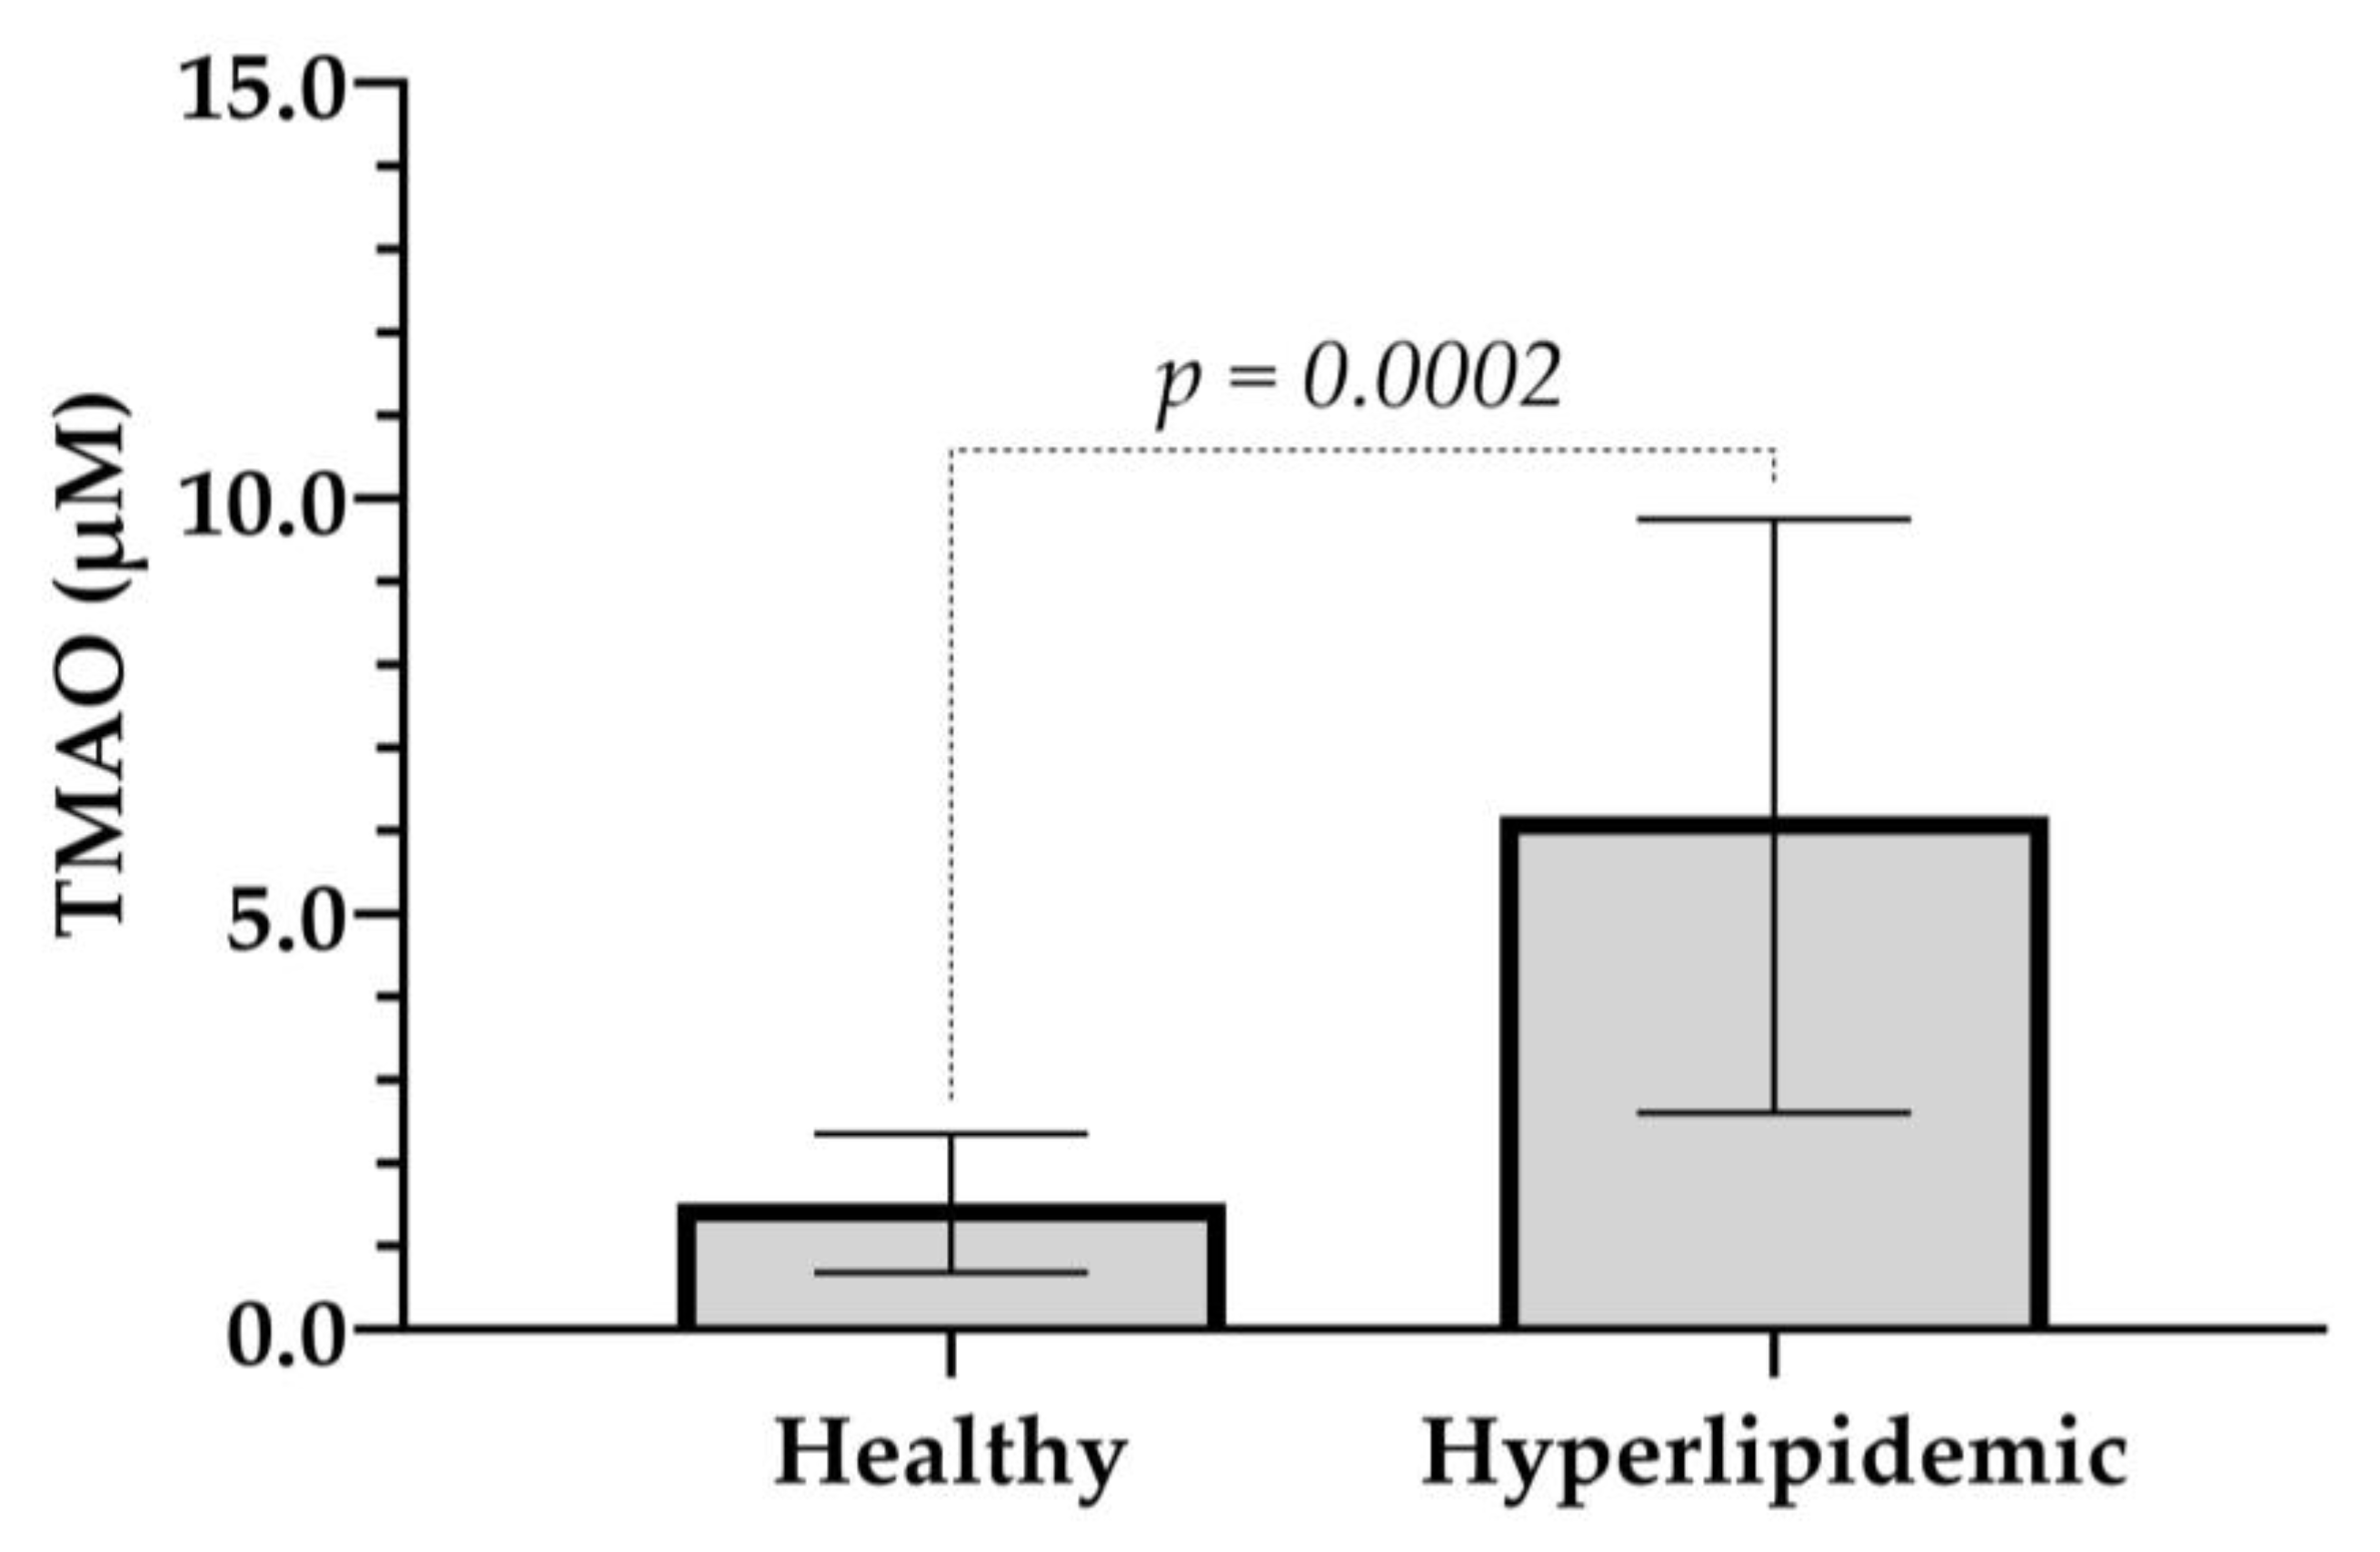
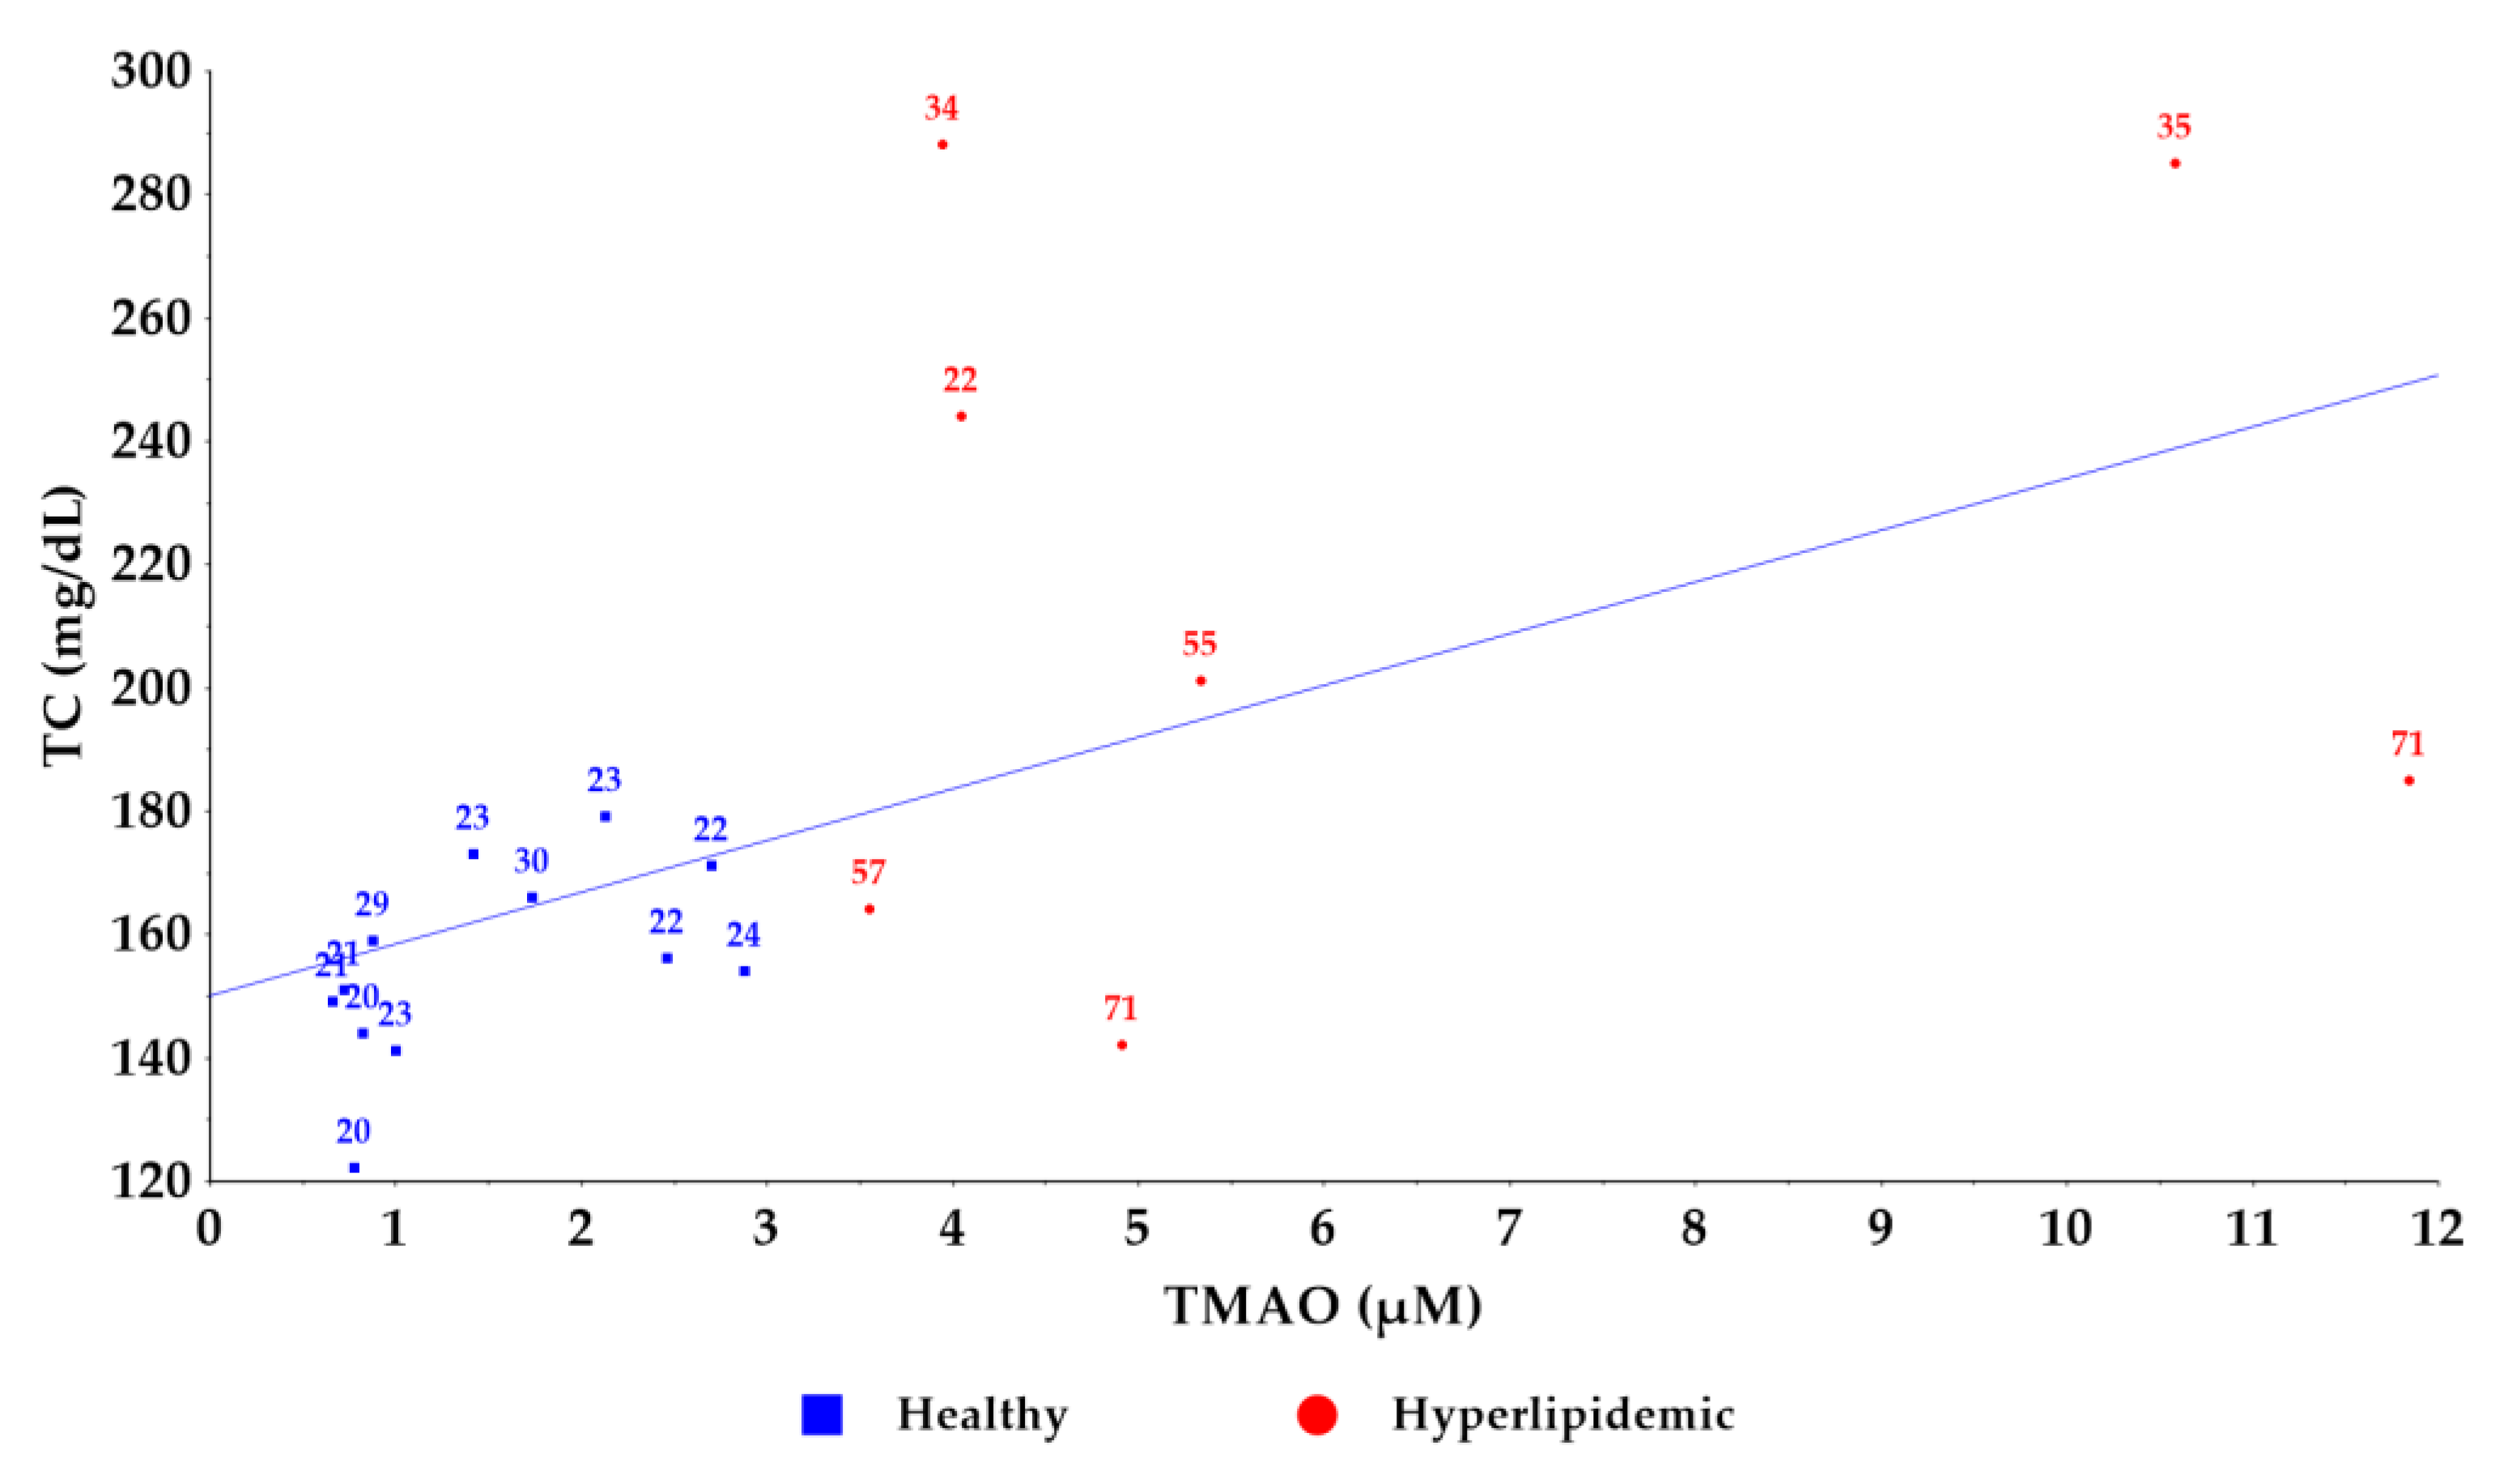
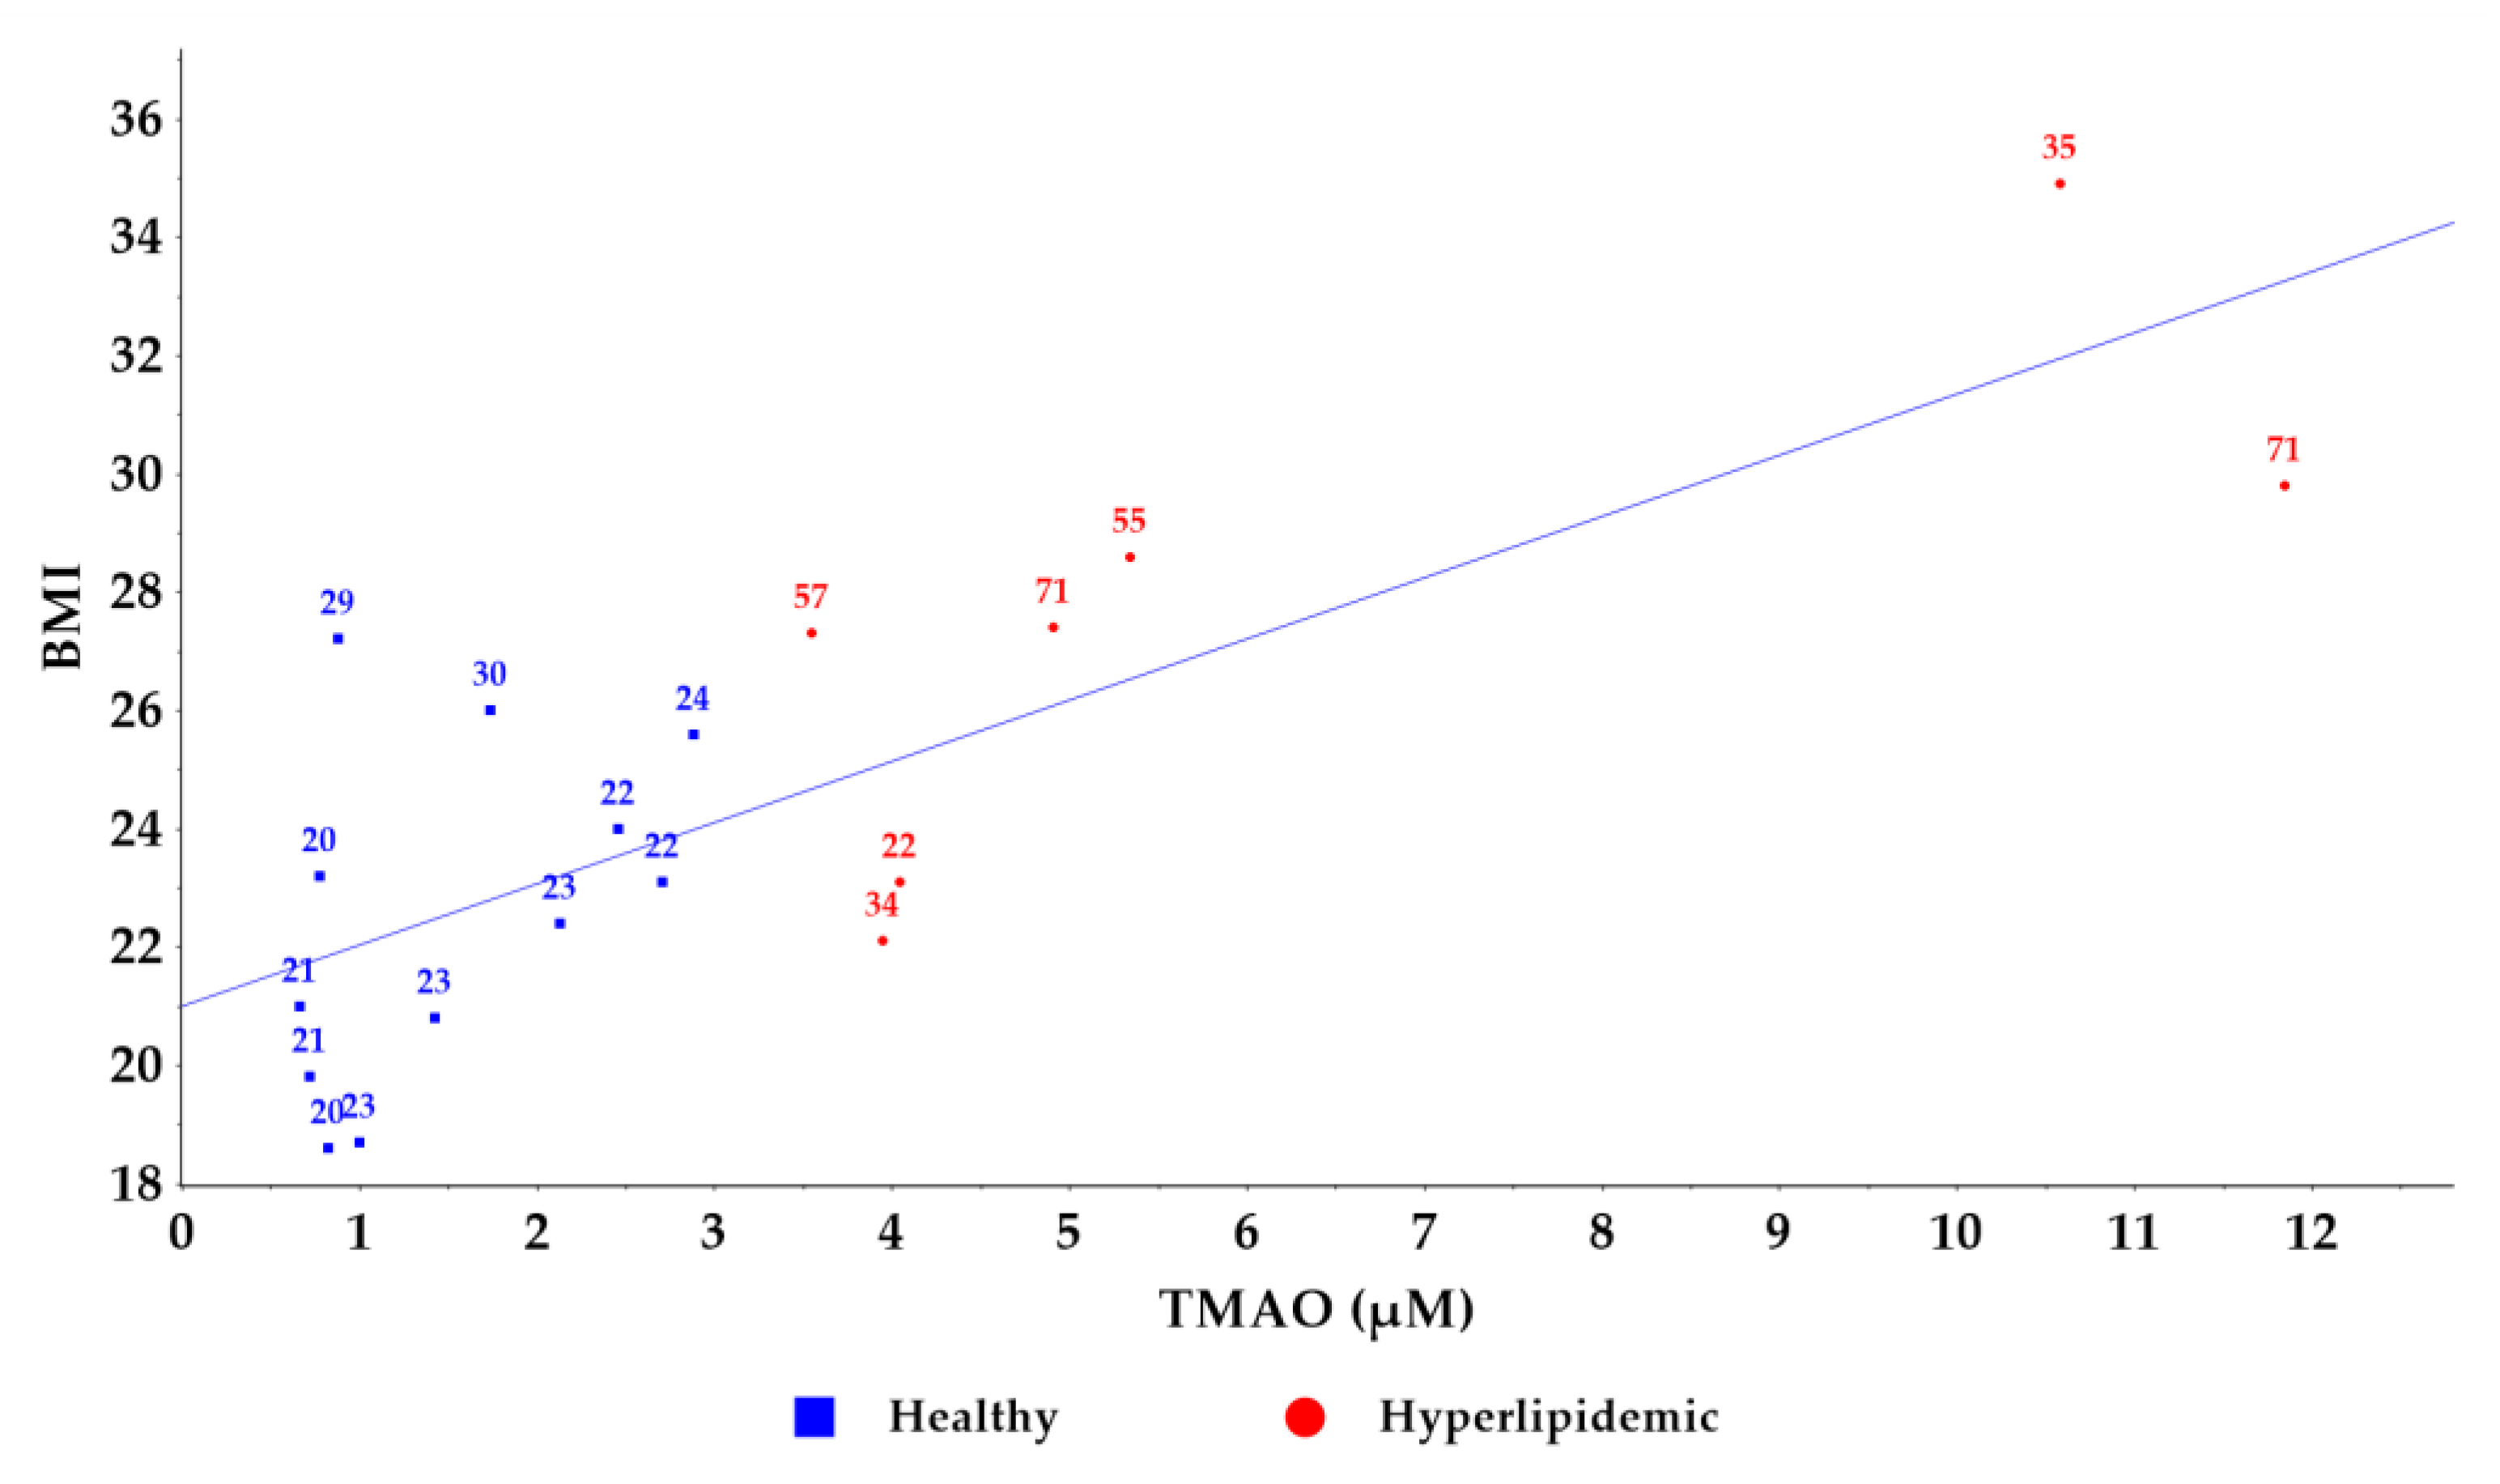
2.3. Application of the Method to a Pilot Study of Healthy and Hyperlipidemic Volunteers
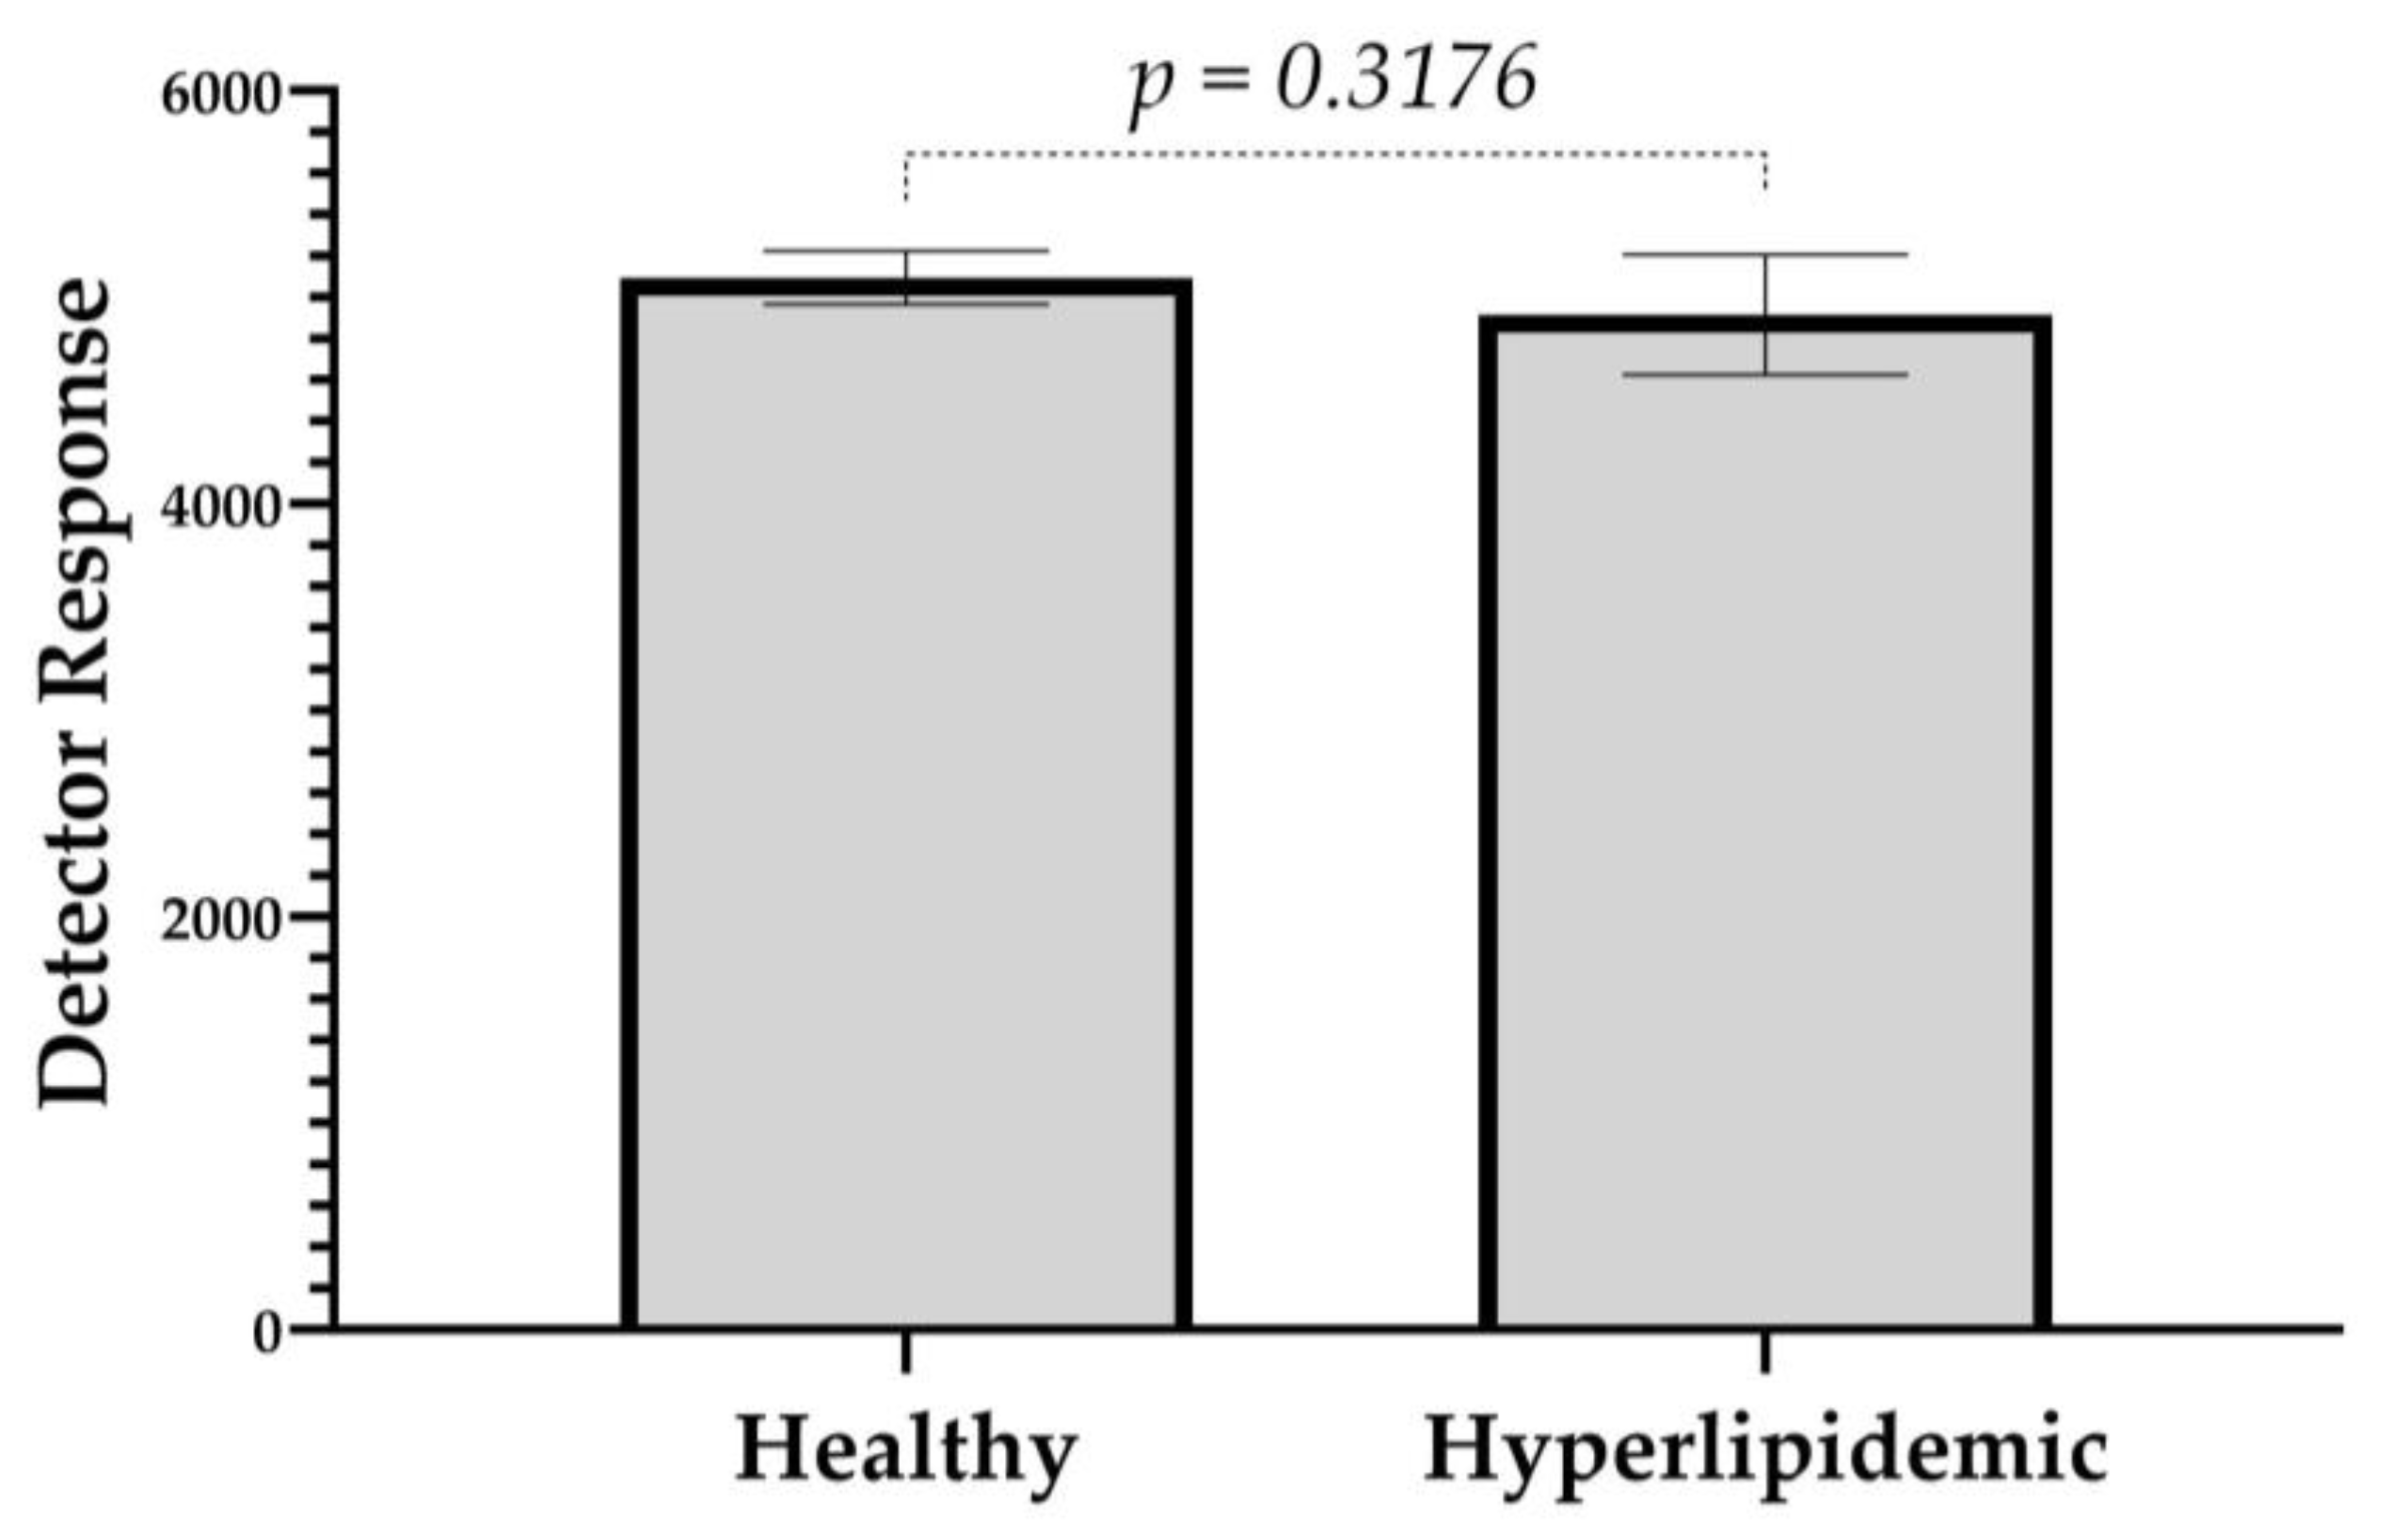
2.4. Methodology Transfer to UPLC-QToF
3. Materials and Methods
3.1. Chemicals and Materials
3.2. UHPLC-ESI-MS/MS Instrumentation
3.3. Preparation of Stock and Working Solutions for the Quantification in Human Plasma
3.4. Preparation of Calibration Standards and Quality Control Human Plasma Samples
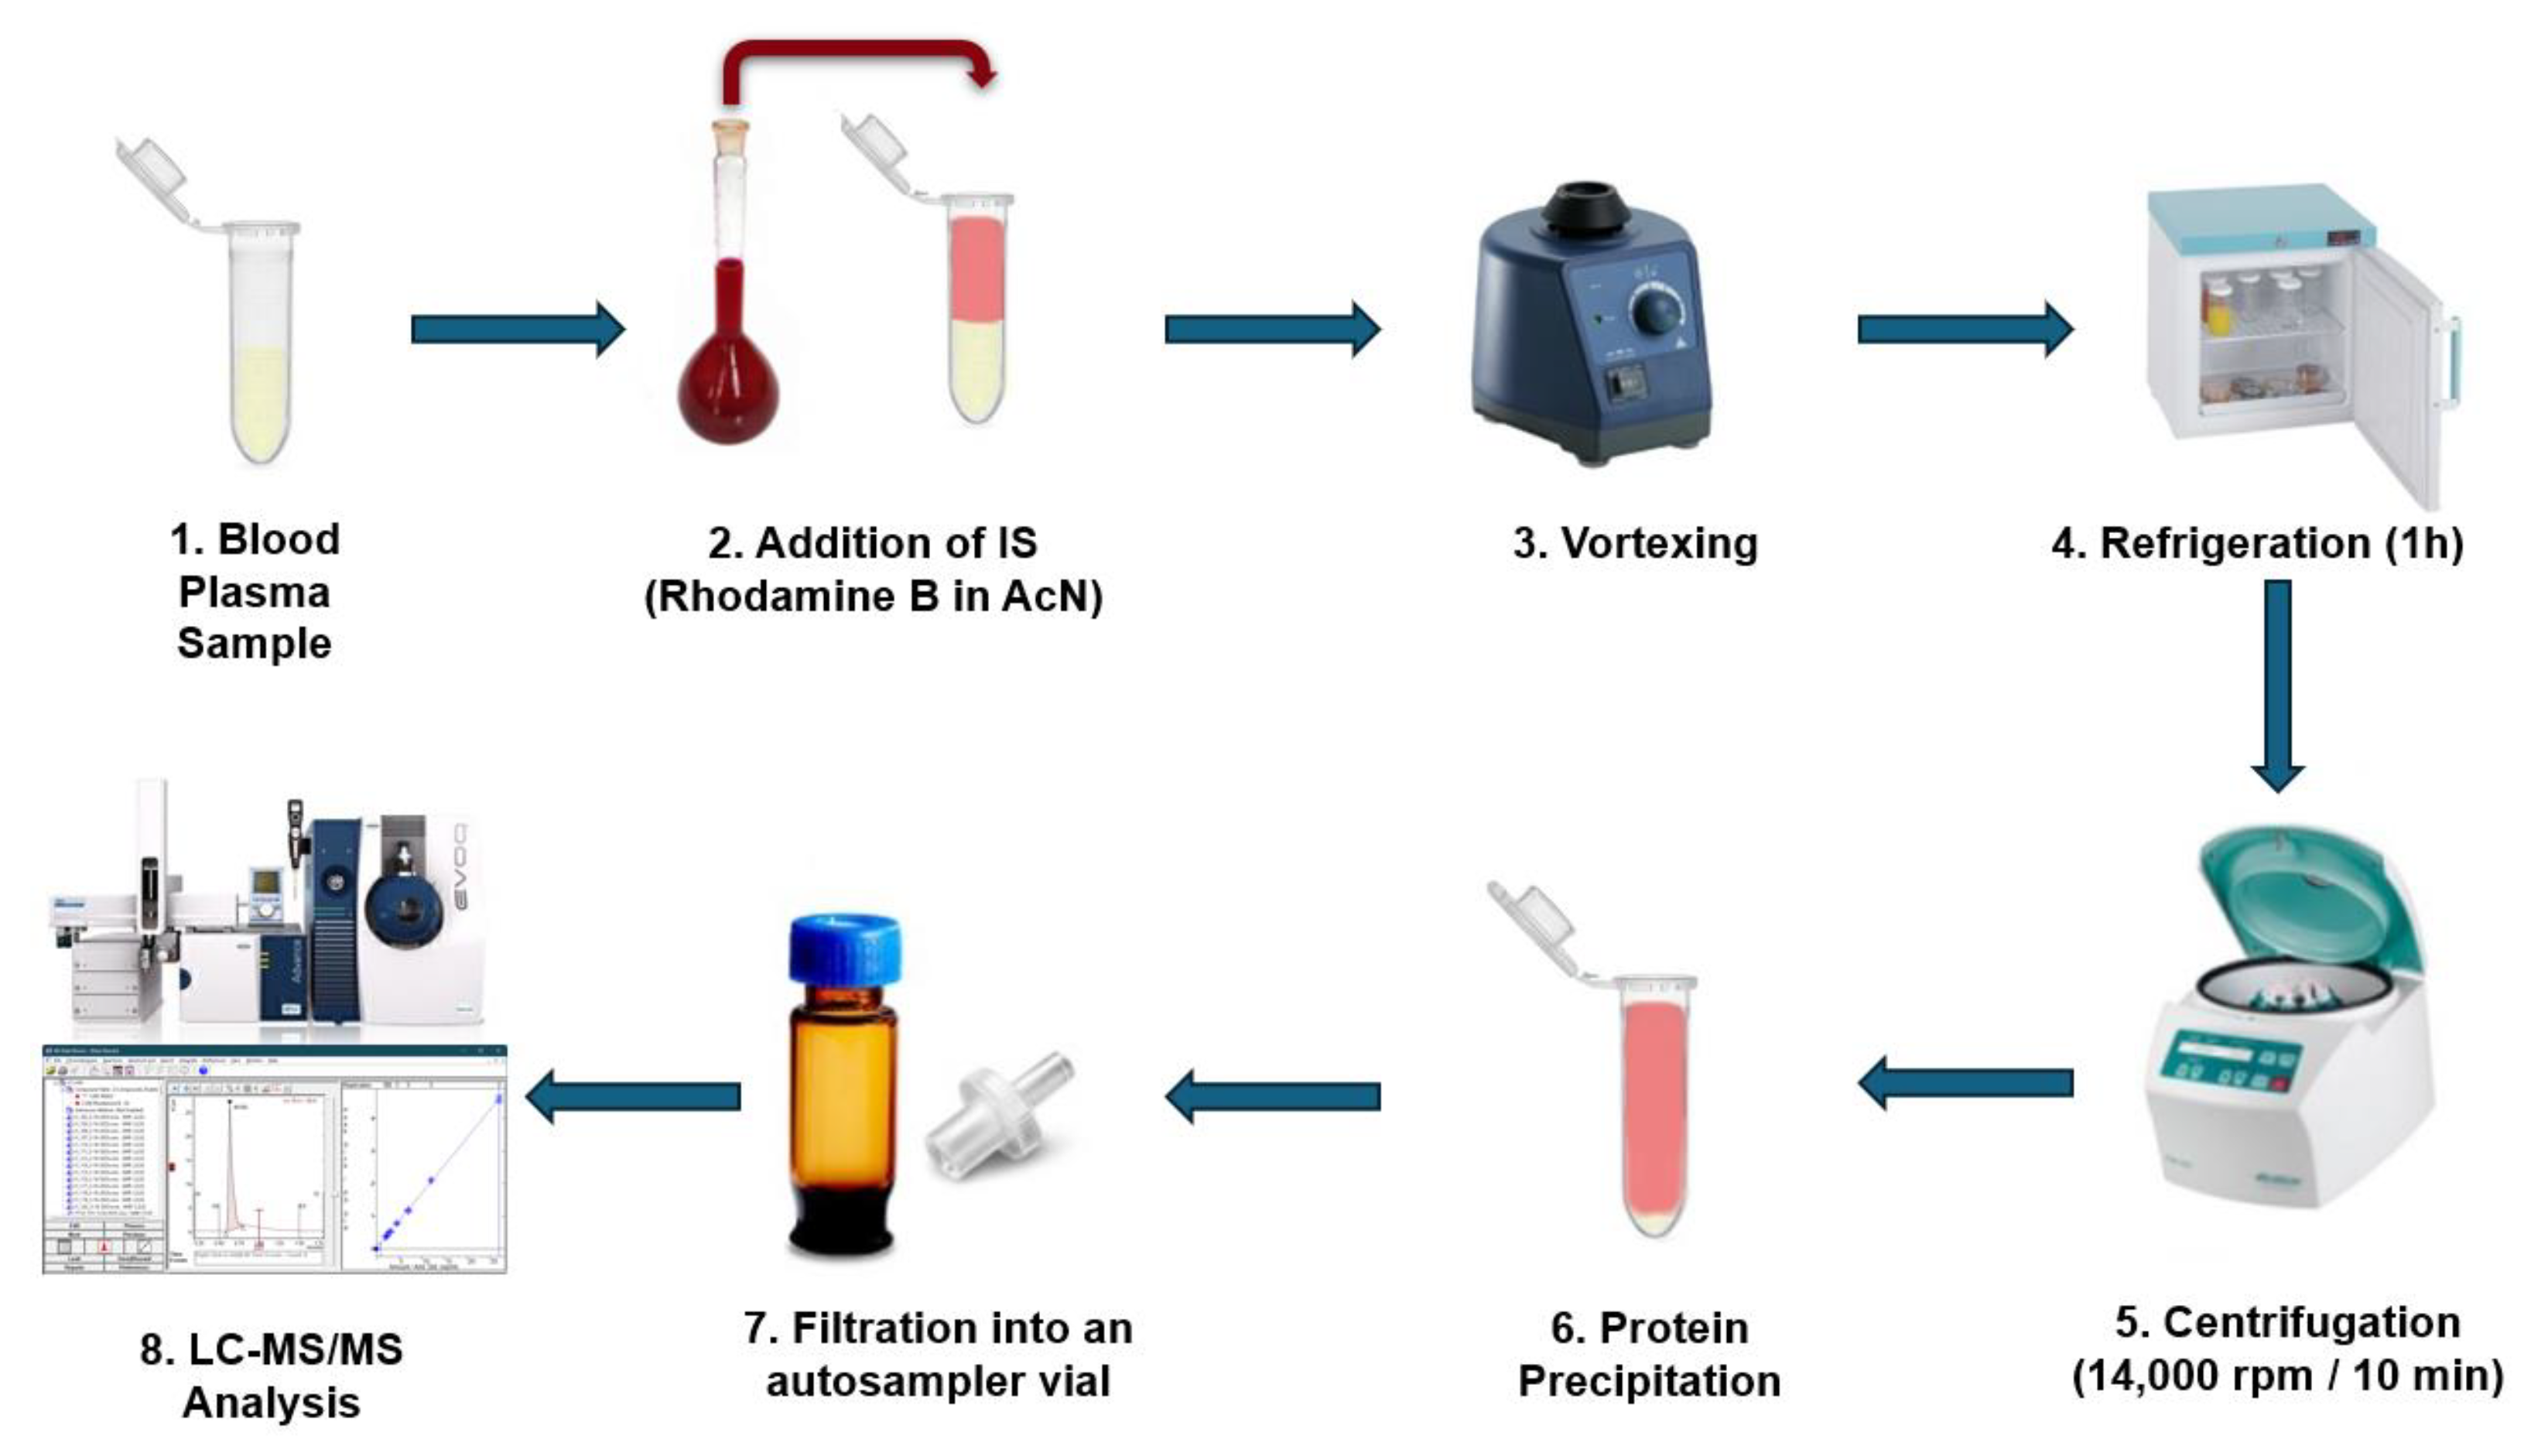
3.5. Human Plasma Sample Preparation
3.6. Method Validation for the Quantification of TMAO in Human Plasma
3.7. Application to Pilot Study of Healthy and Hyperlipidemic Donors
4. Conclusions
Supplementary Materials
Author Contributions
Funding
Institutional Review Board Statement
Informed Consent Statement
Data Availability Statement
Acknowledgments
Conflicts of Interest
References
- Velasquez, M.; Ramezani, A.; Manal, A.; Raj, D. Trimethylamine N-Oxide: The Good, the Bad and the Unknown. Toxins 2016, 8, 326. [Google Scholar] [CrossRef] [PubMed]
- Subramaniam, S.; Fletcher, C. Trimethylamine N-Oxide: Breathe New Life. Br. J. Pharmacol. 2018, 175, 1344–1353. [Google Scholar] [CrossRef] [PubMed]
- Papandreou, C.; Moré, M.; Bellamine, A. Trimethylamine N-Oxide in Relation to Cardiometabolic Health—Cause or Effect? Nutrients 2020, 12, 1330. [Google Scholar] [CrossRef]
- Gessner, A.; di Giuseppe, R.; Koch, M.; Fromm, M.F.; Lieb, W.; Maas, R. Trimethylamine-N-Oxide (TMAO) Determined by LC-MS/MS: Distribution and Correlates in the Population-Based PopGen Cohort. Clin. Chem. Lab. Med. (CCLM) 2020, 58, 733–740. [Google Scholar] [CrossRef] [PubMed]
- Evans, M.; Dai, L.; Avesani, C.M.; Kublickiene, K.; Stenvinkel, P. The Dietary Source of Trimethylamine N-Oxide and Clinical Outcomes: An Unexpected Liaison. Clin. Kidney J. 2023, 16, 1804–1812. [Google Scholar] [CrossRef]
- Tang, W.H.W.; Wang, Z.; Levison, B.S.; Koeth, R.A.; Britt, E.B.; Fu, X.; Wu, Y.; Hazen, S.L. Intestinal Microbial Metabolism of Phosphatidylcholine and Cardiovascular Risk. N. Engl. J. Med. 2013, 368, 1575–1584. [Google Scholar] [CrossRef]
- Wang, Z.; Klipfell, E.; Bennett, B.J.; Koeth, R.; Levison, B.S.; DuGar, B.; Feldstein, A.E.; Britt, E.B.; Fu, X.; Chung, Y.-M.; et al. Gut Flora Metabolism of Phosphatidylcholine Promotes Cardiovascular Disease. Nature 2011, 472, 57–63. [Google Scholar] [CrossRef]
- Koeth, R.A.; Wang, Z.; Levison, B.S.; Buffa, J.A.; Org, E.; Sheehy, B.T.; Britt, E.B.; Fu, X.; Wu, Y.; Li, L.; et al. Intestinal Microbiota Metabolism of L-Carnitine, a Nutrient in Red Meat, Promotes Atherosclerosis. Nat. Med. 2013, 19, 576–585. [Google Scholar] [CrossRef]
- Oktaviono, Y.H.; Dyah Lamara, A.; Saputra, P.B.T.; Arnindita, J.N.; Pasahari, D.; Saputra, M.E.; Suasti, N.M.A. Roles of Trimethylamine-N-Oxide in Atherosclerosis and Its Potential Therapeutic Aspect: A Literature Review. Biomol. Biomed. 2023, 23, 936–948. [Google Scholar] [CrossRef]
- Heianza, Y.; Ma, W.; Manson, J.E.; Rexrode, K.M.; Qi, L. Gut Microbiota Metabolites and Risk of Major Adverse Cardiovascular Disease Events and Death: A Systematic Review and Meta-Analysis of Prospective Studies. J. Am. Heart Assoc. 2017, 6, e004947. [Google Scholar] [CrossRef]
- Stubbs, J.R.; House, J.A.; Ocque, A.J.; Zhang, S.; Johnson, C.; Kimber, C.; Schmidt, K.; Gupta, A.; Wetmore, J.B.; Nolin, T.D.; et al. Serum Trimethylamine-N-Oxide Is Elevated in CKD and Correlates with Coronary Atherosclerosis Burden. J. Am. Soc. Nephrol. 2016, 27, 305–313. [Google Scholar] [CrossRef] [PubMed]
- Jaworska, K.; Bielinska, K.; Gawrys-Kopczynska, M.; Ufnal, M. TMA (Trimethylamine), but Not Its Oxide TMAO (Trimethylamine-Oxide), Exerts Haemodynamic Effects: Implications for Interpretation of Cardiovascular Actions of Gut Microbiome. Cardiovasc. Res. 2019, 115, 1948–1949. [Google Scholar] [CrossRef]
- Bennett, B.J.; de Aguiar Vallim, T.Q.; Wang, Z.; Shih, D.M.; Meng, Y.; Gregory, J.; Allayee, H.; Lee, R.; Graham, M.; Crooke, R.; et al. Trimethylamine-N-Oxide, a Metabolite Associated with Atherosclerosis, Exhibits Complex Genetic and Dietary Regulation. Cell Metab. 2013, 17, 49–60. [Google Scholar] [CrossRef] [PubMed]
- Xiong, X.; Zhou, J.; Fu, Q.; Xu, X.; Wei, S.; Yang, S.; Chen, B. The associations between TMAO-related metabolites and blood lipids and the potential impact of rosuvastatin therapy. Lipids Health Dis. 2022, 21, 60. [Google Scholar] [CrossRef]
- Schneider, C.; Okun, J.G.; Schwarz, K.V.; Hauke, J.; Zorn, M.; Nürnberg, C.; Ungerer, M.; Ringleb, P.A.; Mundiyanapurath, S. Trimethylamine-N-Oxide Is Elevated in the Acute Phase after Ischaemic Stroke and Decreases within the First Days. Eur. J. Neurol. 2020, 27, 1596–1603. [Google Scholar] [CrossRef]
- Hu, X.; Ren, H.; Cao, Y. The Association between Trimethylamine N-Oxide Levels and Ischemic Stroke Occurrence: A Meta-Analysis and Mendelian Randomization Study. BMC Neurol. 2023, 23, 413. [Google Scholar] [CrossRef] [PubMed]
- Zeisel, S.H.; Warrier, M. Trimethylamine N-Oxide, the Microbiome, and Heart and Kidney Disease. Annu. Rev. Nutr. 2017, 37, 157–181. [Google Scholar] [CrossRef] [PubMed]
- Al-Obaide, M.A.I.; Singh, R.; Datta, P.; Rewers-Felkins, K.A.; Salguero, M.V.; Al-Obaidi, I.; Kottapalli, K.R.; Vasylyeva, T.L. Gut Microbiota-Dependent Trimethylamine-N-Oxide and Serum Biomarkers in Patients with T2DM and Advanced CKD. J. Clin. Med. 2017, 6, 86. [Google Scholar] [CrossRef]
- Hai, X.; Landeras, V.; Dobre, M.A.; DeOreo, P.; Meyer, T.W.; Hostetter, T.H. Mechanism of Prominent Trimethylamine Oxide (TMAO) Accumulation in Hemodialysis Patients. PLoS ONE 2015, 10, e0143731. [Google Scholar] [CrossRef]
- Andrikopoulos, P.; Aron-Wisnewsky, J.; Chakaroun, R.; Myridakis, A.; Forslund, S.K.; Nielsen, T.; Adriouch, S.; Holmes, B.; Chilloux, J.; Vieira-Silva, S.; et al. Evidence of a Causal and Modifiable Relationship between Kidney Function and Circulating Trimethylamine N-Oxide. Nat. Commun. 2023, 14, 5843. [Google Scholar] [CrossRef]
- Farhangi, M.A. Gut Microbiota-Dependent Trimethylamine N-Oxide and All-Cause Mortality: Findings from an Updated Systematic Review and Meta-Analysis. Nutrition 2020, 78, 110856. [Google Scholar] [CrossRef] [PubMed]
- Li, Z.; Hui, J.; Li, S.; Cao, T.; Zhang, J.; Mao, X.; Wang, F.; Wang, F.; He, P.; You, Y.; et al. Trimethylamine N-oxide Predicts Stroke Severity in Diabetic Patients with Acute Ischaemic Stroke and Is Related to Glycemic Variability. Eur. J. Neurol. 2023, 30, 3478–3486. [Google Scholar] [CrossRef] [PubMed]
- Florea, C.M.; Rosu, R.; Moldovan, R.; Vlase, L.; Toma, V.; Decea, N.; Baldea, I.; Filip, G.A. The Impact of Chronic Trimethylamine N-Oxide Administration on Liver Oxidative Stress, Inflammation, and Fibrosis. Food Chem. Toxicol. 2024, 184, 114429. [Google Scholar] [CrossRef] [PubMed]
- Wei, B.; Deng, N.; Guo, H.; Wei, Y.; Xu, F.; Luo, S.; You, W.; Chen, J.; Li, W.; Si, X. Trimethylamine N-Oxide Promotes Abdominal Aortic Aneurysm by Inducing Vascular Inflammation and Vascular Smooth Muscle Cell Phenotypic Switching. Eur. J. Pharmacol. 2024, 965, 176307. [Google Scholar] [CrossRef]
- Oh, J.; Kim, J.; Lee, S.; Park, G.; Baritugo, K.-A.G.; Han, K.J.; Lee, S.; Sung, G.-H. 1H NMR Serum Metabolomic Change of Trimethylamine N-Oxide (TMAO) Is Associated with Alcoholic Liver Disease Progression. Metabolites 2024, 14, 39. [Google Scholar] [CrossRef]
- Zhou, H.; Luo, Y.; Zhang, W.; Xie, F.; Deng, C.; Zheng, W.; Zhu, S.; Wang, Q. Causal Effect of Gut-microbiota-derived Metabolite Trimethylamine N-oxide on Parkinson’s Disease: A Mendelian Randomization Study. Eur. J. Neurol. 2023, 30, 3451–3461. [Google Scholar] [CrossRef]
- Shahini Shams Abadi, M.; Khodashahi, R.; Aliakbarian, M.; Beiraghdar, F.; Arjmand, M.-H. The Association Between the Gut Microbiome and COVID-19 Severity: The Potential Role of TMAO Produced by the Gut Microbiome. Arch. Clin. Infect. Dis. 2024, 18, e140346. [Google Scholar] [CrossRef]
- Liu, M.-H.; Lin, X.-L.; Xiao, L.-L. SARS-CoV-2 Nucleocapsid Protein Promotes TMAO-Induced NLRP3 Inflammasome Activation by SCAP–SREBP Signaling Pathway. Tissue Cell 2024, 86, 102276. [Google Scholar] [CrossRef]
- Chen, X.; Gu, M.; Hong, Y.; Duan, R.; Zhou, J. Association of Trimethylamine N-Oxide with Normal Aging and Neurocognitive Disorders: A Narrative Review. Brain Sci. 2022, 12, 1203. [Google Scholar] [CrossRef]
- Coutinho-Wolino, K.S.; de F. Cardozo, L.F.M.; de Oliveira Leal, V.; Mafra, D.; Stockler-Pinto, M.B. Can Diet Modulate Trimethylamine N-Oxide (TMAO) Production? What Do We Know so Far? Eur. J. Nutr. 2021, 60, 3567–3584. [Google Scholar] [CrossRef]
- Zhang, L.; Wu, Q.; Wang, N.; Zhang, L.; Yang, X.; Zhao, Y. Quercetin Inhibits Hepatotoxic Effects by Reducing Trimethylamine- N-Oxide Formation in C57BL/6J Mice Fed with a High-Carnitine Diet. Food Funct. 2023, 14, 206–214. [Google Scholar] [CrossRef] [PubMed]
- Iglesias-Carres, L.; Hughes, M.D.; Steele, C.N.; Ponder, M.A.; Davy, K.P.; Neilson, A.P. Use of Dietary Phytochemicals for Inhibition of Trimethylamine N-Oxide Formation. J. Nutr. Biochem. 2021, 91, 108600. [Google Scholar] [CrossRef] [PubMed]
- Gatarek, P.; Kaluzna-Czaplinska, J. Trimethylamine N-Oxide (TMAO) in Human Health. EXCLI J. 2021, 20, 301–319. [Google Scholar] [CrossRef]
- Korytowska-Przybylska, N.; Michorowska, S.; Wyczałkowska-Tomasik, A.; Pączek, L.; Giebułtowicz, J. Development of a Novel Method for the Simultaneous Detection of Trimethylamine N-Oxide and Creatinine in the Saliva of Patients with Chronic Kidney Disease—Its Utility in Saliva as an Alternative to Blood. J. Pharm. Biomed. Anal. 2023, 234, 115519. [Google Scholar] [CrossRef]
- Li, Y.; Kang, J.; Lee, Y.; Chung, J.-Y.; Cho, J.-Y. A Validated Simple LC-MS/MS Method for Quantifying Trimethylamine N-Oxide (TMAO) Using a Surrogate Matrix and Its Clinical Application. Transl. Clin. Pharmacol. 2021, 29, 216. [Google Scholar] [CrossRef]
- Rox, K.; Rath, S.; Pieper, D.H.; Vital, M.; Brönstrup, M. A Simplified LC-MS/MS Method for the Quantification of the Cardiovascular Disease Biomarker Trimethylamine-N-Oxide and Its Precursors. J. Pharm. Anal. 2021, 11, 523–528. [Google Scholar] [CrossRef] [PubMed]
- Garcia, E.; Wolak-Dinsmore, J.; Wang, Z.; Li, X.S.; Bennett, D.W.; Connelly, M.A.; Otvos, J.D.; Hazen, S.L.; Jeyarajah, E.J. NMR Quantification of Trimethylamine-N-Oxide in Human Serum and Plasma in the Clinical Laboratory Setting. Clin. Biochem. 2017, 50, 947–955. [Google Scholar] [CrossRef]
- Bain, M.A.; Faull, R.; Fornasini, G.; Milne, R.W.; Schumann, R.; Evans, A.M. Quantifying Trimethylamine and Trimethylamine-N-Oxide in Human Plasma: Interference from Endogenous Quaternary Ammonium Compounds. Anal. Biochem. 2004, 334, 403–405. [Google Scholar] [CrossRef]
- Hefni, M.E.; Bergström, M.; Lennqvist, T.; Fagerström, C.; Witthöft, C.M. Simultaneous Quantification of Trimethylamine N-Oxide, Trimethylamine, Choline, Betaine, Creatinine, and Propionyl-, Acetyl-, and l-Carnitine in Clinical and Food Samples Using HILIC-LC-MS. Anal. Bioanal. Chem. 2021, 413, 5349–5360. [Google Scholar] [CrossRef]
- Yu, W.; Xu, C.; Li, G.; Hong, W.; Zhou, Z.; Xiao, C.; Zhao, Y.; Cai, Y.; Huang, M.; Jin, J. Simultaneous Determination of Trimethylamine N -Oxide, Choline, Betaine by UPLC–MS/MS in Human Plasma: An Application in Acute Stroke Patients. J. Pharm. Biomed. Anal. 2018, 152, 179–187. [Google Scholar] [CrossRef]
- Awwad, H.M.; Geisel, J.; Obeid, R. Determination of Trimethylamine, Trimethylamine N-Oxide, and Taurine in Human Plasma and Urine by UHPLC–MS/MS Technique. J. Chromatogr. B 2016, 1038, 12–18. [Google Scholar] [CrossRef] [PubMed]
- Lu, W.-H.; Chiu, H.-H.; Kuo, H.-C.; Chen, G.-Y.; Chepyala, D.; Kuo, C.-H. Using Matrix-Induced Ion Suppression Combined with LC-MS/MS for Quantification of Trimethylamine-N-Oxide, Choline, Carnitine and Acetylcarnitine in Dried Blood Spot Samples. Anal. Chim. Acta 2021, 1149, 338214. [Google Scholar] [CrossRef] [PubMed]
- Gao, W.; Yang, H.; Zhang, Y.; Gao, D.; Wu, C. A Novel and Efficient Electrochemiluminescence Sensing Strategy for the Determination of Trimethylamine Oxide in Seafood. Talanta 2024, 269, 125409. [Google Scholar] [CrossRef] [PubMed]
- Gawrys-Kopczynska, M.; Konop, M.; Maksymiuk, K.; Kraszewska, K.; Derzsi, L.; Sozanski, K.; Holyst, R.; Pilz, M.; Samborowska, E.; Dobrowolski, L.; et al. TMAO, a Seafood-Derived Molecule, Produces Diuresis and Reduces Mortality in Heart Failure Rats. Elife 2020, 9, e57028. [Google Scholar] [CrossRef]
- Heaney, L.M.; Jones, D.J.L.; Mbasu, R.J.; Ng, L.L.; Suzuki, T. High Mass Accuracy Assay for Trimethylamine N-Oxide Using Stable-Isotope Dilution with Liquid Chromatography Coupled to Orthogonal Acceleration Time of Flight Mass Spectrometry with Multiple Reaction Monitoring. Anal. Bioanal. Chem. 2016, 408, 797–804. [Google Scholar] [CrossRef]
- Wang, Z.; Levison, B.S.; Hazen, J.E.; Donahue, L.; Li, X.-M.; Hazen, S.L. Measurement of Trimethylamine-N-Oxide by Stable Isotope Dilution Liquid Chromatography Tandem Mass Spectrometry. Anal. Biochem. 2014, 455, 35–40. [Google Scholar] [CrossRef]
- Polson, C.; Sarkar, P.; Incledon, B.; Raguvaran, V.; Grant, R. Optimization of Protein Precipitation Based upon Effectiveness of Protein Removal and Ionization Effect in Liquid Chromatography–Tandem Mass Spectrometry. J. Chromatogr. B 2003, 785, 263–275. [Google Scholar] [CrossRef]
- Food and Drug Administration (FDA) Bioanalytical Method Validation Guidance for Industry. Published on May 2018. Available online: https://www.fda.gov/regulatory-information/search-fda-guidance-documents/bioanalytical-method-validation-guidance-industry (accessed on 9 October 2024).
- ICH Guideline M10 on Bioanalytical Method Validation and Study Sample Analysis. Published on 25 July 2022. Available online: https://www.ema.europa.eu/en/documents/scientific-guideline/ich-guideline-m10-bioanalytical-method-validation-step-5_en.pdf (accessed on 9 October 2024).
- Magnusson, Β.; Örnemark, U. Eurachem Guide: The Fitness for Purpose of Analytical Methods—A Laboratory Guide to Method Validation and Related Topics, 2nd ed.; Magnusson, Β., Örnemark, U., Eds.; Eurachem: Bucharest, Romania, 2014; ISBN 978-91-87461-59-0. Available online: www.eurachem.org (accessed on 9 October 2024).

| Concentration (µM) | Equation | R2 | RSD (Mean) | LLOQ |
|---|---|---|---|---|
| 0.25–25.0 | Y = 0.3193 × X + 0.0856 | 0.9995 | 0.02 | 0.22 |
| QC Concentration (µM) | Average (n = 5) | % RSD (n = 5) | % Recovery |
|---|---|---|---|
| 0.25 | 0.25 | 0.03 | 98.9% |
| 1.0 | 1.05 | 0.03 | 104.8% |
| 5.0 | 5.06 | 0.10 | 101.3% |
| 25.0 | 25.28 | 0.61 | 101.1% |
| Level | Nominal Concentrations (µM) | Intra-Day | Inter-Day | ||
|---|---|---|---|---|---|
| Trueness | Precision | Trueness | Precision | ||
| (%RE) | (%RSD) | (%RE) | (%RSD) | ||
| LLOQ | 0.25 | −1.10% | 10.90% | 3.10% | 9.60% |
| Low | 1.0 | 4.80% | 3.10% | 0.80% | 8.30% |
| Medium | 5.0 | 1.30% | 2.00% | 1.40% | 4.00% |
| High | 25.0 | 1.10% | 2.40% | 1.30% | 3.00% |
| Age | Sex | BMI | TMAO (µM) | TC (mg/dL) | TG (mg/dL) | HDL (mg/dL) | LDL (mg/dL) | CRP (mg/L) |
|---|---|---|---|---|---|---|---|---|
| (A) Healthy volunteers (University of the Aegean) | ||||||||
| 21 | F | 21.0 | 0.666 | 149 | 55 | 69 | 81 | 0.04 |
| 21 | F | 19.8 | 0.725 | 151 | 64 | 72 | 79 | 0.07 |
| 20 | M | 23.2 | 0.779 | 122 | 84 | 46 | 69 | 0.18 |
| 20 | F | 18.6 | 0.827 | 144 | 76 | 54 | 85 | 0.07 |
| 29 | F | 27.2 | 0.879 | 159 | 83 | 61 | 91 | 0.11 |
| 23 | F | 18.7 | 1.005 | 141 | 97 | 61 | 71 | 0.03 |
| 23 | F | 20.8 | 1.425 | 173 | 45 | 96 | 65 | 0.09 |
| 30 | F | 26.0 | 1.736 | 166 | 75 | 70 | 96 | 0.07 |
| 23 | M | 22.4 | 2.131 | 179 | 124 | 53 | 101 | 0.38 |
| 22 | F | 24.0 | 2.463 | 156 | 68 | 61 | 76 | 0.25 |
| 22 | F | 23.1 | 2.705 | 171 | 69 | 70 | 82 | 0.24 |
| 24 | M | 25.6 | 2.882 | 154 | 58 | 69 | 73 | 0.17 |
| (B) Hyperlipidemic volunteers (University Hospital of Ioannina) | ||||||||
| 71 | M | 27.4 | 4.915 | 142 | 142 | 32 | 71 | 0.40 |
| 55 | M | 28.6 | 5.342 | 201 | 111 | 53 | 126 | 0.20 |
| 22 | F | 23.1 | 4.046 | 244 | 88 | 72 | 154 | 0.10 |
| 57 | F | 27.3 | 3.553 | 164 | 147 | 50 | 85 | 0.20 |
| 34 | M | 22.1 | 3.950 | 288 | 204 | 50 | 198 | 0.40 |
| 71 | F | 29.8 | 11.847 | 185 | 186 | 48 | 100 | 0.40 |
| 35 | M | 34.9 | 10.584 | 285 | 77 | 53 | 216 | 0.30 |
| Group | Value | Age | BMI | TMAO (µM) | TC |
|---|---|---|---|---|---|
| (mg/dL) | |||||
| Healthy | Mean | 34 | 22.5 | 1.519 | 155 |
| SD | 3 | 2.7 | 0.798 | 15 | |
| Hyperlipidemic | Mean | 49 | 27.6 | 6.177 | 216 |
| SD | 18 | 4.0 | 3.3306 | 54 | |
| p | 0.0015 | 0.0130 | 0.0002 | 0.0171 | |
| Group | Value | TG (mg/dL) | HDL (mg/dL) | LDL (mg/dL) | CRP (mg/L) |
| Healthy | Mean | 75 | 65 | 81 | 0.140 |
| SD | 20 | 12 | 11 | 0.100 | |
| Hyperlipidemic | Mean | 136 | 51 | 136 | 0.290 |
| SD | 44 | 11 | 52 | 0.110 | |
| p | 0.0018 | 0.0287 | 0.0221 | 0.0118 |
Disclaimer/Publisher’s Note: The statements, opinions and data contained in all publications are solely those of the individual author(s) and contributor(s) and not of MDPI and/or the editor(s). MDPI and/or the editor(s) disclaim responsibility for any injury to people or property resulting from any ideas, methods, instructions or products referred to in the content. |
© 2025 by the authors. Licensee MDPI, Basel, Switzerland. This article is an open access article distributed under the terms and conditions of the Creative Commons Attribution (CC BY) license (https://creativecommons.org/licenses/by/4.0/).
Share and Cite
Parisis, N.A.; Bousdouni, P.; Kandyliari, A.; Spyridaki, M.-H.; Koutsogianni, A.D.; Telli, C.; Tsilidis, K.K.; Koutelidakis, A.E.; Tzakos, A.G. Development and Validation of a Simple and Cost-Effective LC-MS/MS Method for the Quantitation of the Gut-Derived Metabolite Trimethylamine N-Oxide in Human Plasma of Healthy and Hyperlipidemic Volunteers. Molecules 2025, 30, 2398. https://doi.org/10.3390/molecules30112398
Parisis NA, Bousdouni P, Kandyliari A, Spyridaki M-H, Koutsogianni AD, Telli C, Tsilidis KK, Koutelidakis AE, Tzakos AG. Development and Validation of a Simple and Cost-Effective LC-MS/MS Method for the Quantitation of the Gut-Derived Metabolite Trimethylamine N-Oxide in Human Plasma of Healthy and Hyperlipidemic Volunteers. Molecules. 2025; 30(11):2398. https://doi.org/10.3390/molecules30112398
Chicago/Turabian StyleParisis, Nikolaos A., Panoraia Bousdouni, Aikaterini Kandyliari, Maria-Helen Spyridaki, Amalia Despoina Koutsogianni, Christina Telli, Konstantinos K. Tsilidis, Antonios E. Koutelidakis, and Andreas G. Tzakos. 2025. "Development and Validation of a Simple and Cost-Effective LC-MS/MS Method for the Quantitation of the Gut-Derived Metabolite Trimethylamine N-Oxide in Human Plasma of Healthy and Hyperlipidemic Volunteers" Molecules 30, no. 11: 2398. https://doi.org/10.3390/molecules30112398
APA StyleParisis, N. A., Bousdouni, P., Kandyliari, A., Spyridaki, M.-H., Koutsogianni, A. D., Telli, C., Tsilidis, K. K., Koutelidakis, A. E., & Tzakos, A. G. (2025). Development and Validation of a Simple and Cost-Effective LC-MS/MS Method for the Quantitation of the Gut-Derived Metabolite Trimethylamine N-Oxide in Human Plasma of Healthy and Hyperlipidemic Volunteers. Molecules, 30(11), 2398. https://doi.org/10.3390/molecules30112398