
One-Pot Approach Towards Peptoids Synthesis Using 1,4-Dithiane-2,5-Diol via Multicomponent Approach and DFT-Based Computational Analysis


Abstract
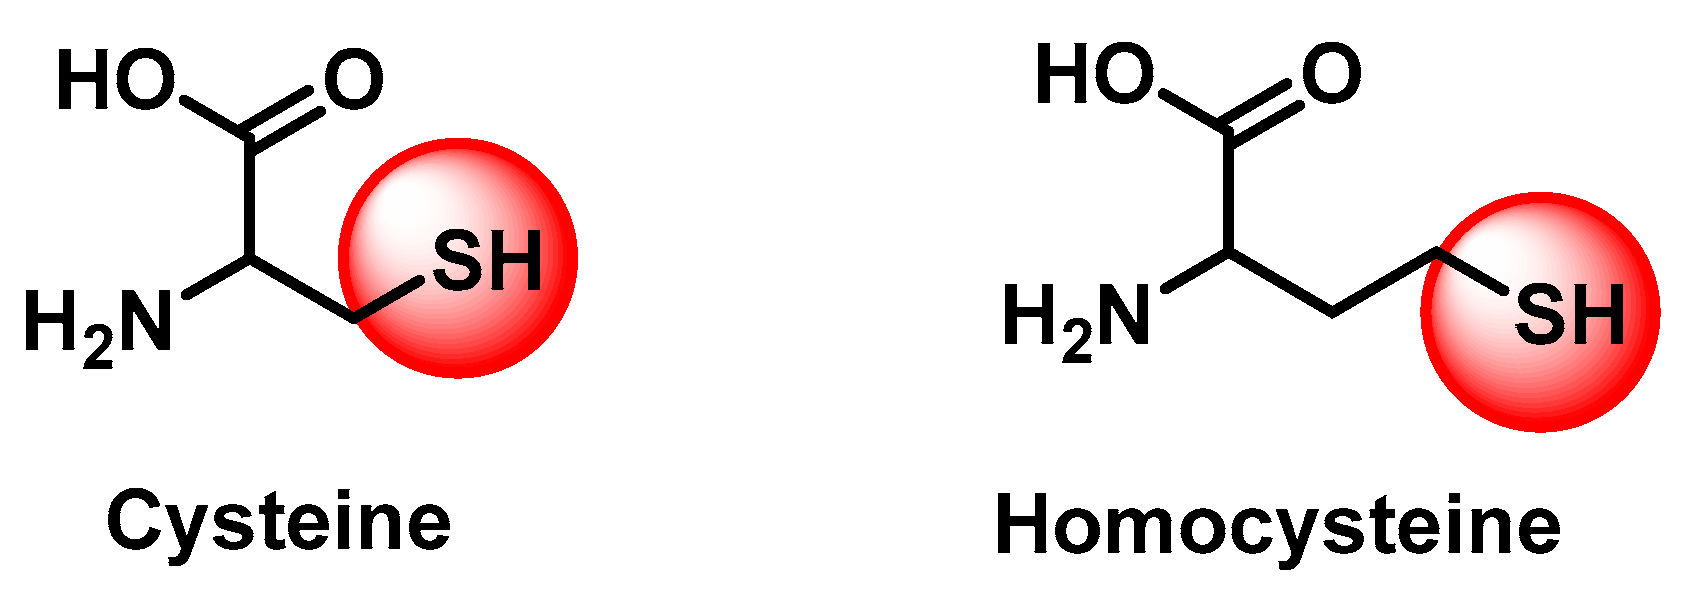
1. Introduction
2. Results and Discussion
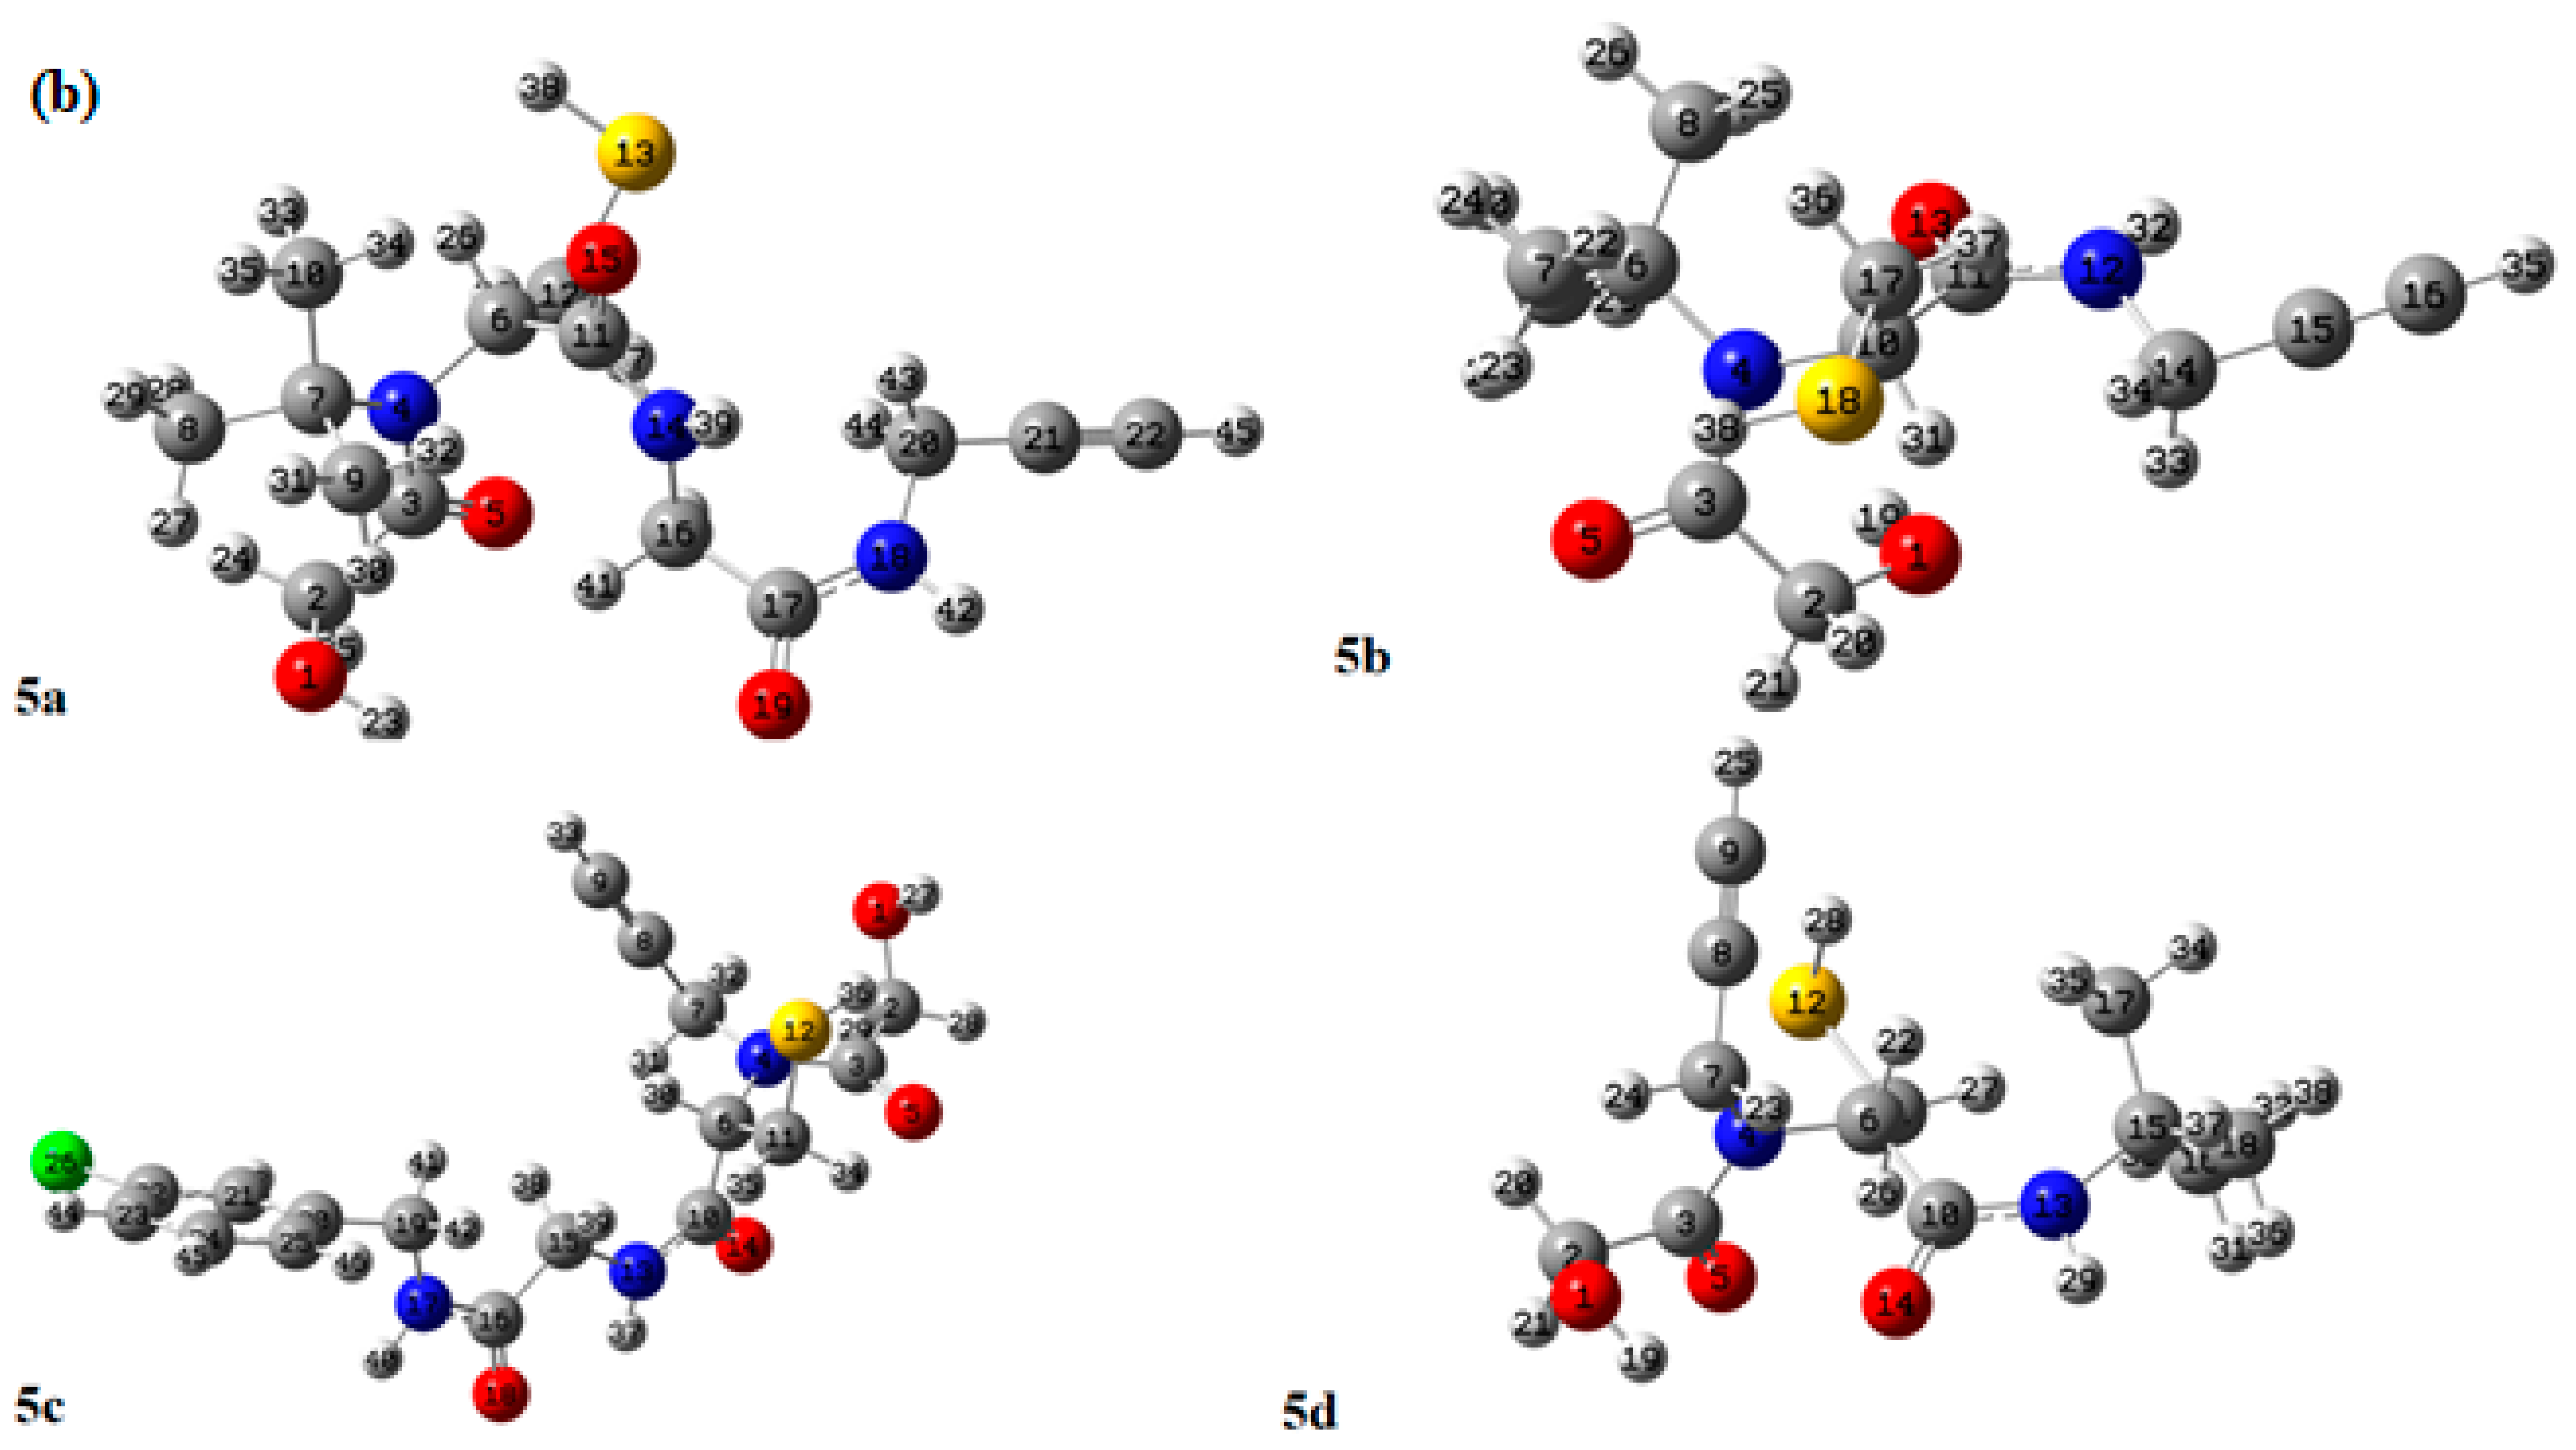
2.1. Computational Study
2.2. Vibrational Spectroscopy
2.2.1. C–H Vibrations
2.2.2. O-H Vibrations
2.2.3. N-H Vibrations
2.2.4. Carbon–Sulfur (C–S) Vibrations
2.2.5. Carbon–Nitrogen (C–N) Vibrations
2.2.6. C=O Vibrations
2.2.7. C=C Stretching Vibrations
2.2.8. C≡C Stretching Vibrations
2.3. NBO Analysis
2.4. Nonlinear Optical (NLO) Properties
2.5. FMO Analysis
2.6. PDOS and TDOS Topology
2.7. ELF and LOL Methodology Analysis
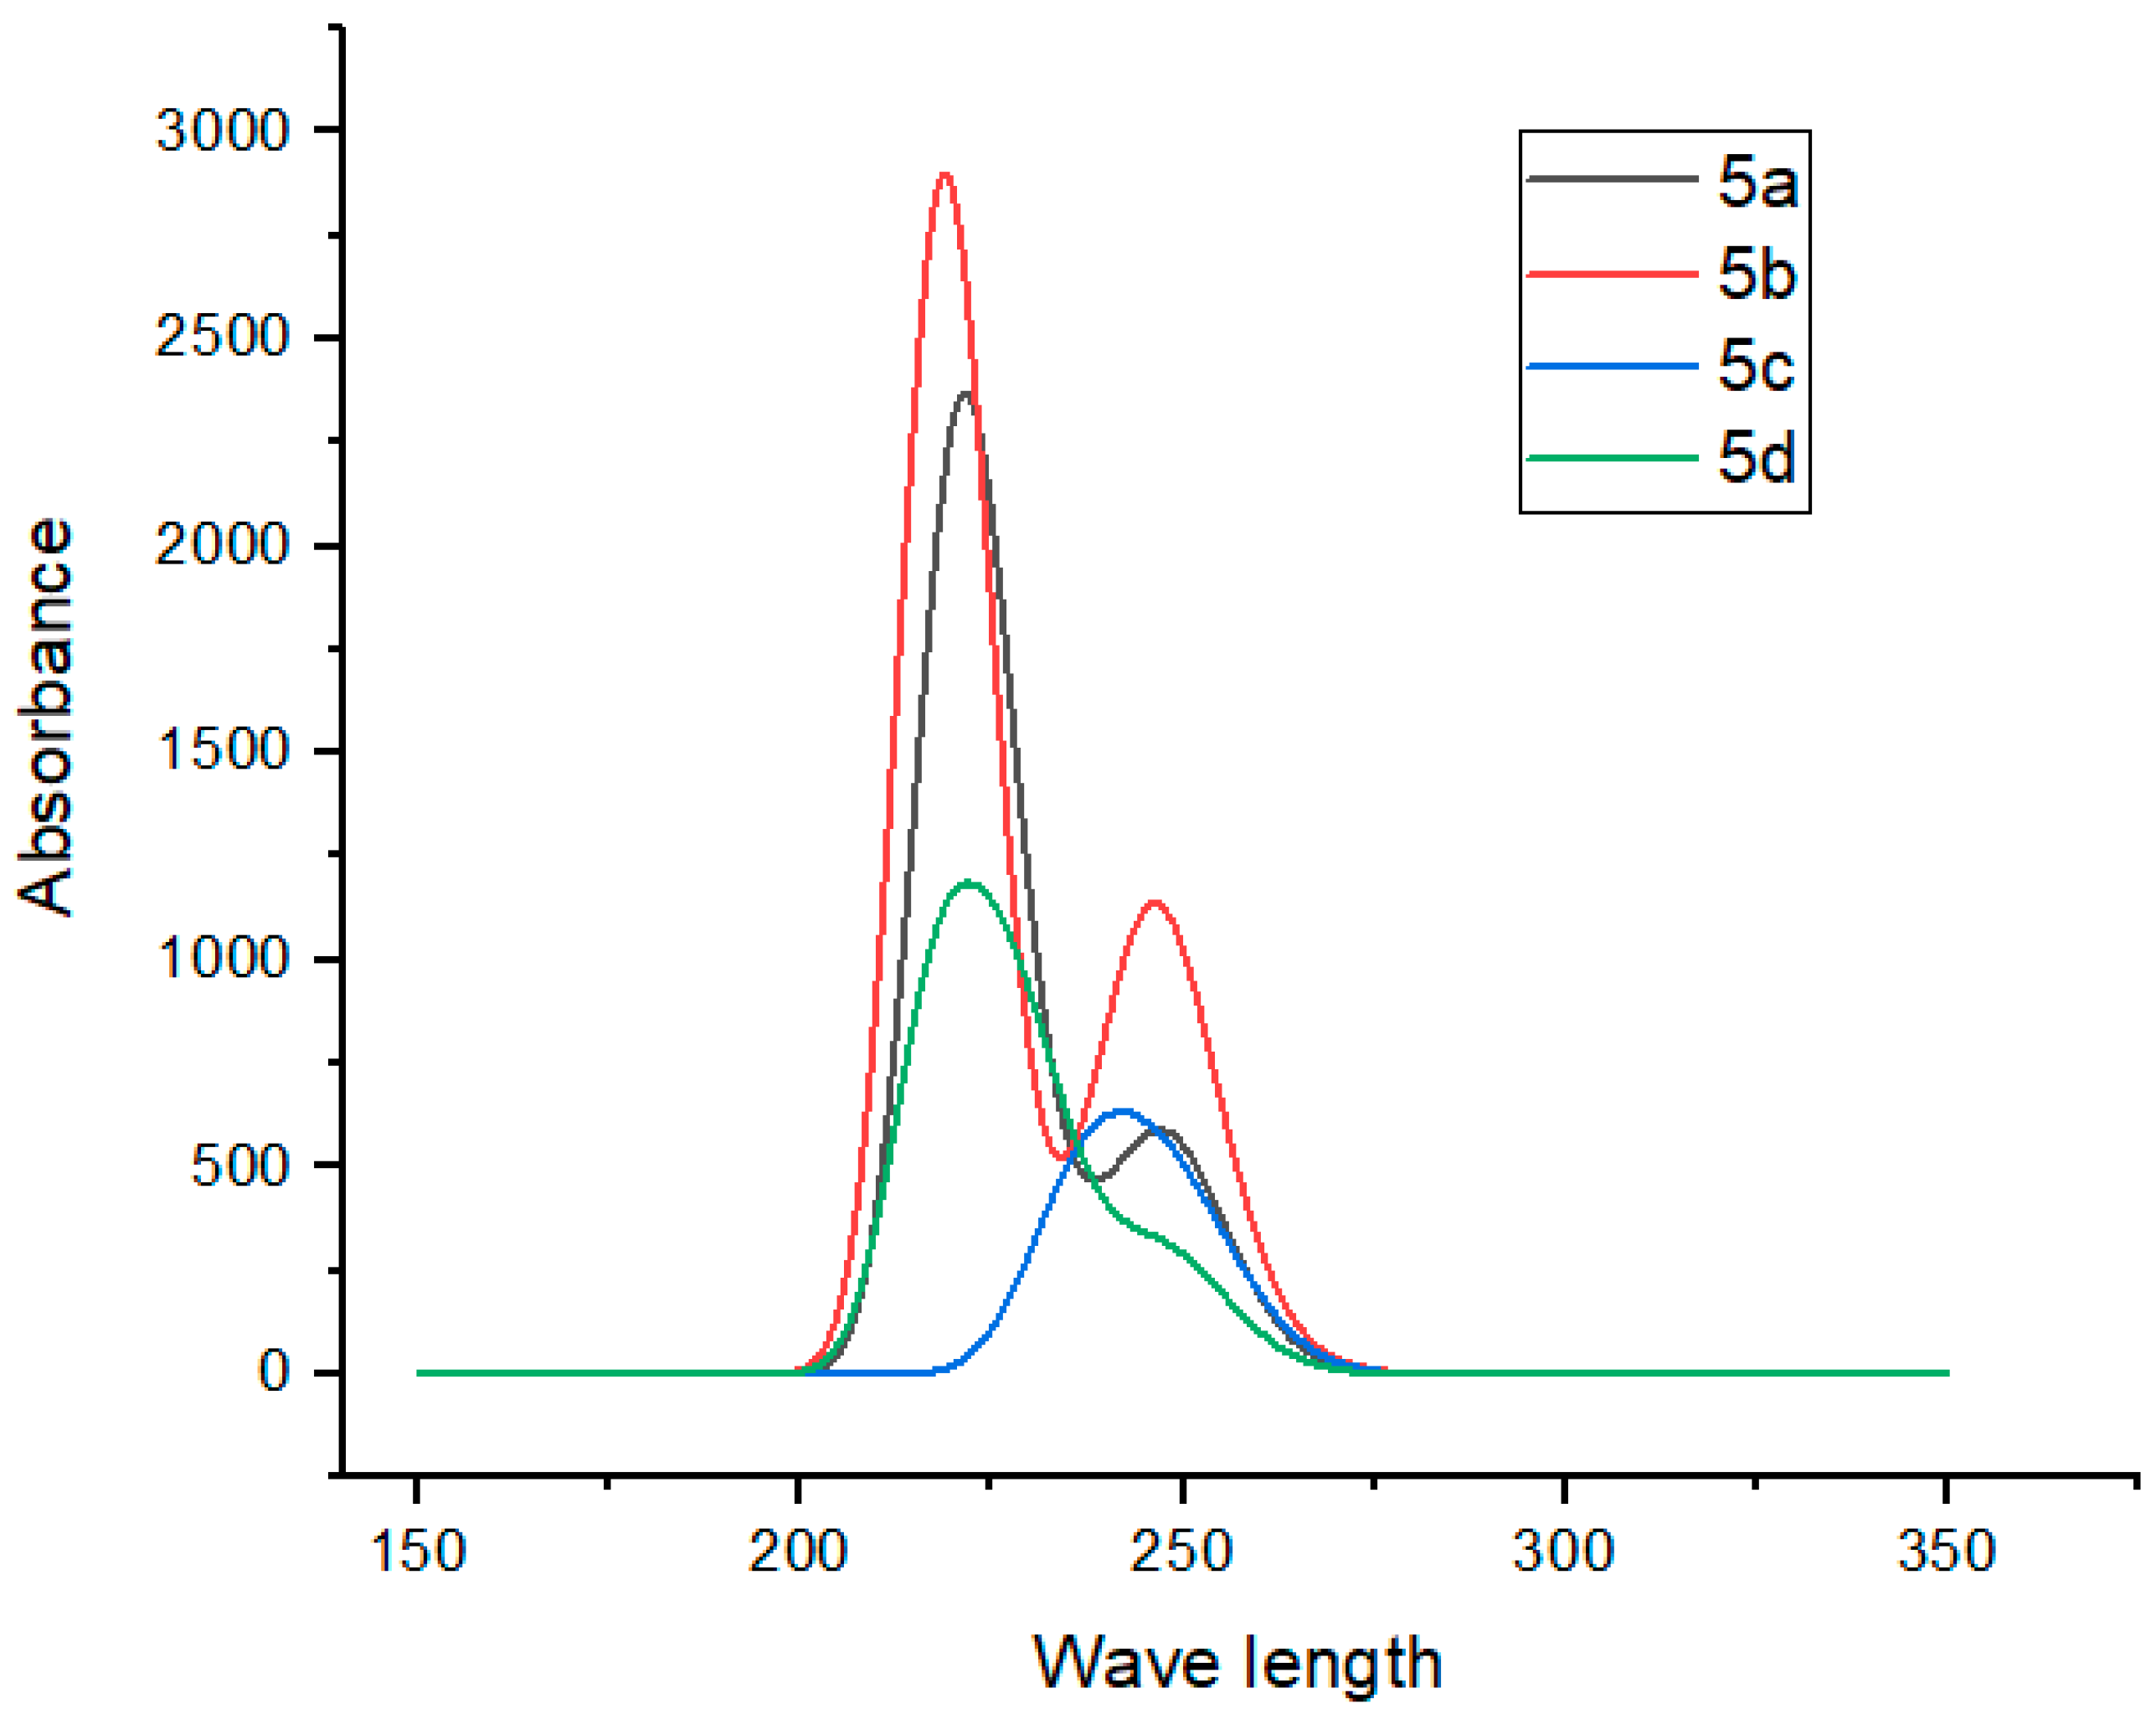
2.8. UV–Visible Spectroscopy
2.9. Natural Population Results
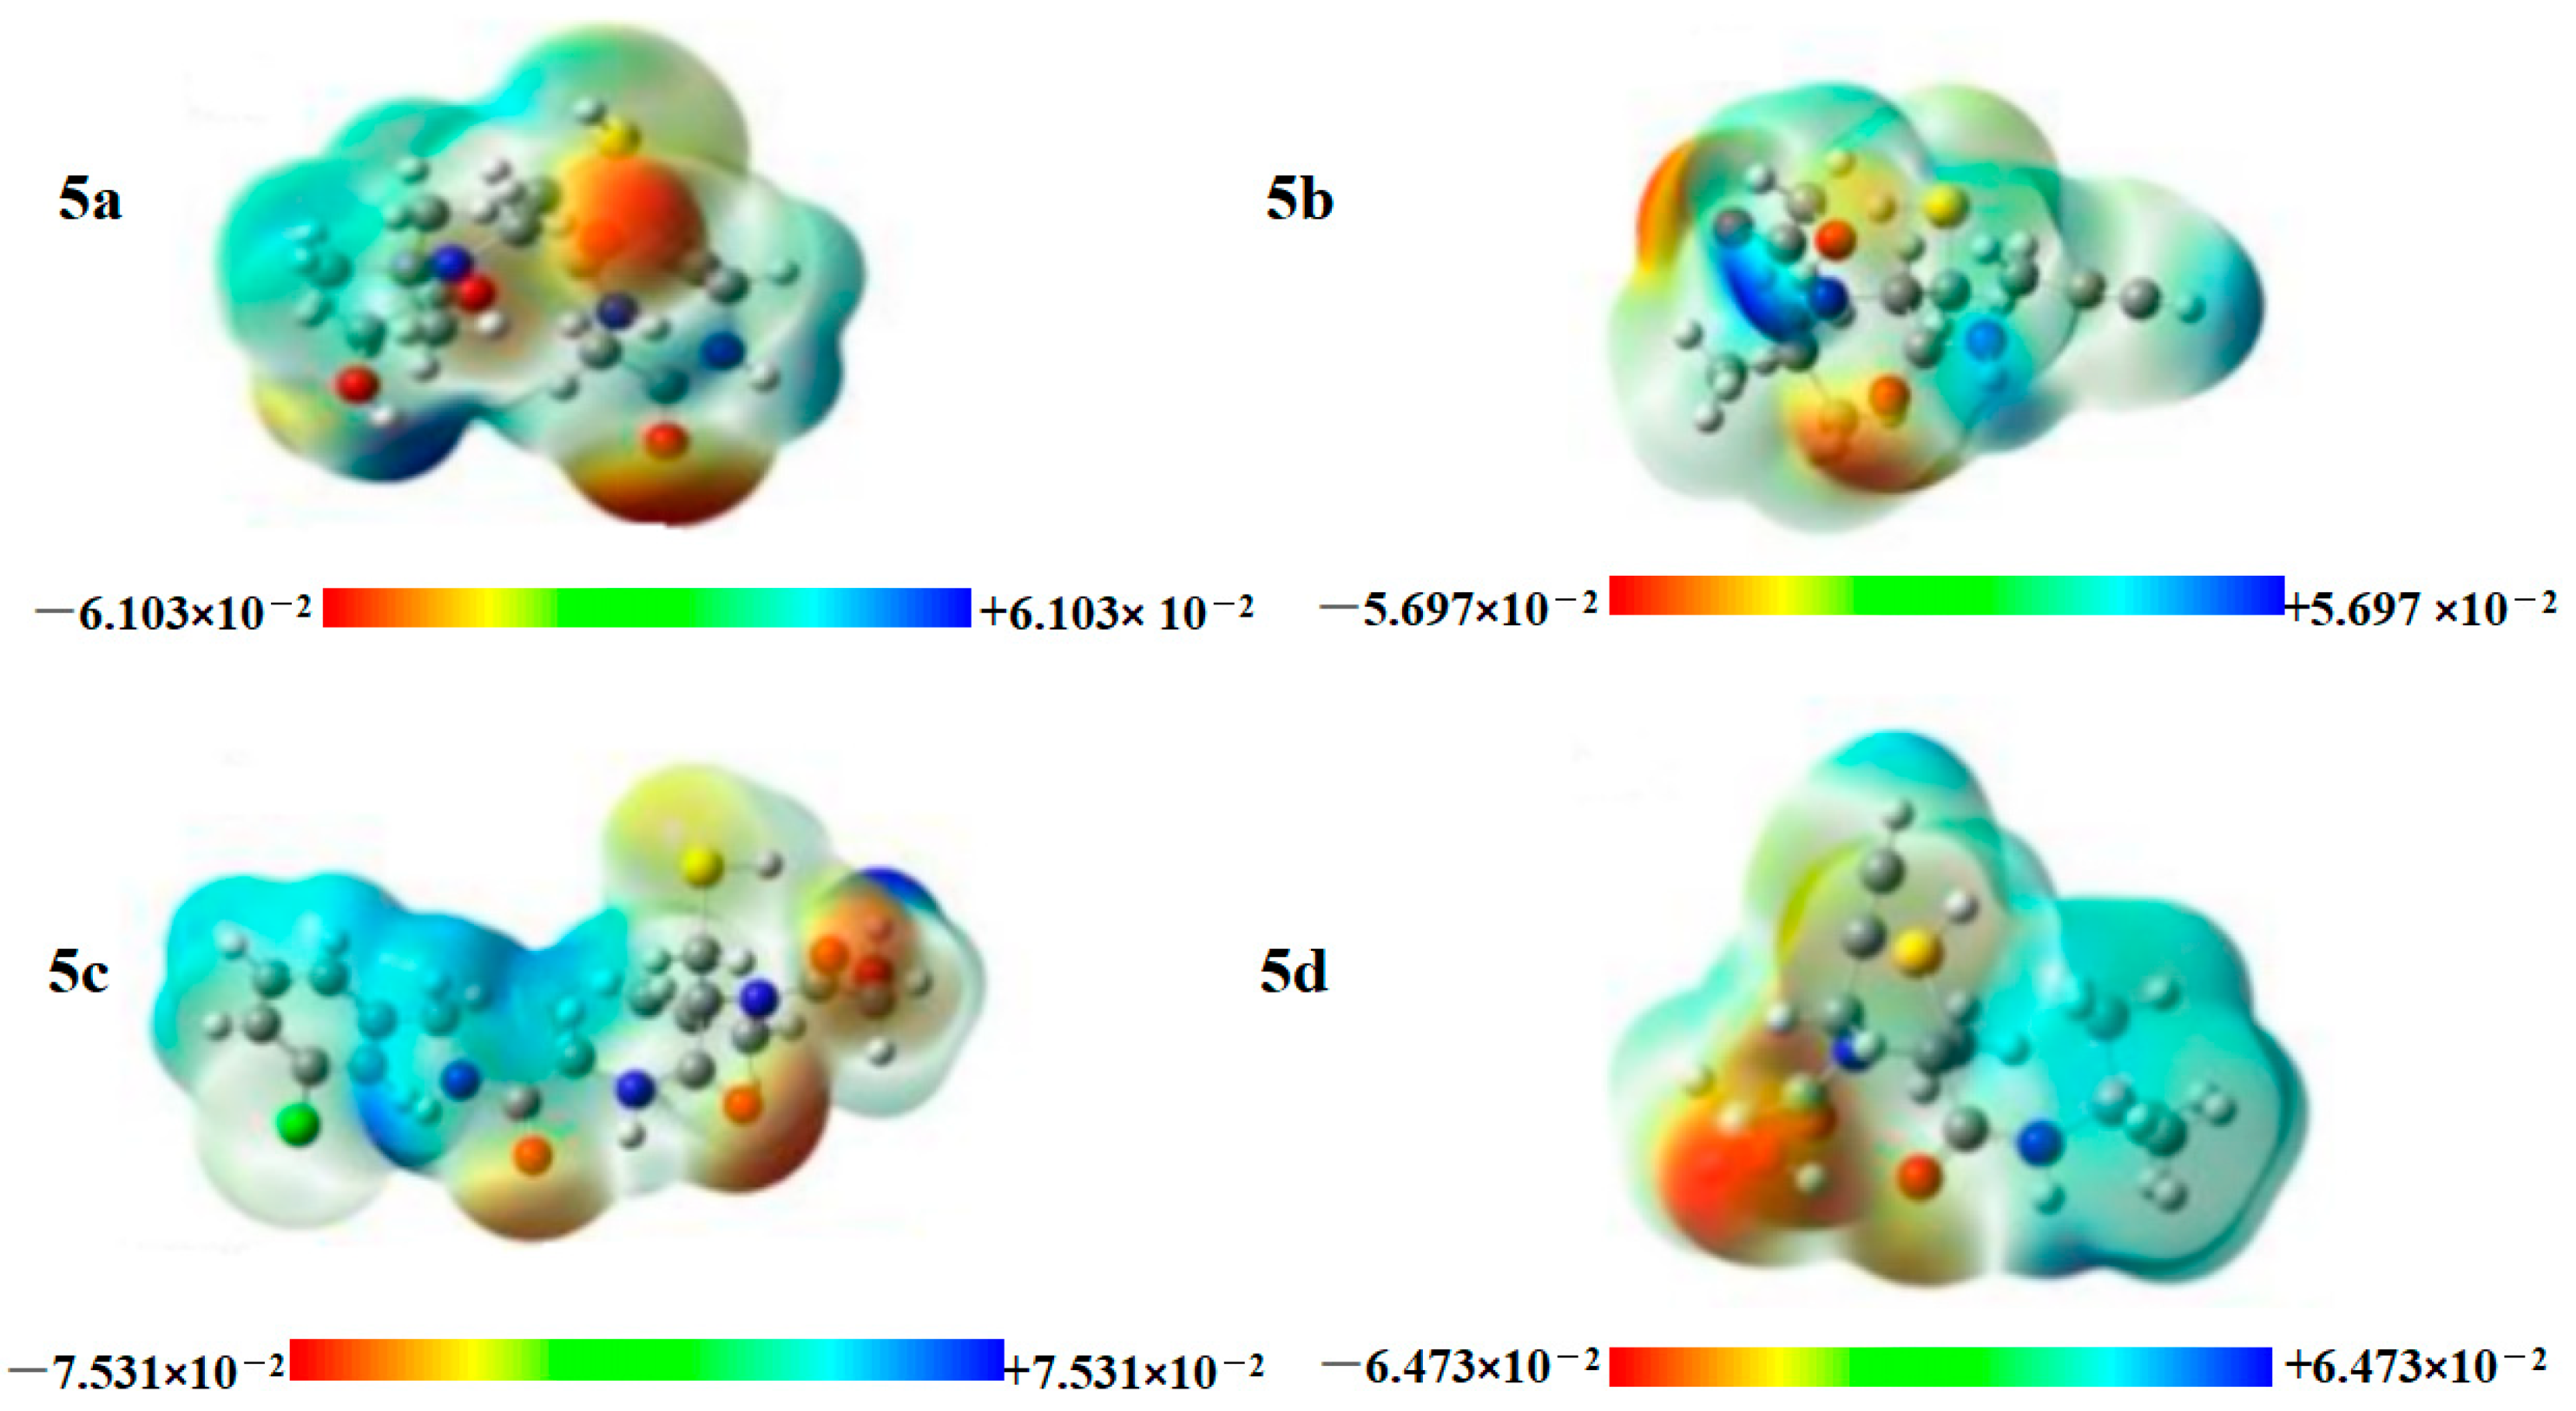
2.10. MEP Surface Analysis
3. Experimental
3.1. Chemistry
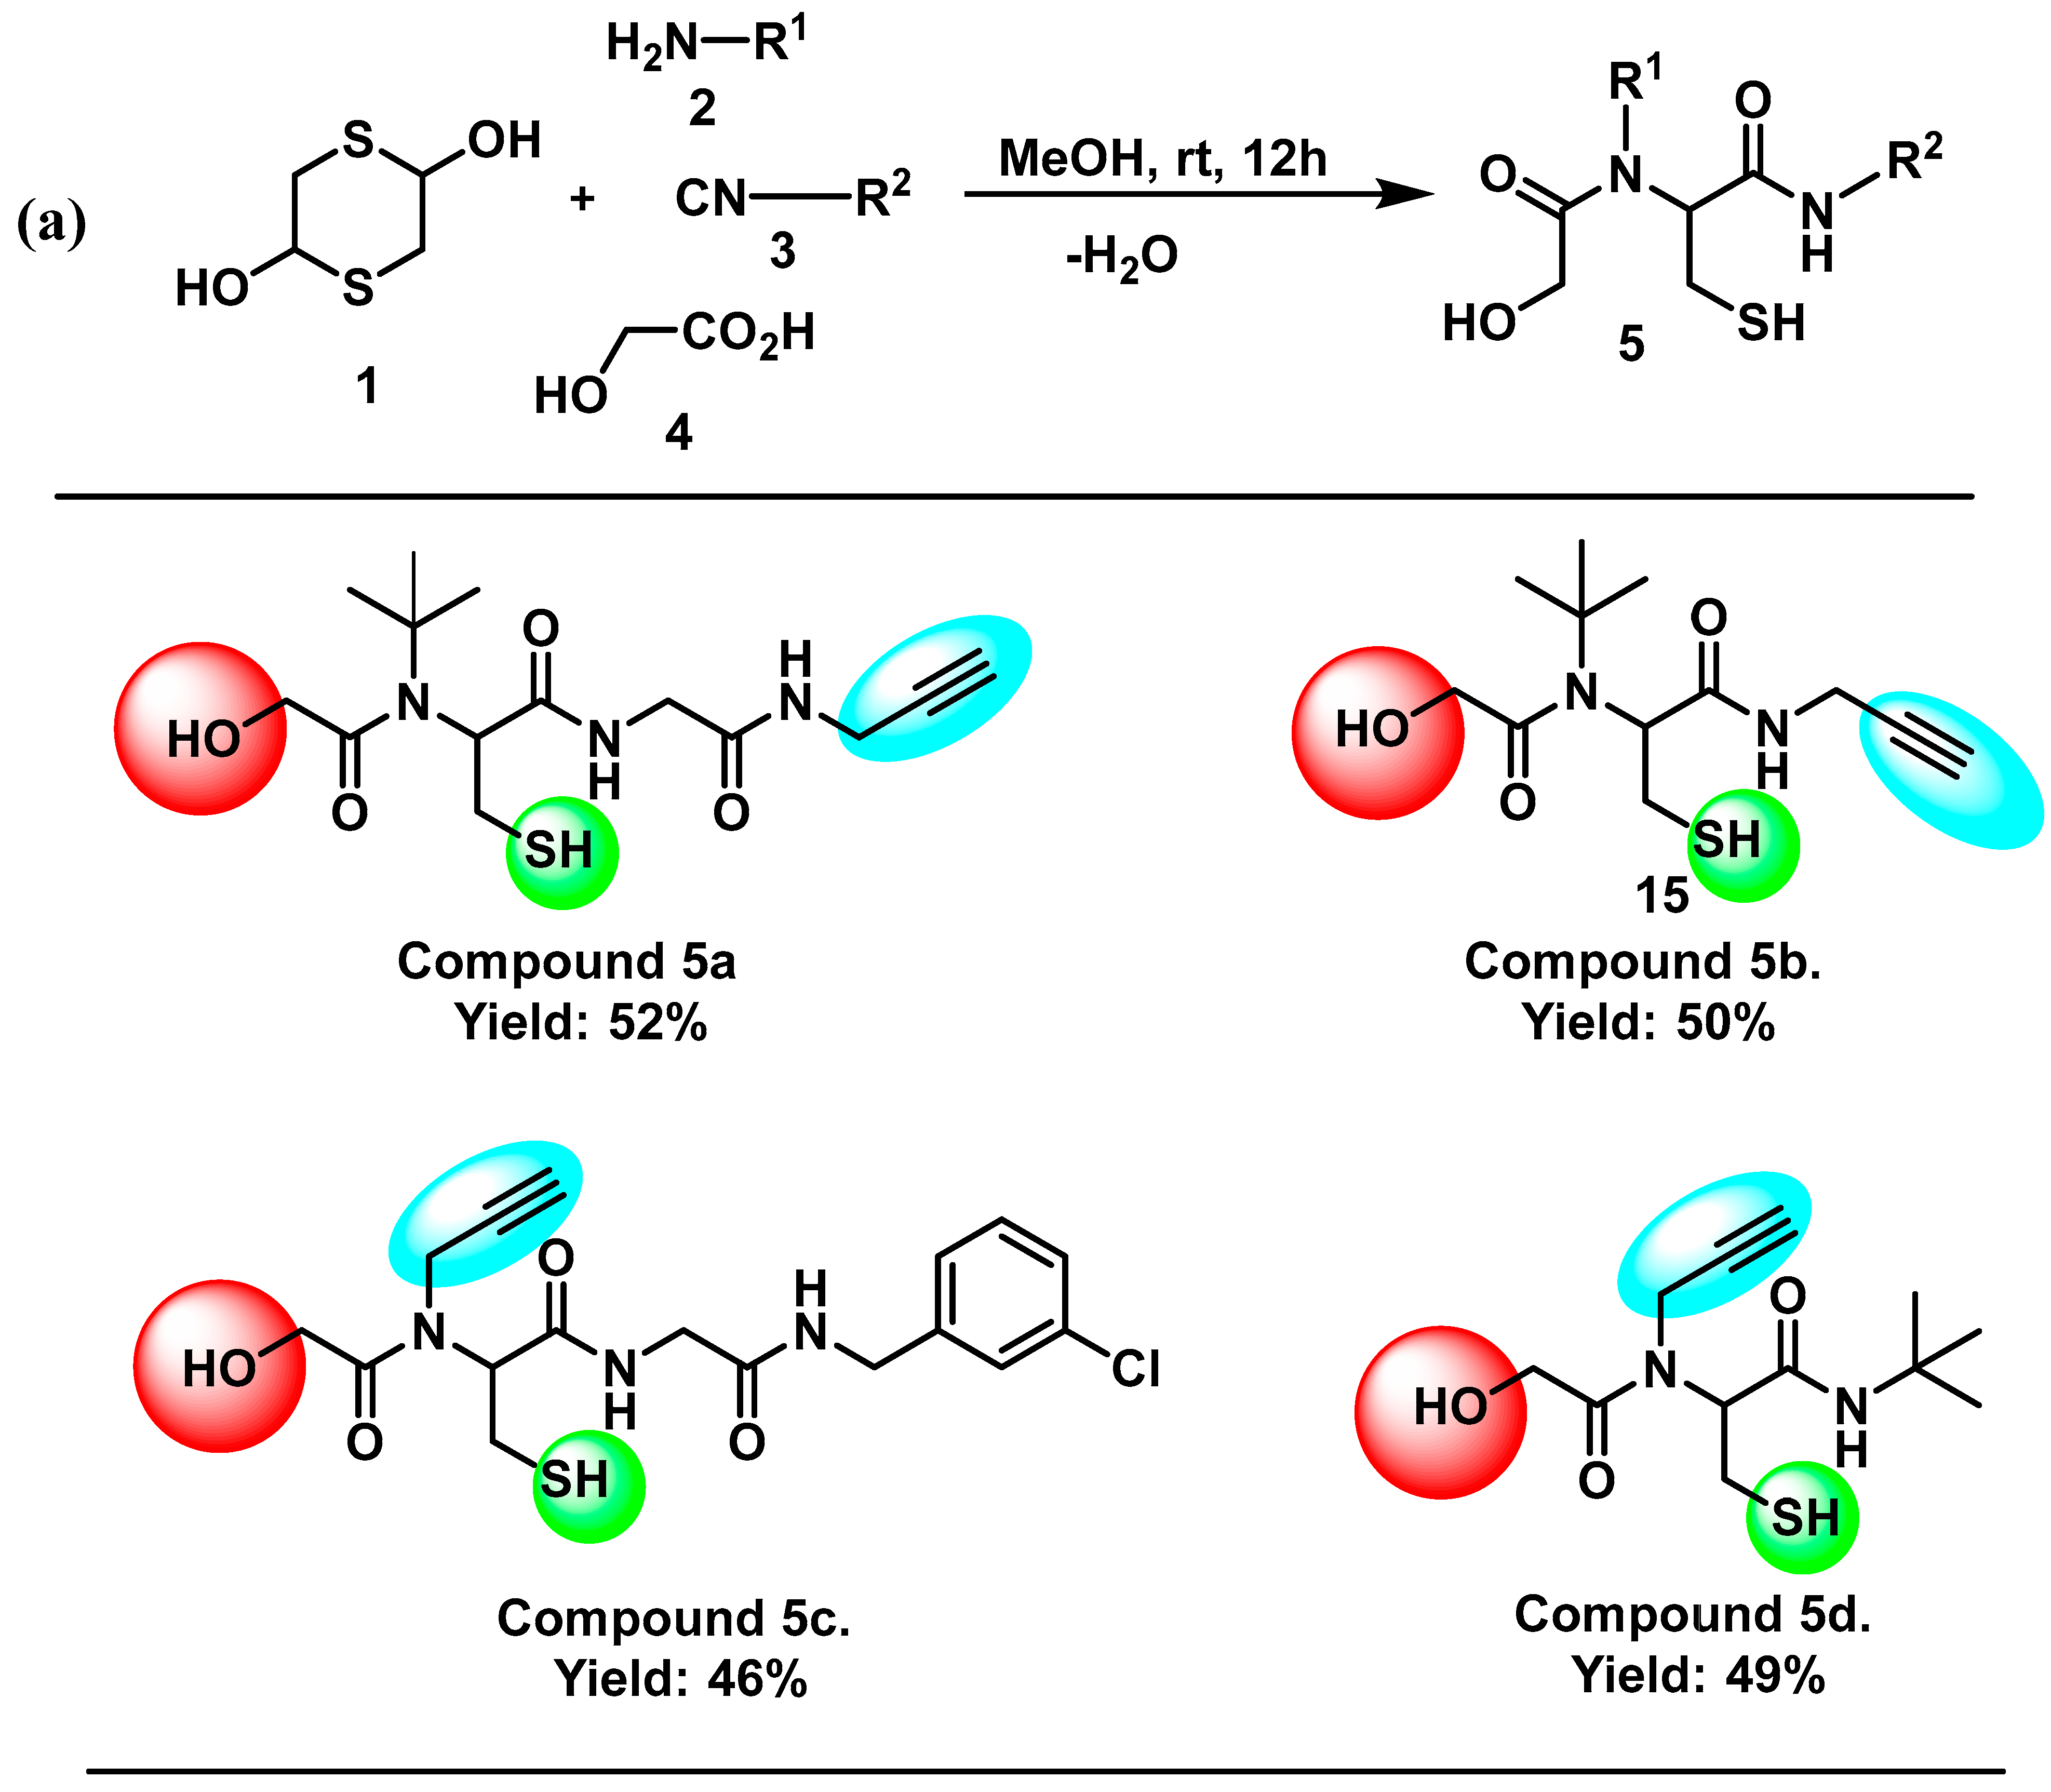
3.2. General Method for the Synthesis of Peptoids
3.3. Synthesis of 2-(N-(Tert-butyl)-2-hydroxyacetamido)-3-mercapto-N-(2-oxo-2-(prop-2-yn-1-ylamino) Ethyl) Propenamide (5a)
3.4. Synthesis of 2-(N-(Tert-butyl)-2-hydroxyacetamido)-3-mercapto-N-(prop-2-yn-1-yl) Propenamide (5b)
3.5. Synthesis of N-(2-((3-Chlorobenzyl) Amino)-2-oxoethyl)-2-(2-hydroxy-N-(prop-2-yn-1-yl) Acetamido)-3-mercaptopropanamide (5c)
3.6. Synthesis of N-(Tert-butyl)-2-(2-hydroxy-N-(prop-2-yn-1-yl) Acetamido)-3-mercaptopropanamide (5d)
3.7. Experimental Section (Characterization, Computational Procedures, DFT-Based Calculations)
4. Conclusions
Supplementary Materials
Author Contributions
Funding
Institutional Review Board Statement
Informed Consent Statement
Data Availability Statement
Acknowledgments
Conflicts of Interest
References
- Concepcion, O.; Ali, A.; Khalid, M.; de la Torre, A.F.; Khan, M.U.; Raza, A.R.; Kamal, G.M.; Rehman, M.F.U.; Alam, M.M.; Imran, M. Facile synthesis of diversely functionalized peptoids, spectroscopic characterization, and DFT-based nonlinear optical exploration. ACS Omega 2021, 6, 26016–26025. [Google Scholar] [CrossRef] [PubMed]
- Zuckermann, R.N.; Kerr, J.M.; Kent, S.B.; Moos, W.H. Efficient method for the preparation of peptoids [oligo(N-substituted glycines)] by submonomer solid-phase synthesis. J. Am. Chem. Soc. 1992, 114, 10646–10647. [Google Scholar] [CrossRef]
- Katyal, P.; Meleties, M.; Montclare, J.K. Self-assembled protein-and peptide-based nanomaterials. ACS Biomater. Sci. Eng. 2019, 5, 4132–4147. [Google Scholar] [CrossRef]
- Chen, J.; Wang, H.; Long, F.; Bai, S.; Wang, Y. Dynamic supramolecular hydrogels mediated by chemical reactions. Chem. Commun. 2023, 59, 14236–14248. [Google Scholar] [CrossRef] [PubMed]
- Sun, J.; Li, Z. Peptoid applications in biomedicine and nanotechnology. In Peptide Applications in Biomedicine, Biotechnology and Bioengineering; Elsevier: Amsterdam, The Netherlands, 2018; pp. 183–213. [Google Scholar]
- Fowler, S.A.; Blackwell, H.E. Structure–function relationships in peptoids: Recent advances toward deciphering the structural requirements for biological function. Org. Biomol. Chem. 2009, 7, 1508–1524. [Google Scholar] [CrossRef]
- Horn, T.; Lee, B.-C.; Dill, K.A.; Zuckermann, R.N. Incorporation of chemoselective functionalities into peptoids via solid-phase submonomer synthesis. Bioconjug. Chem. 2004, 15, 428–435. [Google Scholar] [CrossRef]
- Bailey, M.A.; Ingram, M.J.; Naughton, D.P. A novel anti-oxidant and anti-cancer strategy: A peptoid anti-inflammatory drug conjugate with SOD mimic activity. Biochem. Biophys. Res. Commun. 2004, 317, 1155–1158. [Google Scholar] [CrossRef]
- Leman, E.; Huang, W.; Contreras-Trujillo, H.; Volksmer, J.-P.; Willingham, S.; Barron, A.; Gonzalgo, M. 1072 Inhibition of bladder cancer cell growth by treatment with synthetically derived anti-cancer peptoids. J. Urol. 2012, 187, e435–e436. [Google Scholar] [CrossRef]
- Akhter, S.; Concepcion, O.; de la Torre, A.F.; Ali, A.; Raza, A.R.; Eman, R.; Khalid, M.; ur Rehman, M.F.; Akram, M.S.; Ali, H.M. Synthesis, spectroscopic characterization, DFT and molecular dynamics of quinoline-based peptoids. Arab. J. Chem. 2023, 16, 104570. [Google Scholar] [CrossRef]
- Ugi, I.; Steinbrückner, C. Isonitrile, II. Reaktion von isonitrilen mit carbonylverbindungen, aminen und stickstoffwasserstoffsäure. Chem. Berichte 1961, 94, 734–742. [Google Scholar] [CrossRef]
- Ugi, I. The α-addition of immonium ions and anions to isonitriles accompanied by secondary reactions. Angew. Chem. Int. Ed. Engl. 1962, 1, 8–21. [Google Scholar] [CrossRef]
- Sun, J.; Zuckermann, R.N. Peptoid polymers: A highly designable bioinspired material. ACS Nano 2013, 7, 4715–4732. [Google Scholar] [CrossRef]
- Vener, M.; Egorova, A.; Fomin, D.; Tsirelson, V. DFT study of H-bonds in the peptide secondary structures: The backbone–side-chain and polar side-chains interactions. J. Mol. Struct. 2010, 972, 11–15. [Google Scholar] [CrossRef]
- Kwon, Y.-U.; Kodadek, T. Quantitative evaluation of the relative cell permeability of peptoids and peptides. J. Am. Chem. Soc. 2007, 129, 1508–1509. [Google Scholar] [CrossRef]
- Butterfoss, G.L.; Yoo, B.; Jaworski, J.N.; Chorny, I.; Dill, K.A.; Zuckermann, R.N.; Bonneau, R.; Kirshenbaum, K.; Voelz, V.A. De novo structure prediction and experimental characterization of folded peptoid oligomers. Proc. Natl. Acad. Sci. USA 2012, 109, 14320–14325. [Google Scholar] [CrossRef]
- Kausteklis, J.; Aleksa, V.; Iramain, M.A.; Brandán, S.A. Cation-anion interactions in 1-buthyl-3-methyl imidazolium nitrate ionic liquid and their effect on their structural and vibrational properties. J. Mol. Struct 2018, 1164, 1–14. [Google Scholar] [CrossRef]
- Noureddine, O.; Gatfaoui, S.; Brandán, S.A.; Marouani, H.; Issaoui, N. Structural, docking and spectroscopic studies of a new piperazine derivative, 1-Phenylpiperazine-1, 4-diium bis (hydrogen sulfate). J. Mol. Struct. 2020, 1202, 127351. [Google Scholar] [CrossRef]
- Gatfaoui, S.; Issaoui, N.; Brandán, S.A.; Roisnel, T.; Marouani, H. Synthesis and characterization of p-xylylenediaminium bis (nitrate). Effects of the coordination modes of nitrate groups on their structural and vibrational properties. J. Mol. Struct. 2018, 1151, 152–168. [Google Scholar] [CrossRef]
- Noureddine, O.; Gatfaoui, S.; Brandan, S.A.; Sagaama, A.; Marouani, H.; Issaoui, N. Experimental and DFT studies on the molecular structure, spectroscopic properties, and molecular docking of 4-phenylpiperazine-1-ium dihydrogen phosphate. J. Mol. Struct. 2020, 1207, 127762. [Google Scholar] [CrossRef]
- Anju, L.S.; Aruldhas, D.; Joe, I.H.; Balachandran, S. Density functional theory, spectroscopic and hydrogen bonding analysis of fenoxycarb–water complexes. J. Mol. Struct. 2020, 1201, 127201. [Google Scholar] [CrossRef]
- Mennucci, B.; Tomasi, J.; Cammi, R.; Cheeseman, J.R.; Frisch, M.J.; Devlin, F.J.; Gabriel, S.; Stephens, P.J. Polarizable continuum model (PCM) calculations of solvent effects on optical rotations of chiral molecules. J. Phys. Chem. A 2002, 106, 6102–6113. [Google Scholar] [CrossRef]
- Alecu, I.M.; Zheng, J.; Zhao, Y.; Truhlar, D.G. Computational thermochemistry: Scale factor databases and scale factors for vibrational frequencies obtained from electronic model chemistries. J. Chem. Theory Comput. 2010, 6, 2872–2887. [Google Scholar] [CrossRef] [PubMed]
- Lee, C.; Yang, W.; Parr, R.G. Development of the Colle-Salvetti correlation-energy formula into a functional of the electron density. Phys. Rev. B 1988, 37, 785. [Google Scholar] [CrossRef]
- Zainuri, D.A.; Arshad, S.; Khalib, N.C.; Razak, I.A.; Pillai, R.R.; Sulaiman, S.F.; Hashim, N.S.; Ooi, K.L.; Armaković, S.; Armaković, S.J. Synthesis, XRD crystal structure, spectroscopic characterization (FT-IR, 1H and 13C NMR), DFT studies, chemical reactivity and bond dissociation energy studies using molecular dynamics simulations and evaluation of antimicrobial and antioxidant activities of a novel chalcone derivative,(E)-1-(4-bromophenyl)-3-(4-iodophenyl) prop-2-en-1-one. J. Mol. Struct. 2017, 1128, 520–533. [Google Scholar]
- Costa, A., Jr.; Ondar, G.; Versiane, O.; Ramos, J.; Santos, T.; Martin, A.; Raniero, L.; Bussi, G.; Soto, C.T. DFT: B3LYP/6-311G (d, p) vibrational analysis of bis-(diethyldithiocarbamate) zinc (II) and natural bond orbitals. Spectrochim. Acta Part A Mol. Biomol. Spectrosc. 2013, 105, 251–258. [Google Scholar] [CrossRef]
- Andrade, S.; Gonçalves, L.C.; Jorge, F.E. Scaling factors for fundamental vibrational frequencies and zero-point energies obtained from HF, MP2, and DFT/DZP and TZP harmonic frequencies. J. Mol. Struct. THEOCHEM 2008, 864, 20–25. [Google Scholar] [CrossRef]
- Vennila, P.; Venkatesh, G.; Sixto-López, Y.; Kamal, C.; Kaya, S.; Serdaroğlu, G.; Landeros-Rivera, B. Synthesis, spectroscopic characterization, molecular docking studies and DFT calculation of novel Mannich base 1-((4-ethylpiperazin-1-yl)(2-hydroxyphenyl) methyl) naphthalen-2-ol. J. Mol. Struct. 2021, 1246, 131164. [Google Scholar] [CrossRef]
- Raja, G.; Venkatesh, G.; Al-Otaibi, J.S.; Vennila, P.; Mary, Y.S.; Sixto-López, Y. Synthesis, characterization, molecular docking and molecular dynamics simulations of benzamide derivatives as potential anti-ovarian cancer agents. J. Mol. Struct. 2022, 1269, 133785. [Google Scholar] [CrossRef]
- Muthukkumar, M.; Bhuvaneswari, T.; Venkatesh, G.; Kamal, C.; Vennila, P.; Armaković, S.; Armaković, S.J.; Mary, Y.S.; Panicker, C.Y. Synthesis, characterization and computational studies of semicarbazide derivative. J. Mol. Liq. 2018, 272, 481–495. [Google Scholar] [CrossRef]
- Silverstein, R.M.; Bassler, G.C. Spectrometric identification of organic compounds. J. Chem. Educ. 1962, 39, 546. [Google Scholar] [CrossRef]
- Li, J.; Guo, X.; Panchal, B.; Wang, J.; Guo, W.; Liu, B.; Yuan, Y.; Liu, S. Quantitative analysis of molecular structure characterization of different liptinite-rich coals using FTIR spectroscopy. Infrared Phys. Technol. 2024, 141, 105458. [Google Scholar] [CrossRef]
- Dai, F.; Zhuang, Q.; Huang, G.; Deng, H.; Zhang, X. Infrared spectrum characteristics and quantification of OH groups in coal. ACS Omega 2023, 8, 17064–17076. [Google Scholar] [CrossRef]
- Wiles, D.; Suprunchuk, T. The infrared absorption spectra of thiosemicarbazide and related compounds: NH2 and NH vibrations. Can. J. Chem. 1969, 47, 1087–1089. [Google Scholar] [CrossRef]
- Puviarasan, N.; Arjunan, V.; Mohan, S. FT-IR and FT-Raman studies on 3-aminophthalhydrazide and N-aminophthalimide. Turk. J. Chem. 2002, 26, 323–334. [Google Scholar]
- Rao, C.; Venkataraghavan, R.; Kasturi, T. Contribution to the infrared spectra of organosulphur compounds. Can. J. Chem. 1964, 42, 36–42. [Google Scholar] [CrossRef]
- Dede, B.; Avcı, D.; Bahçeli, S. Study on the 4-ethoxy-2-methyl-5-(4-morpholinyl)-3 (2H)-pyridazinone using FT-IR, 1H and 13C NMR, UV-vis spectroscopy, and DFT/HSEH1PBE method. Can. J. Phys. 2018, 96, 1042–1052. [Google Scholar] [CrossRef]
- Colthup, N. Introduction to Infrared and Raman Spectroscopy; Elsevier: Amsterdam, The Netherlands, 2012. [Google Scholar]
- Pavia, D.L.; Lampman, G.M.; Kriz, G.S.; Vyvyan, J.R. Introduction to Spectroscopy; Cengage Learning: Boston, MA, USA, 2015. [Google Scholar]
- Egorochkin, A.; Skobeleva, S.; Mushtina, T.; Bogoradovsky, E. Intensity of bands of the C≡C stretching modes in the IR spectra and conjugation in silylacetylenes. Russ. Chem. Bull. 1997, 46, 71–75. [Google Scholar] [CrossRef]
- Liu, J.-N.; Chen, Z.-R.; Yuan, S.-F. Study on the prediction of visible absorption maxima of azobenzene compounds. J. Zhejiang Univ.-Sci. B 2005, 6, 584–589. [Google Scholar] [CrossRef]
- Savithiri, S.; Rajarajan, G.; Thanikachalam, V. Molecular structure, vibrational spectral assignments (FT-IR and FT-Raman), UV-Vis, NMR, NBO, HOMO-LUMO and NLO properties of 3t-pentyl-2r, 6c-diphenylpiperidin-4-one picrate based on DFT calculations. J. Mol. Struct. 2016, 1105, 225–237. [Google Scholar] [CrossRef]
- Malik, A.N.; Tahir, M.N.; Ali, A.; Ashfaq, M.; Ibrahim, M.; Kuznetsov, A.E.; Assiri, M.A.; Sameeh, M.Y. Preparation, crystal structure, supramolecular assembly, and DFT studies of two organic salts bearing pyridine and pyrimidine. ACS Omega 2023, 8, 25034–25047. [Google Scholar] [CrossRef]
- Muthu, S.; Ramachandran, G. Spectroscopic studies (FTIR, FT-Raman and UV–Visible), normal coordinate analysis, NBO analysis, first order hyper polarizability, HOMO and LUMO analysis of (1R)-N-(Prop-2-yn-1-yl)-2,3-dihydro-1H-inden-1-amine molecule by ab initio HF and density functional methods. Spectrochim. Acta Part A Mol. Biomol. Spectrosc. 2014, 121, 394–403. [Google Scholar]
- Murugavel, S.; Velan, V.V.; Kannan, D.; Bakthadoss, M. Synthesis, crystal structure analysis, spectral investigations, DFT computations, Biological activities and molecular docking of methyl (2E)-2-{[N-(2-formylphenyl)(4-methylbenzene) sulfonamido] methyl}-3-(4-fluorophenyl) prop-2-enoate, a potential bioactive agent. J. Mol. Struct. 2016, 1108, 150–167. [Google Scholar]
- Khalid, M.; Ali, A.; Din, Z.U.; Tahir, M.N.; de Alcantara Morais, S.F.; Braga, A.A.C.; Akhtar, M.N.; Imran, M.; Rodrigues-Filho, E. β-Hydroxy Carbonyl compounds via aldol reaction: Single crystal investigation and quantum chemical exploration for the unveiling of supramolecular behavior. J. Mol. Struct. 2021, 1241, 130650. [Google Scholar] [CrossRef]
- Koçyiğit, Ü.M.; Doğan, M.; Muğlu, H.; Taslimi, P.; Tüzün, B.; Yakan, H.; Bal, H.; Güzel, E.; Gülçin, İ. Determination of biological studies and molecular docking calculations of isatin-thiosemicarbazone hybrid compounds. J. Mol. Struct. 2022, 1264, 133249. [Google Scholar] [CrossRef]
- Yiğit, M.; Yiğit, B.; Taslimi, P.; Özdemir, İ.; Karaman, M.; Gulcin, I. Novel amine-functionalized benzimidazolium salts: Synthesis, characterization, bioactivity, and molecular docking studies. J. Mol. Struct. 2020, 1207, 127802. [Google Scholar] [CrossRef]
- Peng, Z.; Yu, L. Second-order nonlinear optical polyimide with high-temperature stability. Macromolecules 1994, 27, 2638–2640. [Google Scholar] [CrossRef]
- Khan, H.A.; Irfan, M.; Khan, S.G.; Bibi, S.; Ali, A.; Shafiq, I.; Alhokbany, N.; Haroon, M.; Gondal, H.Y. Facile synthesis, spectroscopic, electronic and non-linear optical properties of 1, 2–4 triazole-based derivatives: An experimental and DFT approach. J. Mol. Struct. 2025, 1322, 140576. [Google Scholar] [CrossRef]
- Tsutsumi, N.; Morishima, M.; Sakai, W. Nonlinear optical (NLO) polymers. 3. NLO polyimide with dipole moments aligned transverse to the imide linkage. Macromolecules 1998, 31, 7764–7769. [Google Scholar] [CrossRef]
- Hussein, H.A.; Fadhil, G.F. Theoretical investigation of para amino-dichloro chalcone isomers. Part II: A DFT structure–stability study of the FMO and NLO properties. ACS Omega 2023, 8, 4937–4953. [Google Scholar] [CrossRef]
- Politzer, P.; Jin, P.; Murray, J.S. Atomic polarizability, volume and ionization energy. J. Chem. Phys. 2002, 117, 8197–8202. [Google Scholar] [CrossRef]
- Khalid, M.; Ali, A.; Asim, S.; Tahir, M.N.; Khan, M.U.; Vieira, L.C.C.; de la Torre, A.F.; Usman, M. Persistent prevalence of supramolecular architectures of novel ultrasonically synthesized hydrazones due to hydrogen bonding [X–H···O; X = N]: Experimental and density functional theory analyses. J. Phys. Chem. Solids 2021, 148, 109679. [Google Scholar] [CrossRef]
- Al-Abdullah, E.S.; Mary, Y.S.; Panicker, C.Y.; El-Brollosy, N.R.; El-Emam, A.A.; Van Alsenoy, C.; Al-Saadi, A.A. Theoretical investigations on the molecular structure, vibrational spectra, HOMO–LUMO analyses and NBO study of 1-[(Cyclopropylmethoxy) methyl]-5-ethyl-6-(4-methylbenzyl)-1,2,3,4-tetrahydropyrimidine-2,4-dione. Spectrochim. Acta Part A Mol. Biomol. Spectrosc. 2014, 133, 639–650. [Google Scholar] [CrossRef] [PubMed]
- Ashfaq, M.; Bogdanov, G.; Glebov, V.; Ali, A.; Tahir, M.N.; Abdullah, S. Single crystal investigation, Hirshfeld surface analysis and DFT exploration of the pyrimethamine-based novel organic salt: 2, 4-diamino-5-(4-chlorophenyl)-6-ethylpyrimidin-1-ium 3-carboxybenzoate hydrate (1:1:1). J. Mol. Struct. 2021, 1224, 129309. [Google Scholar] [CrossRef]
- Aslam, S.; Haroon, M.; Akhtar, T.; Arshad, M.; Khalid, M.; Shafiq, Z.; Imran, M.; Ullah, A. Synthesis, Characterization, and DFT-Based Electronic and Nonlinear Optical Properties of Methyl 1-(arylsulfonyl)-2-aryl-1H-benzo [d] imidazole-6-carboxylates. ACS Omega 2022, 7, 31036–31046. [Google Scholar] [CrossRef]
- Iorhuna, F.; Nyijime, A.; Ayuba, A. 2-Phenylpiperazine, N,N′-di-TFA as a corrosion inhibitor: A computational comparative study on the Aluminium and Zinc surface. Moroc. J. Chem. 2023, 11, 884–896. [Google Scholar]
- Evecen, M.; Ersanlı, C.C.; Doğan, O.E.; Bozkurt, İ.; Ağar, E. Synthesis and analysis (thermodynamic, electronic, NLO, FMO, NBO, MEP, IR, UV properties, Hirshfeld surface analysis and molecular docking) of the novel Schiff base molecule:(Z)-4-bromo-2-((2,4-dimethoxypheny) limino) methyl)-5-fluorophenol. J. Mol. Struct. 2025, 1329, 141454. [Google Scholar] [CrossRef]
- Adindu, E.A.; Godfrey, O.C.; Agwupuye, E.I.; Ekpong, B.O.; Agurokpon, D.C.; Ogbodo, S.E.; Benjamin, I.; Louis, H. Structural analysis, reactivity descriptors (HOMO-LUMO, ELF, NBO), effect of polar (DMSO, EtOH, H2O) solvation, and libido-enhancing potential of resveratrol by molecular docking. Chem. Phys. Impact 2023, 7, 100296. [Google Scholar] [CrossRef]
- Sandoval-Yañez, C.; Martínez-Araya, J.I. Assessment of a set of twelve density functionals to estimate the global reactivity of myricetin through the Koopmans’ theorem. Chem. Phys. Lett. 2019, 715, 354–359. [Google Scholar] [CrossRef]
- Fukui, K. Role of frontier orbitals in chemical reactions. Science 1982, 218, 747–754. [Google Scholar] [CrossRef]
- Parr, R.G.; Donnelly, R.A.; Levy, M.; Palke, W.E. Electronegativity: The density functional viewpoint. J. Chem. Phys. 1978, 68, 3801–3807. [Google Scholar] [CrossRef]
- Tandon, H.; Chakraborty, T.; Suhag, V. A fundamental approach to compute atomic electrophilicity index. J. Math. Chem. 2020, 58, 2188–2196. [Google Scholar] [CrossRef]
- Rajalakshmi, K.; Vetrivel, M. NBO and topology (MESP, ELF, LOL) analysis of 2-hydroxypropanamide. Int. J. 2020, 5, 50–58. [Google Scholar]
- Jacobsen, H. Localized-orbital locator (LOL) profiles of chemical bonding. Can. J. Chem. 2008, 86, 695–702. [Google Scholar] [CrossRef]
- Arulaabaranam, K.; Muthu, S.; Mani, G.; Geoffrey, A.B. Speculative assessment, molecular composition, PDOS, topology exploration (ELF, LOL, RDG), ligand-protein interactions, on 5-bromo-3-nitropyridine-2-carbonitrile. Heliyon 2021, 7, e07061. [Google Scholar] [CrossRef]
- Prabakaran, M.; Prasana, J.C. Molecular docking studies, natural bond orbital, charge transfer excitation, NLO, ELF, LOL, and drug-likeness analysis on Cefixime: A potential anti-bacterial effective. Sci. Acad. 2021, 2, 50–67. [Google Scholar]
- Tariq, S.; Raza, A.R.; Khalid, M.; Rubab, S.L.; Khan, M.U.; Ali, A.; Tahir, M.N.; Braga, A.A.C. Synthesis and structural analysis of novel indole derivatives by XRD, spectroscopic and DFT studies. J. Mol. Struct. 2020, 1203, 127438. [Google Scholar] [CrossRef]
- Frisch, M.; Trucks, G.; Schlegel, H.; Scuseria, G.; Robb, M.; Cheeseman, J.; Scalmani, G.; Barone, V.; Mennucci, B.; Petersson, G. Uranyl extraction by N, N-dialkylamide ligands studied by static and dynamic DFT simulations. Gaussian 09 2009, 9, 227. [Google Scholar]
- Becke, A.D. Density-functional thermochemistry. III. The role of exact exchange. J. Chem. Phys. 1993, 98, 5648–5652. [Google Scholar] [CrossRef]
- Hanwell, M.D.; Curtis, D.E.; Lonie, D.C.; Vandermeersch, T.; Zurek, E.; Hutchison, G.R. Avogadro: An advanced semantic chemical editor, visualization, and analysis platform. J. Cheminform. 2012, 4, 17. [Google Scholar] [CrossRef]
- Dennington, R.; Keith, T.A.; Millam, J.M. GaussView, Version 6.0.16; Semichem Inc.: Shawnee Mission, KS, USA, 2016; Volume 13. [Google Scholar]
- Zhurko, G.; Zhurko, D. ChemCraft, Version 1.6. 2009. Available online: https://www.chemcraftprog.com/ (accessed on 22 May 2025).
- O’boyle, N.M.; Tenderholt, A.L.; Langner, K.M. Cclib: A library for package-independent computational chemistry algorithms. J. Comput. Chem. 2008, 29, 839–845. [Google Scholar] [CrossRef]
- Glendening, E.; Reed, A.; Carpenter, J.; Weinhold, F. NBO, Version 3.1; Gaussian Inc.: Pittsburgh, PA, USA, 2003. [Google Scholar]
- Tahir, M.N.; Ashfaq, M.; Munawar, K.S.; Khan, A.U.; Asghar, M.A.; Ahamad, T.; Ojha, S.C. Synthesis, Characterizations, Hirshfeld Surface Analysis, DFT, and NLO Study of a Schiff Base Derived from Trifluoromethyl Amine. ACS Omega 2024, 9, 2325–2338. [Google Scholar] [CrossRef] [PubMed]


| Compound | Atom | Bond Length | Atom | Bond Angle |
|---|---|---|---|---|
| 5a | O1-H 23 | 0.97322 | O1-C2-C3 | 114.84476 |
| C2-C3 | 1.53016 | O5-C3-N4 | 121.28740 | |
| N4-C6 | 1.51176 | N4-C6-C12 | 116.23986 | |
| C3-O5 | 1.26424 | C11-C6-C12 | 115.16739 | |
| N4-C7 | 1.55457 | N4-C7-C9 | 108.79735 | |
| C7-C8 | 1.54649 | C8-C7-C10 | 106.27711 | |
| C7-C9 | 1.54430 | C12-C6-C11 | 115.16739 | |
| C7-C10 | 1.54908 | C6-C12-S13 | 111.31957 | |
| C6-C11 | 1.54840 | O15-C11-N14 | 118.96980 | |
| C6-C12 | 1.54088 | N14-C16-C17 | 111.97091 | |
| C12-S13 | 1.91628 | O19-C17-N18 | 120.84854 | |
| S13-H38 | 1.38443 | C16-C17-O19 | 119.98662 | |
| C11-N14 | 1.36757 | N18-C20-C21 | 113.68073 | |
| N14-C16 | 1.46795 | C20-C21-C22 | 79.65692 | |
| C16-C17 | 1.52419 | |||
| C17-N18 | 1.37023 | |||
| C17-O19 | 1.25060 | |||
| C20-N18 | 1.47247 | |||
| C20-C21 | 1.46846 | |||
| C≡C | 1.20534 | |||
| 5b | C2-O1 | 1.46497 | O1-C2-C3 | 113.81273 |
| C2-C3 | 1.53354 | C2-C3=O5 | 115.73547 | |
| C3=O5 | 1.25559 | C3-N4-C6 | 116.86348 | |
| C3-N4 | 1.38583 | C9-C6-C7 | 111.08996 | |
| N4-C6 | 1.55094 | C7-C6-C8 | 107.07582 | |
| C6-C7 | 1.54816 | N4-C10-C11 | 113.67713 | |
| C6-C8 | 1.54261 | C17-C10-C11 | 110.50794 | |
| C6-C9 | 1.54620 | N12-C11-O13 | 120.03093 | |
| N4-C10 | 1.48668 | C10-C11-O13 | 123.41579 | |
| C10-C17 | 1.54189 | N12-C14-C15 | 110.39825 | |
| C17-S18 | 1.90430 | C14-C15≡C16 | 179.54141 | |
| C10-C11 | 1.54391 | |||
| C11=O13 | 1.25166 | |||
| C11-N12 | 1.36754 | |||
| N12-C14 | 1.48111 | |||
| C14-C15 | 1.46107 | |||
| C15≡C16 | 1.20451 | |||
| 5c | O1-C2 | 1.44950 | O1-C2-C3 | 114.62658 |
| C2-C3 | 1.52048 | N4-C3=O5 | 123.33369 | |
| C3-N4 | 1.36474 | N4-C7-C8 | 112.71823 | |
| C3=O5 | 1.25019 | C7-C8≡C9 | 178.04819 | |
| N4-C7 | 1.48093 | C6-C11-S12 | 113.90251 | |
| C7-C8 | 1.46278 | C6-C10=O14 | 120.80279 | |
| C8≡C9 | 1.19999 | C10-N13-C15 | 127.69179 | |
| N4-C6 | 1.46823 | C15-C16=O | 26.38630 | |
| C6-C11 | 1.53056 | C16-N17-C19 | 127.50822 | |
| C11-S12 | 1.87599 | C20-C21-C22 (aromatic) | 119.16245 | |
| C6-C10 | 1.53671 | C22-C23-C24 | 118.39558 | |
| C10=O14 | 1.24338 | C24-C25-C20 | 120.46519 | |
| C10-N13 | 1.35697 | |||
| C15-C16 | 1.52011 | |||
| C16=O18 | 1.24377 | |||
| C16-N17 | 1.35700 | |||
| C19-C20 | 1.51215 | |||
| C20-C21 (aromatic) | 1.39666 | |||
| C21-C22 (aromatic) | 1.38192 | |||
| C22-C23 (aromatic) | 1.38493 | |||
| C23-24 (aromatic) | 1.38993 | |||
| C24-C25 (aromatic) | 1.39155 | |||
| C22-Cl 26 | 1.81146 | |||
| 5d | O1-C2 | 1.45474 | O1-C2-C3 | 110.83283 |
| C1-C3 | 1.52295 | N4-C3=O5 | 122.42407 | |
| C3=O5 | 1.24939 | N4-C7-C8 | 112.32576 | |
| C3-N4 | 1.38758 | C7-C8≡C9 | 178.01041 | |
| N4-C7 | 1.48327 | N4-C6-C10 | 107.16812 | |
| N4-C6 | 1.46905 | N13-C10=O14 | 117.85144 | |
| C7-C8 | 1.46642 | C6-C11-S12 | 113.71090 | |
| C8≡C9 | 1.20562 | N13-C15-C16 | 109.69455 | |
| C6-C11 | 1.53943 | C17-C15-C18 | 108.36323 | |
| C6-C10 | 1.55903 | C16-C15-C18 | 109.18518 | |
| C10-O14 | 1.26112 | |||
| C10-N13 | 1.36658 | |||
| N13-C15 | 1.50181 | |||
| C15-C16 | 1.54438 | |||
| C15-C17 | 1.53888 | |||
| C15-C18 | 1.54742 |
| Compound | Donor | Types | Acceptor | Types | E(2) kjmol−1 | E(j)E(i)(a.u) | F(i.j)(a.u) |
|---|---|---|---|---|---|---|---|
| 5c | C11-H35 | Σ | N4-C6 | σ* | 5.72 | 0.82 | 0.061 |
| C15-C16 | Σ | C15-H39 | σ* | 0.51 | 1.03 | 0.053 | |
| C21-C22 | Π | C20-C251 | π* | 8.74 | 0.3 | 0.067 | |
| C21-C22 | Π | C23-C242 | π* | 0.08 | 0.3 | 0.069 | |
| C20-C25 | Π | N17-C19 | σ* | 4.77 | 0.6 | 0.052 | |
| C8-C9 | Π | C7-H32 | σ* | 1.09 | 0.66 | 0.024 | |
| C7-H31 | Σ | C8-C9 | π* | 4.72 | 0.59 | 0.047 | |
| N13-C15 | Σ | C10-O14 | π* | 0.8 | 0.79 | 0.024 | |
| O5 | LP(2) | C2-C31 | σ* | 8.8 | 0.59 | 0.095 | |
| O1 | LP(2) | C2-C3 | σ* | 7.96 | 0.66 | 0.065 | |
| C26 | LP(2) | C23-C24 | σ* | 0.5 | 0.87 | 0.019 | |
| N13 | LP(1) | C10-O144 | π* | 9.53 | 0.29 | 0.108 | |
| N17 | LP(1) | C16-O186 | π* | 8.66 | 0.26 | 0.119 | |
| N4 | LP(1) | C8-C9 | π* | 1.16 | 0.32 | 0.019 |
| Parameters | 5a (a.s.u) | 5b (a.s.u) | 5c (a.s.u) | 5d (a.s.u) |
|---|---|---|---|---|
| µx | −4.92 × 10⁻³⁰ | 8.03 × 10⁻³⁰ | −1.71 × 10⁻²⁹ | 1.76 × 10⁻²⁹ |
| µy | 2.59 × 10⁻³⁰ | −4.31 × 10⁻³¹ | 9.67 × 10⁻³⁰ | 4.66 × 10⁻³⁰ |
| µz | −3.36 × 10⁻³⁰ | −2.24 × 10⁻³⁰ | 1.06 × 10⁻²⁹ | 1.14 × 10⁻²⁹ |
| µtotal | 6.47 × 10⁻³⁰ | 8.29 × 10⁻³⁰ | 2.23 × 10⁻²⁹ | 2.15 × 10⁻²⁹ |
| αxx | 2.03 × 10⁻²⁷ | 1.77 × 10⁻²⁷ | 2.48 × 10⁻²⁷ | 1.52 × 10⁻²⁷ |
| αxy | 8.33 × 10⁻²⁹ | 4.81 × 10⁻²⁹ | −2.38 × 10⁻²⁸ | 1.25 × 10⁻²⁹ |
| αyy | 1.68 × 10⁻²⁷ | 1.24 × 10⁻²⁷ | 1.76 × 10⁻²⁷ | 1.45 × 10⁻²⁷ |
| αxz | −1.15 × 10⁻²⁸ | −3.94 × 10⁻²⁹ | −1.31 × 10⁻²⁸ | 4.95 × 10⁻²⁹ |
| αyz | 5.21 × 10⁻²⁹ | 6.25 × 10⁻²⁹ | −5.24 × 10⁻²⁹ | 9.09 × 10⁻²⁹ |
| αzz | 1.35 × 10⁻²⁷ | 1.25 × 10⁻²⁷ | 1.82 × 10⁻²⁷ | 1.27 × 10⁻²⁷ |
| αmean | 1.68 × 10⁻²⁷ | 1.42 × 10⁻²⁷ | 2.02 × 10⁻²⁷ | 1.41 × 10⁻²⁷ |
| Δα | 2.50 × 10⁻²⁸ | 2.11 × 10⁻²⁸ | 2.99 × 10⁻²⁸ | 2.10 × 10⁻²⁸ |
| βxxx | 2.70 × 10⁻²⁹ | −5.30 × 10⁻²⁸ | 1.24 × 10⁻²⁷ | −4.50 × 10⁻²⁸ |
| βxxy | −3.47 × 10⁻²⁸ | −4.04 × 10⁻²⁸ | −1.35 × 10⁻²⁸ | −3.82 × 10⁻²⁸ |
| βxyy | −2.76 × 10⁻²⁸ | −2.01 × 10⁻²⁸ | 6.38 × 10⁻²⁸ | −7.96 × 10⁻²⁸ |
| βyyy | −1.67 × 10⁻²⁷ | −9.89 × 10⁻²⁸ | −1.56 × 10⁻²⁸ | −8.59 × 10⁻²⁸ |
| βxxz | −6.36 × 10⁻²⁸ | 9.81 × 10⁻²⁸ | −5.73 × 10⁻²⁸ | 8.47 × 10⁻²⁸ |
| Βxyz | −2.93 × 10⁻²⁹ | −2.65 × 10⁻²⁸ | 2.70 × 10⁻²⁸ | 1.56 × 10⁻²⁸ |
| βyyz | 4.04 × 10⁻²⁸ | −5.18 × 10⁻²⁸ | −6.52 × 10⁻²⁸ | 1.25 × 10⁻²⁸ |
| βxzz | 6.31 × 10⁻²⁸ | 6.81 × 10⁻²⁸ | 1.30 × 10⁻²⁸ | 6.65 × 10⁻³⁰ |
| βyzz | 4.55 × 10⁻²⁸ | 2.04 × 10⁻²⁸ | 1.18 × 10⁻²⁸ | −3.44 × 10⁻²⁸ |
| βzzz | 5.39 × 10⁻²⁸ | 7.22 × 10⁻²⁸ | −1.76 × 10⁻²⁷ | −4.28 × 10⁻²⁸ |
| βtotal | 1.63 × 10⁻²⁷ | 1.21 × 10⁻²⁷ | 3.02 × 10⁻²⁷ | 2.08 × 10⁻²⁷ |
| Comp | HOMO (eV) | LUMO (eV) | HOMO-LUMO (eV) | I | A | X | η | µ | Ω | σ |
|---|---|---|---|---|---|---|---|---|---|---|
| 5a | −6.649 | −1.227 | 5.42 | 6.65 | 1.23 | 3.94 | 2.71 | −3.94 | 2.86 | 0.18 |
| 5b | −6.809 | −0.719 | 6.09 | 6.81 | 0.72 | 3.76 | 3.04 | −3.76 | 2.33 | 0.16 |
| 5c | −6.484 | −1.404 | 5.08 | 6.48 | 1.40 | 3.94 | 2.54 | −3.94 | 3.06 | 0.20 |
| 5d | −6.544 | −0.595 | 5.95 | 6.54 | 0.60 | 3.57 | 2.97 | −3.57 | 2.14 | 0.17 |
| Compound | Energy (cm−1) | Wavelength (nm) (Cal) | Wavelength (nm) (Exp) | Oscillator Strength | Major Contributions |
|---|---|---|---|---|---|
| 5a | 39,069.76 | 255 | 278 | 0.0003 | H2-LUMO (45%), H1-LUMO (37%) |
| 5b | 38,851.18 | 257 | 296 | 0.0006 | H1-L+1 (63%), H-L+1 (12%) |
| 5c | 43,013.04 | 232 | 238 | 0.0002 | HOMO-LUMO (86%) |
| 5d | 41,004.71 | 243 | 248 | 0.0022 | HOMO-LUMO (81%) |
Disclaimer/Publisher’s Note: The statements, opinions and data contained in all publications are solely those of the individual author(s) and contributor(s) and not of MDPI and/or the editor(s). MDPI and/or the editor(s) disclaim responsibility for any injury to people or property resulting from any ideas, methods, instructions or products referred to in the content. |
© 2025 by the authors. Licensee MDPI, Basel, Switzerland. This article is an open access article distributed under the terms and conditions of the Creative Commons Attribution (CC BY) license (https://creativecommons.org/licenses/by/4.0/).
Share and Cite
Shaheen, M.; Ali, A. One-Pot Approach Towards Peptoids Synthesis Using 1,4-Dithiane-2,5-Diol via Multicomponent Approach and DFT-Based Computational Analysis. Molecules 2025, 30, 2340. https://doi.org/10.3390/molecules30112340
Shaheen M, Ali A. One-Pot Approach Towards Peptoids Synthesis Using 1,4-Dithiane-2,5-Diol via Multicomponent Approach and DFT-Based Computational Analysis. Molecules. 2025; 30(11):2340. https://doi.org/10.3390/molecules30112340
Chicago/Turabian StyleShaheen, Musrat, and Akbar Ali. 2025. "One-Pot Approach Towards Peptoids Synthesis Using 1,4-Dithiane-2,5-Diol via Multicomponent Approach and DFT-Based Computational Analysis" Molecules 30, no. 11: 2340. https://doi.org/10.3390/molecules30112340
APA StyleShaheen, M., & Ali, A. (2025). One-Pot Approach Towards Peptoids Synthesis Using 1,4-Dithiane-2,5-Diol via Multicomponent Approach and DFT-Based Computational Analysis. Molecules, 30(11), 2340. https://doi.org/10.3390/molecules30112340