Abstract
The simultaneous adsorption and removal of low concentrations of SO2 and H2S using experimental and simulation methods were investigated in this paper. The adsorption breakthrough performance of the single-component SO2 or H2S was determined in the activated carbon fixed-bed test. Langmuir and extended Langmuir equations in the Aspen adsorption module were used to describe the adsorption equilibrium of the single and bi-component SO2 and H2S system, respectively. The effects of gas hourly space velocity (GHSV) and temperature on the dynamic adsorption process of the bi-component SO2/H2S system were investigated. The concentration distribution and adsorption capacity of SO2/H2S in the bed were simulated. The results showed that the simulation for the single-component breakthrough curves of SO2 or H2S agreed well with the experimental data. It indicated that the model and simulation yielded engineering acceptable accuracy. For the bi-component adsorption, the competitive adsorption effect was observed, with H2S as the weakly adsorbed component and SO2 as the strongly adsorbed component. The dynamic adsorption process showed the sequence of initial adsorption, breakthrough, replacement, and equilibrium. The breakthrough curves were characterized by the distinct hump (roll-up) for H2S, resulting from the replacement effect. The influence of GHSV and the temperature on the dynamic adsorption process were investigated, revealing that the lower velocity and temperature enhanced the adsorption. This work might be used for the design and optimization of adsorption bed for the simultaneous removal of SO2 and H2S in Claus tail gas.
1. Introduction
The Claus tail gas [1] typically contains low concentrations of SO2 (0.15–1.09%) and H2S (0.3–2.21%). It may exceed atmospheric emission standards and require additional removal treatment processes.
Currently, SCOT [2] and CANSOLV [3] processes are widely used for Claus tail gas treatment. However, these methods involve multiple complex steps, including reduction and oxidation reactions, rapid cooling, absorption, desorption, and incineration. It may increase the costs of energy consumption and operational costs. Schmidt [4] proposed an adsorption desulphurization process to replace the above processes of SCOT or CANSOLV, which effectively simplified the desulphurization process, improved the desulphurization accuracy, and reduced costs and energy consumption. The adsorption approach has drawn increasing attention regarding gas purification.
Previous research on the adsorption approach have focused on the removal of single-component SO2 [5,6,7,8,9,10,11,12,13] or H2S [14,15,16,17,18,19] individually, with limited studies addressing the simultaneous adsorption of bi-component gas [20,21]. The performance of activated carbon adsorbent ACS-1 for the Claus exhaust gas treatment was tested [22]. It demonstrated positive desulfurization efficiency for both H2S and SO2. The activated carbon adsorbent TL-1 [23] was tested to study the simultaneous adsorption of H2S and SO2 with the presence of CO2. The Cu–Ce–O modified activated carbon was tested to remove the 70 ppm H2S in blast furnace gas [24]. The adsorbed breakthrough time of H2S was extended if SO2 or O2 was included in the gas mixture and the introduction of SO2 could improve the adsorption of H2S on the modified activated carbon adsorbents. The simultaneous removal of H2S and SO2 not only enhanced the adsorbent utilization and the adsorption efficiency but also reduced the operational costs, highlighting its potential for industrial applications.
Analytical simulations were frequently used to evaluate the desulfurization capacity of various adsorbents. Mathematical models were used to predict breakthrough curves and kinetic models. For the 50 ppm SO2 adsorption over the palm kernel shell-activated carbon and xerogel adsorbent, the mathematical models, like Thomas, Yoon–Nelson, and Adam–Bohart models, were analyzed by curve fitting to determine the parameters. For the 70 ppm H2S adsorption over the modified activated carbon in the multicomponent blast furnace gas, five adsorption kinetics models were analyzed, while the Bangham model, including the pore diffusion effect, was selected for the best curve fitting to test data [24]. The over simplified mathematical models might result in several critical flaws, which were reported in the adsorption analysis of contaminated water [25]. Numerical methods, like the one-dimensional mass transfer balance determined by the partial differential equations, were frequently adopted with explicit input parameters. SO2 adsorption over the pistachio-nut-shell-activated carbon was simulated following the Langmuir isotherm model and the linear driving force kinetics model [11]. H2S physical adsorption in the fixed bed was simulated in COMSOL 5.4 software following the mass and energy balances [26]. For the multicomponent adsorption, several simulations reported the competitive adsorption phenomenon. The adsorption of SO2 and CO2 over the 41-S activated carbon adsorbent was simulated following the Langmuir and Ideal Adsorbed Solution Theory (IAST). The hump of the CO2 breakthrough curve, and the replacement of SO2 over CO2 predicted by the simulation were verified by test results [27]. The latest computational and experimental results showed the hump and selective adsorption in the CO2 and CH4 mixture [28]. Previous research provided fundamental knowledge and guided the adsorption simulation in this paper. However, little simulated research involving the bi-component simultaneous adsorption of SO2 and H2S were available, while further numerical studies were required.
In this study, the adsorption and breakthrough characteristics of SO2 and H2S over activated carbon fixed bed were investigated using a combination of experimental and simulated methods. The Langmuir and extended Langmuir equations in the Aspen adsorption module were applied to describe the adsorption equilibrium process of a single and bi-component SO2/H2S system, respectively, and compared with the experimental results. Furthermore, the effects of GHSV and temperature on dynamic adsorption characteristics of bi-component SO2 and H2S were investigated. The concentration distribution and adsorption capacity of SO2 and H2S within the activated carbon fixed bed were also examined. This work provides insights for the design and optimization of the adsorption bed for the simultaneous removal of SO2 and H2S in Claus tail gas, especially the increasing restrictions of the global air pollutant emission standards worldwide.
2. Experiments and Simulation
2.1. Experimental
The adsorption bed (15 mm × 75 mm), packed with the activated carbon, was heated to the desired temperature using an electric heater (Shanghai Aore Electric Co., Ltd., Shanghai, China). N2 gas containing 1% SO2 or 2% H2S was introduced at controlled flow rates for the dynamic adsorption and desulfurization experiments. The sulfur content in the exhaust gas was continuously monitored at the bed outlet using the analytical instrument. When the sulfur concentration exceeded the breakthrough point, the experiment was terminated. The breakthrough point defined for SO2 was 100 ppm, and for H2S, it was 10 ppm in the experiment. It was close to the allowable emission levels which were 100 mg/m3 for SO2 and 10 mg/m3 for H2S, following the national air pollutant emission standards of China, like GB 31570-2015 [29] and GBZ 2.1-2019 [30]. The exhaust gas was then passed through the alkali tank for the final treatment. The schematic diagram of the adsorption desulfurization process is illustrated in Figure 1.
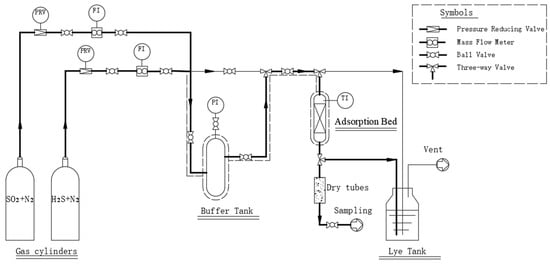
Figure 1.
Schematic diagram of the simultaneous adsorption and removal of low concentrations of SO2 and H2S.
The bulk density of activated carbon was 450 kg/m3. The concentrations of H2S or SO2 in the desulfurized tail gas were measured by PGD3-IR gas analyzer from SSC (London, UK). The BET surface area of activated carbon was 1854 m2/g with the total pore volume of 0.97 cm3/g, including the micropore volume of 0.90 cm3/g, and the average pore diameter of 2.10 nm.
The dynamic adsorption experiments of SO2 or H2S were carried out under the adsorption conditions of 1% SO2 or 2% H2S, a GHSV of 173.32~866.58 1/h, and a temperature of 30 °C~155 °C.
2.2. Simulations
The single-component adsorption process of low-concentration SO2 or H2S over activated carbon was simulated by Aspen adsorption V11 [31]. The Langmuir adsorption isotherm equation was applied to model the adsorption bed, with the parameters of the adsorption bed (the diameter was 15 mm and the height was 75 mm) and the adsorbent being consistent with the experimental setup. The simulated breakthrough curves were compared with the experimental data to validate the isotherm model and its parameters.
For the bi-component adsorption, the simulation was conducted using the Extended-Langmuir isotherm model. The influences of GHSV and temperature on the breakthrough time of SO2 and H2S were analyzed to optimize the simultaneous and efficient removal ratio.
Aspen Adsorption simulation workflow was as follows. (1) Component Definition: specifying all the chemical components in Aspen Plus. (2) Model Transfer: importing component definitions to Aspen Adsorption environment. (3) Adsorption Bed Modeling: building adsorption bed modeling, the feed stream, and the product stream. (4) Parameters Input: inputting the parameters of the adsorption bed, the feed stream, and the product stream. (5) Solver Configuration, (6) Simulation Initialization, and (7) Execution and Analysis.
2.2.1. Model Selection
The one-dimensional mass balance equation [9] for the fixed-bed adsorption is given in Equation (1).
The mass transfer due to the axial dispersion effect was usually ignored [10], as shown in Equation (2).
The gas to solid surface mass transfer rate was determined by the Linear Driving Force (LDF) model, as shown in Equation (3).
Considering Equations (2) and (3), the mass balance Equation (1) could be expressed as Equation (4).
According to the Langmuir isotherm model in Aspen Adsorption, q* could be determined by Equation (5).
For the extended Langmuir isotherm model used in the bi-component adsorption, the parameters were determined by Equations (6) and (7). Where, the subscripts i and j represented the two components, respectively.
In Aspen Adsorption, the partial differential Equation (4) was solved using the Upwind Differencing Scheme (UDS1), as shown in Equation (8).
The fluid velocity along the axial direction of the fixed bed was constant. The pressure drop along the axial direction of the adsorption bed was included using the Ergun equation to maintain the momentum balance. Since the diameter of the fixed bed was small and the adsorption was moderate, the temperature was assumed to be constant.
2.2.2. Parameters for Simulation Calculations
The Langmuir isotherm parameters for SO2 and H2S adsorption on activated carbon at different temperatures were listed in Table 1. The adsorption process parameters were presented in Table 2.

Table 1.
Langmuir isothermal model parameters for SO2 [11] and H2S [32] at different temperatures.

Table 2.
Adsorption process parameters of activated carbon fixed bed.
3. Results and Discussion
3.1. Comparison of Single-Component Adsorption Experiments and Simulation
3.1.1. SO2 Adsorption
The experimental and simulation results for SO2 adsorption on activated carbon at different GHSV and temperatures were compared in Figure 2 and Figure 3. The breakthrough time was summarized in Table 3 and Table 4. The horizontal axis represented the time. The vertical axis represented the gas volumetric concentration.
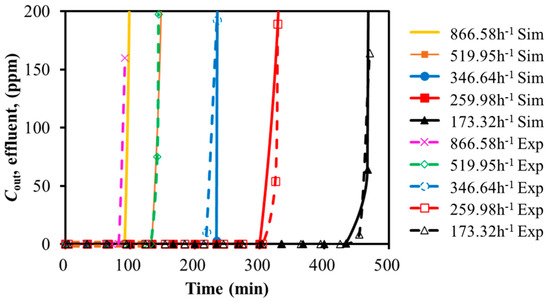
Figure 2.
Calibration of breakthrough curves for SO2 with GHSV variation (30 °C).
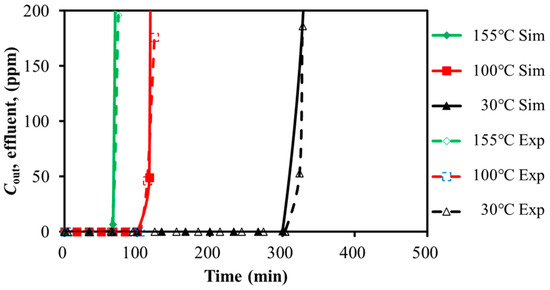
Figure 3.
Calibration of breakthrough curves for SO2 with temperature variation (259.98 h−1).

Table 3.
Breakthrough time for SO2 with GHSV variation (30 °C).

Table 4.
Breakthrough time for SO2 with temperature variation (259.98 h−1).
As shown in Figure 2, increasing the feed GHSV reduced the fluid residence time, leading to a shorter breakthrough time and lower adsorption efficiency. Similarly, Figure 3 demonstrated that the higher adsorption bed temperatures led to earlier breakthrough time. The experimental and simulated breakthrough time, as summarized in Table 3 and Table 4, showed acceptable approximation with the relative deviation of less than 6% and 3%. It might be acceptable within the scope of the engineering design. It seemed that the simulation was capable of representing the SO2 single-component adsorption system.
3.1.2. H2S Adsorption
The experimental and simulation results for H2S adsorption on activated carbon by varying the feed GHSV and temperatures are presented in Figure 4 and Figure 5. The breakthrough times are compared in Table 5 and Table 6.
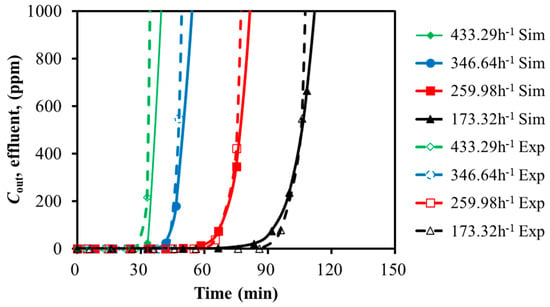
Figure 4.
Calibration of breakthrough curves for H2S with GHSV variation (30 °C).
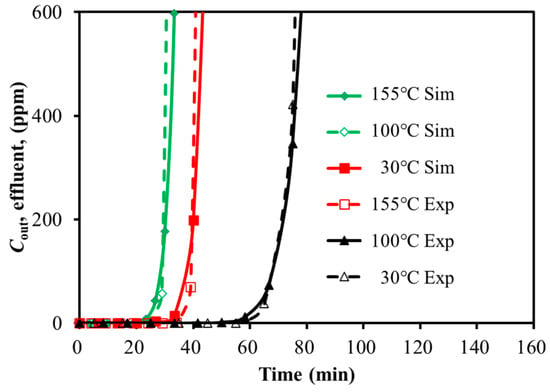
Figure 5.
Calibration of breakthrough curves for H2S with temperature variation (259.98 h−1).

Table 5.
Breakthrough time for H2S with GHSV variation (30 °C).

Table 6.
Breakthrough time for H2S with temperature variation (259.98 h−1).
With the feed gas GHSV decreased by 50%, the breakthrough time was extended by 116.3% and 97.5% for H2S and SO2, respectively. With the temperature decreased by 80%, the breakthrough time was extended by 112.9% and 334.5% for H2S and SO2, respectively. It seemed that the low temperature and the slow GHSV were favorable for the adsorption. For the case of 30 °C, the breakthrough time of SO2 was five times of H2S, even though the feed concentration of H2S was twice that of SO2. SO2 showed stronger adsorption capacity over the activated carbon. It was efficient to adsorb SO2 with restricted temperature. However, the distinct adsorption capacity of H2S and SO2 over activated carbon might increase the difficulty of the simultaneous removal of the mixture. The adsorption performance of the mixture will be analyzed in the next section.
The predicted breakthrough times of H2S and SO2 were close to the test data with an acceptable error of less than 6.4%. It seemed that the simulation with the Langmuir isotherm model was able to approximate the adsorption of H2S and SO2 over activated carbon.
With the adsorption temperature increased from 30 °C to 155 °C, the error of simulation increased from 1.5% to 6.4% for H2S, and it increased from 0.9% to 5.4% for SO2. It seemed that the constant temperature assumption might result in larger prediction deviation. The same trend existed with the increased feed GHSV.
3.2. Simulation Calculation of Bi-Component Adsorption
3.2.1. Effects of GHSV and Temperature on Dynamic Adsorption Characteristics
Using the parameters validated by the single-component adsorption simulation, the bi-component adsorption was modeled using the Extended-Langmuir isotherm model, as shown in Equations (6) and (7). The adsorption bed structure and adsorbent characteristics remained unchanged. The effects of GHSV and temperature on the bi-component adsorption breakthrough curves were also investigated. The breakthrough time for the bi-component adsorption was defined as the time when any component first reached its breakthrough concentration.
GHSV
Under the conditions of the adsorption temperature of 30 °C, a total pressure of 101 kPa, and the inlet gas concentrations of 2% H2S and 1% SO2, the breakthrough curves for the bi-component SO2 and H2S adsorption on the activated carbon were simulated with the feed GHSV variation. The results are presented in Figure 6 and Table 7.
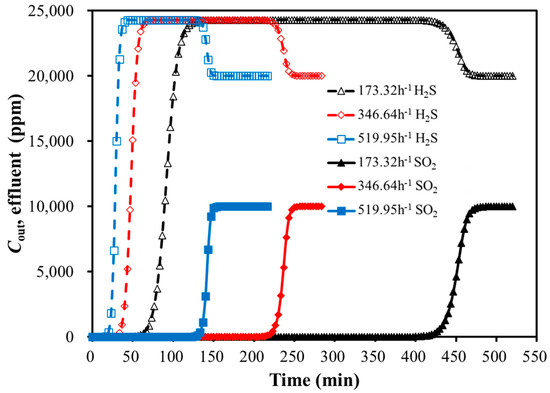
Figure 6.
Breakthrough curves of bi-component adsorption with GHSV variation (30 °C).

Table 7.
Breakthrough time for bi-component SO2 and H2S adsorption with GHSV variation (30 °C).
As shown in Figure 6 and Table 7, the weakly adsorbed component H2S reached its adsorption saturation first during the bi-component adsorption of SO2 and H2S. It was followed by the characteristic hump in the breakthrough curve. This indicated that the competitive adsorption process might exist between SO2 and H2S. The strongly adsorbed component (SO2) was probably able to replace the weakly adsorbed component (H2S). With the development of the replacement, the two components reached the adsorption equilibrium. As a result, the concentrations at the bed outlet matched those at the inlet.
Aspen Adsorption simulated the replacement mechanism at the macro level, and the replacement mechanism was related to the characteristics of the adsorbent. SO2 on the adsorbent surface was adsorbed through van der Waals forces between its molecules and the π-electron layer of the adsorbent. The heat of the sublimation of SO2 (32.32 kJ/mol) was higher than that of H2S (23.01 kJ/ mol), meaning H2S had weaker adsorption on the adsorbent surface compared to SO2 [24]. Additionally, SO2 had greater polarity, leading to its preferential replacement of H2S.
For the bi-component SO2 and H2S adsorption, the higher GHSV resulted in a shorter breakthrough time. While the GHSV did not significantly affect the peak height of the H2S hump, it extended the duration of the hump. The impact of GHSV on the SO2 breakthrough curve was larger than H2S.
Temperature
The breakthrough curves for the bi-component SO2 and H2S adsorption on activated carbon were simulated at different temperatures, with a GHSV of 346.64 h−1, H2S concentration of 2%, SO2 concentration of 1%, and a total pressure of 101 kPa. The results are presented in Figure 7 and Table 8.
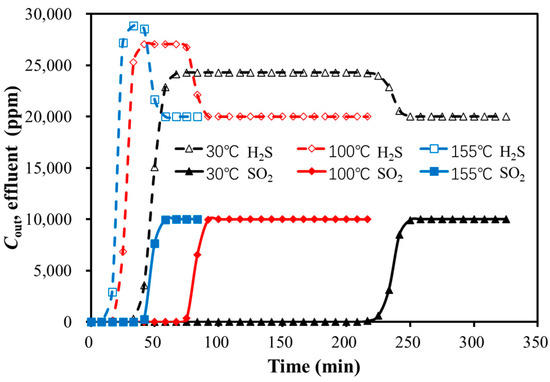
Figure 7.
Breakthrough curves of bi-component adsorption with temperature variation.

Table 8.
Breakthrough time for bi-component adsorption with temperature variation.
As shown in Figure 7 and Table 8, the peak height of the H2S hump increased with the rising temperature, while the duration of the hump decreased. The higher temperature led to a shorter breakthrough time for both SO2 and H2S. The effect of temperature was larger on the strongly adsorbed component (SO2) compared to the weakly adsorbed component (H2S).
3.2.2. Comparison of Bi-Component and Single-Component Adsorption Breakthrough Time
The Extended Langmuir equation was the improvement upon the classical Langmuir model, used to describe complex systems involving the competitive multicomponent adsorption or adsorption on heterogeneous surfaces.
The breakthrough time for bi-component and single-component adsorption of H2S and SO2 were compared at the temperature of 30 °C and an GHSV of 346.64 h−1, as summarized in Table 9.

Table 9.
Comparison of breakthrough time for bi-component and single-component adsorption.
As shown in Table 9, the breakthrough time of the bi-component simulation was 10.5% and 18.2% earlier for SO2 and H2S, respectively. The bi-component adsorption led to an earlier breakthrough time for both SO2 and H2S compared to the single-component adsorption. This was attributed to the increase in feed species and the competitive interaction between the two gases, where the presence of one component reduced the available adsorption sites for the other.
3.2.3. Concentration Distribution in the Adsorption Bed
Under the adsorption conditions of a H2S concentration of 2%, SO2 concentration of 1%, temperature of 30 °C, and a GHSV of 259.98 h−1, the axial concentration distributions of the two components in the adsorption bed at different time intervals are illustrated in Figure 8 and Figure 9. The horizontal axis represented the axial distance from the inlet of the adsorption bed, while the vertical axis indicates the concentration of SO2 and H2S in the gas mixture.
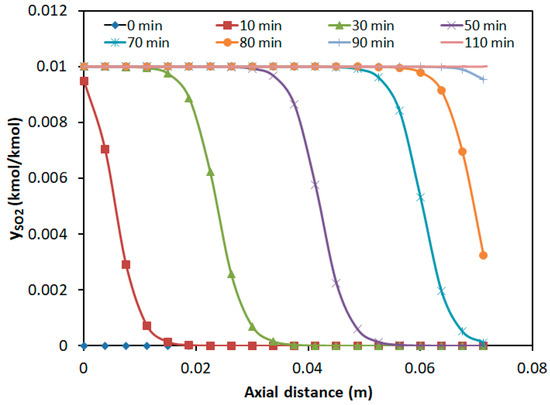
Figure 8.
Axial concentration distribution of SO2 at different time intervals.
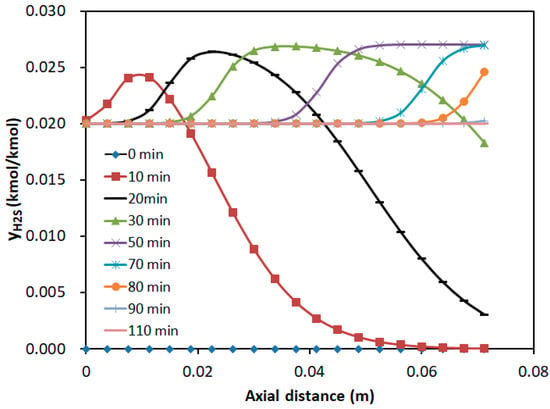
Figure 9.
Axial concentration distribution of H2S at different time intervals.
As shown in Figure 8, the SO2 mass transfer wave propagated forward and flattens over time. However, the breakthrough time was earlier, which increased adsorption resistance. At the bed outlet (z = 0.075 m), the SO2 concentration gradually increased from zero to the inlet concentration over time, with the breakthrough occurring at approximately 75 min and adsorption saturation reached at around 110 min. When H2S reached its breakthrough time at about 20 min, the bed above 0.03 m showed almost zero SO2 presence. The potential of over 60% of the fixed bed for the SO2 adsorption was not fully utilized.
Figure 9 demonstrated that during the bi-component adsorption, the hump appeared in the H2S concentration profile. This phenomenon arose from competitive adsorption, where H2S, as the weakly adsorbed component, was replaced by the strongly adsorbed SO2. As a result, the H2S concentration temporarily exceeded the inlet concentration, forming the hump. Over time, the hump propagated along the bed, and its height increased. At the bed exit (z = 0.075 m), the H2S concentration gradually rose from zero to the inlet concentration, with the breakthrough occurring at approximately 20 min and the adsorption saturation reached at around 110 min. It was consistent with the breakthrough curves.
3.2.4. Distribution of Adsorption Amount in the Adsorption Bed
The axial distribution of the adsorption amounts for the bi-component SO2 and H2S over the activated carbon are shown in Figure 10 and Figure 11. The horizontal axis represented the adsorption time, while the vertical axis indicated the adsorption amount of each component. The parameter H denotes the axial distance from the inlet of the adsorption bed.
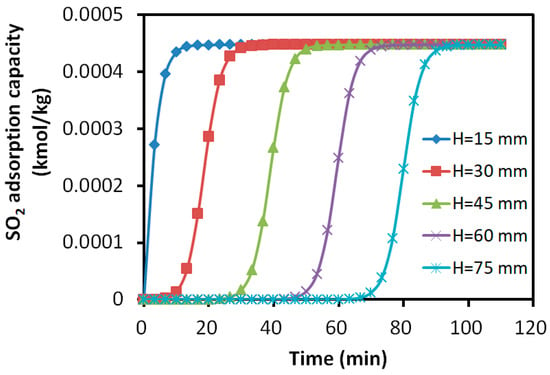
Figure 10.
Variation in SO2 adsorption amount with time at different axial positions.
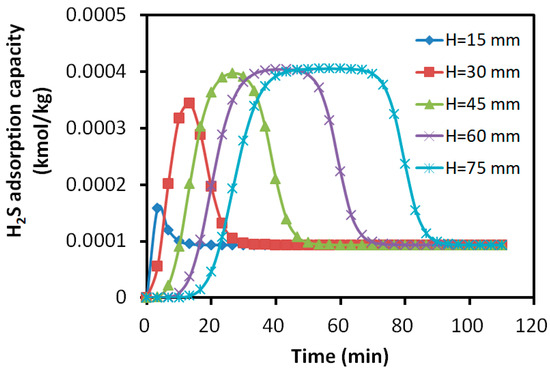
Figure 11.
Variation in H2S adsorption amount with time at different axial positions.
The results revealed that the adsorption profiles of SO2 at different axial positions exhibited similar S-shapes, indicating the steady progression of the adsorption process along the bed. For the adsorption of H2S, the layers close to the inlet showed a slight increase in the adsorbed H2S. However, it was not able to maintain the S-shaped adsorption due to the replacement of SO2. The adsorbate rapidly decreased to the constant level of about 0.01% kmol/kg, which was about 25% of the peak value in the layers away from the inlet. For the layers close to the outlet, the peak adsorbed H2S was about 0.04% kmol/kg and it maintained a longer S-shape due to the later presence of SO2.
After the breakthrough of H2S at about 20 min, the adsorbed SO2 is mainly reserved within the bed layers of 0~30 mm, while H2S was mainly absorbed within the layers of 30~60 mm. The bed showed 40% of its desulfurization capability for SO2, while less than 40% for H2S due to the over 12.5% difference in the adsorption capacity peak. More than 20% of the bed was underutilized for the adsorption.
For the removal of the low-concentration SO2 and H2S, the simultaneous removal approach might be preferred to simplify the adsorption process and the equipment. However, it may require the extension of the bed due to the early breakthrough of H2S and the replacement effect. Water vapor and oxygen may be included to activate the reaction of H2S. As a result, the early breakthrough of H2S was delayed and the simultaneous removal performance might be improved.
The step-by-step approach might be optional since the early breakthrough and the replaced H2S could be adsorbed in the following unit without the influence of SO2. As a result, the potential adsorption capacity of SO2 might be maximized.
3.2.5. Limitations of the Bi-Component Simulation
For the simulation of the bi-component adsorption of H2S and SO2 over the activated carbon, the extended Langmuir isotherm model, which was developed for the multicomponent adsorption, was adopted to predict the dynamic adsorption process of the trace fixed bed. The possible reaction of H2S and SO2 on the adsorbent surface were neglected since the low concentration, the low temperature, and the nitrogen mixture might suppress the reaction. However, the presence of water vapor and oxygen would activate the reaction, which was the case for the adsorbents with the atmosphere exposure experiences. The influences of chemical reactions require further experimental verification of the bi-component system. The distinct adsorption location of the bed indicating the variation of species concentrated on the adsorbents, and the breakthrough time gaps might be the evidence for the replacement effect in future experimental studies.
4. Conclusions
This paper investigated the simultaneous adsorption and removal of low concentrations of SO2 and H2S using experimental and simulation methods.
Test results showed the breakthrough time of SO2 was five times longer than H2S at 30 °C, and the activated carbon showed a better adsorption capacity over SO2. The decreased temperature and the low GHSV were favorable for the adsorption of both SO2 and H2S.
The simulation following the Langmuir isotherm model showed a less than 6.5% overestimation of the breakthrough time compared with the single-component test results. The simulation and the selected parameters were acceptable to reflect the adsorption of SO2 and H2S on the activated carbon.
The bi-component simulation following the extended Langmuir isotherm model predicted the hump breakthrough curves of H2S adsorption, which was probably due to the competitive adsorption of SO2 over H2S. It resulted in an 18% breakthrough time shortening of the system, which was controlled by the breakthrough of H2S. Additionally, the replacement of SO2 over H2S led to the distinct adsorption location over the fixed bed layers. The bed length should be extended to increase the simultaneous removal of the mixture.
Further research is required to investigate the chemical reaction effects on the bi-component adsorption, and to improve the simultaneous removal of SO2 and H2S by avoiding the unexpected early breakthrough of H2S.
Author Contributions
Conceptualization, X.C., L.Z., Q.C. and H.W.; Methodology, X.C. and L.Z.; Software, X.C.; Formal analysis, X.C.; Investigation, X.C.; Resources, Q.C. and H.W.; Data curation, X.C. and Q.C.; Writing—original draft, X.C.; Writing—review & editing, H.W.; Project administration, Q.C. and H.W.; Funding acquisition, Q.C. and H.W. All authors have read and agreed to the published version of the manuscript.
Funding
This work was financially supported by the National Key R&D Program of China, (No. 2021YFC2103900), the Project of Sinopec Petrochemical Company Ltd. (No. 315015), and the Project of Sinopec Yangzi Petrochemical Company Ltd. (No. 30600000-12-Z-ZC0607-25400006-0-*).
Institutional Review Board Statement
Not applicable.
Informed Consent Statement
Not applicable.
Data Availability Statement
The original contributions presented in this study are included in the article. Further inquiries can be directed to the corresponding authors.
Acknowledgments
The research reported herein has been carried out with the help of Xiaopo, Zhao at Nanjing Tech University for the experimental study, and Zhengfei Ma at Nanjing Tech University for the simulation. The assistances are gratefully acknowledged.
Conflicts of Interest
The authors declare no conflict of interest.
Nomenclature
| C | Concentration of adsorbate (kg/m3) |
| Cout, effluent | Species concentration at the outlet (ppm) |
| ySO2 | Dimensionless concentration of SO2 (kmol/kmol) |
| yH2S | Dimensionless concentration of H2S (kmol/kmol) |
| v | Flow rate of the fluid (m/s) |
| z | Axial direction of adsorption bed (m) |
| εb | Bed porosity (-) |
| ρp | Adsorbent particle density (kg/m3) |
| ρb | Bed bulk density (kg/m3) |
| ρs | Particle skeletal density (kg/m3) |
| q | Adsorption phase concentration (kg adsorbed/kg adsorbent) |
| q* | Equilibrium adsorption capacity (kg adsorbed/kg adsorbent) |
| kf | Overall mass transfer coefficient (1/s) |
| RP | Particle radius of adsorbent (m) |
| t | Adsorption time (s) |
| Hb | Height of adsorption bed (m) |
| Db | Adsorption bed inner diameter (m) |
| S | Spherical particle size of adsorbent (-) |
| IP1 | Langmuir isothermal parameter (kmol/kg/bar) |
| IP2 | Langmuir isothermal parameter (1/bar) |
References
- Kohl, A.L.; Nielsen, R.B. Gas Purification, 5th ed.; Gulf Publishing Company: Houston, TX, USA, 1997. [Google Scholar]
- Eow, J.S. Recovery of Sulfur from Sour Acid Gas: A Review of the Technology. Environ. Prog. 2002, 21, 143–162. [Google Scholar] [CrossRef]
- Léveillé, V.; Claessens, T. Cansolv® SO2 Scrubbing System: Review of Commercial Applications for Smelter SO2 Emissions Control. S. Afr. Inst. Min. Metall. 2009, 109, 485–489. [Google Scholar]
- Schmidt, R.; Cross, J.B.; Latimer, E.G. Tail-Gas Cleanup by Simultaneous SO2 and H2S Removal. Energy Fuels 2009, 23, 3612–3616. [Google Scholar] [CrossRef]
- Zhang, S.; Zhang, L.; Zhang, Y.; Ren, X.; Sun, Q.; Wennersten, R.; Cao, F.; Liu, Y.; Hao, M.; Yu, H. Performance of Nitrogen-Containing Functional Groups on SO2 Adsorption by Active Coke. Sep. Purif. Technol. 2024, 337, 126192. [Google Scholar] [CrossRef]
- Kisiela-Czajka, A.M.; Dziejarski, B. Linear and Non-Linear Regression Analysis for the Adsorption Kinetics of SO2 in a Fixed Carbon Bed Reactor—A Case Study. Energies 2022, 15, 633. [Google Scholar] [CrossRef]
- Zhang, S.; Li, Z.; Yang, Y.; Jian, W.; Ma, D.; Jia, F. Kinetics and Thermodynamics of SO2 Adsorption on Metal-Loaded Multiwalled Carbon Nanotubes. Open Phys. 2020, 18, 1201–1214. [Google Scholar] [CrossRef]
- Li, Z.; Liu, Y.; Wang, H.; Tsai, C.-J.; Yang, X.; Xing, Y.; Zhang, C.; Xiao, P.; Webley, P.A. A Numerical Modelling Study of SO2 Adsorption on Activated Carbons with New Rate Equations. Chem. Eng. J. 2018, 353, 858–866. [Google Scholar] [CrossRef]
- Ma, S.-C.; Yao, J.-J.; Gao, L.; Ma, X.-Y.; Zhao, Y. Experimental Study on Removals of SO2 and NOx Using Adsorption of Activated Carbon/Microwave Desorption. J. Air Waste Manag. Assoc. 2012, 62, 1012–1021. [Google Scholar] [CrossRef]
- Deng, H.; Yi, H.; Tang, X.; Yu, Q.; Ning, P.; Yang, L. Adsorption Equilibrium for Sulfur Dioxide, Nitric Oxide, Carbon Dioxide, Nitrogen on 13x and 5a Zeolites. Chem. Eng. J. 2012, 188, 77–85. [Google Scholar] [CrossRef]
- Lua, A.C.; Yang, T. Theoretical and Experimental SO2 Adsorption onto Pistachio-Nut-Shell Activated Carbon for a Fixed-Bed Column. Chem. Eng. J. 2009, 155, 175–183. [Google Scholar] [CrossRef]
- Lopez, D.; Buitrago, R.; Sepulveda-Escribano, A.; Rodríguez-Reinoso, F.; Mondragón, F. Low Temperature Catalytic Adsorption of SO2 on Activated Carbon. J. Phys. Chem. C 2008, 112, 15335–15340. [Google Scholar] [CrossRef]
- Wang, S.; Xu, S.; Gao, S.; Xiao, P.; Jiang, M.; Zhao, H.; Huang, B.; Liu, L.; Niu, H.; Wang, J.; et al. Simultaneous Removal of SO2 and NOx from Flue Gas by Low-Temperature Adsorption over Activated Carbon. Sci. Rep. 2021, 11, 11003. [Google Scholar] [CrossRef]
- Pudi, A.; Rezaei, M.; Signorini, V.; Andersson, M.P.; Baschetti, M.G.; Mansouri, S.S. Hydrogen Sulfide Capture and Removal Technologies: A Comprehensive Review of Recent Developments and Emerging Trends. Sep. Purif. Technol. 2022, 298, 121448. [Google Scholar] [CrossRef]
- Saleh, A.M.; Mahdi, H.H.; Alias, A.B.; Hadi, N.K.A.; Qarizada, D.; Jawad, A.H.; Saleh, N.M. Equilibrium and Kinetic Studies in Adsorption of H2s Using Coconut Shell Activated Carbon Xerogel: Effect of Mass Adsorbent and Temperature. Desalin. Water Treat. 2024, 317, 100149. [Google Scholar] [CrossRef]
- Sadighi, S.; Masoudian, S.K.; Mohaddecy, S.R.S.; Karimi, A. Sub-Dew Point Claus Process for Reducing Hydrogen Sulfide Emission from Sulfur Recovery Units. Petrol. Sci. Technol. 2024, 43, 1166–1181. [Google Scholar] [CrossRef]
- Yang, J.H. Hydrogen Sulfide Removal Technology: A Focused Review on Adsorption and Catalytic Oxidation. Korean J. Chem. Eng. 2021, 38, 674–691. [Google Scholar] [CrossRef]
- Moradi, H.; Azizpour, H.; Bahmanyar, H.; Mohammadi, M. Molecular Dynamics Simulation of H2S Adsorption Behavior on the Surface of Activated Carbon. Inorg. Chem. Commun. 2020, 118, 108048. [Google Scholar] [CrossRef]
- Han, X.; Chen, H.; Liu, Y.; Pan, J. Study on Removal of Gaseous Hydrogen Sulfide Based on Macroalgae Biochars. Nat. Gas Sci. Eng. 2020, 73, 103068. [Google Scholar] [CrossRef]
- Hussain, A. A Computational Study of Adsorption of H2S and SO2 on the Activated Carbon Surfaces. J. Mol. Graph. Model. 2023, 122, 108463. [Google Scholar] [CrossRef]
- Parinyakit, S.; Worathanakul, P. Static and Dynamic Simulation of Single and Binary Component Adsorption of CO2 and CH4 on Fixed Bed Using Molecular Sieve of Zeolite 4A. Processes 2021, 9, 1250. [Google Scholar] [CrossRef]
- Shi, L.; Yang, K.; Zhao, Q.; Wang, H.; Cui, Q. Characterization and Mechanisms of H2S and SO2 Adsorption by Activated Carbon. Energy Fuels 2015, 29, 6678–6685. [Google Scholar] [CrossRef]
- Xuan, J.; Wang, C.; Zhang, L.; Cui, Q.; Wang, H. Effect of CO2/H2O on Adsorptive Removal of H2S/SO2 Mixture. Environ. Technol. 2022, 43, 2069–2079. [Google Scholar] [CrossRef] [PubMed]
- Wan, J.; Liu, M.; Liu, W.; Ding, W.; Duan, Y. Effect of Multi-Component Gas on Removal of Trace Hydrogen Sulfide Activity from Blast Furnace Gas Using Activated Carbon Adsorbent. Int. J. Chem. React. Eng. 2024, 22, 867–878. [Google Scholar] [CrossRef]
- Mudhoo, A.; Pittman, C.U., Jr. Adsorption Data Modeling and Analysis under Scrutiny: A Clarion Call to Redress Recently Found Troubling Flaws. Chem. Eng. Res. Des. 2023, 192, 371–388. [Google Scholar] [CrossRef]
- Ortiz, F.J.G.; Rodríguez, M.B.; Yang, R.T. Modeling of Fixed-Bed Columns for Gas Physical Adsorption. Chem. Eng. J. 2019, 378, 121985. [Google Scholar] [CrossRef]
- Moreira, D.D.S.; Goncalves, D.V.; Coelho, J.A.; de Azevedo, D.C.; Rios, R.B.; de Lucena, S.M.; Bastos-Neto, M. Influence of SO2 on CO2 Capture by Adsorption on Activated Carbon: Individual Pore Performance Via Multiscale Simulation. Sep. Purif. Technol. 2024, 336, 126219. [Google Scholar] [CrossRef]
- Capelo-Aviles, S.; De Fez-Febré, M.; Balestra, S.R.G.; Cabezas-Giménez, J.; de Oliveira, R.T.; Stampino, I.I.G.; Vidal-Ferran, A.; González-Cobos, J.; Lillo, V.; Fabelo, O.; et al. Selective Adsorption of CO2 in Tamof-1 for the Separation of CO2/CH4 Gas Mixtures. Nat. Commun. 2025, 16, 3243. [Google Scholar] [CrossRef]
- GB 31570-2015; Emission Standard of Pollutants for Petroleum Refining Industry. The Standards Press of China: Beijing, China, 2015.
- GBZ 2.1-2019; Occupational Exposure Limits for Hazardous Agents in the Workplace—Part 1: Chemical Hazardous Agents. The Standards Press of China: Beijing, China, 2019.
- Riaz, Z. Modelling of Gas Separations Using Aspen Adsorption® Software. Master’s Thesis, LUT School of Engineering Science, Lappeenranta—Lahti University of Technology, Lahti, Finland, 2021. [Google Scholar]
- Boki, K.; Tanada, S. Adsorption of Hydrogen Sulfide on Activated Carbon. Chem. Pharm. Bull. 1980, 28, 1270–1275. [Google Scholar] [CrossRef][Green Version]
Disclaimer/Publisher’s Note: The statements, opinions and data contained in all publications are solely those of the individual author(s) and contributor(s) and not of MDPI and/or the editor(s). MDPI and/or the editor(s) disclaim responsibility for any injury to people or property resulting from any ideas, methods, instructions or products referred to in the content. |
© 2025 by the authors. Licensee MDPI, Basel, Switzerland. This article is an open access article distributed under the terms and conditions of the Creative Commons Attribution (CC BY) license (https://creativecommons.org/licenses/by/4.0/).