
High-Risk Neuroblastoma Stage 4 (NBS4): Developing a Medicinal Chemistry Multi-Target Drug Approach


Abstract

1. Introduction
1.1. Reasoning Behind Selected Targets
- (1)
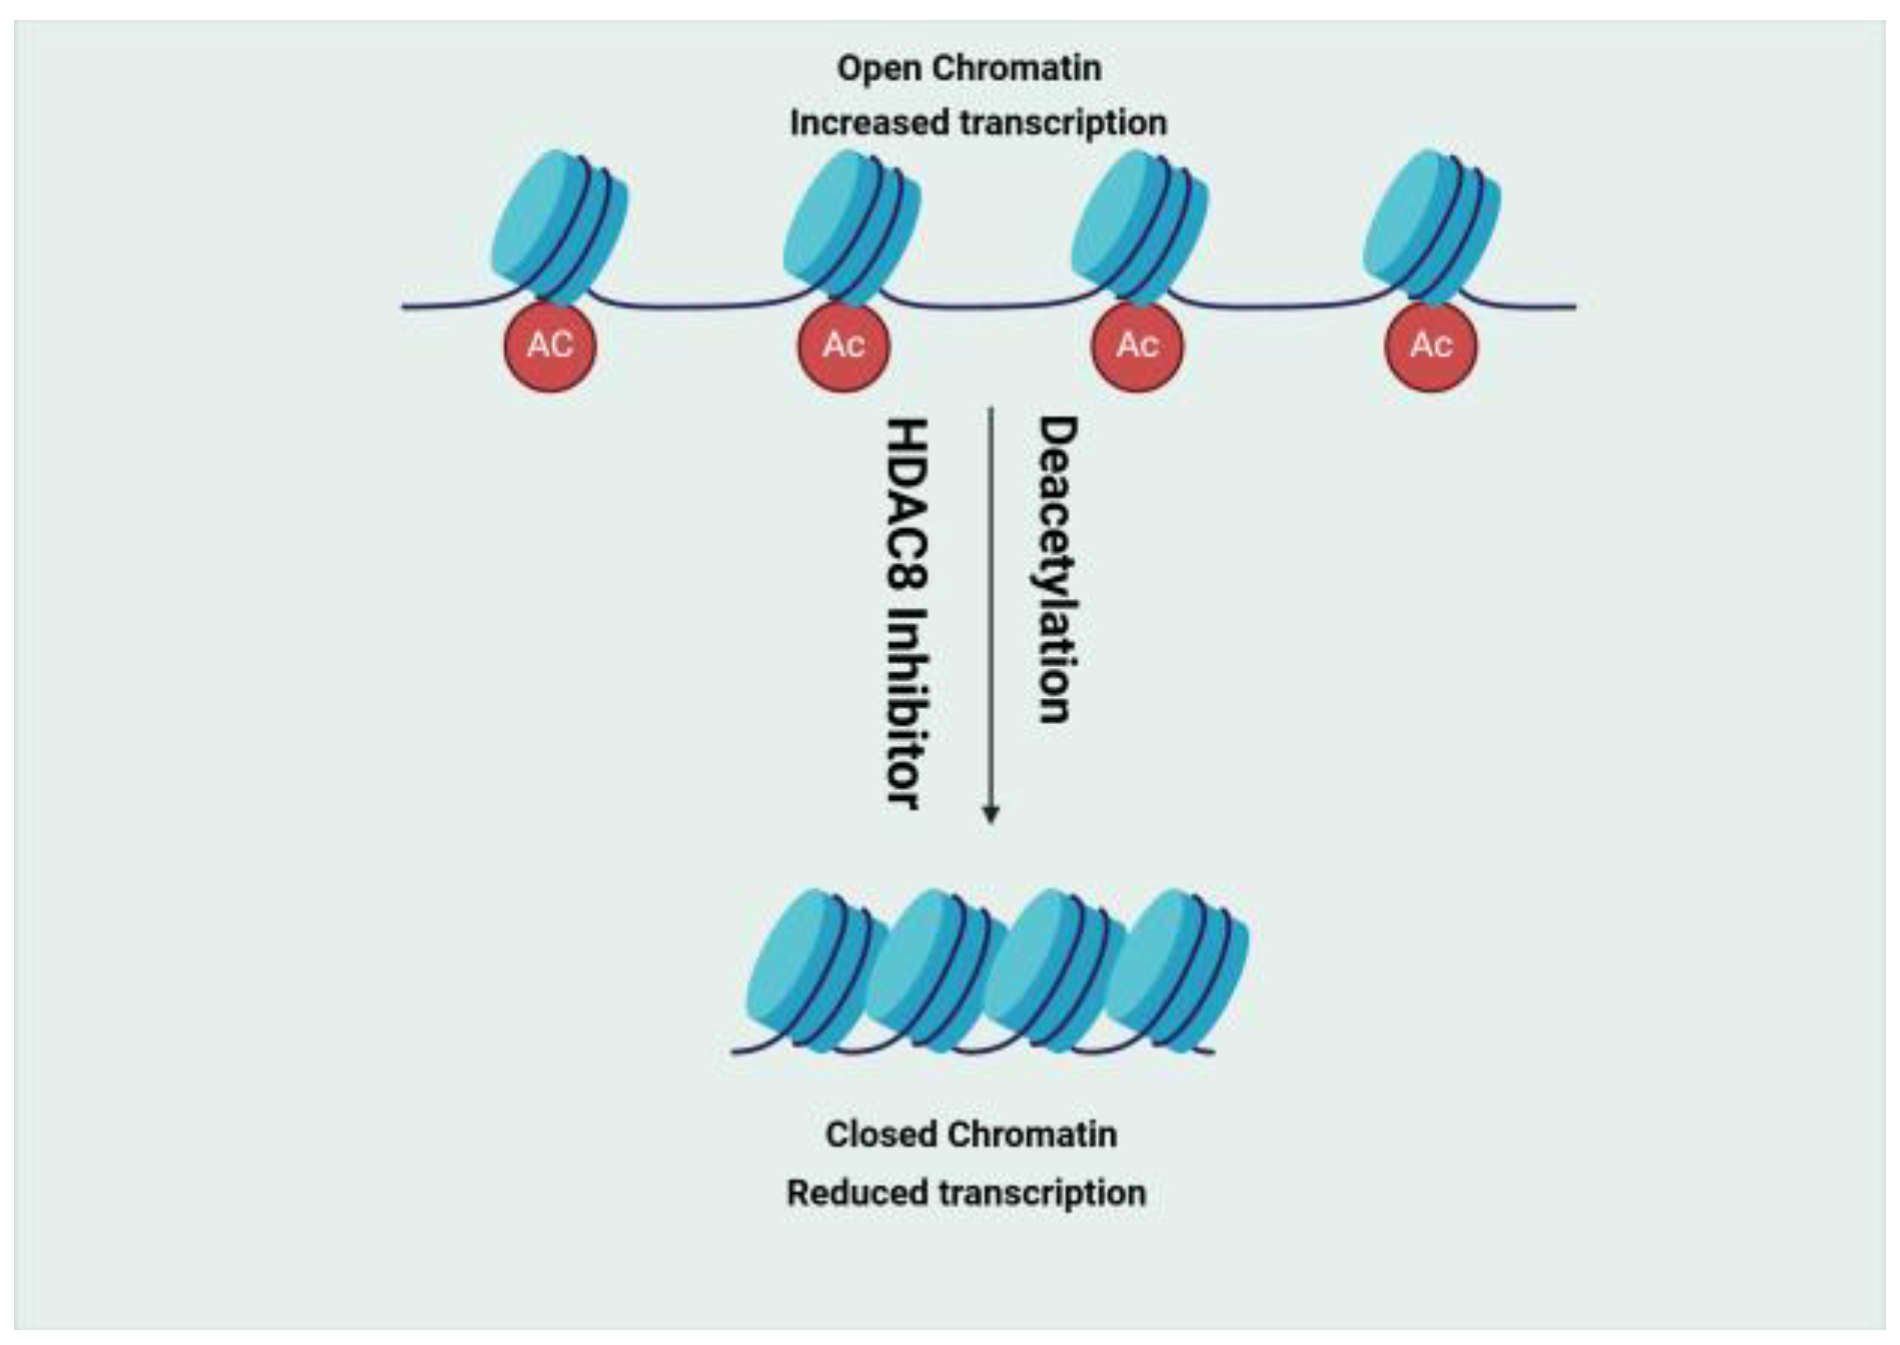
- Histone Deacetylase (HDAC)
- (2)
- Bromodomain (BRD)
- (3)
- Hedgehog (HH)
- (4)
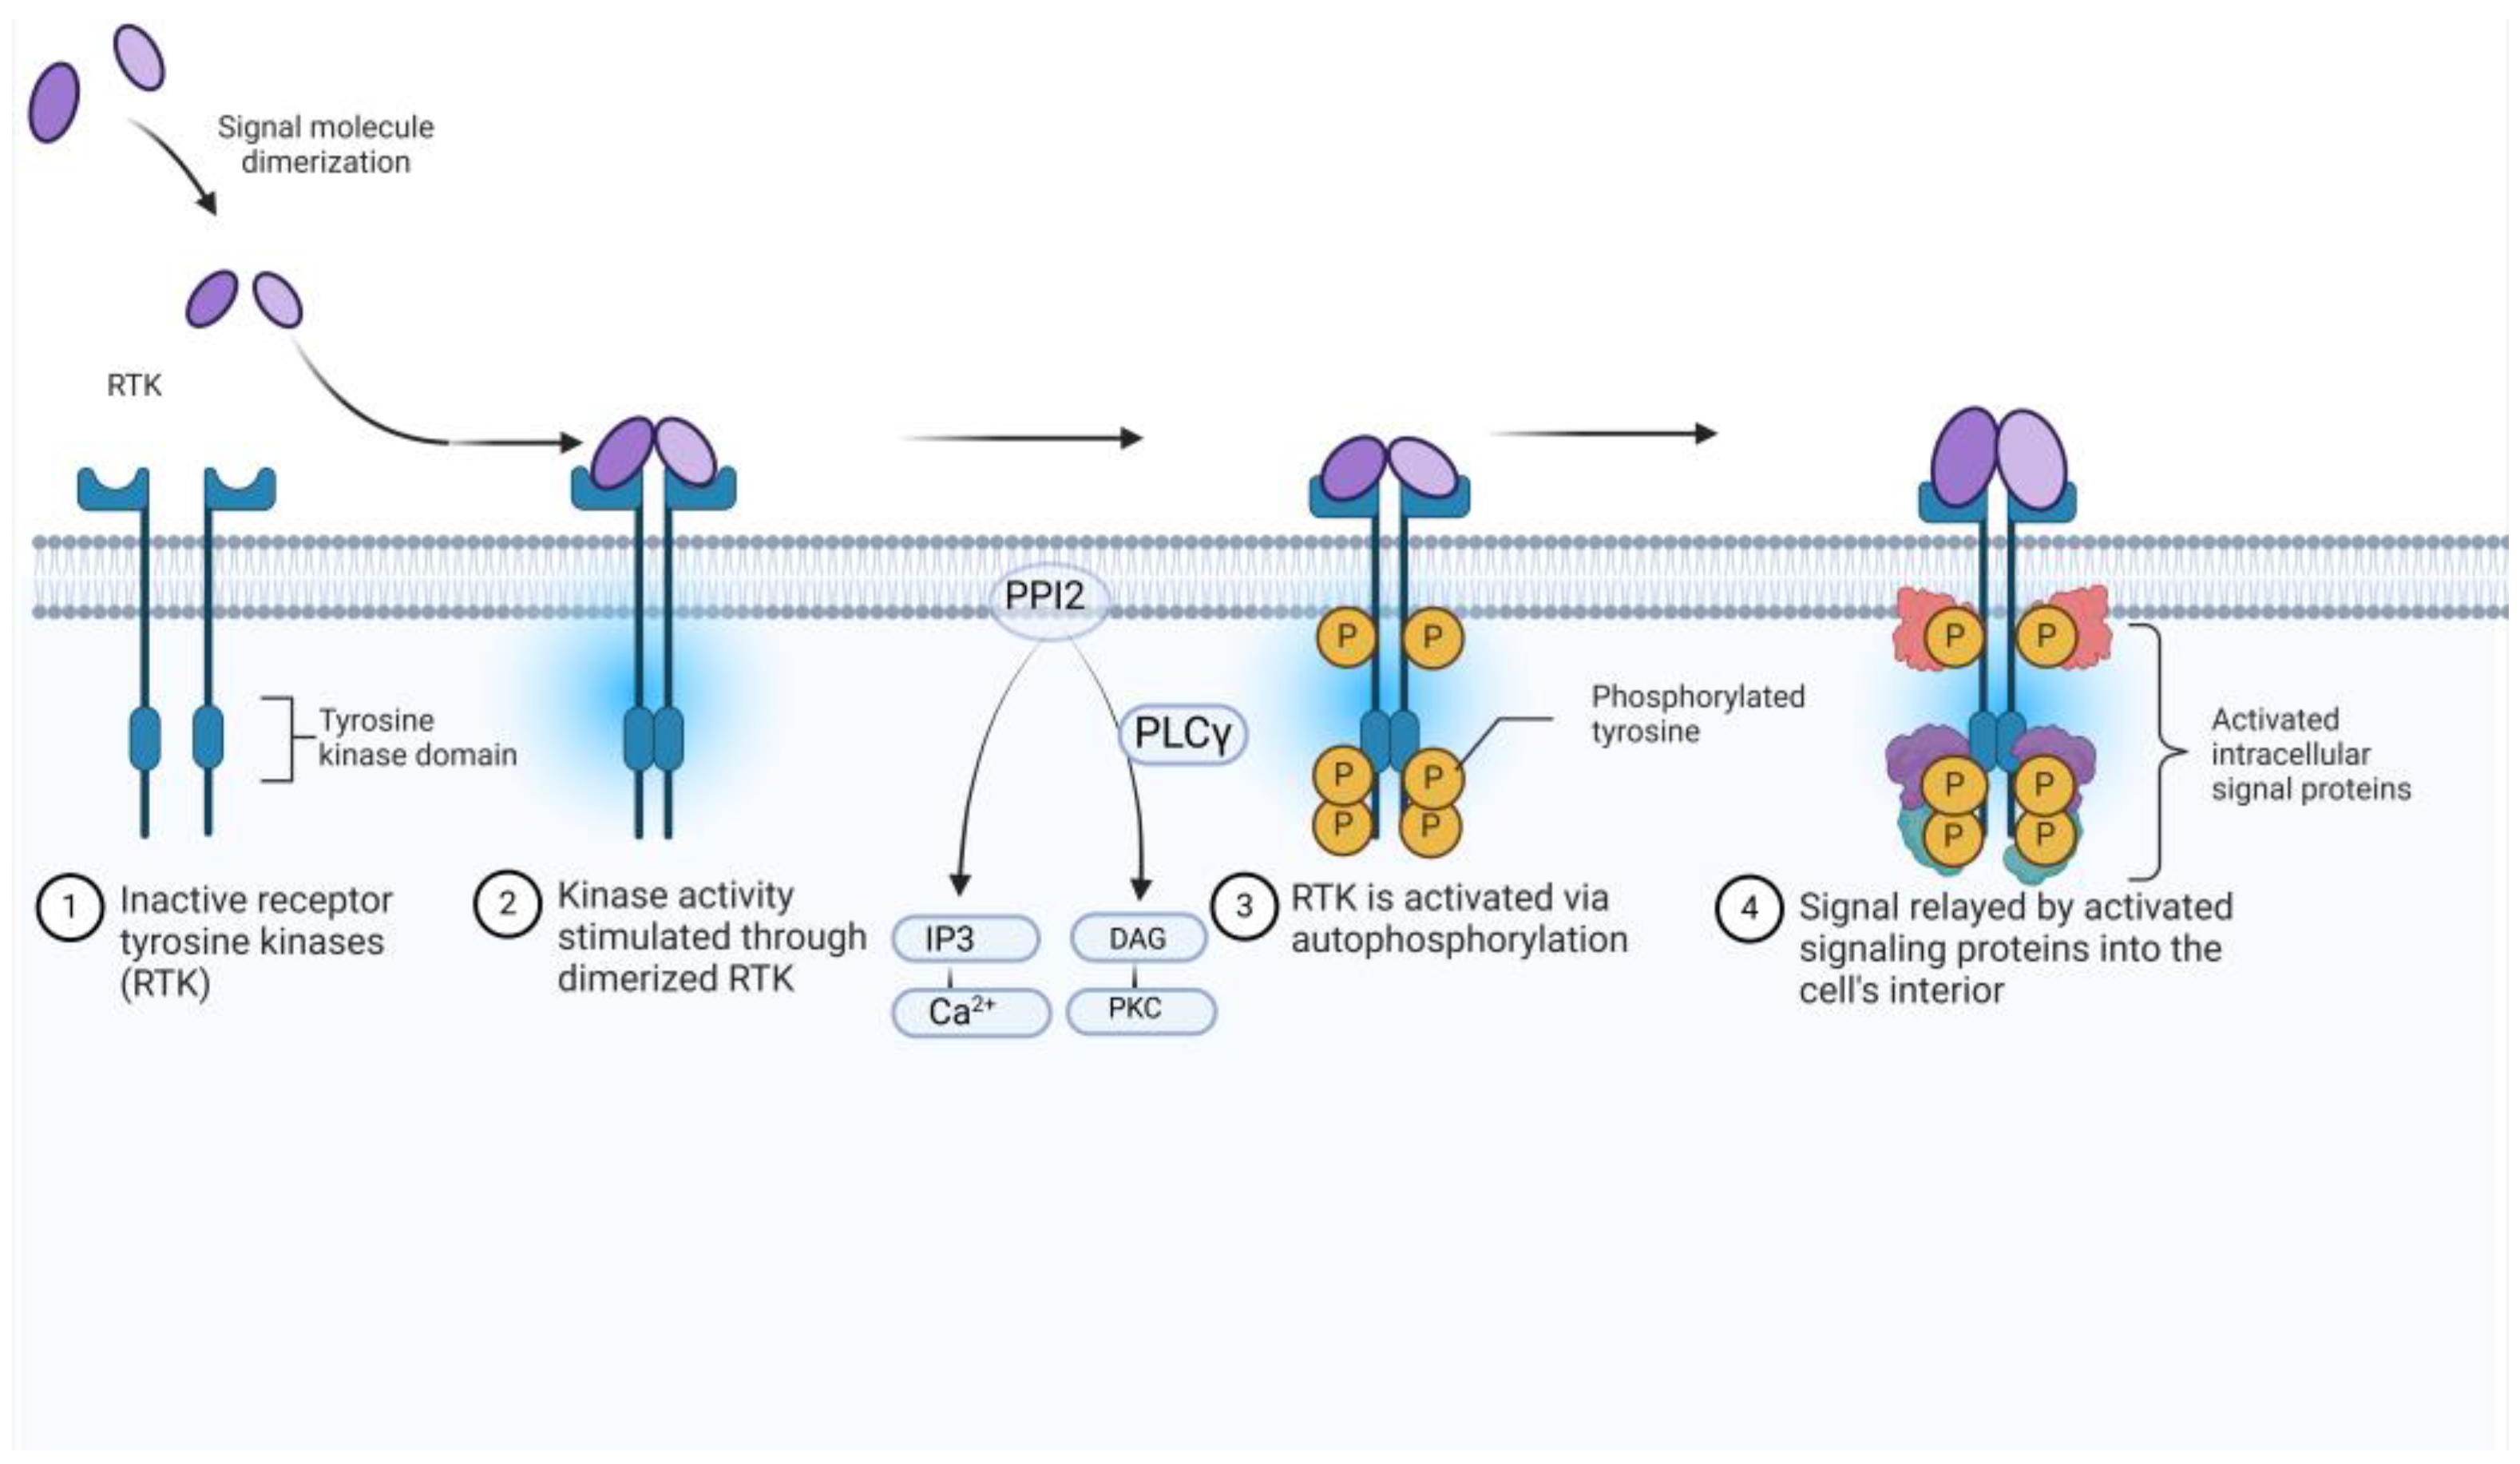
- Tropomyosin Receptor Kinase (TRK)

| Target | Lead Compound 1 | Lead Compound 2 | Protein/Receptor |
|---|---|---|---|
|  |  | 2V5X and 2V5W [16] |
| 8b [15] | 20a [15] | ||
|  JQ1 [18,20] |  BET762 [18] | 4BJX [18] and 5UY9 [22] |
|  BMS-833923 [28] |  Vismodegib [29] | 5L7I [30] and 3N1P [31] |
|  GW441759 [36] |  Compound 10 [36] | 4AT3 [36] and 3V5Q [36] |
1.2. Medicinal Chemistry Approaches to Drug Design
2. Results
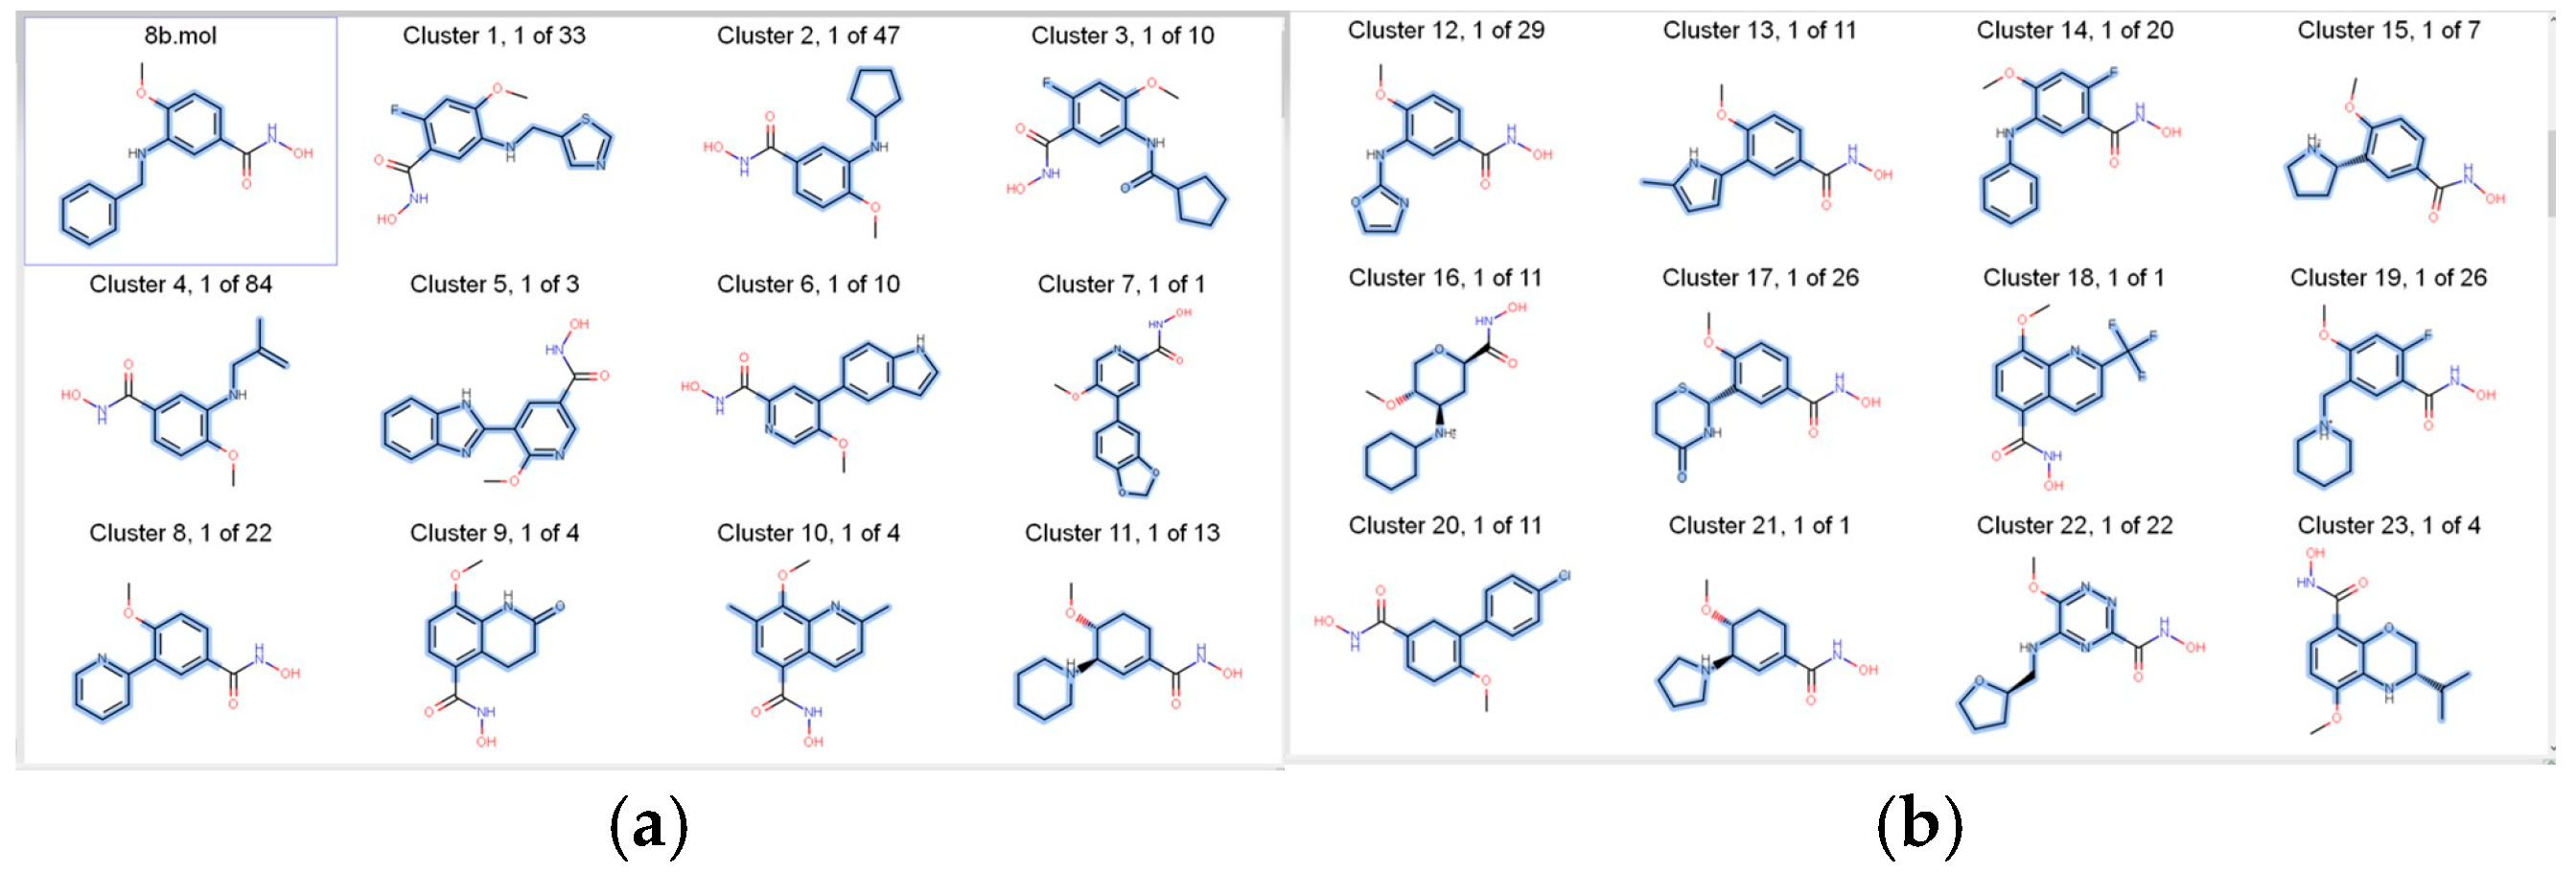
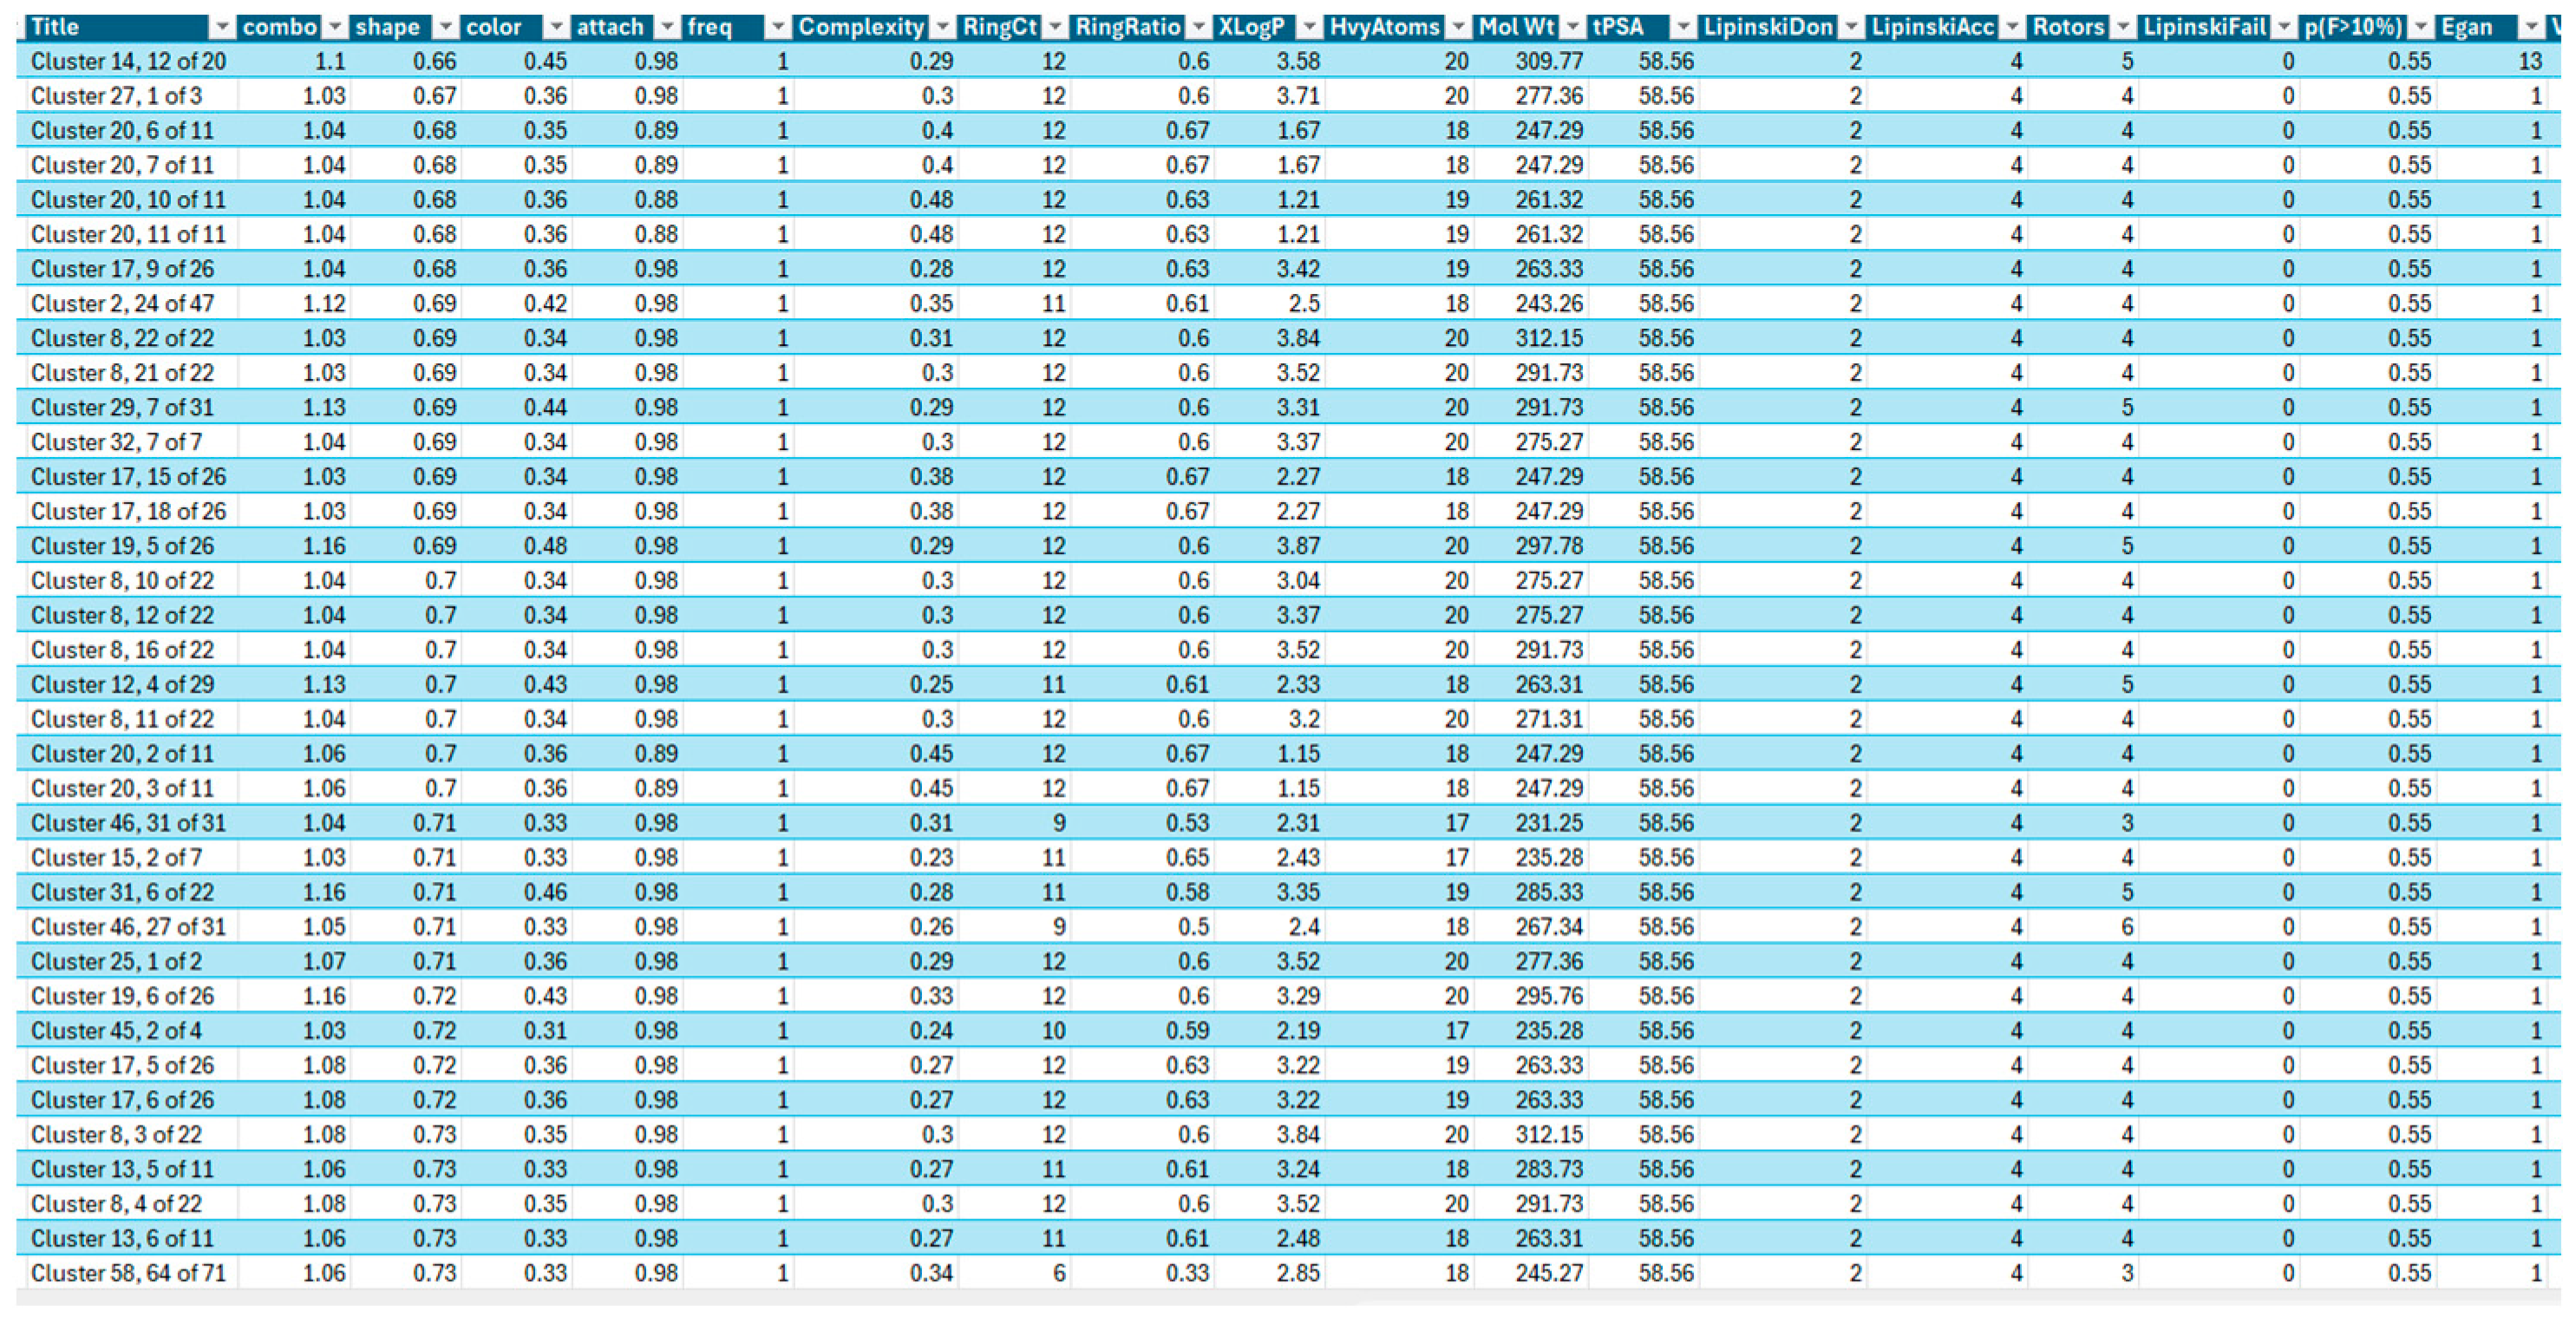
2.1. Medicinal Chemistry Results
- (1)
- AroRingCt: Number of aromatic rings in the molecule;
- (2)
- ClusterID/IdeaGroup: ClusterID of the molecule;
- (3)
- Colour: The replacement fragment’s colour Tanimoto score in comparison to the query fragment;
- (4)
- Combo: Tanimoto combo score for the replacement fragment’s shape and colour in comparison to the query fragment;
- (5)
- Egan: The Boolean indicates if the molecule satisfies the Egan bioavailability model;
- (6)
- Fragment: SMILES string of the replacement fragment;
- (7)
- Freq: The replacement fragment’s frequency;
- (8)
- fsp3C: The molecule’s fraction of sp3 hybridized carbon atoms;
- (9)
- HvyAtoms: Number of heavy atoms in the molecule;
- (10)
- LipinskiDon: Number of Lipinski donors in the molecule;
- (11)
- LipinkskiAcc: Number of Lipinski acceptors in the molecule;
- (12)
- LipinskiFail: Boolean specifying whether the molecule fails Lipinski’s rule of five;
- (13)
- Local strain: Calculated local strain of the molecule;
- (14)
- Molecular TanimotoCombo: Shape + colour Tanimoto combo score of the molecule against the query molecule;
- (15)
- MolWt: Molecular weight of the molecule;
- (16)
- p (active): Belief score of the molecule;
- (17)
- RingCt: Number of ring atoms;
- (18)
- RingRatio: Ratio of the number of ring atoms to the total number of heavy atoms;
- (19)
- Rotors: Number of rotatable bonds in the molecule;
- (20)
- Shape: Compare the replacement fragment’s Shape Tanimoto score to that of the query fragment;
- (21)
- Source Mols: SMILES strings of the molecules the replacement fragment is part of;
- (22)
- Source Mol Labels: Labels of the molecules the replacement fragment is part of;
- (23)
- tPSA: Calculated topological polar surface area of the molecule;
- (24)
- Veber: Boolean specifying whether the molecule passes the Veber bioavailability model;
- (25)
- XlogP: Calculated LogP of the molecule [50].
2.2. Retrosynthesis Results Using Spaya
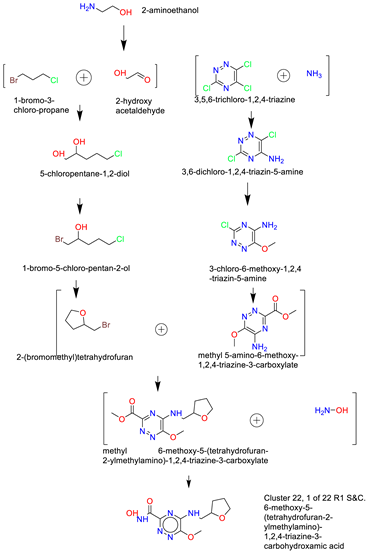
- (1)
- Synthesis of Cluster 22, 1 of 22 R1 S&C [49]
- (2)
- Cluster 10, 1 of 86

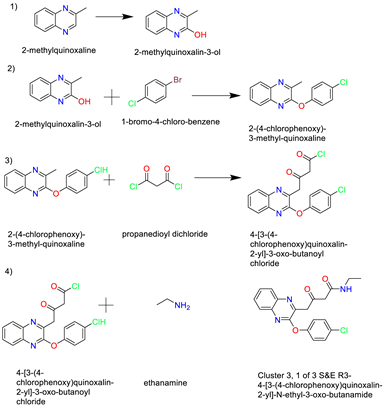
- (3)
- Cluster 3, 1 of 3
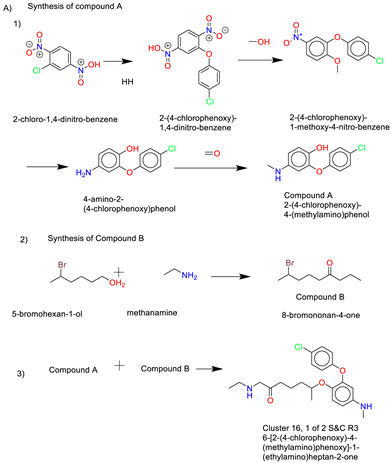
- (4)
- Cluster 16, 1 of 2
- (5)
- Cluster 8, 1 of 1
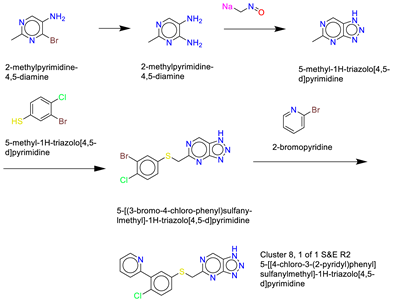
- (6)
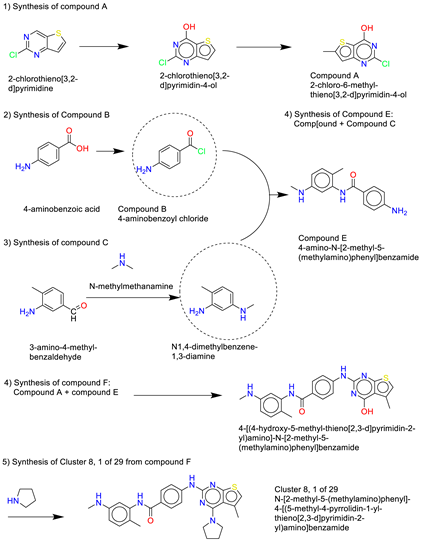
- Cluster 8, 1 of 29
- (7)
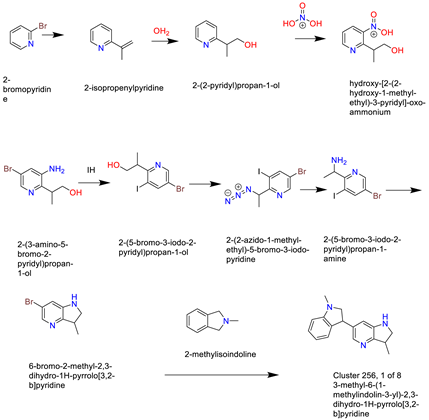
- Cluster 25, 1 of 8
- (8)
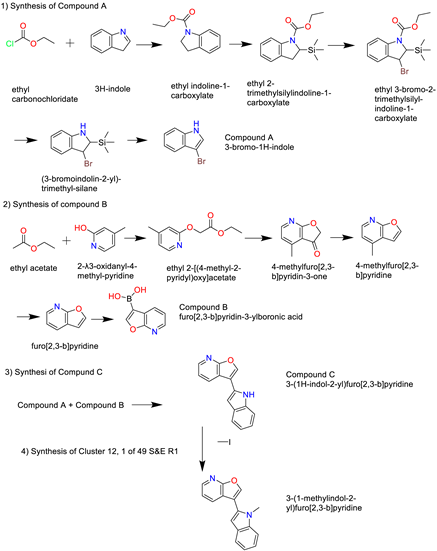
- Cluster 12, 1 of 49
3. Discussion
4. Materials and Methods
4.1. Materials
- OpenEye Scientific programmes, which include various applications, were used. The suite comprises BROOD, MakeReceptor, FRED, and AFITT.
- Molegro Virtual Docker.
- The Samson suite includes Autodock Vina Extended, the Fitted suite by Molecular Forecaster, and Protein Aligner.
- Toxicity Estimation Software Tools (TEST).
- BIOVIA Discovery Studio Visualizer.
- Spaya retrosynthesis software.
4.2. Method
- Identifying drug targets.
- Selection of two proteins (receptors) for each target and downloading the PDB files and their electron density map from the Protein Data Bank database.
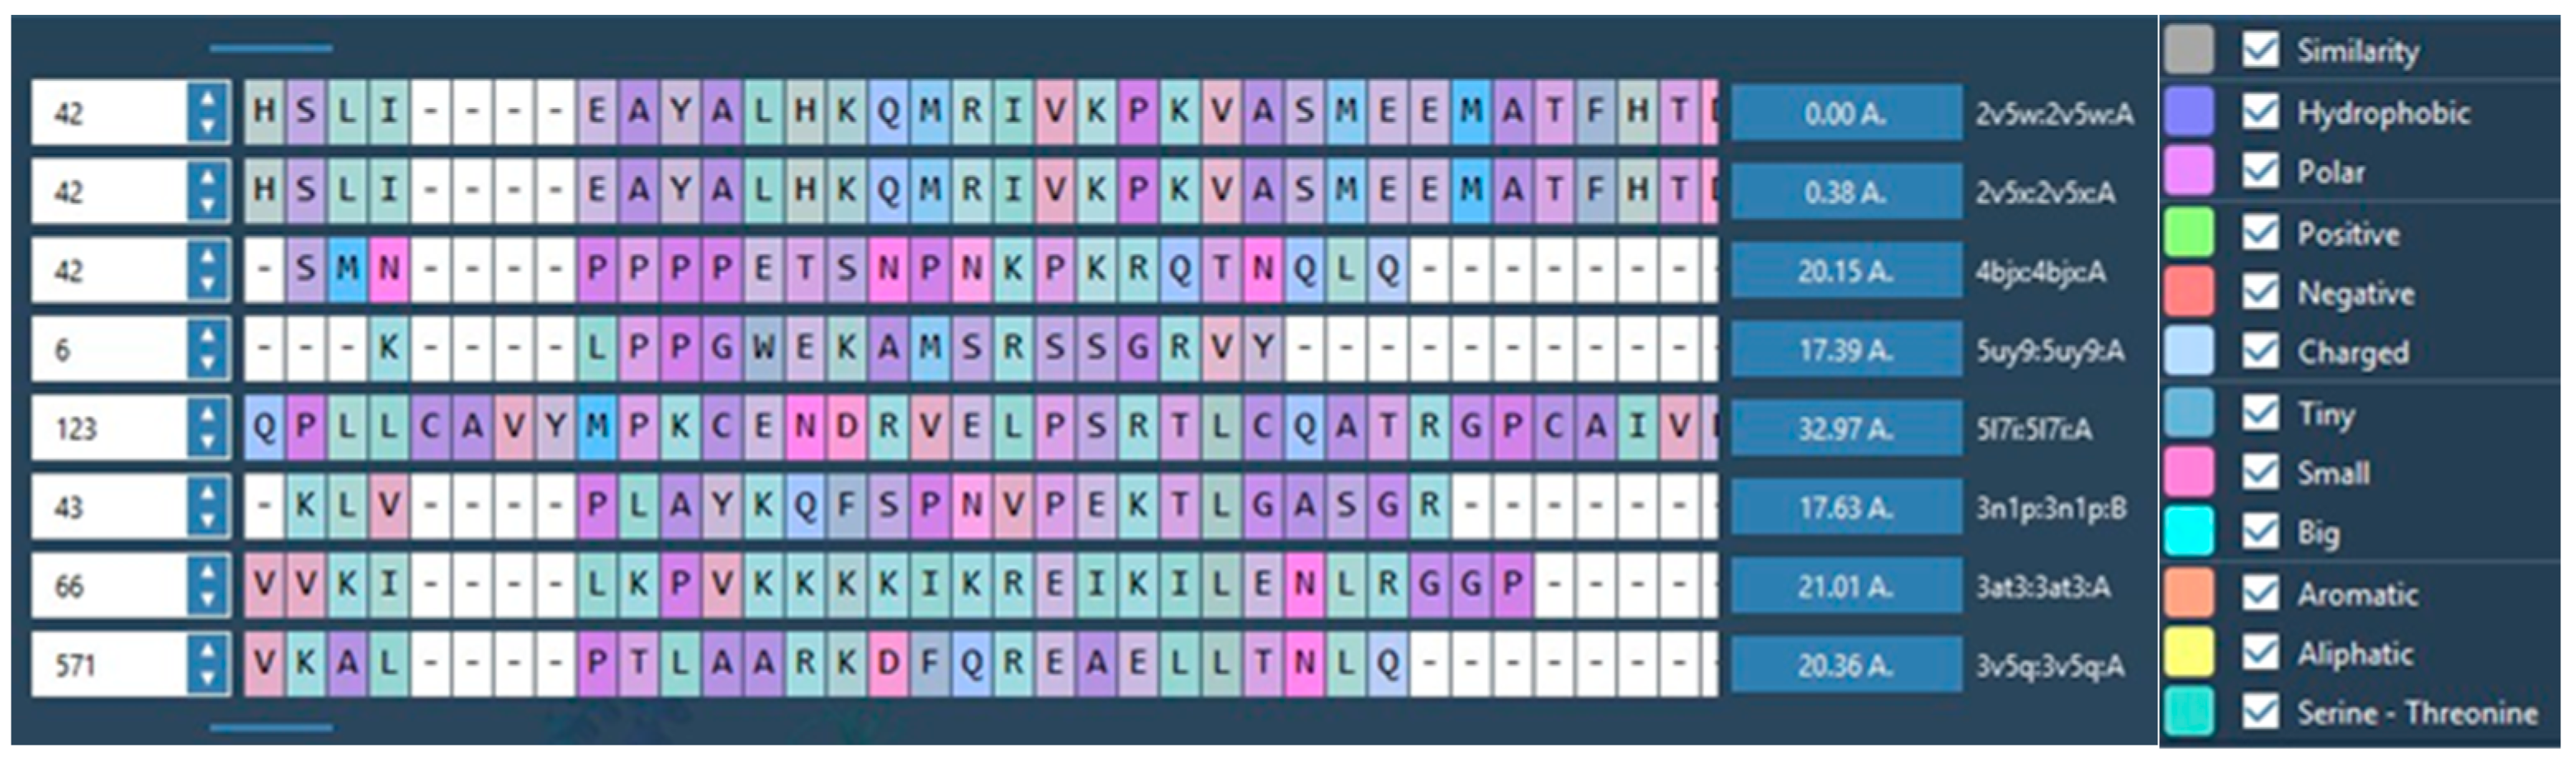
- Comparing the binding/active sites similarities of the receptors. Run protein similarity on Samson (Protein Aligner) to determine suitability.
- Selection of two lead compounds from each type.
- Run the lead compounds on BROOD (from the OpenEye suite) and produce hit lists using Shape and Colour and Shape and Electrostatics.
- Receptor preparations using MakeReceptor from the OpenEye suite.
- Docking the hit compounds with OpenEye suite (FRED), Molegro, and Samson suite (AutoDockVina and Fitted).
- Run cross-docking; each hitlist clusters from one target to the other 3 targets (using their protein/receptor).
- Run hits with AFITT to rank the compounds according to their fitting probabilities.
- Run selected clusters on ROCS.
- Run selected clusters on Toxicity Estimation Software Tools (TEST)
- Run clusters on Spaya to find the best synthesis route.
5. Conclusions
Supplementary Materials
Author Contributions
Funding
Institutional Review Board Statement
Informed Consent Statement
Data Availability Statement
Acknowledgments
Conflicts of Interest
References
- Cullinane, C.J.; Burchill, S.A.; Jeremy, A.S.; O’Leary, J.J.; Lewis, I.J. Molecular Biology and Pathology of Paediatric Cancer; Oxford University Press: New York, NY, USA, 2003; p. 360. [Google Scholar]
- Paraboschi, I.; Privitera, L.; Kramer-Marek, G.; Anderson, J.; Giuliani, S. Novel Treatments and Technologies Applied to the Cure of Neuroblastoma. Children 2021, 8, 482. [Google Scholar] [CrossRef] [PubMed]
- Cohen, S.; Carpenter, G. Human epidermal growth factor: Isolation and chemical and biological properties. Proc. Natl. Acad. Sci. USA 1975, 72, 1317–1321. [Google Scholar] [CrossRef] [PubMed]
- Gerges, A.; Canning, U. Neuroblastoma and its Target Therapies: A Medicinal Chemistry Review. ChemMedChem 2024, 19, e202300535. [Google Scholar] [CrossRef]
- Zafar, A.; Wang, W.; Liu, G.; Wang, X.; Xian, W.; McKeon, F.; Foster, J.; Zhou, J.; Zhang, R. Molecular targeting therapies for neuroblastoma: Progress and challenges. Med. Res. Rev. 2021, 41, 961–1021. [Google Scholar] [CrossRef] [PubMed]
- Inomistova, M.; Khranovska, N.; Skachkova, O. Role of Genetic and Epigenetic Alterations in Pathogenesis of Neuroblastoma; Academic Press: Cambridge, MA, USA, 2019; pp. 23–41. [Google Scholar]
- Bhoopathi, P.; Mannangatti, P.; Emdad, L.; Das, S.K.; Fisher, P.B. The quest to develop an effective therapy for neuroblastoma. J. Cell Physiol. 2021, 236, 7775–7791. [Google Scholar] [CrossRef]
- Zhang, W.L.; Pei, J.F.; Lai, L.H. Computational Multitarget Drug Design. J. Chem. Inf. Model. 2017, 57, 403–412. [Google Scholar] [CrossRef]
- Anighoro, A.; Bajorath, J.; Rastelli, G. Polypharmacology: Challenges and Opportunities in Drug Discovery. J. Med. Chem. 2014, 57, 7874–7887. [Google Scholar] [CrossRef]
- Knight, Z.A.; Lin, H.; Shokat, K.M.; Knight, Z.A.; Lin, H.; Shokat, K.M. Targeting the cancer kinome through polypharmacology. Nat. Rev. Cancer 2010, 10, 130–137. [Google Scholar] [CrossRef]
- Ooms, F. Molecular Modeling and Computer Aided Drug Design. Examples of their Applications in Medicinal Chemistry. Curr. Med. Chem. 2000, 7, 141–158. [Google Scholar] [CrossRef]
- Kumalo, H.M.; Bhakat, S.; Soliman, M.E.S.; Kumalo, H.M.; Bhakat, S.; Soliman, M.E.S. Theory and Applications of Covalent Docking in Drug Discovery: Merits and Pitfalls. Molecules 2015, 20, 1984. [Google Scholar] [CrossRef] [PubMed]
- Bolden, J.E.; Peart, M.J.; Johnstone, R.W. Anticancer activities of histone deacetylase inhibitors. Nat. Rev. Drug Discov. 2006, 5, 769–784. [Google Scholar] [CrossRef]
- Oehme, I.; Deubzer, H.E.; Wegener, D.; Pickert, D.; Linke, J.P.; Hero, B.; Kopp-Schneider, A.; Westermann, F.; Ulrich, S.M.; Von Deimling, A.; et al. Histone Deacetylase 8 in Neuroblastoma Tumorigenesis. Clin. Cancer Res. 2009, 15, 91–99. [Google Scholar] [CrossRef] [PubMed]
- Heimburg, T.; Kolbinger, F.R.; Zeyen, P.; Ghazy, E.; Herp, D.; Schmidtkunz, K.; Melesina, J.; Shaik, T.B.; Erdmann, F.; Schmidt, M.; et al. Structure-Based Design and Biological Characterization of Selective Histone Deacetylase 8 (HDAC8) Inhibitors with Anti-Neuroblastoma Activity. J. Med. Chem. 2017, 60, 10188–10204. [Google Scholar] [CrossRef]
- Vannini, A.; Volpari, C.; Gallinari, P.; Jones, P.; Mattu, M.; Carfí, A.; Francesco, R.D.; Steinkühler, C.; Marco, S.D. Substrate binding to histone deacetylases as shown by the crystal structure of the HDAC8–substrate complex. EMBO Rep. 2007, 8, 879–884. [Google Scholar] [CrossRef] [PubMed]
- Tamkun, J.W.; Deuring, R.; Scott, M.P.; Kissinger, M.; Pattatucci, A.M.; Kaufman, T.C.; Kennison, J.A. brahma: A regulator of Drosophila homeotic genes structurally related to the yeast transcriptional activator SNF2/SWI2. Cell 1992, 68, 561–572. [Google Scholar] [CrossRef]
- Pérez-Salvia, M.; Esteller, M. Bromodomain inhibitors and cancer therapy: From structures to applications. Epigenetics 2017, 12, 323–339. [Google Scholar] [CrossRef] [PubMed]
- Li, G.-Q.; Guo, W.-Z.; Zhang, Y.; Seng, J.-J.; Zhang, H.-P.; Ma, X.-X.; Zhang, G.; Li, J.; Yan, B.; Tang, H.-W.; et al. Suppression of BRD4 inhibits human hepatocellular carcinoma by repressing MYC and enhancing BIM expression. Oncotarget 2016, 7, 2462. [Google Scholar] [CrossRef]
- McKeown, M.R.; Shaw, D.L.; Fu, H.; Liu, S.; Xu, X.; Marineau, J.J.; Huang, Y.; Zhang, X.; Buckley, D.L.; Kadam, A.; et al. Biased multicomponent reactions to develop novel bromodomain inhibitors. J. Med. Chem. 2014, 57, 9019–9027. [Google Scholar] [CrossRef]
- Mirguet, O.; Gosmini, R.; Toum, J.; Clement, C.A.; Barnathan, M.; Brusq, J.M.; Mordaunt, J.E.; Grimes, R.M.; Crowe, M.; Pineau, O.; et al. Discovery of epigenetic regulator I-BET762: Lead optimization to afford a clinical candidate inhibitor of the BET bromodomains. J. Med. Chem. 2013, 56, 7501–7515. [Google Scholar] [CrossRef]
- Wyce, A.; Ganji, G.; Smitheman, K.N.; Chung, C.-w.; Korenchuk, S.; Bai, Y.; Barbash, O.; Le, B.; Craggs, P.D.; McCabe, M.T.; et al. BET Inhibition Silences Expression of MYCN and BCL2 and Induces Cytotoxicity in Neuroblastoma Tumor Models. PLoS ONE 2013, 8, e72967. [Google Scholar] [CrossRef] [PubMed]
- Peukert, S.; Miller-Moslin, K. Small-Molecule Inhibitors of the Hedgehog Signaling Pathway as Cancer Therapeutics. ChemMedChem 2010, 5, 500–512. [Google Scholar] [CrossRef] [PubMed]
- Nüsslein-volhard, C.; Wieschaus, E. Mutations affecting segment number and polarity in Drosophila. Nature 1980, 287, 795–801. [Google Scholar] [CrossRef] [PubMed]
- Lum, L.; Beachy, P.A. The Hedgehog Response Network: Sensors, Switches, and Routers. Science 2004, 304, 1755–1759. [Google Scholar] [CrossRef] [PubMed]
- Skoda, A.M.; Simovic, D.; Karin, V.; Kardum, V.; Vranic, S.; Serman, L. The role of the Hedgehog signaling pathway in cancer: A comprehensive review. Bosn. J. Basic Med. Sci. 2018, 18, 8. [Google Scholar] [CrossRef] [PubMed]
- Goodrich, L.V.; Scott, M.P. Hedgehog and patched in neural development and disease. Neuron 1998, 21, 1243–1257. [Google Scholar] [CrossRef] [PubMed]
- Siu, L.L.; Papadopoulos, K.; Alberts, S.R.; Kirchoff-Ross, R.; Vakkalagadda, B.; Lang, L.; Ahlers, C.M.; Bennett, K.L.; Tornout, J.M.V. A first-in-human, phase I study of an oral hedgehog (HH) pathway antagonist, BMS-833923 (XL139), in subjects with advanced or metastatic solid tumors. J. Clin. Oncol. 2010, 28, 2501. [Google Scholar] [CrossRef]
- Dlugosz, A.; Agrawal, S.; Kirkpatrick, P. Vismodegib. Nat. Rev. Drug Discov. 2012, 11, 437–438. [Google Scholar] [CrossRef]
- Deshpande, I.; Liang, J.; Hedeen, D.; Roberts, K.J.; Zhang, Y.; Ha, B.; Latorraca, N.R.; Faust, B.; Dror, R.O.; Beachy, P.A.; et al. Smoothened stimulation by membrane sterols drives Hedgehog pathway activity. Nature 2019, 571, 284–288. [Google Scholar] [CrossRef]
- Kavran, J.M.; Ward, M.D.; Oladosu, O.O.; Mulepati, S.; Leahy, D.J. All Mammalian Hedgehog Proteins Interact with Cell Adhesion Molecule, Down-regulated by Oncogenes (CDO) and Brother of CDO (BOC) in a Conserved Manner. J. Biol. Chem. 2010, 285, 24584–24590. [Google Scholar] [CrossRef]
- McCarthy, C.; Walker, E. Tropomyosin receptor kinase inhibitors: A patent update 2009–2013. Expert Opin. Ther. Pat. 2014, 24, 731–734. [Google Scholar] [CrossRef] [PubMed]
- Bailey, J.J.; Jaworski, C.; Tung, D.; Wängler, C.; Wängler, B.; Schirrmacher, R. Tropomyosin receptor kinase inhibitors: An updated patent review for 2016–2019. Expert Opin. Ther. Pat. 2020, 30, 831–849. [Google Scholar] [CrossRef] [PubMed]
- Cocco, E.; Scaltriti, M.; Drilon, A. NTRK fusion-positive cancers and TRK inhibitor therapy. Nat. Rev. Clin. Oncol. 2018, 15, 731–747. [Google Scholar] [CrossRef]
- Saleh, K.; Khalifeh-Saleh, N.; Kourie, H.R. TRK inhibitors: Toward an era of agnostic targeted therapies in oncology. Pharmacogenomics 2019, 20, 927–929. [Google Scholar] [CrossRef] [PubMed]
- Bernard-Gauthier, V.; Aliaga, A.; Aliaga, A.; Boudjemeline, M.; Hopewell, R.; Kostikov, A.; Rosa-Neto, P.; Thiel, A.; Schirrmacher, R. Syntheses and evaluation of carbon-11- and fluorine-18-radiolabeled pan-tropomyosin receptor kinase (Trk) inhibitors: Exploration of the 4-aza-2-oxindole scaffold as Trk PET imaging agents. ACS Chem. Neurosci. 2015, 6, 260–276. [Google Scholar] [CrossRef] [PubMed]
- Morphy, R.; Kay, C.; Rankovic, Z. From magic bullets to designed multiple ligands. Drug Discov. Today 2004, 9, 641–651. [Google Scholar] [CrossRef]
- Li, X.; Li, X.; Liu, F.; Li, S.; Shi, D. Rational Multitargeted Drug Design Strategy from the Perspective of a Medicinal Chemist. J. Med. Chem. 2021, 64, 10581–10605. [Google Scholar] [CrossRef]
- Wang, L.-h.; Evers, A.; Monecke, P.; Naumann, T. Ligand based lead generation—Considering chemical accessibility in rescaffolding approaches via BROOD. J. Cheminformatics 2012, 4, 20. [Google Scholar] [CrossRef]
- McGann, M. FRED and HYBRID docking performance on standardized datasets. J. Comput.-Aided Mol. Des. 2012, 26, 897–906. [Google Scholar] [CrossRef]
- López-Ramos, M.; Perruccio, F. HPPD: Ligand-and Target-Based Virtual Screening on a Herbicide Target. J. Chem. Inf. Model 2010, 50, 801–814. [Google Scholar] [CrossRef]
- Janowski, P.A.; Moriarty, N.W.; Kelley, B.P.; Case, D.A.; York, D.M.; Adams, P.D.; Warren, G.L. Improved ligand geometries in crystallographic refinement using AFITT in PHENIX. Acta Cryst. 2016, 72, 1062–1072. [Google Scholar] [CrossRef]
- VIDA, 5.0.7.0; OpenEye, Cadence Molecular Sciences: Santa Fe, NM, USA, 2024.
- Moitessier, N.; Pottel, J.; Therrien, E.; Englebienne, P.; Liu, Z.; Tomberg, A.; Corbeil, C.R. Medicinal Chemistry Projects Requiring Imaginative Structure-Based Drug Design Methods. Acc. Chem. Res. 2016, 49, 1646–1657. [Google Scholar] [CrossRef] [PubMed]
- Thomsen, R.; Christensen, M.H. MolDock: A New Technique for High-Accuracy Molecular Docking. J. Med. Chem. 2006, 49, 3315–3321. [Google Scholar] [CrossRef] [PubMed]
- Discovery Studio Visualizer, v24.1.0.23298; Dassault Systemes Biovia Corp: Waltham, MA, USA, 2023.
- Samson Software. Protein Aligner. Available online: https://www.uniprot.org/align (accessed on 20 March 2025).
- Martin, T.; Harten, P.; Venkatapathy, R.; Young, D. T.E.S.T., EPA-ORD-CCTE Clowder: Public Domain Dedication, 2021. Available online: https://www.epa.gov/comptox-tools/toxicity-estimation-software-tool-test (accessed on 20 March 2025).
- Parrot, M.; Tajmouati, H.; da Silva, V.B.R.; Atwood, B.R.; Fourcade, R.; Gaston-Mathé, Y.; Do Huu, N.; Perron, Q.; Parrot, M.; Tajmouati, H.; et al. Integrating synthetic accessibility with AI-based generative drug design. J. Cheminformatics 2023, 15. [Google Scholar] [CrossRef]
- OpenEye, Cadence Molecular Sciences. BROOD; OpenEye: Carrboro, NC, USA, 2023. [Google Scholar]
- Horvath, D. Pharmacophore-Based Virtual Screening. Methods Mol. Biol. 2010. [Google Scholar] [CrossRef]
- Korshavn, K.J.; Jang, M.; Kwak, Y.J.; Kochi, A.; Vertuani, S.; Bhunia, A.; Manfredini, S.; Ramamoorthy, A.; Lim, M.H. Reactivity of Metal-Free and Metal-Associated Amyloid-beta with Glycosylated Polyphenols and Their Esterified Derivatives. Sci. Rep. 2015, 5, 17842. [Google Scholar] [CrossRef]


| Target | Shape and Colour | Shape and Electrostatics |
|---|---|---|
| 8b-2 rounds 20a-2 rounds | 8b-2 rounds 20a-2 rounds |
| JQ1-2 rounds I-BET-762-3 rounds | JQ1-2 rounds I-BET-762-3 rounds |
| BMS-833923-2 rounds Vismodegib-2 rounds | BMS-833923-2 rounds Vismodegib-2 rounds |
| GW441759-2 rounds Compound 10-2 rounds | GW441759-2 rounds Compound 10-2 rounds |
| HDACIs (n = 9) | BRDI (n = 8) | HH (n = 10) | TRK (n = 8) |
|---|---|---|---|
| Cluster 22, 1 of 22 | Cluster 3, 1 of 3 | Cluster 4, 1 of 1 | Cluster 12, 1 of 6 |
| Cluster 21, 1 of 11 | Cluster 25, 1 of 12 | Cluster 8, 1 of 1 | Cluster 4, 1 of 5 |
| Cluster 16,1 of 65 | Cluster 16, 1 of 2 | Cluster 1, 1 of 3 | Cluster 8, 1 of 19 |
| Cluster 23, 1 of 1 | Cluster 15, 1 of 2 | Cluster 9, 1 of 1 | Cluster 9, 1 of 4 |
| Cluster 1, 1 of 26 | Cluster 4, 1 of 4 | Cluster 8, 1 of 29 | Cluster 25, 1 of 8 |
| Cluster 7, 1 of 26 | Cluster 24, 1 of 7 | Cluster 21, 1 of 99 | Cluster 12, 1 of 49 |
| Cluster 4, 1 of 28 | Cluster 23, 1 of 1 | Cluster 15, 1 of 6 | Cluster 7, 1 of 11 |
| Cluster 10, 1 of 86 | Cluster 10, 1 of 1 | Cluster 23, 1 of 1 | Cluster 25, 1 of 8 |
| Cluster 12, 1 of 50 | Cluster 17, 1 of 1 | ||
| Cluster 20, 1 of 12 |
| Column 1 | Clusters from Bromodomain (BRD) | AFITT | FRED | AutoDock Vina Extended | Molegro | Fitted |
|---|---|---|---|---|---|---|
| 1 | Cluster 3, 1 of 3 | 0.766 | −6.474 | −8.124 | −4.86 | −25.259 |
| 2 | Cluster 25, 1 of 12 | 0.6863 | −8.315 | −8.549 | 89.3 | −26.775 |
| 3 | Cluster 16, 1 of 2 | 0.7356 | −6.337 | −7.542 | 52.9 | −21.687 |
| 4 | Cluster 15, 1 of 2 | 0.553 | −5.308 | −7.048 | 33.28 | −23.624 |
| 5 | Cluster 4, 1 of 4 | 0.4898 | −5.693 | −8.403 | 36.98 | −25.566 |
| 6 | Cluster 24, 1 of 7 | 0.4644 | −8.556 | −8.909 | 80.89 | −30.289 |
| 7 | Cluster 23, 1 of 1 | 0.497 | −5.955 | −7.795 | 9.34 | −24.131 |
| 8 | Cluster 10, 1 of 1 | 0.7103 | −4.672 | −7.71 | 5.23 | −21.734 |
| 9 | BET-762-Lead compound | 0.6691 | −7.528 | −7.971 | 49.84 | −19.709 |
| 10 | JQ1-Lead compound | 0.6084 | −8.133 | −7.006 | 99.29 | −22.161 |
| Clusters HDACs | AFITT | Clusters BRD | AFITT | Clusters HH | AFITT | Clusters Tropomyosin | AFITT | ||||
|---|---|---|---|---|---|---|---|---|---|---|---|
| 2V5X | 2V5W | 4BJX | 5UY9 | 5L7I | 3N1P | 4AT3 | 3V5Q | ||||
| Cluster 22, 1 of 22 | 0.652 | 0.541 | Cluster 3, 1 of 3 | 0.77 | 0.42 | Cluster 4, 1 of 1 | 0.552 | 0.336 | Cluster 12, 1 of 6 | 0.638 | 0.438 |
| Cluster 21, 1 of 11 | 0.650 | 0.499 | Cluster 25, 1 of 12 | 0.69 | 0.39 | Cluster 8, 1 of 1 | 0.514 | 0.385 | Cluster 4, 1 of 5 | 0.685 | 0.438 |
| Cluster 16,1 of 65 | 0.650 | 0.541 | Cluster 16, 1 of 2 | 0.74 | 0.33 | Cluster 1, 1 of 3 | 0.521 | 0.330 | Cluster 8, 1 of 19 | 0.435 | 0.438 |
| Cluster 23, 1 of 1 | 0.645 | 0.532 | Cluster 15, 1 of 2 | 0.55 | 0.39 | Cluster 9, 1 of 1 | 0.513 | 0.404 | Cluster 9, 1 of 4 | 0.622 | 0.539 |
| Cluster 1, 1 of 26 | 0.642 | 0.504 | Cluster 4, 1 of 4 | 0.49 | 0.33 | Cluster 8, 1 of 29 | 0.496 | 0.432 | Cluster 25, 1 of 8 | 0.675 | 0.521 |
| Cluster 7, 1 of 26 | 0.635 | 0.527 | Cluster 24, 1 of 7 | 0.46 | 0.37 | Cluster 21, 1 of 99 | 0.493 | 0.340 | Cluster 12, 1 of 49 | 0.630 | 0.627 |
| Cluster 4, 1 of 28 | 0.633 | 0.499 | Cluster 23, 1 of 1 | 0.50 | 0.37 | Cluster 15, 1 of 6 | 0.491 | 0.374 | Cluster 7, 1 of 11 | 0.643 | 0.596 |
| Cluster 10, 1 of 86 | 0.632 | 0.517 | Cluster 10, 1 of 1 | 0.71 | 0.37 | Cluster 23, 1 of 1 | 0.478 | 0.470 | Cluster 25, 1 of 11 | 0.491 | 0.614 |
| Cluster 12, 1 of 50 | 0.631 | 0.524 | BET-762 | 0.67 | 0.39 | Cluster 17, 1 of 1 | 0.471 | 0.364 | Compound Z9 | 0.596 | 0.543 |
| 20A | 0.631 | 0.511 | JQ1 | 0.61 | 0.41 | Cluster 20, 1 of 12 | 0.463 | 0.389 | Compound 10 | 0.560 | 0.505 |
| 8B | 0.629 | 0.516 | Vesmodigib | 0.363 | 0.363 | ||||||
| BMS-833923 | 0.313 |
| HDACIs (n = 2) | BRDI (n = 2) | HH (n = 2) | TRK (n = 2) |
|---|---|---|---|
| Cluster 22, 1 of 22 | Cluster 3, 1 of 3 | Cluster 8, 1 of 1 | Cluster 25, 1 of 8 |
| Cluster 10, 1 of 86 | Cluster 16, 1 of 2 | Cluster 8, 1 of 29 | Cluster 12, 1 of 49 |
| Clusters | Bioconcentration Factor 1 | Mutagenicity 2 | Oral rat LD50 -Log10 (mol/kg) 3 | T. Pyriformis IGC50 (48 h) mg/L 4 |
|---|---|---|---|---|
| Cluster 22, 1 of 22 | 0.31 | Positive | 1.78 | 3845.78 |
| Cluster 10, 1 of 86 | 5.56 | Positive | 2.67 | 173.52 |
| Cluster 3, 1 of 3 | 12.71 | Positive | 2.52 | 4.61 |
| Cluster 16, 1 of 2 | 46.62 | Negative | 2.66 | 1.91 |
| Cluster 8, 1 of 1 | 27.88 | Negative | 1.70 | 6.33 |
| Cluster 8, 1 of 29 | 8.62 | N/A | 2.52 | N/A |
| Cluster 25, 1 of 8 | 98.26 | Positive | 2.01 | 6.55 |
| Cluster 12, 1 of 49 | 308.45 | Negative | 2.41 | 6.46 |
| 20A | 9.94 | Positive | N/A | 36.39 |
| 8B | 5.14 | Positive | N/A | 29.50 |
| BET-762 | 22.21 | Negative | 2.26 | 2.27 |
| JQ1 | 235.52 | Negative | 2.45 | 0.73 |
| Vesmodigib | 28.48 | Negative | 2.13 | 2.87 |
| BMS-833923 | 11.53 | Positive | 2.38 | N/A |
| Compound Z9 | 25.14 | Positive | 2.20 | 42.96 |
| Compound 10 | 20.85 | Positive | 2.65 | 7.04 |
Disclaimer/Publisher’s Note: The statements, opinions and data contained in all publications are solely those of the individual author(s) and contributor(s) and not of MDPI and/or the editor(s). MDPI and/or the editor(s) disclaim responsibility for any injury to people or property resulting from any ideas, methods, instructions or products referred to in the content. |
© 2025 by the authors. Licensee MDPI, Basel, Switzerland. This article is an open access article distributed under the terms and conditions of the Creative Commons Attribution (CC BY) license (https://creativecommons.org/licenses/by/4.0/).
Share and Cite
Gerges, A.; Canning, U. High-Risk Neuroblastoma Stage 4 (NBS4): Developing a Medicinal Chemistry Multi-Target Drug Approach. Molecules 2025, 30, 2211. https://doi.org/10.3390/molecules30102211
Gerges A, Canning U. High-Risk Neuroblastoma Stage 4 (NBS4): Developing a Medicinal Chemistry Multi-Target Drug Approach. Molecules. 2025; 30(10):2211. https://doi.org/10.3390/molecules30102211
Chicago/Turabian StyleGerges, Amgad, and Una Canning. 2025. "High-Risk Neuroblastoma Stage 4 (NBS4): Developing a Medicinal Chemistry Multi-Target Drug Approach" Molecules 30, no. 10: 2211. https://doi.org/10.3390/molecules30102211
APA StyleGerges, A., & Canning, U. (2025). High-Risk Neuroblastoma Stage 4 (NBS4): Developing a Medicinal Chemistry Multi-Target Drug Approach. Molecules, 30(10), 2211. https://doi.org/10.3390/molecules30102211