
Molecular Recognition of SARS-CoV-2 Mpro Inhibitors: Insights from Cheminformatics and Quantum Chemistry


Abstract
1. Introduction
2. Results and Discussion
2.1. Data Mining and Classification of Mpro Inhibitors
2.2. Cheminformatics Analysis of Mpro Inhibitors
2.2.1. Molecular Descriptors: A Comparative Analysis of Covalent vs. Non-Covalent Inhibitors
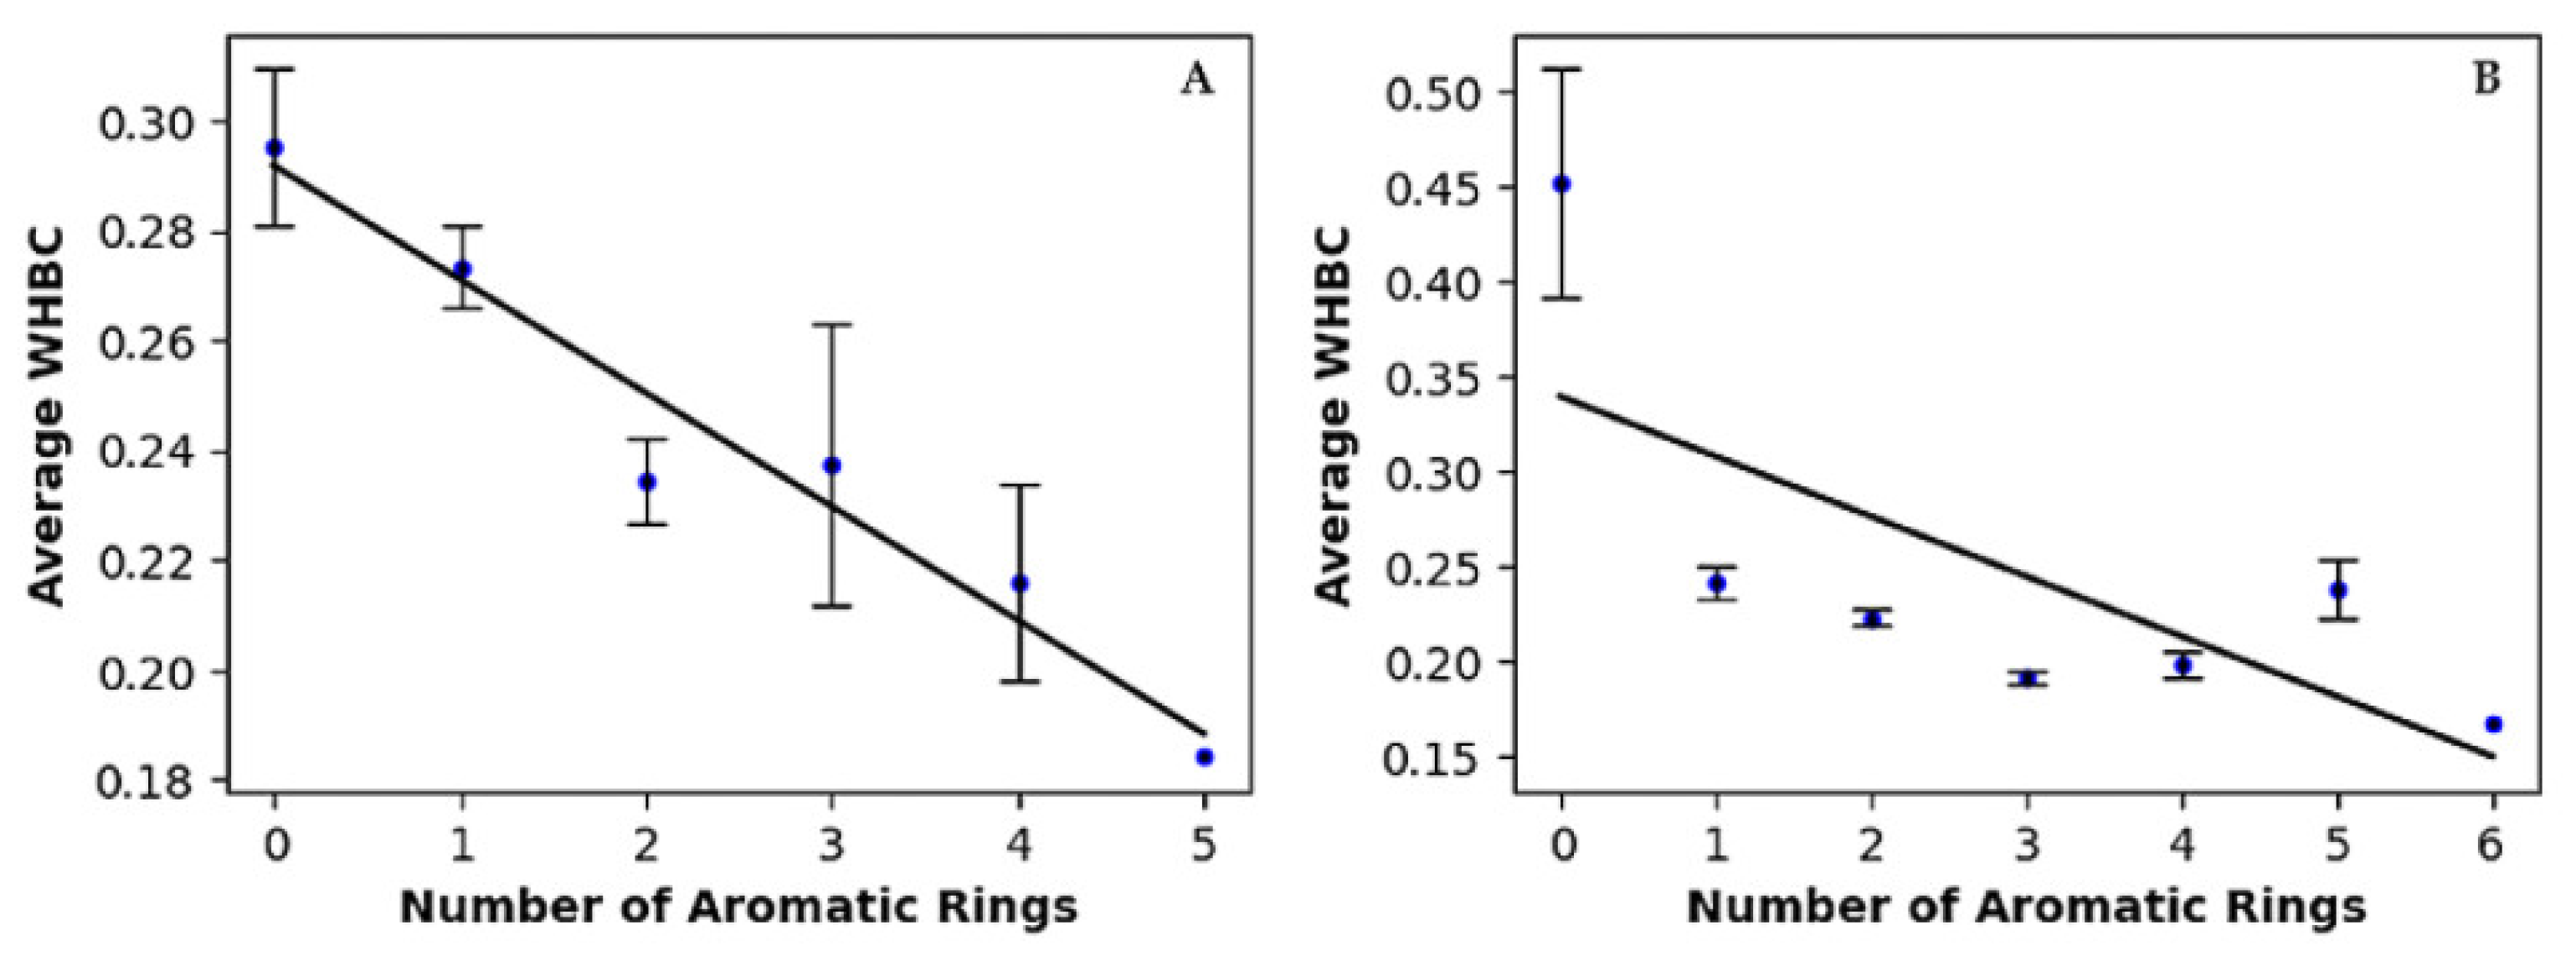
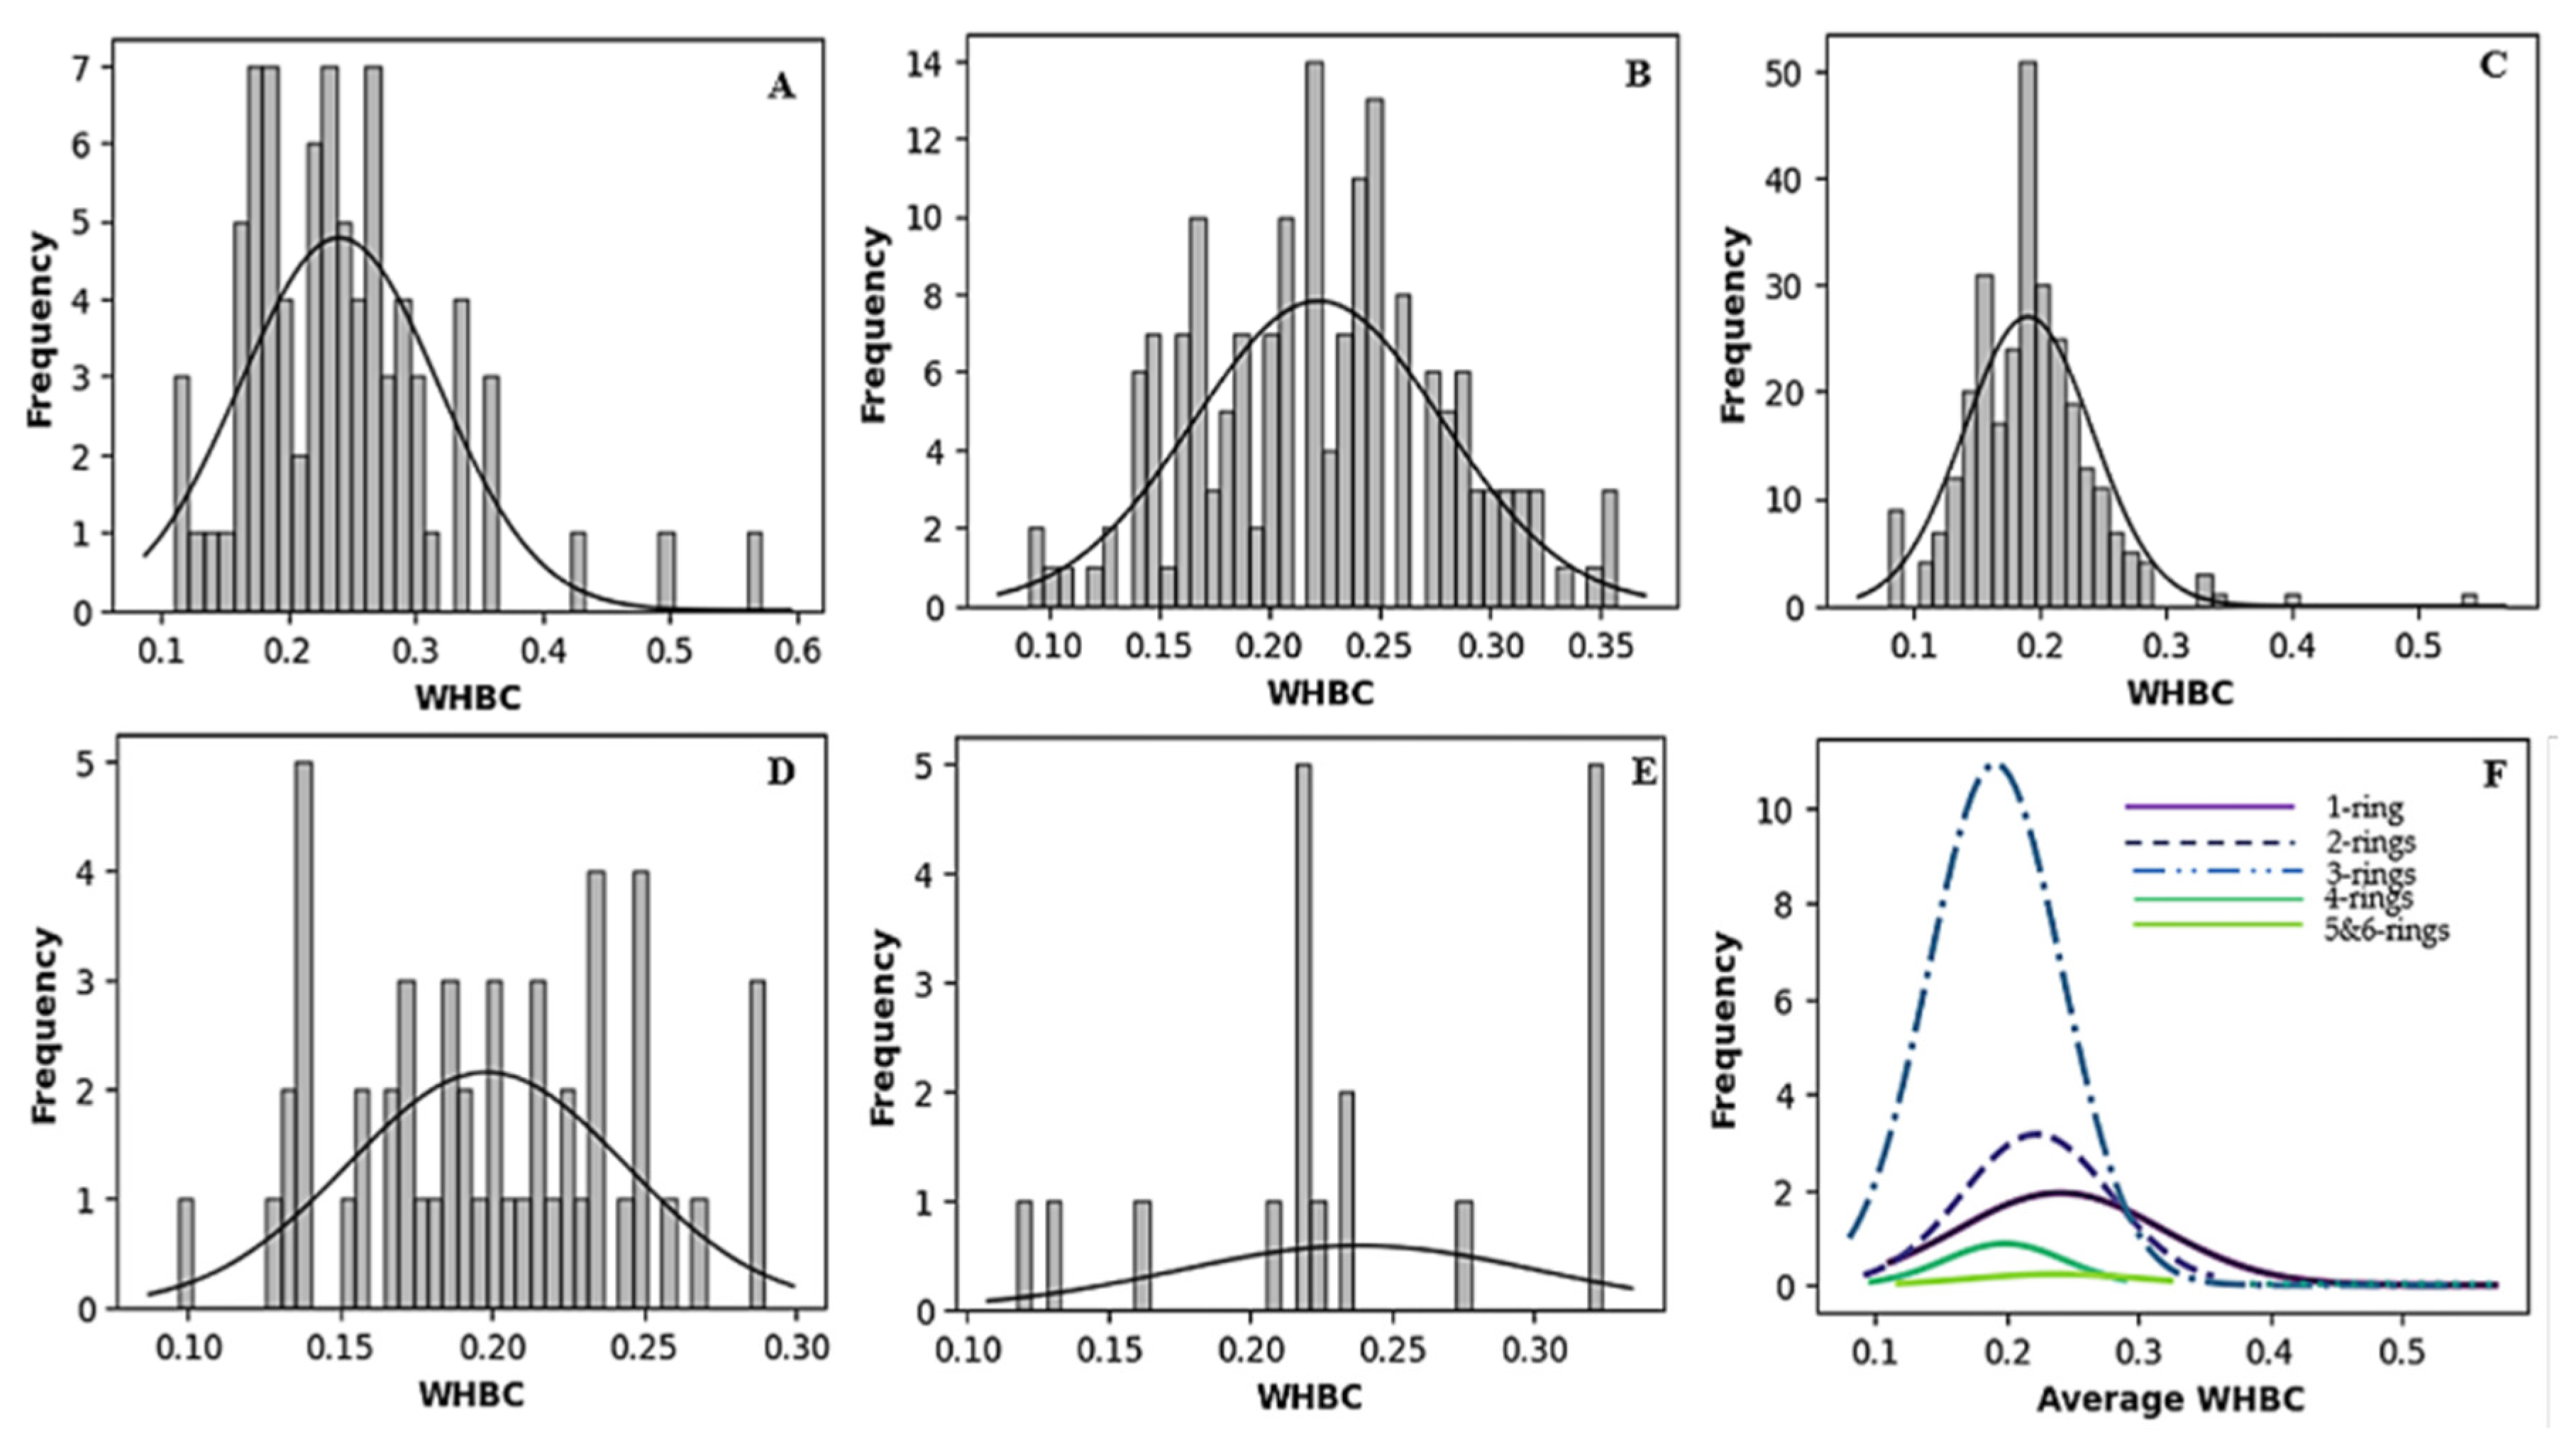
2.2.2. Relationship Between Aromatic Rings and Hydrogen Bonds
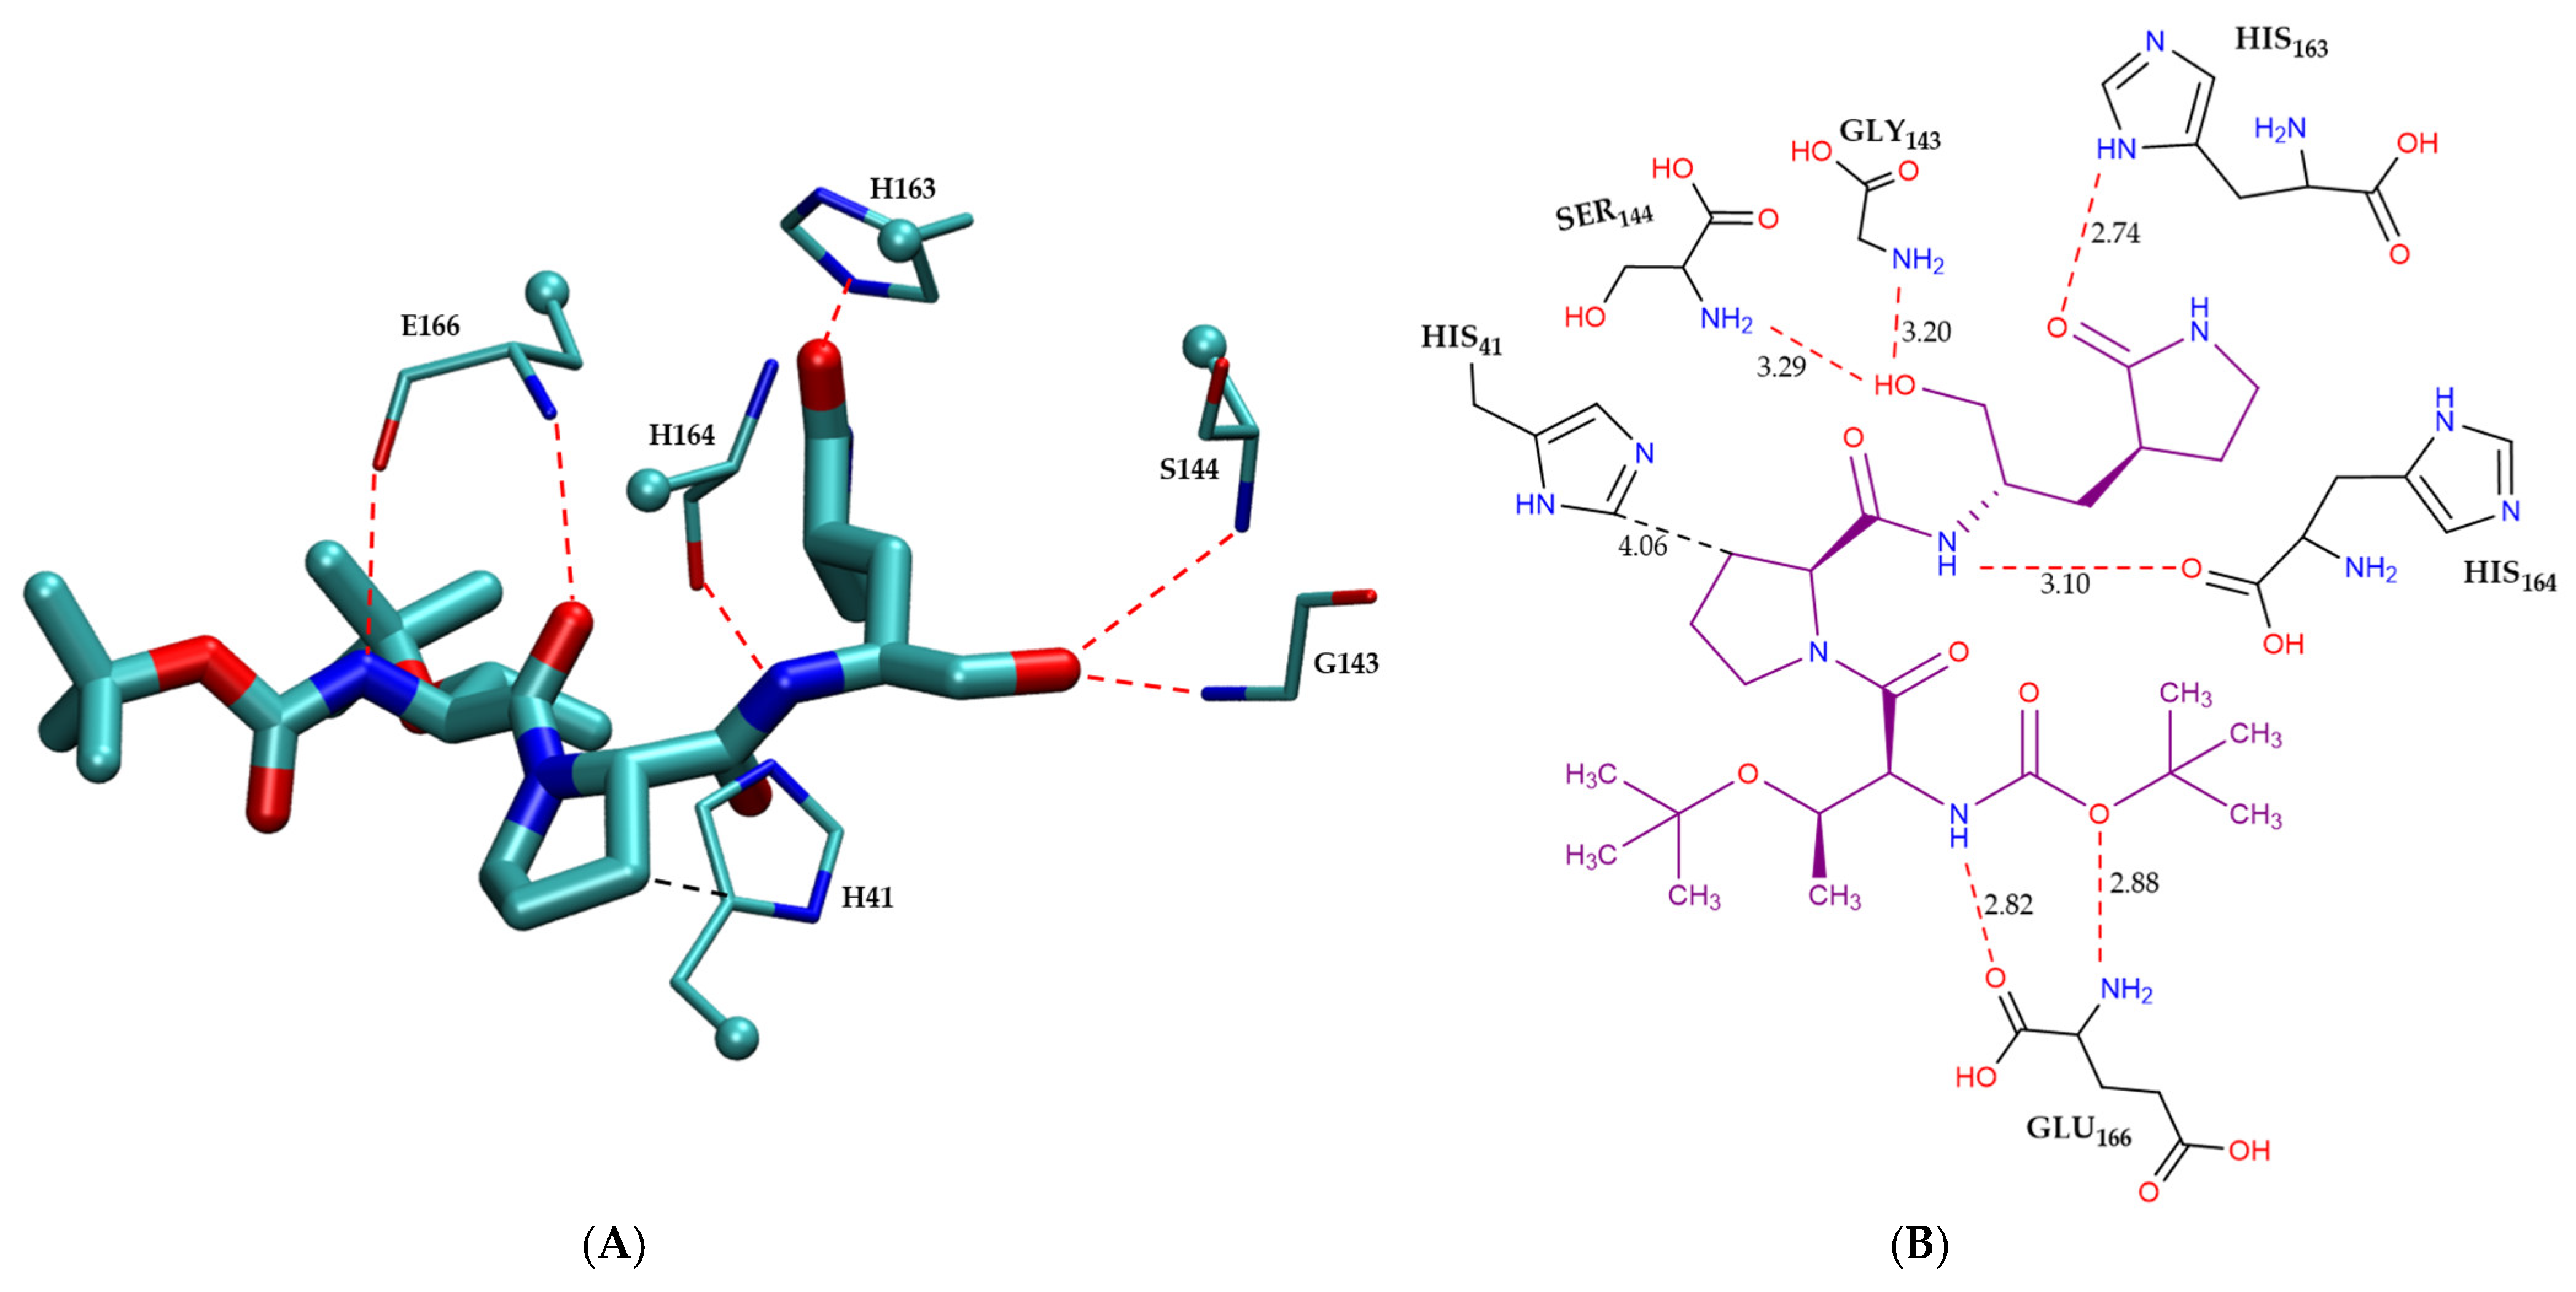
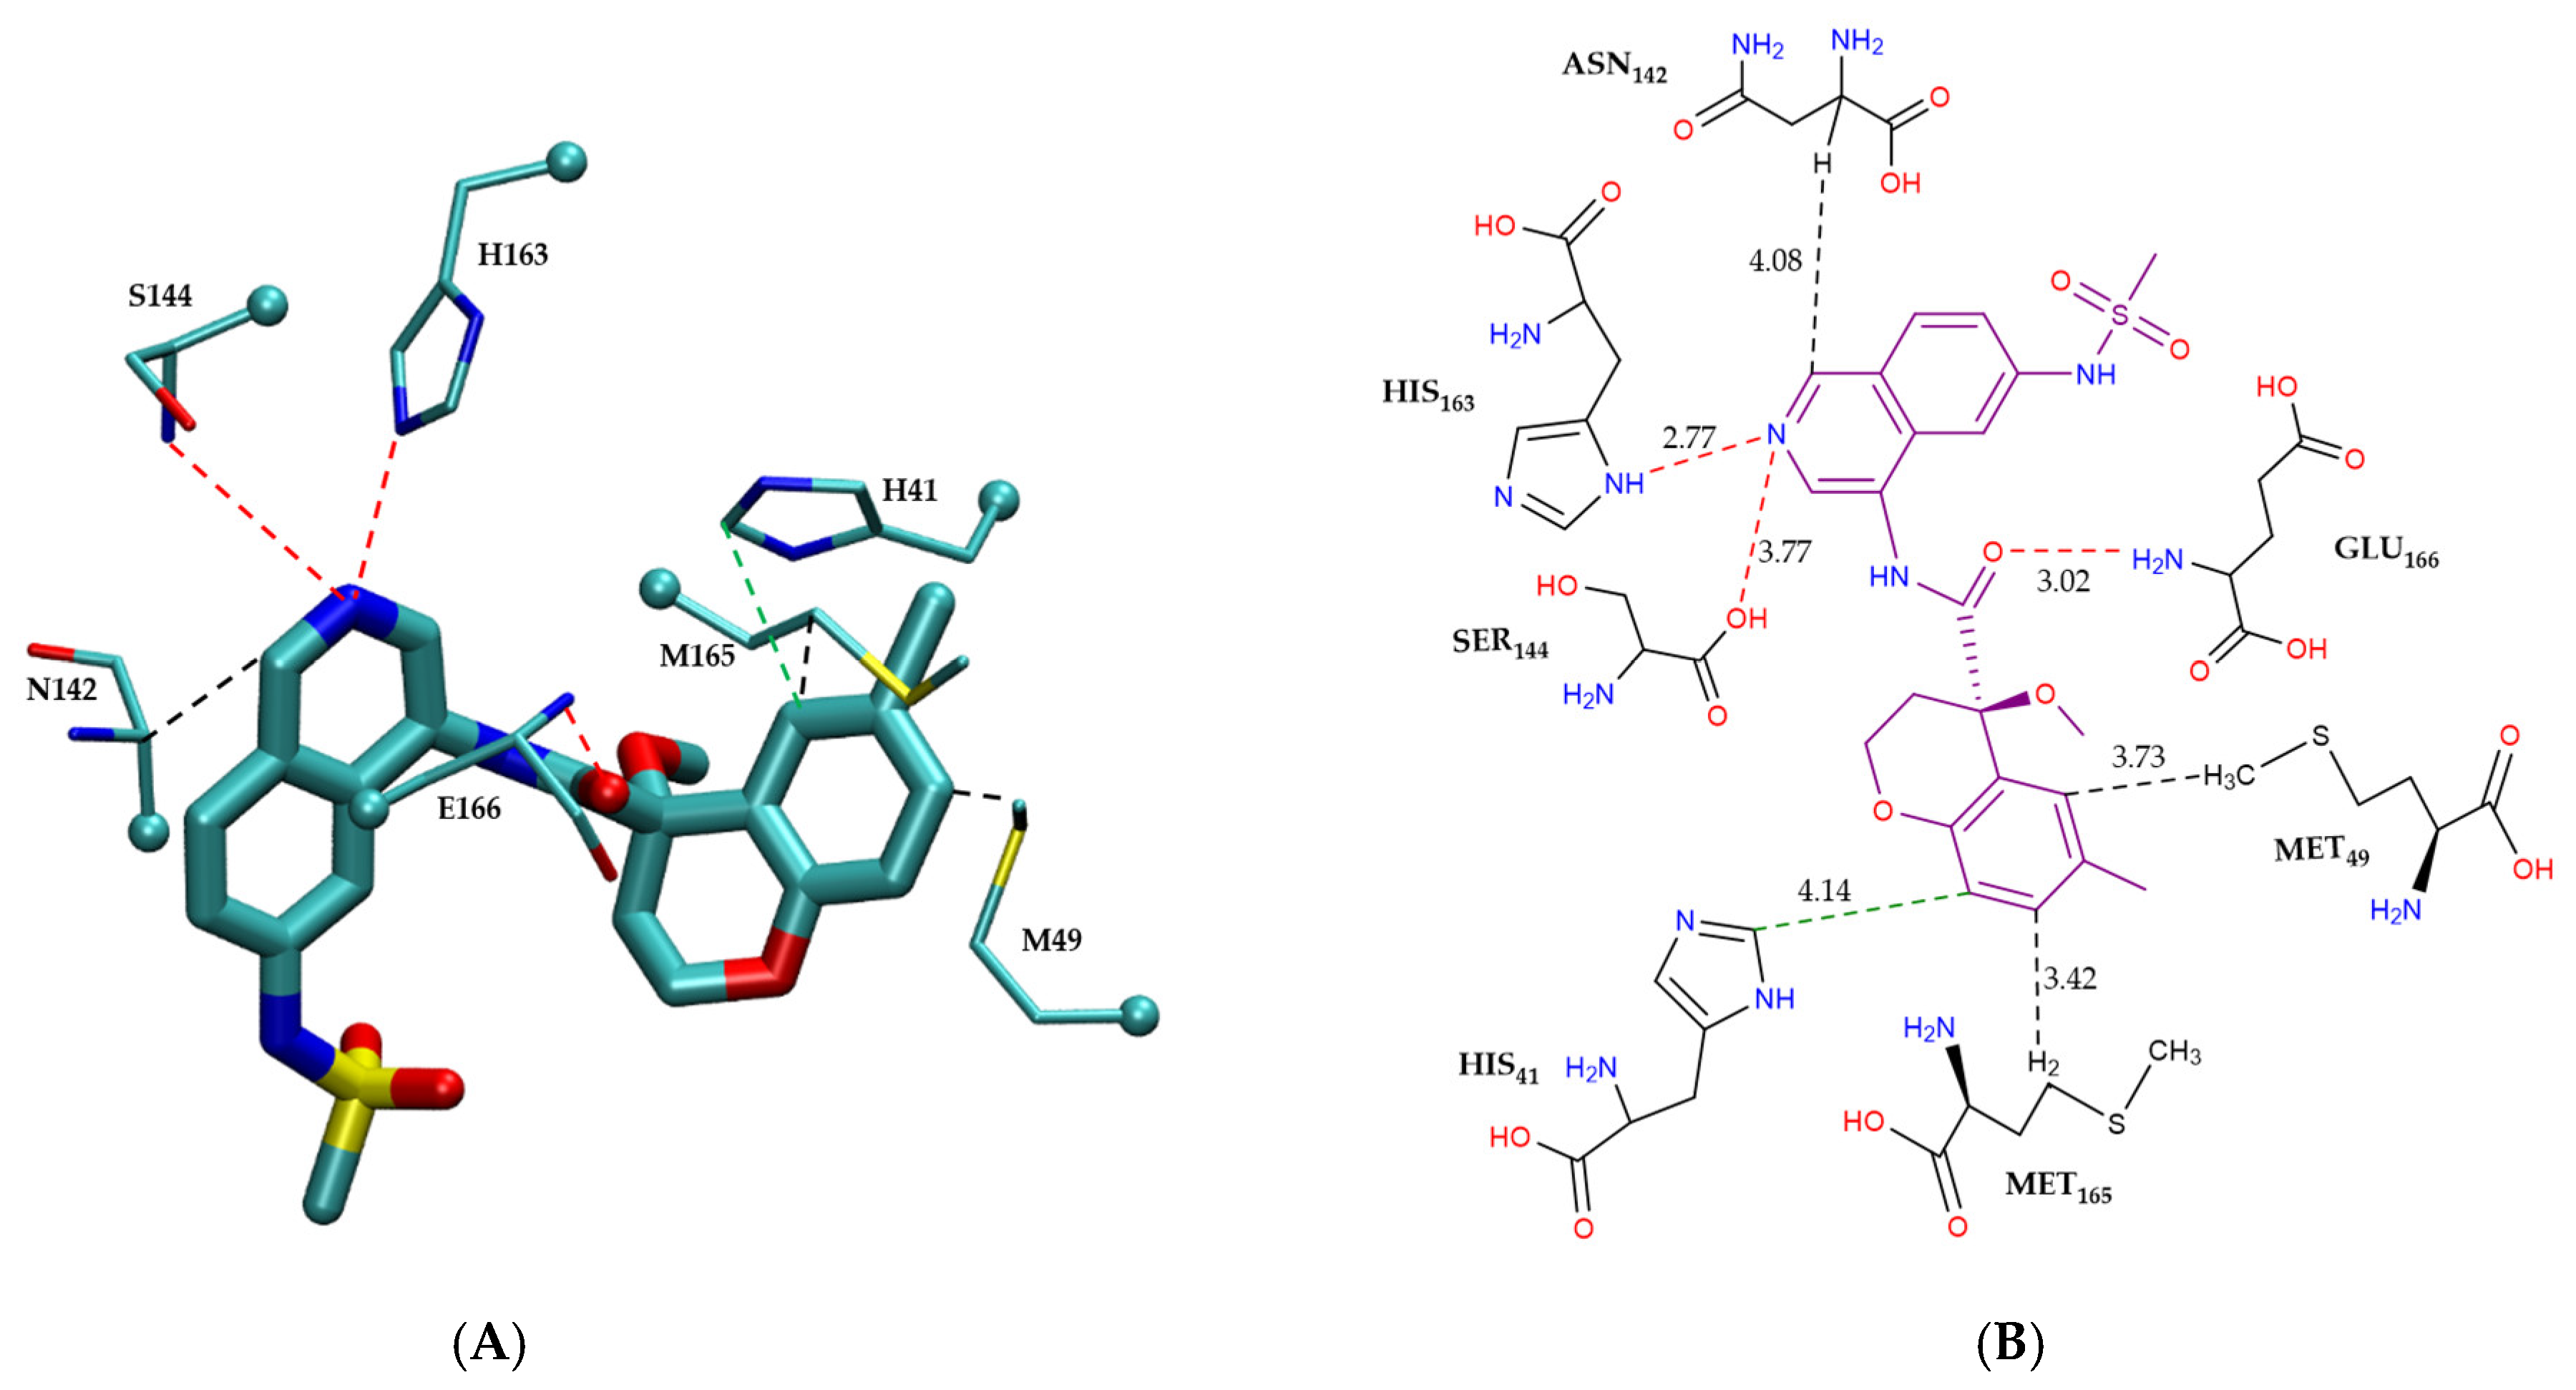
2.3. Binding Modes of Covalent and Non-Covalent Inhibitors
2.3.1. Comparative Analysis of Binding Modes
Covalent Inhibitor Pharmacophore Model
Non-Covalent Inhibitor Pharmacophore Model
3. Theory and Methods
3.1. Data Mining of Mpro Inhibitors
3.2. Cheminformatics Analysis: Molecular Descriptors
3.3. Quantum Chemical Calculations of Intermolecular Interaction Energies
4. Conclusions
4.1. Major Findings and Comparative Insights
4.2. Pharmacophore Models
- Covalent Inhibitor Pharmacophore ModelThe covalent pharmacophore is characterized by:
- Covalent anchor point for nucleophilic attack by Cys145 (e.g., nitrile, aldehyde, or α-ketoamide warheads);
- Hydrogen bond cluster involving polar groups interacting with backbone atoms of residues G143, S144, H164, and E166, stabilizing ligand positioning;
- N-heteroaromatic ring enabling a directional hydrogen bond with the side chain of H163;
- Auxiliary hydrophobic motif capable of CH–π interaction with H41 to enhance hydrophobic stabilization.
- Non-Covalent Inhibitor Pharmacophore ModelThe non-covalent pharmacophore emphasizes:
- Aromatic scaffold flanking an amide linker, providing π–π stacking with H41 and CH–π interactions with M49 and M165;
- Amide linker functionality forming hydrogen bonds with E166, a conserved interaction point for ligand anchoring;
- N-heteroaromatic ring engaging in both CH–π interaction with N142 and hydrogen bonding with S144 and H163;
- Balanced π-stacking and polar features, allowing strong yet reversible binding optimized for selectivity and bioavailability.
4.3. Implications for Rational Drug Design
Supplementary Materials
Author Contributions
Funding
Institutional Review Board Statement
Informed Consent Statement
Data Availability Statement
Acknowledgments
Conflicts of Interest
References
- Ng, T.I.; Correia, I.; Seagal, J.; DeGoey, D.A.; Schrimpf, M.R.; Hardee, D.J.; Noey, E.L.; Kati, W.M. Antiviral drug discovery for the treatment of COVID-19 infections. Viruses 2022, 14, 961. [Google Scholar] [CrossRef] [PubMed]
- Chakraborty, C.; Bhattacharya, M.; Mallick, B.; Sharma, A.R.; Lee, S.S.; Agoramoorthy, G. SARS-CoV-2 protein drug targets landscape: A potential pharmacological insight view for the new drug development. Expert Rev. Clin. Pharmacol. 2021, 14, 225–237. [Google Scholar] [CrossRef] [PubMed]
- Hu, Q.; Xiong, Y.; Zhu, G.H.; Zhang, Y.N.; Zhang, Y.W.; Huang, P.; Ge, G.B. The SARS-CoV-2 main protease (Mpro): Structure, function, and emerging therapies for COVID-19. Medcomm 2022, 3, e151. [Google Scholar] [CrossRef]
- Duan, Y.K.; Wang, H.F.; Yuan, Z.H.; Yang, H.T. Structural biology of SARS-CoV-2 Mpro and drug discovery. Curr. Opin. Struct. Biol. 2023, 82, 102667. [Google Scholar] [CrossRef]
- Huang, C.; Shuai, H.; Qiao, J.; Hou, Y.; Zeng, R.; Xia, A.; Xie, L.; Fang, Z.; Li, Y.; Yoon, C. A new generation Mpro inhibitor with potent activity against SARS-CoV-2 Omicron variants. Signal Transduct. Target. Ther. 2023, 8, 128. [Google Scholar] [CrossRef]
- Amin, S.A.; Banerjee, S.; Ghosh, K.; Gayen, S.; Jha, T. Protease targeted COVID-19 drug discovery and its challenges: Insight into viral main protease (Mpro) and papain-like protease (PLpro) inhibitors. Bioorganic Med. Chem. 2021, 29, 115860. [Google Scholar] [CrossRef] [PubMed]
- Jin, Z.; Du, X.; Xu, Y.; Deng, Y.; Liu, M.; Zhao, Y.; Zhang, B.; Li, X.; Zhang, L.; Peng, C. Structure of Mpro from SARS-CoV-2 and discovery of its inhibitors. Nature 2020, 582, 289–293. [Google Scholar] [CrossRef]
- Narwal, M.; Armache, J.-P.; Edwards, T.J.; Murakami, K.S. SARS-CoV-2 polyprotein substrate regulates the stepwise Mpro cleavage reaction. J. Biol. Chem. 2023, 299, 104697. [Google Scholar] [CrossRef]
- Chen, S.A.; Arutyunova, E.; Lu, J.; Khan, M.B.; Rut, W.; Zmudzinski, M.; Shahbaz, S.; Iyyathurai, J.; Moussa, E.W.; Turner, Z. SARS-CoV-2 Mpro protease variants of concern display altered viral substrate and cell host target Galectin-8 processing but retain sensitivity toward antivirals. ACS Cent. Sci. 2023, 9, 696–708. [Google Scholar] [CrossRef]
- Tan, B.; Joyce, R.; Tan, H.; Hu, Y.; Wang, J. SARS-CoV-2 Main Protease Drug Design, Assay Development, and Resistance Studies. Acc. Chem. Res. 2022, 56, 157–168. [Google Scholar] [CrossRef]
- Sacco, M.D.; Ma, C.; Lagarias, P.; Gao, A.; Townsend, J.A.; Meng, X.; Dube, P.; Zhang, X.; Hu, Y.; Kitamura, N. Structure and inhibition of the SARS-CoV-2 main protease reveal strategy for developing dual inhibitors against Mpro and cathepsin L. Sci. Adv. 2020, 6, eabe0751. [Google Scholar] [CrossRef] [PubMed]
- Shawky, A.M.; Almalki, F.A.; Alzahrani, H.A.; Abdalla, A.N.; Youssif, B.G.M.; Ibrahim, N.A.; Gamal, M.; El-Sherief, H.A.M.; Abdel-Fattah, M.M.; Hefny, A.A.; et al. Covalent small-molecule inhibitors of SARS-CoV-2 Mpro: Insights into their design, classification, biological activity, and binding interactions. Eur. J. Med. Chem. 2024, 277, 116704. [Google Scholar] [CrossRef] [PubMed]
- Baillie, T.A. Targeted Covalent Inhibitors for Drug Design. Angew. Chem. Int. Ed. 2016, 55, 13408–13421. [Google Scholar] [CrossRef]
- Zhang, L.; Lin, D.; Sun, X.; Curth, U.; Drosten, C.; Sauerhering, L.; Becker, S.; Rox, K.; Hilgenfeld, R. Crystal structure of SARS-CoV-2 main protease provides a basis for design of improved α-ketoamide inhibitors. Science 2020, 368, 409–412. [Google Scholar] [CrossRef] [PubMed]
- Hengphasatporn, K.; Harada, R.; Wilasluck, P.; Deetanya, P.; Sukandar, E.R.; Chavasiri, W.; Suroengrit, A.; Boonyasuppayakorn, S.; Rungrotmongkol, T.; Wangkanont, K. Promising SARS-CoV-2 main protease inhibitor ligand-binding modes evaluated using LB-PaCS-MD/FMO. Sci. Rep. 2022, 12, 17984. [Google Scholar] [CrossRef]
- Owen, D.R.; Allerton, C.M.; Anderson, A.S.; Aschenbrenner, L.; Avery, M.; Berritt, S.; Boras, B.; Cardin, R.D.; Carlo, A.; Coffman, K.J. An oral SARS-CoV-2 Mpro inhibitor clinical candidate for the treatment of COVID-19. Science 2021, 374, 1586–1593. [Google Scholar] [CrossRef]
- Unoh, Y.; Uehara, S.; Nakahara, K.; Nobori, H.; Yamatsu, Y.; Yamamoto, S.; Maruyama, Y.; Taoda, Y.; Kasamatsu, K.; Suto, T. Discovery of S-217622, a noncovalent oral SARS-CoV-2 3CL protease inhibitor clinical candidate for treating COVID-19. J. Med. Chem. 2022, 65, 6499–6512. [Google Scholar] [CrossRef]
- Narayanan, A.; Narwal, M.; Majowicz, S.A.; Varricchio, C.; Toner, S.A.; Ballatore, C.; Brancale, A.; Murakami, K.S.; Jose, J. Identification of SARS-CoV-2 inhibitors targeting Mpro and PLpro using in-cell-protease assay. Commun. Biol. 2022, 5, 169. [Google Scholar] [CrossRef]
- Hu, Y.M.; Lewandowski, E.M.; Tan, H.Z.; Zhang, X.M.; Morgan, R.T.; Zhang, X.J.; Jacobs, L.M.C.; Butler, S.G.; Gongora, M.V.; Choy, J.; et al. Naturally Occurring Mutations of SARS-CoV-2 Main Protease Confer Drug Resistance to Nirmatrelvir. Acs Cent. Sci. 2023, 9, 1658–1669. [Google Scholar] [CrossRef]
- Todeschini, R.; Consonni, V. Handbook of Molecular Descriptors; John Wiley & Sons: Hoboken, NJ, USA, 2008. [Google Scholar]
- Lipinski, C.A.; Lombardo, F.; Dominy, B.W.; Feeney, P.J. Experimental and computational approaches to estimate solubility and permeability in drug discovery and development settings. Adv. Drug Deliv. Rev. 1997, 23, 3–25. [Google Scholar] [CrossRef]
- Veber, D.F.; Johnson, S.R.; Cheng, H.-Y.; Smith, B.R.; Ward, K.W.; Kopple, K.D. Molecular properties that influence the oral bioavailability of drug candidates. J. Med. Chem. 2002, 45, 2615–2623. [Google Scholar] [CrossRef] [PubMed]
- Persch, E.; Dumele, O.; Diederich, F. Molecular recognition in chemical and biological systems. Angew. Chem. Int. Ed. 2015, 54, 3290–3327. [Google Scholar] [CrossRef] [PubMed]
- Bissantz, C.; Kuhn, B.; Stahl, M. A medicinal chemist’s guide to molecular interactions. J. Med. Chem. 2010, 53, 5061–5084. [Google Scholar] [CrossRef]
- Hunter, C.A.; Singh, J.; Thornton, J.M. π-π interactions: The geometry and energetics of phenylalanine-phenylalanine interactions in proteins. J. Mol. Biol. 1991, 218, 837–846. [Google Scholar] [CrossRef] [PubMed]
- Nishio, M.; Umezawa, Y.; Fantini, J.; Weiss, M.S.; Chakrabarti, P. CH–π hydrogen bonds in biological macromolecules. Phys. Chem. Chem. Phys. 2014, 16, 12648–12683. [Google Scholar] [CrossRef]
- Gallivan, J.P.; Dougherty, D.A. Cation-π interactions in structural biology. Proc. Natl. Acad. Sci. USA 1999, 96, 9459–9464. [Google Scholar] [CrossRef]
- Mohan, N.; Vijayalakshmi, K.P.; Koga, N.; Suresh, C.H. Comparison of aromatic NH··· π, OH··· π, and CH··· π interactions of alanine using MP2, CCSD, and DFT methods. J. Comput. Chem. 2010, 31, 2874–2882. [Google Scholar] [CrossRef]
- Ringer, A.L.; Senenko, A.; Sherrill, C.D. Models of S/π interactions in protein structures: Comparison of the H2S–benzene complex with PDB data. Protein Sci. 2007, 16, 2216–2223. [Google Scholar] [CrossRef]
- Tsuzuki, S.; Honda, K.; Uchimaru, T.; Mikami, M.; Tanabe, K. Origin of the Attraction and Directionality of the NH/π Interaction: Comparison with OH/π and CH/π Interactions. J. Am. Chem. Soc. 2000, 122, 11450–11458. [Google Scholar] [CrossRef]
- Zhu, Y.; Alqahtani, S.; Hu, X.C. An Assessment of Dispersion-Corrected DFT Methods for Modeling Nonbonded Interactions in Protein Kinase Inhibitor Complexes. Molecules 2024, 29, 304. [Google Scholar] [CrossRef]
- Berman, H.M.; Westbrook, J.; Feng, Z.; Gilliland, G.; Bhat, T.N.; Weissig, H.; Shindyalov, I.N.; Bourne, P.E. The protein data bank. Nucleic Acids Res. 2000, 28, 235–242. [Google Scholar] [CrossRef] [PubMed]
- RDKit: Open-Source Cheminformatics. Version Release_2024_09. Available online: http://www.rdkit.org (accessed on 5 May 2025).
- Sander, T.; Freyss, J.; Von Korff, M.; Rufener, C. DataWarrior: An open-source program for chemistry aware data visualization and analysis. J. Chem. Inf. Model. 2015, 55, 460–473. [Google Scholar] [CrossRef] [PubMed]
- Mauri, A.; Consonni, V.; Pavan, M.; Todeschini, R. Dragon software: An easy approach to molecular descriptor calculations. Match 2006, 56, 237–248. [Google Scholar]
- Zhu, Y.; Alqahtani, S.; Hu, X. Aromatic rings as molecular determinants for the molecular recognition of protein kinase inhibitors. Molecules 2021, 26, 1776. [Google Scholar] [CrossRef]
- Yoshida, F.; Topliss, J.G. QSAR model for drug human oral bioavailability. J. Med. Chem. 2000, 43, 2575–2585. [Google Scholar] [CrossRef] [PubMed]
- Monteleone, S.; Fuchs, J.E.; Liedl, K.R. Molecular connectivity predefines polypharmacology: Aliphatic rings, chirality, and sp3 centers enhance target selectivity. Front. Pharmacol. 2017, 8, 552. [Google Scholar] [CrossRef]
- Jafarzadegan, M.; Safi-Esfahani, F.; Beheshti, Z. Combining hierarchical clustering approaches using the PCA method. Expert Syst. Appl. 2019, 137, 1–10. [Google Scholar] [CrossRef]
- Stefanelli, I.; Corona, A.; Cerchia, C.; Cassese, E.; Improta, S.; Costanzi, E.; Pelliccia, S.; Morasso, S.; Esposito, F.; Paulis, A. Broad-spectrum coronavirus 3C-like protease peptidomimetic inhibitors effectively block SARS-CoV-2 replication in cells: Design, synthesis, biological evaluation, and X-ray structure determination. Eur. J. Med. Chem. 2023, 253, 115311. [Google Scholar] [CrossRef]
- Boby, M.L.; Fearon, D.; Ferla, M.; Filep, M.; Koekemoer, L.; Robinson, M.C.; Consortium, C.M.; Chodera, J.D.; Lee, A.A.; London, N. Open science discovery of potent noncovalent SARS-CoV-2 main protease inhibitors. Science 2023, 382, eabo7201. [Google Scholar] [CrossRef]
- Humphrey, W.; Dalke, A.; Schulten, K. VMD: Visual molecular dynamics. J. Mol. Graph. 1996, 14, 33–38. [Google Scholar] [CrossRef]
- Flynn, J.M.; Samant, N.; Schneider-Nachum, G.; Barkan, D.T.; Yilmaz, N.K.; Schiffer, C.A.; Moquin, S.A.; Dovala, D.; Bolon, D.N. Comprehensive fitness landscape of SARS-CoV-2 Mpro reveals insights into viral resistance mechanisms. Elife 2022, 11, e77433. [Google Scholar] [CrossRef] [PubMed]
- Zhang, W.F.; Lin, S.X. Search of Novel Small Molecule Inhibitors for the Main Protease of SARS-CoV-2. Viruses 2023, 15, 580. [Google Scholar] [CrossRef] [PubMed]
- Shitrit, A.; Zaidman, D.; Kalid, O.; Bloch, I.; Doron, D.; Yarnizky, T.; Buch, I.; Segev, I.; Ben-Zeev, E.; Segev, E. Conserved interactions required for inhibition of the main protease of severe acute respiratory syndrome coronavirus 2 (SARS-CoV-2). Sci. Rep. 2020, 10, 20808. [Google Scholar] [CrossRef]
- Duong, C.Q.; Nguyen, P.T.V. Exploration of SARS-CoV-2 Mpro Noncovalent Natural Inhibitors Using Structure-Based Approaches. Acs Omega 2023, 8, 6679–6688. [Google Scholar] [CrossRef] [PubMed]
- Mao, L.; Wang, Y.; Liu, Y.; Hu, X. Multiple intermolecular interaction modes of positively charged residues with adenine in ATP-binding proteins. J. Am. Chem. Soc. 2003, 125, 14216–14217. [Google Scholar] [CrossRef]
- Bhatta, P.; Hu, X. Molecular Determinants for Guanine Binding in GTP-Binding Proteins: A Data Mining and Quantum Chemical Study. Int. J. Mol. Sci. 2024, 25, 12449. [Google Scholar] [CrossRef]
- Martínez-Rosell, G.; Giorgino, T.; De Fabritiis, G. PlayMolecule ProteinPrepare: A Web Application for Protein Preparation for Molecular Dynamics Simulations. J. Chem. Inf. Model. 2017, 57, 1511–1516. [Google Scholar] [CrossRef]
- Frisch, M.J.; Trucks, G.W.; Schlegel, H.B.; Scuseria, G.E.; Robb, M.A.; Cheeseman, J.R.; Scalmani, G.; Barone, V.; Petersson, G.A.; Nakatsuji, H.; et al. Gaussian 16 Rev. C.01; Gaussian, Inc.: Wallingford, CT, USA, 2016. [Google Scholar]
- Neese, F. The ORCA program system. Wiley Interdiscip. Rev. Comput. Mol. Sci. 2012, 2, 73–78. [Google Scholar] [CrossRef]
- Grimme, S. Semiempirical hybrid density functional with perturbative second-order correlation. J. Chem. Phys. 2006, 124, 034108. [Google Scholar] [CrossRef]
- Grimme, S.; Neese, F. Double-hybrid density functional theory for excited electronic states of molecules. J. Chem. Phys. 2007, 127, 154116. [Google Scholar] [CrossRef]
- Weigend, F.; Ahlrichs, R. Balanced basis sets of split valence, triple zeta valence and quadruple zeta valence quality for H to Rn: Design and assessment of accuracy. Phys. Chem. Chem. Phys. 2005, 7, 3297–3305. [Google Scholar] [CrossRef] [PubMed]
- Grimme, S.; Ehrlich, S.; Goerigk, L. Effect of the damping function in dispersion corrected density functional theory. J. Comput. Chem. 2011, 32, 1456–1465. [Google Scholar] [CrossRef] [PubMed]
- Weigend, F. A fully direct RI-HF algorithm: Implementation, optimised auxiliary basis sets, demonstration of accuracy and efficiency. Phys. Chem. Chem. Phys. 2002, 4, 4285–4291. [Google Scholar] [CrossRef]
- Boys, S.F.; Bernardi, F. The calculation of small molecular interactions by the differences of separate total energies. Some procedures with reduced errors. Mol. Phys. 1970, 19, 553–566. [Google Scholar] [CrossRef]
- Marenich, A.V.; Cramer, C.J.; Truhlar, D.G. Universal solvation model based on solute electron density and on a continuum model of the solvent defined by the bulk dielectric constant and atomic surface tensions. J. Phys. Chem. B 2009, 113, 6378–6396. [Google Scholar] [CrossRef]
- Kim, S.; Thiessen, P.A.; Bolton, E.E.; Chen, J.; Fu, G.; Gindulyte, A.; Han, L.; He, J.; He, S.; Shoemaker, B.A.; et al. PubChem substance and compound databases. Nucleic Acids Res. 2016, 44, D1202–D1213. [Google Scholar] [CrossRef]
- Swain, M. PubChemPy. 2014. Available online: https://pubchempy.readthedocs.io/en/latest/ (accessed on 5 May 2025).


| Name | Description |
|---|---|
| MW | Molecular weight |
| nHDon | Number of hydrogen bond donors |
| nHAcc | Number of hydrogen bond acceptors |
| SA | Total surface area |
| TPSA | Topological polar surface area |
| nSK | Number of non-hydrogen atoms |
| RBN | Number of rotatable bonds |
| nAR | Number of aromatic rings |
| cLogP | Calculated partition coefficient between octanol and water |
| NAA | Number of Aromatic atoms |
| ARR | Aromatic ratio |
| Nsp3 | Number of sp3 hybridized carbon atom |
| Fsp3 | Fraction of sp3 carbon atoms |
| Covalent Mpro Inhibitors | ||||||
|---|---|---|---|---|---|---|
| Molecular Descriptor | Min | Median | Max | Average | Ro5 a | Veber b |
| MW (Da) | 112.15 | 473.55 | 993.30 | 442.32 ± 7.69 | 59.8% | |
| nHDon | 0 | 4 | 9 | 2.99 ± 0.11 | 96.3% | 77.9% c |
| nHAcc | 1 | 5 | 13 | 5.19 ± 0.11 | 99.4% | |
| RBN | 1 | 11 | 40 | 10.27 ± 0.30 | 49.1% | |
| cLogP | −2.28 | 1.86 | 7.12 | 2.12 ± 0.08 | 96.0% | |
| NAA | 0 | 6 | 25 | 7.83 ± 0.30 | ||
| ARR | 0 | 0.27 | 0.92 | 0.29 ± 0.01 | ||
| SA (Å2) | 129.80 | 533.26 | 1163.24 | 492.71 ± 8.84 | ||
| nAR | 0 | 1 | 5 | 1.41 ± 0.06 | ||
| TPSA (Å2) | 0 | 116.76 | 300.78 | 111.61 ± 2.77 | 63.8% | |
| nSK | 7 | 33 | 67 | 31.02 ± 0.55 | ||
| Nsp3 | 0 | 12 | 36 | 11.80 ± 0.39 | ||
| Fsp3 | 0 | 0.52 | 1 | 0.50 ± 0.01 | ||
| Non-covalent Mpro inhibitors | ||||||
| Molecular Descriptor | Min | Median | Max | Average | Ro5 a | Veber b |
| MW (Da) | 73.12 | 345.79 | 630.50 | 353.76 ± 3.80 | 91.1% | |
| nHDon | 0 | 1 | 5 | 1.32 ± 0.03 | 100% | 98.9% c |
| nHAcc | 0 | 4 | 11 | 3.79 ± 0.06 | 99.2% | |
| RBN | 1 | 4 | 19 | 4.66 ± 0.09 | 98.9% | |
| cLogP | −1.49 | 3.32 | 7.24 | 3.22 ± 0.05 | 93.7% | |
| NAA | 0 | 16 | 30 | 14.23 ± 0.20 | ||
| ARR | 0 | 0.59 | 0.86 | 0.57 ± 0.01 | ||
| SA (Å2) | 117.44 | 356.86 | 664.73 | 367.64 ± 3.61 | ||
| nAR | 0 | 3 | 6 | 2.59 ± 0.04 | ||
| TPSA (Å2) | 12.27 | 64.11 | 167.86 | 67.77 ± 0.96 | 99.3% | |
| nSK | 5 | 24 | 44 | 24.84 ± 0.26 | ||
| Nsp3 | 0 | 4 | 19 | 4.37 ± 0.11 | ||
| Fsp3 | 0 | 0.2 | 1 | 0.24 ± 0.01 | ||
| Covalent Mpro Inhibitors | |||
|---|---|---|---|
| Number of Aromatic Rings | Number of Ligands | Percentage (%) | Average of WHBC |
| 0 | 68 | 19.54 | 0.295 ± 0.014 |
| 1 | 134 | 38.51 | 0.273 ± 0.008 |
| 2 | 99 | 28.45 | 0.234 ± 0.008 |
| 3 | 31 | 8.91 | 0.238 ± 0.026 |
| 4 | 15 | 4.30 | 0.216 ± 0.018 |
| 5 | 1 | 0.29 | 0.184 ± 0.000 |
| Non-covalent Mpro inhibitors | |||
| Number of Aromatic Rings | Number of Ligands | Percentage (%) | Average of WHBC |
| 0 | 3 | 0.49 | 0.452 ± 0.060 |
| 1 | 81 | 13.17 | 0.240 ± 0.009 |
| 2 | 166 | 26.99 | 0.222 ± 0.004 |
| 3 | 295 | 47.97 | 0.191 ± 0.003 |
| 4 | 51 | 8.29 | 0.198 ± 0.007 |
| 5 | 18 | 2.93 | 0.238 ± 0.016 |
| 6 | 1 | 0.16 | 0.167 ± 0.000 |
| Covalent Inhibitors | |||||
|---|---|---|---|---|---|
| Selection Method | PDB ID | Resolution (Å) | Ligand ID | Ligand Structure | (kcal/mol) |
| PCA clustering | 5RFJ | 1.8 | T7A |  | −3.5 |
| 5RGN | 1.86 | U1A |  | −3.6 | |
| 7AWU | 2.07 | S8B |  | −3.7 | |
| 7GDX | 1.84 | N1U |  | −11.0 | |
| 7GFV | 1.73 | OJO | 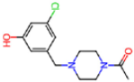 | −4.5 | |
| 7UUC | 1.6 | 81L | 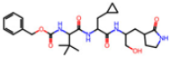 | −16.2 | |
| 7SF1 | 1.85 | 8ZI | 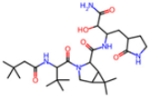 | −13.7 | |
| 8BGA | 1.98 | QQL |  | −12.1 | |
| 8OKN | 1.35 | 83W |  | −15.1 | |
| 8TPE | 1.61 | JK0 | 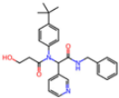 | −12.1 | |
| Frequency of aromatic rings | 5RFO | 1.83 | T7S | 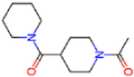 | −3.7 |
| 6XR3 | 1.45 | V7G | 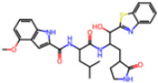 | −13.7 | |
| 7FAZ | 2.1 | 2RI | 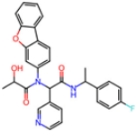 | −21.2 | |
| 7GJ7 | 1.88 | Q0I | 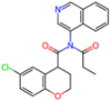 | −14.0 | |
| 7NT1 | 2.85 | UQW |  | −13.2 | |
| 7RVN | 1.63 | 7VB |  | −13.5 | |
| 7RVX | 1.85 | 7YI | 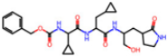 | −16.1 | |
| 7SH8 | 1.8 | GJ3 | 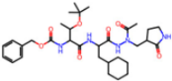 | −17.0 | |
| 8DSU | 1.86 | V2M |  | −19.9 | |
| 8GXI | 1.69 | 0BO | 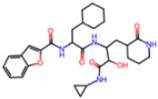 | −14.1 | |
| Non-covalent Inhibitors | |||||
| Selection Method | PDB ID | Resolution (Å) | Ligand ID | Ligand Structure | (kcal/mol) |
| PCA clustering | 5REV | 1.6 | T4J |  | −3.3 |
| 7GDJ | 1.77 | M50 | 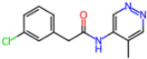 | −15.6 | |
| 7GEF | 1.18 | NJE |  | −10.7 | |
| 7GEM | 1.32 | NQO |  | −13.0 | |
| 7GGA | 1.49 | OSI | 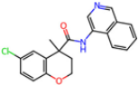 | −18.1 | |
| 7GI4 | 1.72 | QCC | 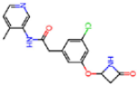 | −18.7 | |
| 7GJ2 | 1.87 | QK3 | 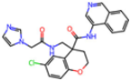 | −19.5 | |
| 7GK3 | 2.19 | QT3 |  | −18.1 | |
| 7GKV | 1.88 | R0F | 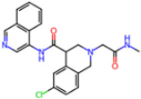 | −20.0 | |
| 7GL5 | 1.68 | R5O | 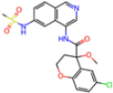 | −19.2 | |
| Frequency of aromatic rings | 5RF2 | 1.53 | HVB |  | −1.2 |
| 5RG1 | 1.65 | T9J | 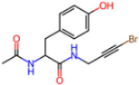 | −11.3 | |
| 7ANS | 1.7 | RNW | 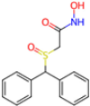 | −8.3 | |
| 7GAZ | 1.75 | KL6 | 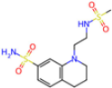 | −3.2 | |
| 7GBS | 1.54 | KZX |  | −16.5 | |
| 7GHR | 1.655 | OZC | 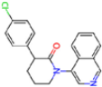 | −13.7 | |
| 7GJD | 1.79 | QM9 | 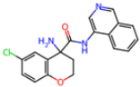 | −16.7 | |
| 7GNN | 1.81 | S39 | 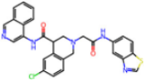 | −18.0 | |
| 7GNQ | 1.531 | S5L | 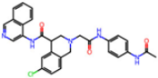 | −22.8 | |
| 7US4 | 2.07 | O69 |  | −21.6 | |
| Catagory | Residue | Interaction Mode | (kcal/mol) | Combined Energy (kcal/mol) |
|---|---|---|---|---|
| Non-bonded π-interactions | H41 | CH–π | −2.7 | −2.7 |
| Hydrogen bonding | S144 | HB | −2.1 | |
| E166 | HB | −5.8 | ||
| G143 | HB | −1.5 | −12.4 | |
| H163 | HB | −1.9 | ||
| H164 | HB | −1.1 |
| Catagory | Residue | Interaction Mode | (kcal/mol) | Combined Energy (kcal/mol) |
|---|---|---|---|---|
| Non-bonded π-interactions | H41 | π–π | −2.4 | |
| M49 | CH–π | −3.4 | −12.6 | |
| M165 | CH–π | −3.4 | ||
| N142 | CH–π | −3.4 | ||
| Hydrogen bonding | S144 | HB | −0.5 | |
| H163 | HB | −2.8 | −6.6 | |
| E166 | HB | −3.3 |
| Covalent Inhibitors | |||
|---|---|---|---|
| Residue | Interaction Mode | Occurrence | Average (kcal/mol) |
| E166 | HB | 10 | −5.52 |
| H163 | HB | 15 | −2.29 |
| H164 | HB | 10 | −1.26 |
| G143 | HB | 17 | −1.22 |
| S144 | HB | 18 | −1.02 |
| H41 | HB | 6 | −2.1 |
| N142 | HB | 1 | −0.6 |
| H41 | π–π, CH–π | 17 | −2.98 |
| N142 | CH–π | 3 | −4.30 |
| A191 | CH–π | 7 | −2.26 |
| M49 | CH–π | 1 | −0.1 |
| M165 | CH–π | 1 | −5.2 |
| E166 | CH–π | 1 | −2.2 |
| Q192 | NH–π | 1 | −0.6 |
| Non-covalent Inhibitors | |||
| Residue | Interaction Mode | Occurrence | Average (kcal/mol) |
| E166 | HB | 17 | −3.36 |
| H163 | HB | 16 | −2.55 |
| S144 | HB | 16 | −0.59 |
| G143 | HB | 1 | −0.2 |
| H41 | π–π, CH–π | 19 | −1.99 |
| N142 | CH–π | 16 | −2.96 |
| M49 | CH–π | 15 | −2.70 |
| M165 | CH–π | 15 | −3.71 |
| E166 | NH–π | 1 | −0.6 |
Disclaimer/Publisher’s Note: The statements, opinions and data contained in all publications are solely those of the individual author(s) and contributor(s) and not of MDPI and/or the editor(s). MDPI and/or the editor(s) disclaim responsibility for any injury to people or property resulting from any ideas, methods, instructions or products referred to in the content. |
© 2025 by the authors. Licensee MDPI, Basel, Switzerland. This article is an open access article distributed under the terms and conditions of the Creative Commons Attribution (CC BY) license (https://creativecommons.org/licenses/by/4.0/).
Share and Cite
Olosunde, A.; Hu, X. Molecular Recognition of SARS-CoV-2 Mpro Inhibitors: Insights from Cheminformatics and Quantum Chemistry. Molecules 2025, 30, 2174. https://doi.org/10.3390/molecules30102174
Olosunde A, Hu X. Molecular Recognition of SARS-CoV-2 Mpro Inhibitors: Insights from Cheminformatics and Quantum Chemistry. Molecules. 2025; 30(10):2174. https://doi.org/10.3390/molecules30102174
Chicago/Turabian StyleOlosunde, Adedapo, and Xiche Hu. 2025. "Molecular Recognition of SARS-CoV-2 Mpro Inhibitors: Insights from Cheminformatics and Quantum Chemistry" Molecules 30, no. 10: 2174. https://doi.org/10.3390/molecules30102174
APA StyleOlosunde, A., & Hu, X. (2025). Molecular Recognition of SARS-CoV-2 Mpro Inhibitors: Insights from Cheminformatics and Quantum Chemistry. Molecules, 30(10), 2174. https://doi.org/10.3390/molecules30102174