Article

Gas-Phase Infrared Action Spectroscopy of CH2Cl+ and CH3ClH+: Likely Protagonists in Chlorine Astrochemistry

1
I. Physikalisches Institut, Universität zu Köln Zülpicher, Str. 77, 50937 Köln, Germany
2
FELIX Laboratory, Institute for Molecules and Materials, Radboud University, Toernooiveld 7, 6525 ED Nijmegen, The Netherlands
*
Author to whom correspondence should be addressed.
Molecules 2024, 29(3), 665; https://doi.org/10.3390/molecules29030665
Submission received: 13 December 2023 / Revised: 17 January 2024 / Accepted: 18 January 2024 / Published: 31 January 2024

Abstract

:
Two fundamental halocarbon ions, CH2Cl+ and CH3ClH+, were studied in the gas phase using the FELion 22-pole ion trap apparatus and the Free Electron Laser for Infrared eXperiments (FELIX) at Radboud University, Nijmegen (the Netherlands). The vibrational bands of a total of four isotopologs, CH235,37Cl+ and CH335,37ClH+, were observed in selected wavenumber regions between 500 and 2900 cm−1 and then spectroscopically assigned based on the results of anharmonic force field calculations performed at the CCSD(T) level of theory. As the infrared photodissociation spectroscopy scheme employed probes singly Ne-tagged weakly bound complexes, complementary quantum-chemical calculations of selected species were also performed. The impact of tagging on the vibrational spectra of CH2Cl+ and CH3ClH+ is found to be virtually negligible for most bands; for CH3ClH+–Ne, the observations suggest a proton-bound structural arrangement. The experimental band positions as well as the best estimate rotational molecular parameters given in this work provide a solid basis for future spectroscopic studies at high spectral resolutions.

Graphical Abstract

1. Introduction

Out of the more than 300 inter- and circumstellar molecules detected to date, more than 25% contain heavy elements from the second row of the periodic table. With nearly fifty species, molecules containing silicon and sulfur are particularly abundant (an up-to-date list of astronomically detected molecules with complementary information is maintained at the Cologne Database for Molecular Spectroscopy (CDMS) [1,2] accessible online at https://cdms.astro.uni-koeln.de/ (accessed on 12 December 2023)).
In contrast, the number of chlorine-bearing molecules is much smaller. Only seven such species have been observed so far: HCl [3]; AlCl, NaCl, and KCl [4]; HCl+ [5]; H2Cl+ [6]; and CH3Cl [7]. The latter, pentatomic methyl chloride, or CH3Cl, is the most complex chlorine-bearing species presently known in space and, thus, an interesting target for studies of chlorine astrochemistry. In this context, it is assumed that CH3Cl may be formed through reactions on grain surfaces but also possibly in the gas phase through ion–molecule reactions, for example, in a scenario suggested by Garrod (cf., Ref. [8]).
CH 3 +   +   HCl     CH 2 Cl +   +   H 2
CH 2 Cl +   +   H 2     CH 3 ClH +   +   h ν
CH 3 ClH +   +   e     CH 3 Cl +   +   H
Here, in the first step, the chloromethyl ion CH2Cl+ is formed from a reaction of the methyl cation CH3+ and HCl; in the second, the halonium ion CH3ClH+ is produced via radiative association between CH2Cl+ and molecular hydrogen, finally yielding CH3Cl through dissociate recombination with a free electron.
While the CH3+, HCl, H2, and CH3Cl species are all known to be present in astronomical environments (the non-polar CH3+ molecular ion being detected only very recently through observations with the James Webb Space Telescope [9]), our knowledge of the CH2Cl+ and CH3ClH+ molecular ions also participating in the above chain of reactions is still highly fragmentary. From the viewpoint of laboratory experiments, only little spectroscopic information has been collected previously for the chloromethyl cation. Photoelectron spectroscopy of the CH2Cl radical has provided a vibrational wavenumber ν = 1040 ( 30 )  cm−1 of the Cl–C-stretching mode of CH2Cl+ [10,11]. A somewhat more comprehensive picture of the vibrational spectrum has been obtained through infrared spectroscopy of CH2Cl+ trapped in solid Ar matrices [12]. In these studies, four out of the six vibrational fundamentals were observed for the most abundant isotopic species, CH235Cl+. Using precursors enriched in 13C or deuterium permitted the observation of four vibrational fundamentals of 13CH235Cl+ or five of CD235Cl+, respectively. Owing to a significant isotopic shift, the C–37Cl stretching mode could also be observed for all three isotopic species. Direct infrared spectroscopic studies of CH2Cl+ in the gas phase have not been reported yet. Hexatomic protonated methyl chloride, CH3ClH+, has been known from mass spectrometry and studies of reaction kinetics [13,14]; however, it has never been spectroscopically studied.
In the present work, the vibrational spectra of the 35Cl and 37Cl isotopic species of CH2Cl+ and CH3ClH+ were observed in the gas phase, marking the first direct gas-phase infrared study of CH2Cl+ and the first ever spectroscopic detection of CH3ClH+. The characterization of both ions was accomplished in an ion trap using a messenger action spectroscopy scheme, i.e., employing infrared photodissociation (IRPD) of their weakly bound complexes with neon, CH2Cl+-Ne, and CH3ClH+-Ne. Spectroscopic analysis was supported based on complementary high-level quantum-chemical calculations performed at the CCSD(T) level of theory. A detailed account of the experimental and theoretical work as well as of the analysis will be given in the following.

2. Results and Discussion

2.1. Structures of CH2Cl+, CH3ClH+, and Their Weakly Bound Complexes with Ne

Equilibrium molecular structures of CH2Cl+ and CH3ClH+ (and their isoelectronic sulfur-bearing counterparts, cf. Section 4) were calculated at the CCSD(T) level of theory using different basis sets. Full sets of internal coordinates are given in Appendix A and Appendix B. Best-estimate equilibrium structures were calculated using the cc-pwCVQZ basis set and all electrons in the correlation treatment, providing a level of theory previously shown to be of high accuracy [15]. The fc-CCSD(T)/cc-pV(T + d)Z level was employed for the calculation of harmonic and anharmonic force fields of the bare ions and used for the interpretation of their vibrational spectra. The impact of Ne-tagging on the molecular structures and harmonic force fields was estimated at the fc-CCSD(T)/aug-cc-pV(T + d)Z level of theory. To determine the energetically favorable locations of the Ne atom with respect to the CH2Cl+ and CH3ClH+ ions, potential energy surfaces (PESs) were calculated using grids of appropriate size and sampling (see also Ref. [16]). Briefly, in these calculations, the fc-CCSD(T)/aug-cc-pV(T + d)Z equilibrium structures of CH2Cl+ and CH3ClH+ were kept fixed while varying the position of the Ne atom on the grid over an area of a few tens of Å2 and at a spacing of 0.25 Å. At each of the grid points, single-point energy calculations were performed. PESs were calculated for the two mirror planes of CH2Cl+ and for the single mirror plane of CH3ClH+. The resulting potential energy maps of CH2Cl+ are shown in Figure 1.
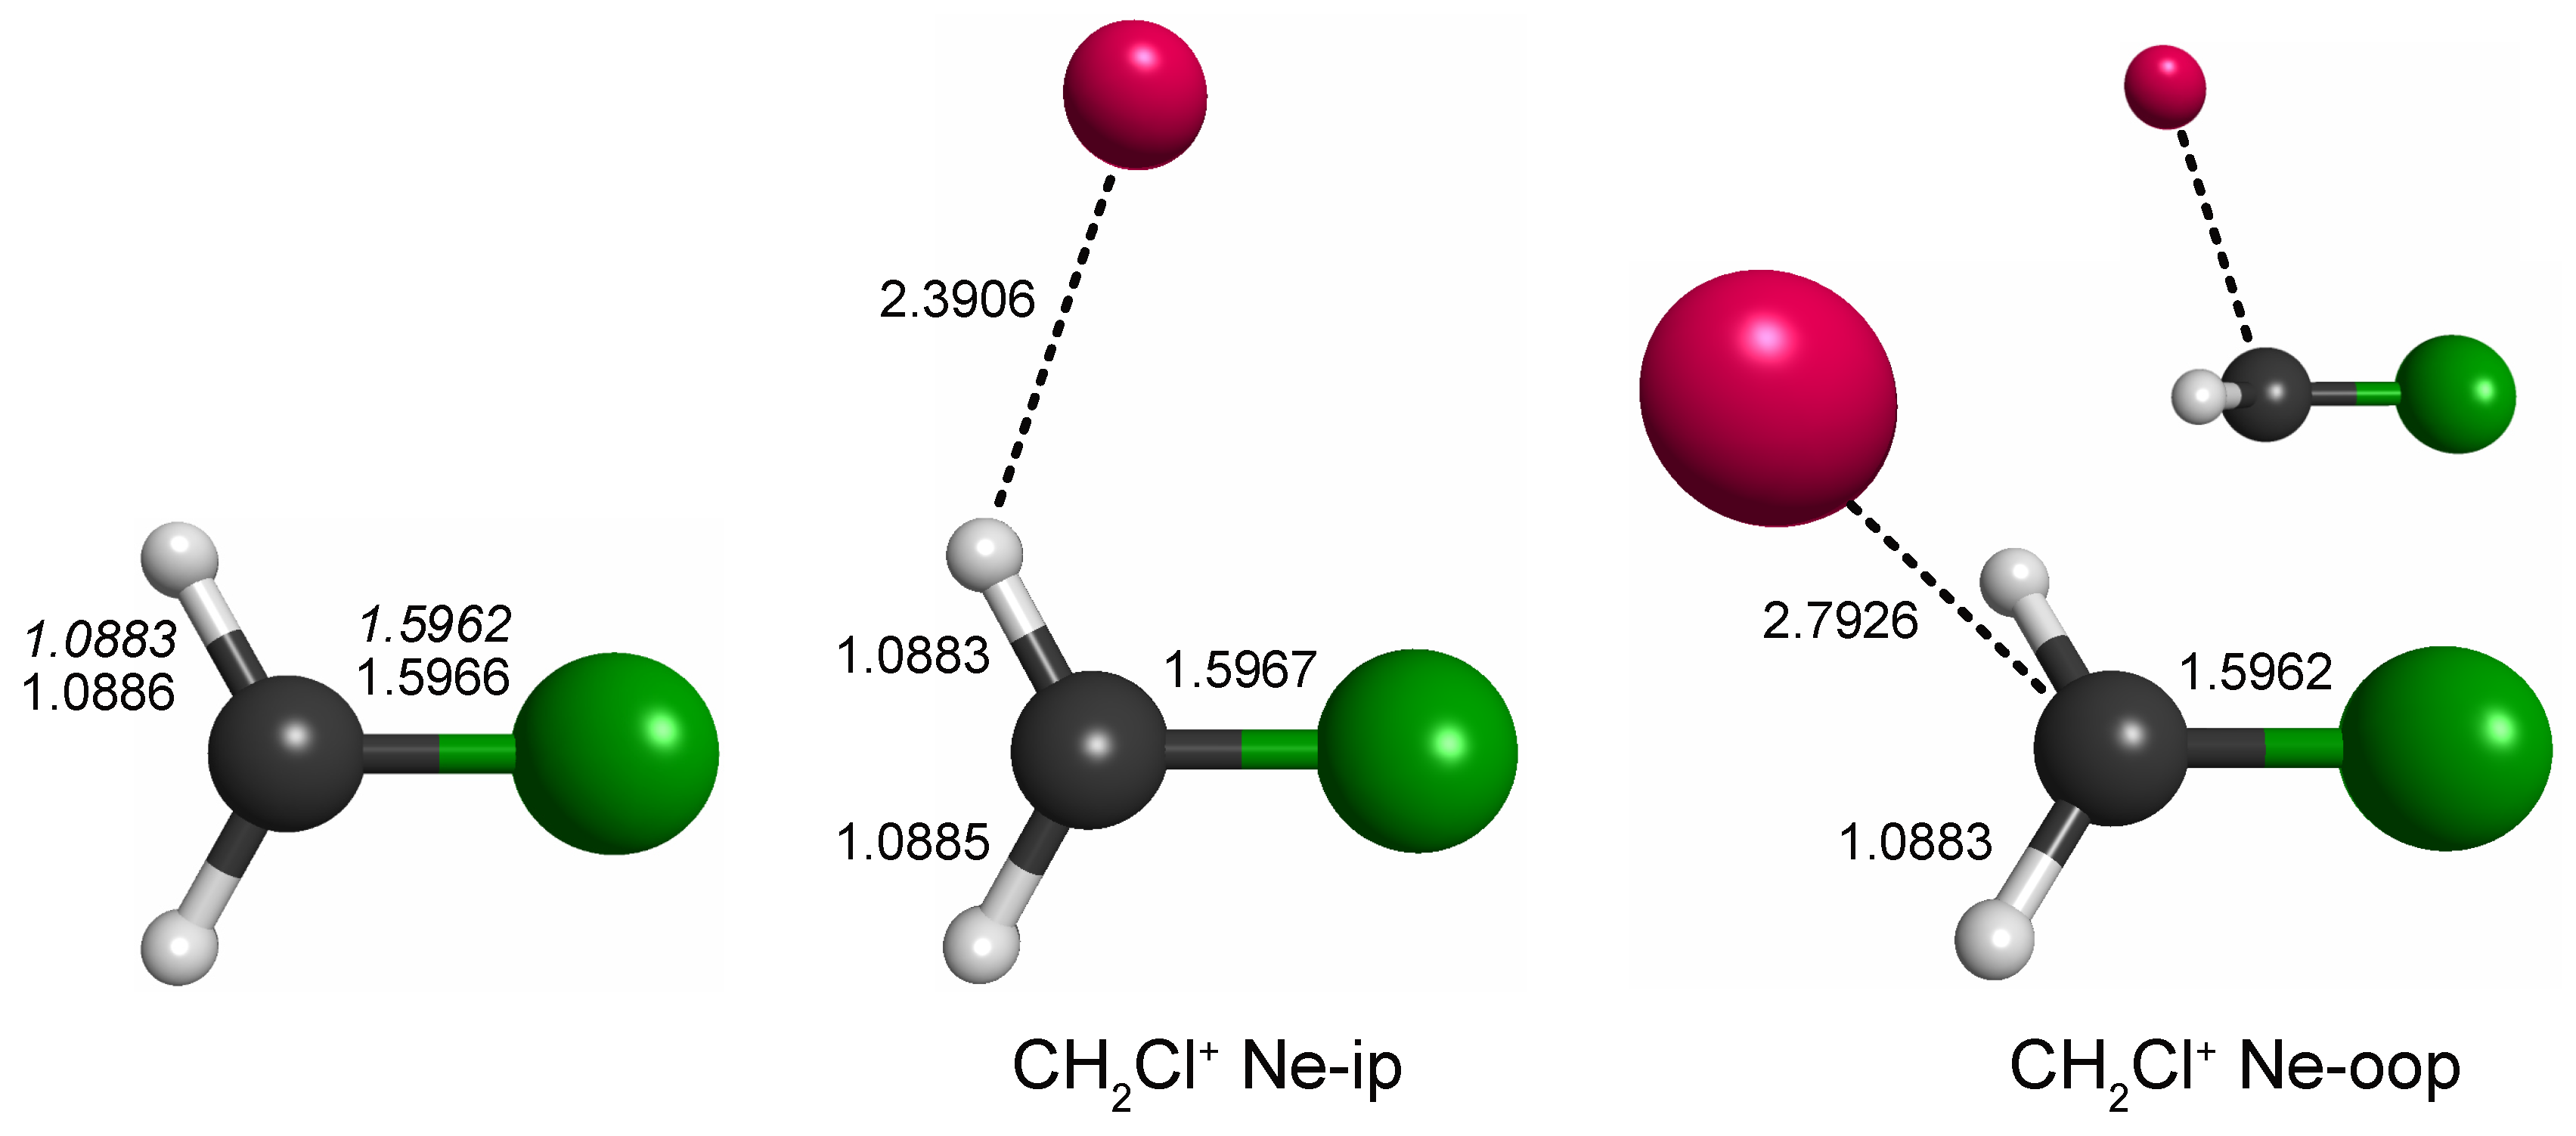
Out of the four unique local minima seen, the shallow ones corresponding to linear C–Cl–Ne and Cl–C–Ne cluster variants were not considered further. The global minimum arrangements of each plot, i.e., one H-bound in-plane variant (CH2Cl+ Ne-ip, Figure 1, left map) and the out-of-plane variant (CH2Cl+ Ne-oop, right), were finally structurally refined in fully relaxed calculations. The corresponding structures are shown in Figure 2, and the full sets of structural parameters are given in Appendix A. As can be seen, the molecular structure of CH2Cl+ hardly changes upon Ne-tagging at either position, and as a consequence, also the harmonic vibrational wavenumbers of CH2Cl+ collected in Table 1 show very little dependence on tagging. The Ne-ip and Ne-oop species are calculated to be almost isoenergetic, with the latter configuration being slightly more stable by about 0.1 kcal/mol. Ne bond dissociation energies under the consideration of an estimate of zero-point vibrational effects amount to 0.6 kcal/mol (Ne-ip) and 0.7 kcal/mol (Ne-oop), respectively.
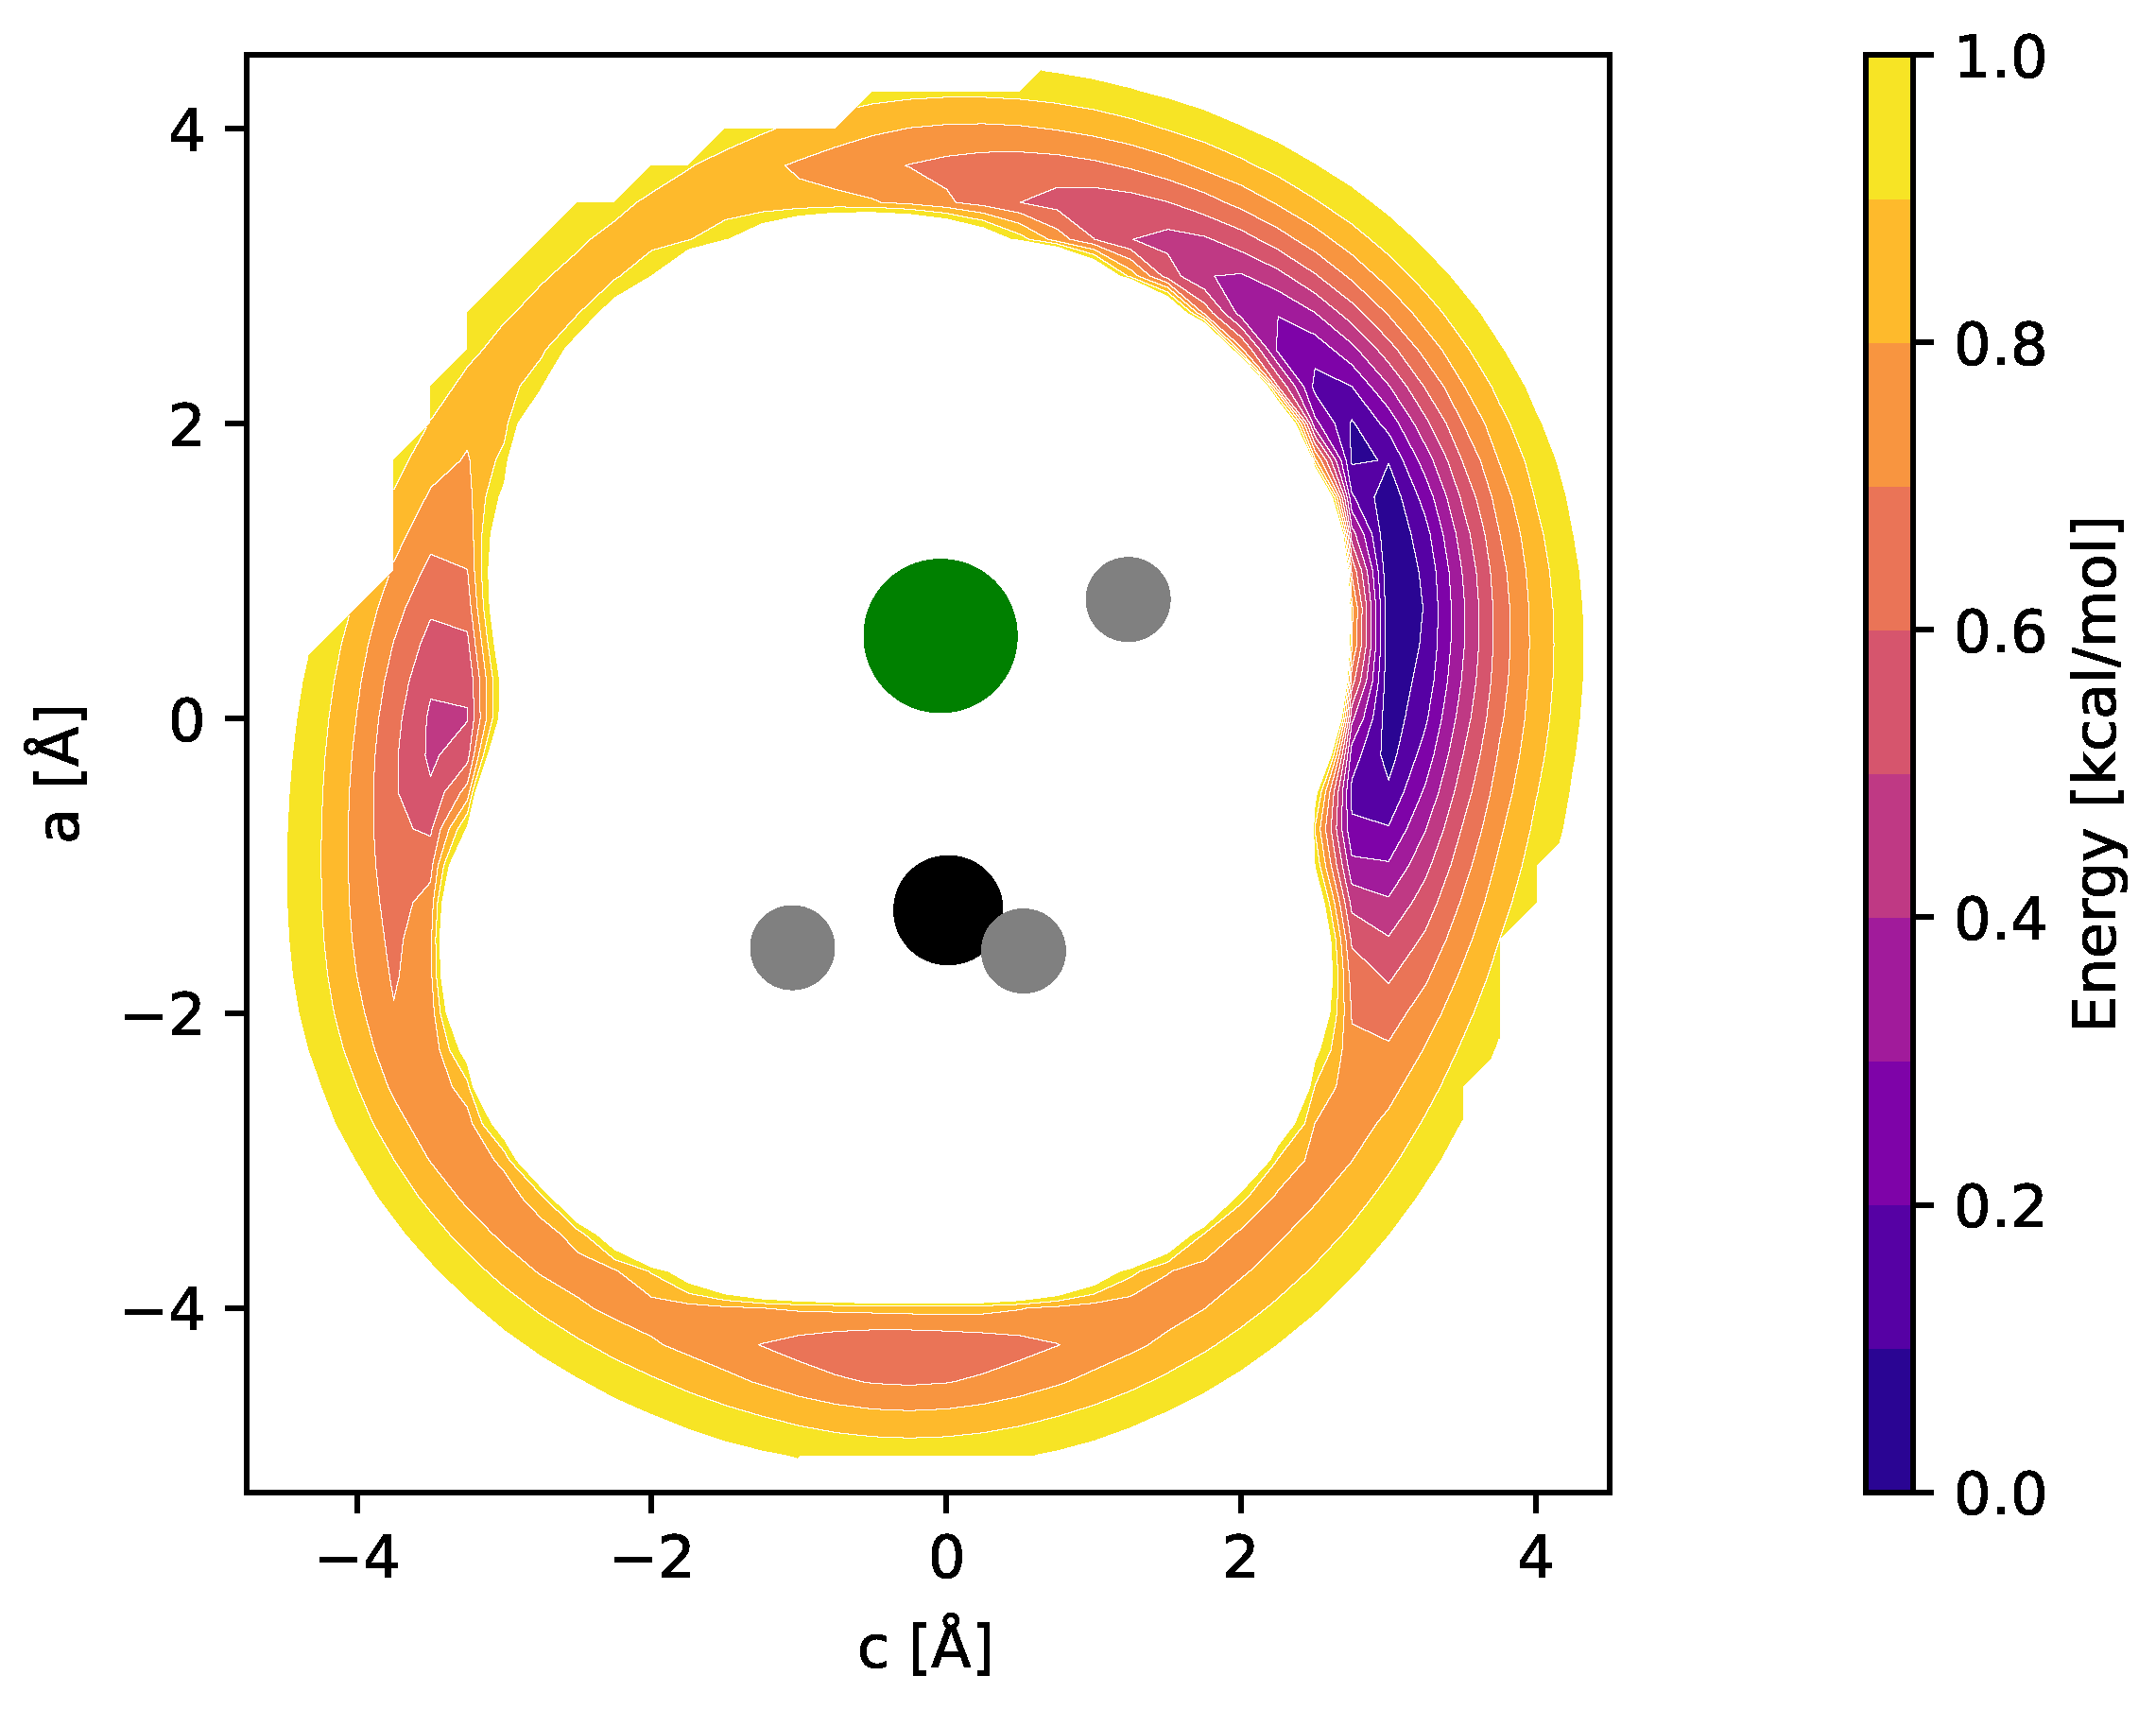
For CH3ClH+, by analogy with other rare gas-tagged protonated species, one would expect the Ne atom to be bound to the proton in a near-linear Cl-H⋯Ne fashion (e.g., Refs. [17,18,19]). Indeed, from the potential energy map obtained for the molecular mirror plane (Figure 3), this arrangement is identified as a deep, putatively global minimum. Another minimum is identified on the opposite side of the molecule and a third shallow one where Ne is arranged in a near-linear Cl-C-Ne fashion. Fully relaxed structures of the first two configurations (“p-bound” and “CH3/Cl-bound”) are shown in Figure 4. According to those calculations, the p-bound variant is more stable by 0.4 kcal/mol. The third minimum as well as potential arrangements where the Ne atom would be located outside of the symmetry plane of CH3ClH+ have not been studied further. The results of harmonic force field calculations to study the influence of Ne-tagging are presented in Table 2. As can be seen, the influence of tagging is virtually negligible for the majority, but not all, of the vibrational fundamentals (see further discussion in Section 2.3). Under the consideration of zero-point vibrational effects, the Ne bond dissociation energies are 1.0  kcal/mol and 0.7  kcal/mol for the p-bound and CH3/Cl-bound species, respectively.

2.2. IRPD Spectrum of CH235Cl+–Ne

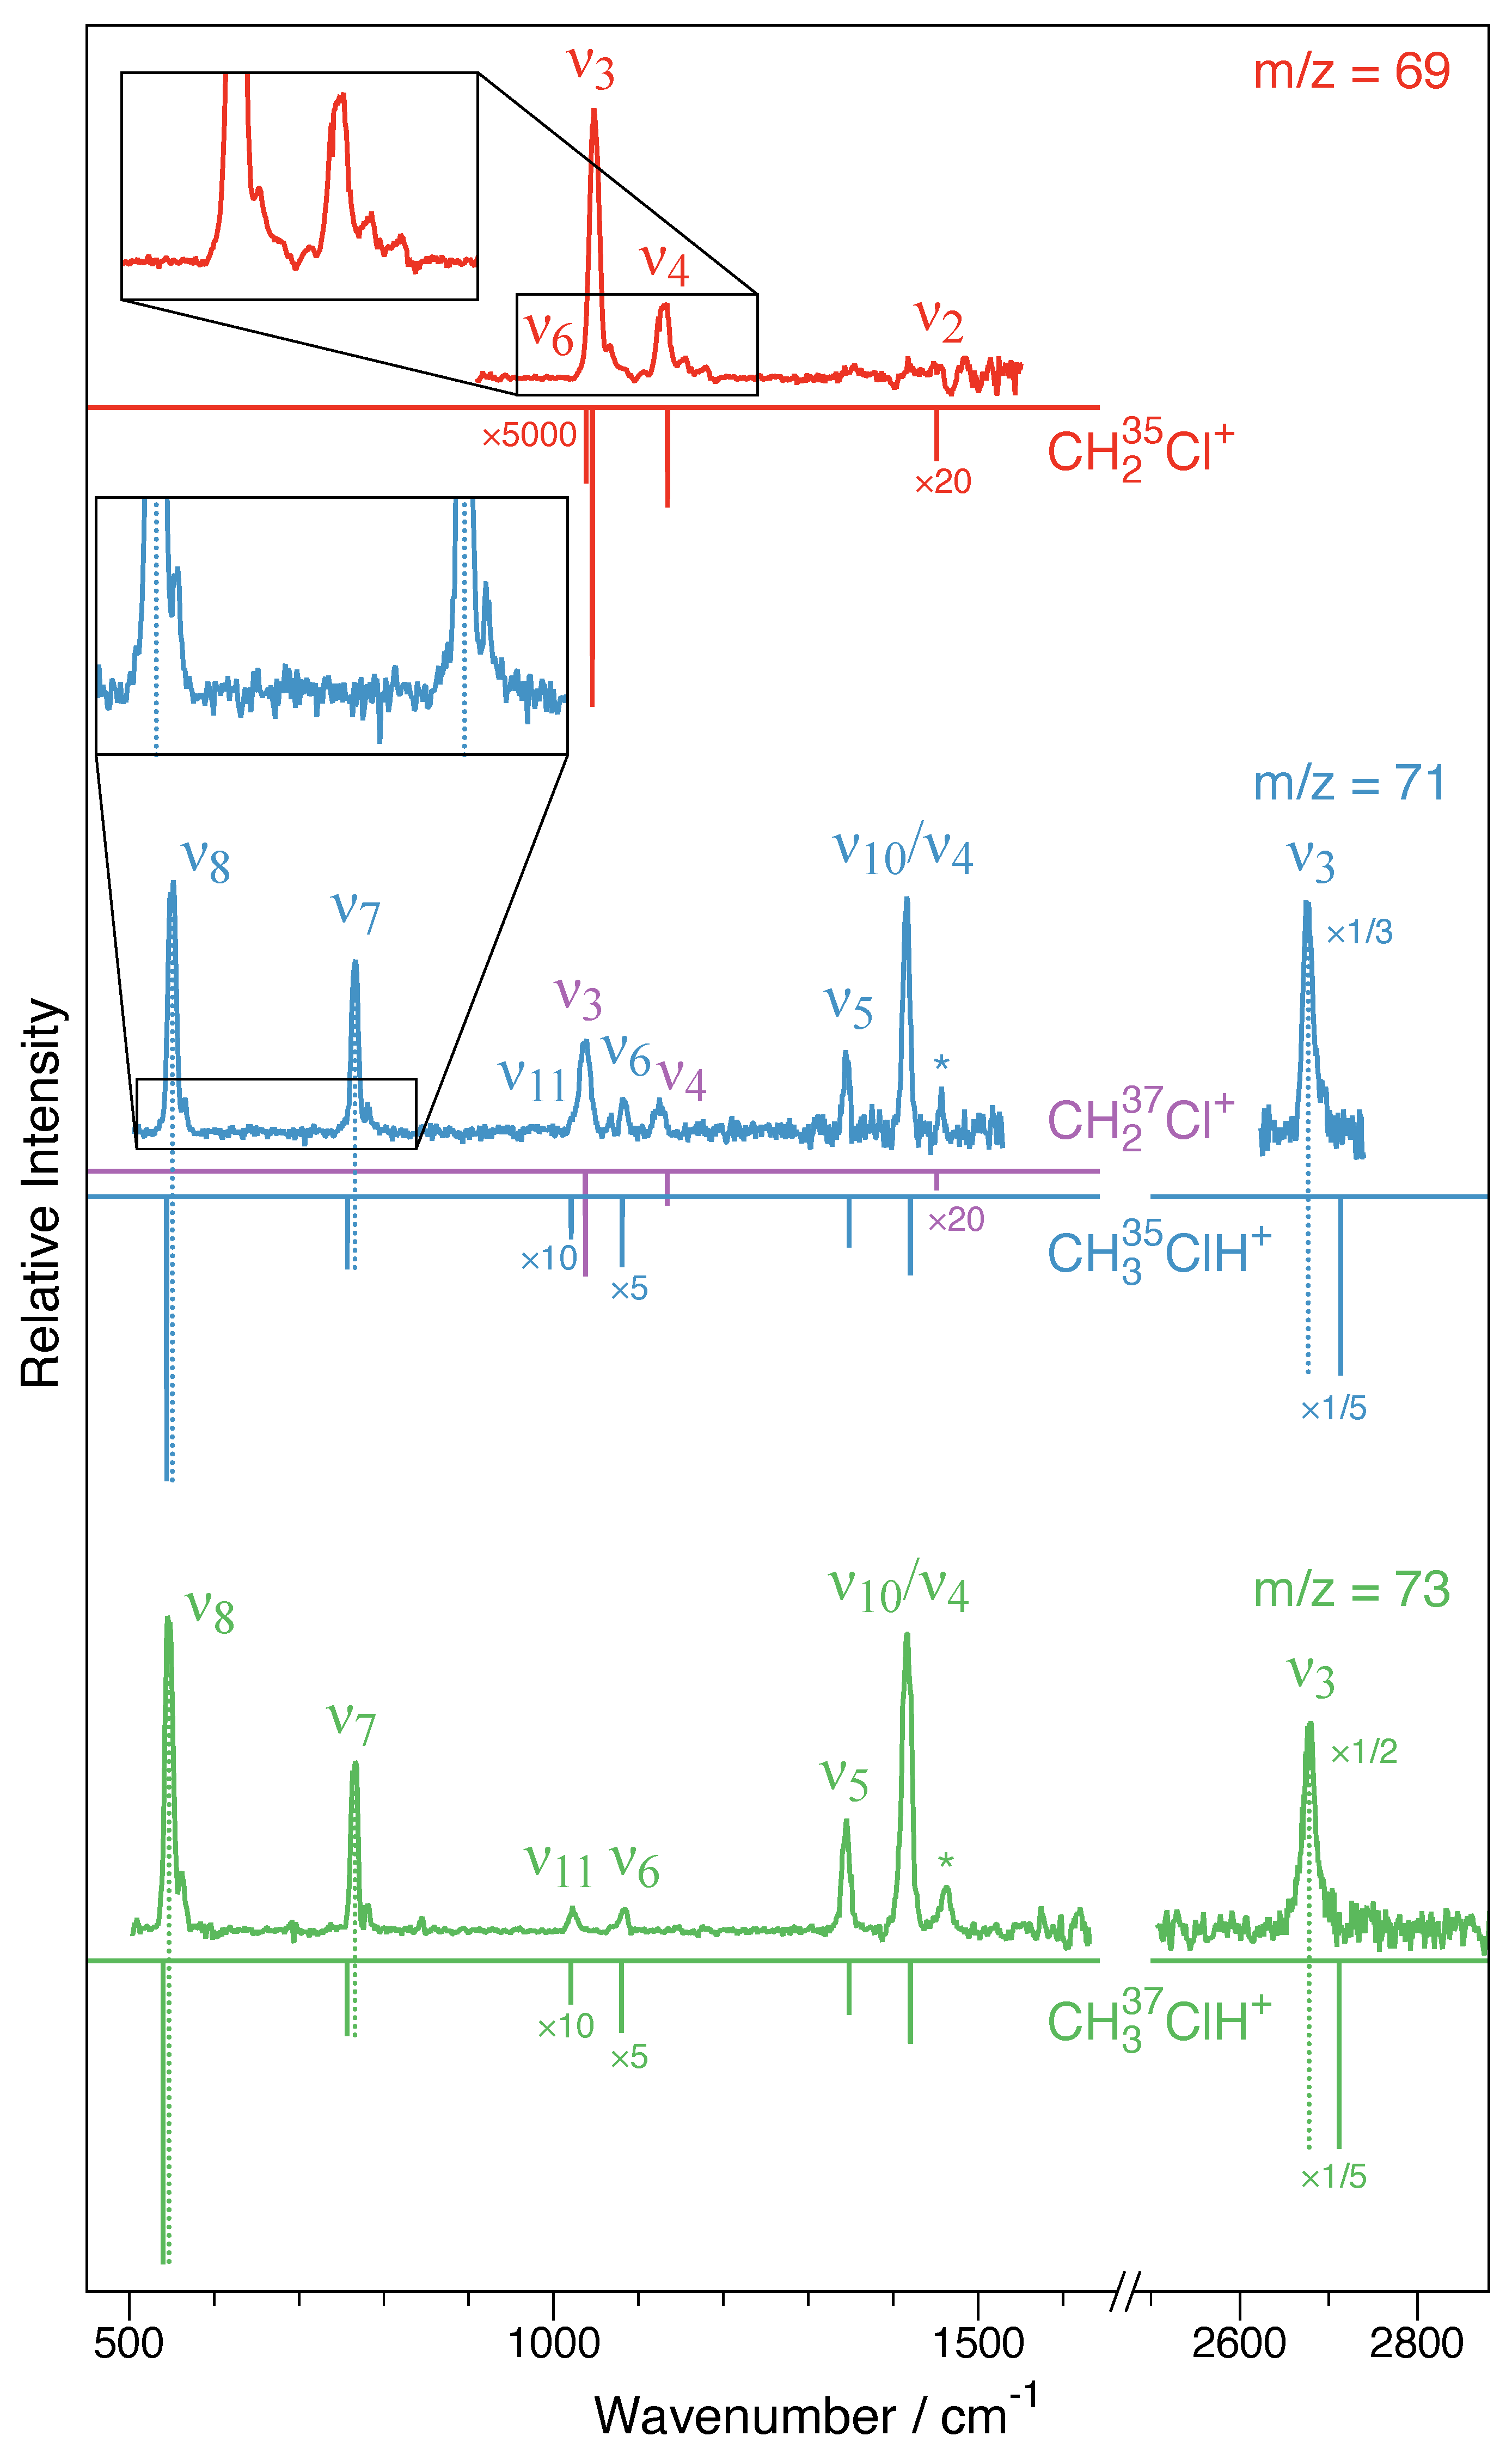
The m / z = 69 filtered IRPD spectrum from 900 to 1600 cm−1 is shown in Figure 5 (top red trace). From Table 3, it can be seen that four fundamental modes of the CH235Cl+ species are calculated in this wavenumber range: the ν 6 mode at 1038 cm−1, ν 3 at 1046 cm−1, ν 4 at 1134 cm−1, and ν 2 at 1451 cm−1, only two of which have sizable calculated infrared intensities: ν 3 (Cl–C stretching) and ν 4 (out-of-plane (oop) bending). While infrared intensities are not strictly related to the intensities in the action spectroscopy scheme employed here, usually good qualitative agreement is observed. Clearly, ν 3 and ν 4 are detected at 1048 cm−1 and 1129 cm−1, respectively, which is in very good agreement with the anharmonic CCSD(T)/cc-pV(T + d)Z values (1046 and 1134 cm−1, as shown in Table 3) and also show proper intensity behavior. Both ν 3 and ν 4 show weak satellite band progressions with approximate spacings of 20 cm−1 to their blue sides (see inset in Figure 5), which is thought to originate from combination modes with the participation of the Ne-tag (most likely involving the ω 9 fundamental (Table 1); see, e.g., Refs. [20,21]). The CH2 scissoring mode ν 2 is calculated to be very weak and would be located in a region affected by somewhat higher noise and some baseline instabilities. The CH2 wagging mode ν 6 is calculated to have almost no infrared intensity and is either too weak to be detected or overlapped with the much stronger ν 3 band. Apart from that, no other clear spectroscopic feature is observed. As concluded from harmonic fc-CCSD(T)/aug-cc-pV(T + d)Z calculations of bare CH2Cl+ and its singly tagged Ne-clusters (Table 1), tagging is expected to have a negligible influence on the IRPD spectrum of this ion.

2.3. IRPD Spectra of CH237Cl+–Ne and CH335ClH+–Ne

Because CH237Cl+–Ne and CH335ClH+–Ne are isobaric species ( m / z = 71 ), both ions were present in the ion trap, and hence, the corresponding spectrum comprises the spectra of both ions superimposed. The center trace in Figure 5 shows the final spectrum obtained in the wavenumber regions from 500 to 1530 cm−1 and from 2625 to 2740 cm−1. The two regions feature no less than seven vibrational bands, all but one of which can be assigned in a straightforward fashion based on the CCSD(T)/cc-pV(T + d)Z force field calculations. The two vibrational bands located at 1037 cm−1 and 1125 cm−1 are assigned as the strong ν 3 and ν 4 vibrational fundamentals of CH237Cl+ (cf. Table 3). By comparison with the results from the CCSD(T)/cc-pV(T + d)Z force field calculations collected in Table 4, five bands are assigned as to originate from CH335ClH+, marking the first spectroscopic detection of this molecular ion. CH3ClH+ has a total of 3 N 6 = 12 vibrational fundamentals, four of which are lying outside of the spectral regions covered here, namely, the three C–H stretching modes ν 1 (calculated at 3085 cm−1), ν 2 (2979 cm−1), and ν 9 (3101 cm−1), as well as the low-energy torsional mode ν 12 (177 cm−1). Most other fundamentals are clearly identified, i.e., the Cl–C stretching mode ν 8 at 551 cm−1, the C–Cl–H bending mode ν 7 at 766 cm−1, the CH3 in-plane rocking mode ν 6 at 1083 cm−1, and the CH3 umbrella mode ν 5 at 1345 cm−1. According to the calculations, the strong feature at 1420 cm−1 is from an overlap of the energetically nearly degenerate CH3 asymmetric bending modes ν 4 ( a ) and ν 10 ( a ) . The vibrational band with the largest calculated infrared intensity (Table 4) and indeed the strongest feature in the spectrum covered here is the Cl–H stretching mode ν 3 detected at 2677 cm−1. The weak out-of-plane rocking mode ν 11 is overlapping with the much stronger ν 3 band of CH237Cl+. Overall, the agreement between the IRPD spectrum and the anharmonic CCSD(T)/cc-pV(T + d)Z force field calculation is excellent. The harmonic force field calculations of the bare ions and the singly tagged variants in Table 2 suggest that the influences of Ne should be subtle for most bands but noticeable for some. For the bands covered here, significant shifts might be expected for the ν 3 (redshift), ν 7 (blueshift), and, possibly, ν 8 bands (blueshift) if Ne was connected to the site of protonation. Indeed, the experimental findings are qualitatively consistent with this geometrical arrangement, as the largest differences δ between experimental and calculated wavenumbers of all bands observed are found for these three modes that also agree with the predicted sign of the shift. Lastly, as seen from the inset in Figure 5 (blue center trace), similarly to the ν 3 and ν 4 bands in CH2Cl+, the ν 8 and ν 7 bands (possibly also ν 3 ) show weak satellite bands about 15 cm−1 blueshifted from the fundamentals, presumably combination modes involving low-energy fundamentals introduced through Ne-tagging (most likely the ω 15 mode, as shown in Table 2).

2.4. IRPD Spectrum of CH337ClH+–Ne

The IRPD spectrum of the m / z = 73 species covering the 500 to 1630 cm−1 and 2505 to 2880 cm−1 regions is shown in Figure 5 (green bottom trace). Clearly, the strong vibrational band quintett comprising the ν 8 , ν 7 , ν 5 , ν 10 / ν 4 , and ν 3 bands nicely matches the pattern observed also for the CH335ClH+–Ne isotopic species at m / z = 71 . Likewise, the ν 8 and ν 7 bands of CH337ClH+–Ne show weaker yet clearly discernible shoulders to their blue sides. IRPD scans of the strong ν 8 band reveal that depletion is nearly 100%, suggesting that the m / z = 73 spectrum should provide a clean view of the CH337ClH+–Ne species and not be affected by isobaric contamination. As a consequence, in addition to the weak CH3 ip rocking mode ν 6 band at 1082 cm−1, now also the very weak CH3 out-of-plane rocking mode ν 11 can be identified at 1023 cm−1. In addition to these vibrational fundamentals, the spectrum shows a spectroscopic feature at 1461 cm−1 that is also seen as a somewhat less prominent signal in the m / z = 71 spectrum (see bands marked with asterisks in Figure 5). From the anharmonic force field calculations, this feature is not compatible with a binary but, possibly, a ternary combination mode comprising the three energetically lowest fundamental modes, ν 7 + ν 8 + ν 12 . However, from the present investigation, a definitive assignment is not feasible.

3. Materials and Methods

3.1. Quantum-Chemical Calculations

Theoretical molecular structures of both CH2Cl+ ( C 2 v ) and CH3ClH+ ( C s ) have previously been provided on several occasions (e.g., Refs. [12,22,23,24,25]). In the present study, complementary quantum-chemical calculations of CH2Cl+ and CH3ClH+ (as well as their isostructural and isoelectronic sulfur analogs, H2CS and CH3SH) were performed at the coupled cluster single and double (CCSD) level augmented by a perturbative treatment of triple excitations (CCSD(T)) [26], together with correlation-consistent (augmented) polarized valence and (augmented) polarized weighted core–valence basis sets, i.e., cc-pVXZ [27], aug-cc-pVXZ [27,28,29], and cc-pwCVXZ [27,30] (with X = T, Q). For basis sets denoted as cc-pV(X + d)Z or aug-cc-pV(X + d)Z, an additional tight d function [31] was added to the chlorine (and sulfur) atom only, while for all other elements, cc-pV(X)Z or aug-cc-pV(X)Z was used, respectively. Equilibrium geometries were calculated using analytic gradient techniques [32], while harmonic frequencies were computed using analytic second-derivative techniques [33,34]. For anharmonic computations, second-order vibrational perturbation theory (VPT2) [35] was employed, and an additional numerical differentiation of analytic second derivatives was applied to obtain the third and fourth derivatives required for the application of VPT2 [34,36]. The frozen core approximation is indicated throughout with “fc”, and “ae” indicates that all electrons were used in the correlation treatment. All calculations were carried out using the CFOUR program package [37,38].

3.2. Experiment

Experimental infrared action spectroscopic characterization of CH2Cl+ and CH3ClH+ was performed in selected wavenumber ranges from 500 to 2900 cm−1 using a cryogenic 22-pole ion trap apparatus FELion connected to the Free Electron Laser for Infrared eXperiments (FELIX) [39], located at Radboud University (Nijmegen, the Netherlands). The FELion apparatus and its central part, the 22-pole ion trap, have been described elsewhere in detail [40,41], and the experimental conditions applied were similar to those used in other recent studies of molecular ions [16,17,42,43,44]. CH235,37Cl+ ( m / z = 49 , 51 ) and CH335,37ClH+ ( m / z = 51 , 53 ) were produced in an ion source under the same experimental conditions from commercially available methyl chloride, CH3Cl, using electron impact ionization at an electron energy of about 30 eV. Because of the high natural abundance of 37Cl (24.24%), the corresponding heavy isotopologs CH237Cl+ and CH337ClH+ were easily accessible. It should be stressed that CH237Cl+ and CH335ClH+ are isobaric species ( m / z = 51 ) ; hence, the corresponding spectra were expected to appear superimposed in the same scan.
After extracting the ion cloud from the source and selection in the first quadrupole mass analyzer, the m / z of choice was introduced into the 22-pole ion trap, where it was cooled via a cold pulse of a 3:1 mixture of He:Ne kept at a nominal temperature of 8 K and at a high number density, leading to efficient tagging with Ne atoms. Per filling cycle of the ion trap, typically, several thousand cation–Ne complexes (CH235,37Cl+–Ne at m / z = 69 / 71 or CH335,37ClH+–Ne at m / z = 71 , 73 ) can be formed via three-body collisions (Figure A1 in Appendix C). After a selected storage time of typically 1.6 or 2.6 s, the trap content was extracted from the trap, mass-filtered in a second quadrupole mass analyzer, and counted using a very sensitive Daly-type detector.
In the infrared photodissociation (IRPD) action spectroscopy scheme employed herein, the number of singly tagged CH2Cl+-Ne cluster ions (similar for CH3ClH+-Ne) was monitored while the FELIX (FEL-2) IR radiation traversing the ion trap was tuned in wavenumber. FELIX was operated in a pulsed mode (10 Hz), with typical pulse energies of a few up to a few tens of mJ (measured at the exit of the ion trap) and a Fourier-limited full width at half maximum (FWHM) bandwidth on the order of 0.7%. When a vibrational mode of the cluster and the radiation source are coincident in wavenumber, dissociation of the cluster occurs, resulting in depletion in the ion–Ne counts. Finally, several power-normalized spectra were co-added to obtain the final spectrum. Details on the normalization procedure have been given in Ref. [41].
Since the weakly bound, rare gas Ne generally only slightly perturbs the structure of the ion, an IRPD spectrum is highly representative of that of the bare ion (e.g., Refs. [16,17,21,44]). Band parameters such as positions and FWHM were obtained by fitting (multi-component) Gaussian profiles to the experimental spectra. Typical wavenumber uncertainties of 0.5% are mainly dependent on calibration uncertainties due to the grating spectrum analyzer.

4. Conclusions

The present study reports on the first infrared gas-phase study of CH2Cl+ and the first spectroscopic detection and characterization of CH3ClH+, two fundamental chlorine-bearing ions possibly linked to the astrochemical gas-phase production of methyl chloride, CH3Cl. Now that the IR spectra of CH2Cl+ and CH3ClH+ have been detected at low spectral resolution, corresponding studies at high resolution are imperative, in particular, to permit radio astronomical searches. Following the very recent technical developments in action spectroscopy of molecular ions, high-resolution infrared spectroscopy of both species may be performed using leak-out spectroscopy [45], a new method that does not require any rare gas tagging and has already been shown, on several occasions, to yield spectra of superb signal-to-noise ratios [46,47,48,49]. The method may even be combined with millimeter-wave radiation in a double-resonance fashion to derive accurate information about the pure rotational spectrum [46,47,50], a prerequisite for radio astronomy. Using the high-level CCSD(T) structural and force field calculations performed here, very good predictions of the ground state rotational and centrifugal distortion constants can be derived. These estimates may even be further improved using a simple scaling procedure, if experimental data of isostructural/isoelectronic species are available (see, e.g., Refs. [16,50,51]). As the Cl+ ion is isoelectronic with neutral atomic S, thioformaldehyde, H2CS, and methyl mercaptan, CH3SH, may potentially be used as calibrators, the pure rotational spectra of which are very well known from previous microwave and millimeter-wave studies (see, e.g., Refs. [52,53] for recent reports). Calculated and experimental rotational constants of H2CS and CH3SH (structural parameters are given in Appendix B) as well as calculated constants of CH2Cl+ and CH3ClH+ are collected in Table 5. For the sulfur species, the agreement between the calculated and experimental ground state rotational constants is already very good. Consequently, the scaling factors, i.e., the ratios A 0 , e x p / A 0 , c a l c , B 0 , e x p / B 0 , c a l c , and C 0 , e x p / C 0 , c a l c are almost but not quite unity. Multiplying those factors with the calculated ground state rotational constants of CH2Cl+ and CH3ClH+ finally yields the scaled best-estimate rotational constants in the last column of Table 5. Both species are very polar with center-of-mass frame equilibrium dipole moment components μ a = 3.02  D of CH2Cl+ as well as μ a = 1.22  D and μ b = 1.42  D of CH3ClH+.
From a chemical viewpoint, extending the spectroscopy of CH2X+ and CH3XH+ to halogens other than chlorine also seems appealing. The situation for X=Br, for example, appears similar to the one with X=Cl prior to the present study. To date, spectroscopic studies of CH2Br+ have been restricted to infrared matrix isolation [12,54]. Protonated methyl bromide, CH3BrH+, seems not to have been spectroscopically studied to date.

Author Contributions

Conceptualization, S.T., P.C.S., O.A. and S.S.; software, S.T. and L.B.; formal analysis, S.T., T.D. and L.B.; investigation, S.T., K.S., T.D., P.C.S. and S.B.; writing—original draft preparation, S.T.; writing—review and editing, S.T., K.S., T.D., P.C.S., L.B., O.A., S.B. and S.S.; visualization, S.T. and L.B.; project administration, S.T., K.S. and S.B.; funding acquisition, S.T., O.A. and S.S. All authors have read and agreed to the published version of the manuscript.

Funding

We gratefully acknowledge the support of Radboud University and of the Nederlandse Organisatie voor Wetenschappelijk Onderzoek (NWO) in providing the required beam time at the FELIX laboratory. This work was additionally funded by the Deutsche Forschungsgemeinschaft (DFG) via Grant No. SCHL 341/15-1 “Cologne Center for Terahertz Spectroscopy”, and via SFB 1601 (project ID 500700252), sub-projects B8 and C4. K.S. is supported by the research program “HFML-FELIX: a Dutch Centre of Excellence for Science under Extreme Conditions” (with project number: 184.035.011) of the research program “Nationale Roadmap Grootschalige Wetenschappelijke Infastructuur”, which is financed by the NWO.

Institutional Review Board Statement

Not applicable.

Informed Consent Statement

Not applicable.

Data Availability Statement

Data are contained within the article.

Acknowledgments

We thank the FELIX staff for assistance during the FELIX shifts, Marcel Bast for data reduction support, and Christian P. Endres for helpful discussions. Furthermore, we thank the Regional Computing Center of the University of Cologne (RRZK) for providing computing time on the DFG-funded High-Performance Computing system CHEOPS (Funding number: INST 216/512/1FUGG) as well as for additional support.

Conflicts of Interest

The authors declare no conflicts of interest.

Appendix A. Molecular Structures of CH2Cl+ and CH3ClH+ and Their Weakly Bound Clusters with Neon

Appendix A.1. CH2Cl+

CL
C 1 r1
H 2 r2 1 a1
H 2 r2 1 a1 3 d180
       cc-pV(T+d)Z / aug-cc-pV(T+d)Z / cc-pwCVQZ
r1   =   1.59619   /   1.59662       /   1.58812
r2   =   1.08829   /   1.08860       /   1.08620
a1   = 119.09851   / 119.03255       / 119.07897
d180 = 180.00000   / 180.00000       / 180.00000

Appendix A.2. CH2Cl+ Ne-ip

CL
C 1 r1
H 2 r2 1 a1
H 2 r3 1 a2 3 d180
NE 4 r4 2 a3 3 d180
      aug-cc-pV(T+d)Z
r1   =    1.59672
r2   =    1.08853
a1   =  119.01368
r3   =    1.08827
a2   =  118.82770
d180 =  180.00000
r4   =    2.39056
a3   =  133.32909

Appendix A.3. CH2Cl+ Ne-oop

CL
C 1 r1
NE 2 rNE 1 aNE
H 2 r2 3 a1 1 d1
H 2 r2 3 a1 1 md1
      aug-cc-pV(T+d)Z
r1   =    1.59691
rNE  =    2.79264
aNE  =  108.25118
r2   =    1.08829
a1   =   81.35078
d1   =  117.85276
md1  = −117.85276

Appendix A.4. CH3ClH+

H
C 1 r1
CL 2 r2 1 a1
H 3 r3 2 a2 1 d180
H 2 r4 3 a3 1 d1
H 2 r4 3 a3 1 md1
       cc-pV(T+d)Z / aug-cc-pV(T+d)Z / cc-pwCVQZ
r1   =    1.08652  /    1.08729     /    1.08435
r2   =    1.85970  /    1.86174     /    1.84696
a1   =  101.97978  /  101.91486     /  102.10778
r3   =    1.29569  /    1.29687     /    1.29436
a2   =   99.43628  /   99.36597     /   99.64973
d180 =  180.00000  /  180.00000     /  180.00000
r4   =    1.08443  /    1.08514     /    1.08215
a3   =  105.70626  /  105.53383     /  105.84821
d1   =  118.70156  /  118.73149     /  118.68039
md1  = −118.70156  / −118.73149     / −118.68039

Appendix A.5. CH3ClH+–Ne, p-bound

H
C 1 r1
CL 2 r2 1 a1
H 3 r3 2 a2 1 d180
H 2 r4 3 a3 1 d1
H 2 r4 3 a3 1 md1
X 4 rd 3 a90 2 d180
NE 4 r5 7 a4 3 d180
r1   =        1.08720
r2   =        1.85987
a1   =      102.05144
r3   =        1.29827
a2   =       99.19249
d180 =      180.00000
r4   =        1.08515
a3   =      105.57033
d1   =      118.75594
md1  =     −118.75594
rd   =        1.00000
a90  =       90.00000
r5   =        2.07322
a4   =       94.38835

Appendix A.6. CH3ClH+–Ne, CH3/Cl-bound

H
C 1 r1
CL 2 r2 1 a1
H 3 r3 2 a2 1 d180
H 2 r4 3 a3 1 d1
H 2 r4 3 a3 1 md1
X 1 rd 2 a90 3 d0
NE 1 r5 7 a4 2 d180
r1   =        1.08692
r2   =        1.86155
a1   =      101.81875
r3   =        1.29674
a2   =       99.27846
d180 =      180.00000
r4   =        1.08514
a3   =      105.52239
d1   =      118.75328
md1  =     −118.75328
rd   =        1.00000
a90  =       90.00000
d0   =        0.00000
r5   =        2.57934
a4   =       40.24330

Appendix B. Molecular Structures of H2CS and CH3SH

Appendix B.1. H2CS

S
C 1 r1
H 2 r2 1 a1
H 2 r2 1 a1 3 d180
            cc-pV(T+d)Z / cc-pwCVQZ
r1   =          1.61826 /   1.60890
r2   =          1.08766 /   1.08531
a1   =        121.92777 / 121.85524
d180 =        180.00000 / 180.00000

Appendix B.2. CH3SH

H
C 1 r1
S 2 r2 1 a1
H 3 r3 2 a2 1 d180
H 2 r4 3 a3 1 d1
H 2 r4 3 a3 1 md1
            cc-pV(T+d)Z /  cc-pwCVQZ
r1   =          1.08915 /    1.08669
r2   =          1.82085 /    1.81020
a1   =        106.24841 /  106.25194
r3   =          1.33803 /    1.33502
a2   =         96.64050 /   96.88414
d180 =        180.00000 /  180.00000
r4   =          1.08804 /    1.08554
a3   =        111.27155 /  111.25848
d1   =        118.26139 /  118.25357
md1  =       −118.26139 / −118.25357

Appendix C. Mass Spectrum of CH2Cl+ and CH2Cl+–Ne as Extracted from the Ion Trap
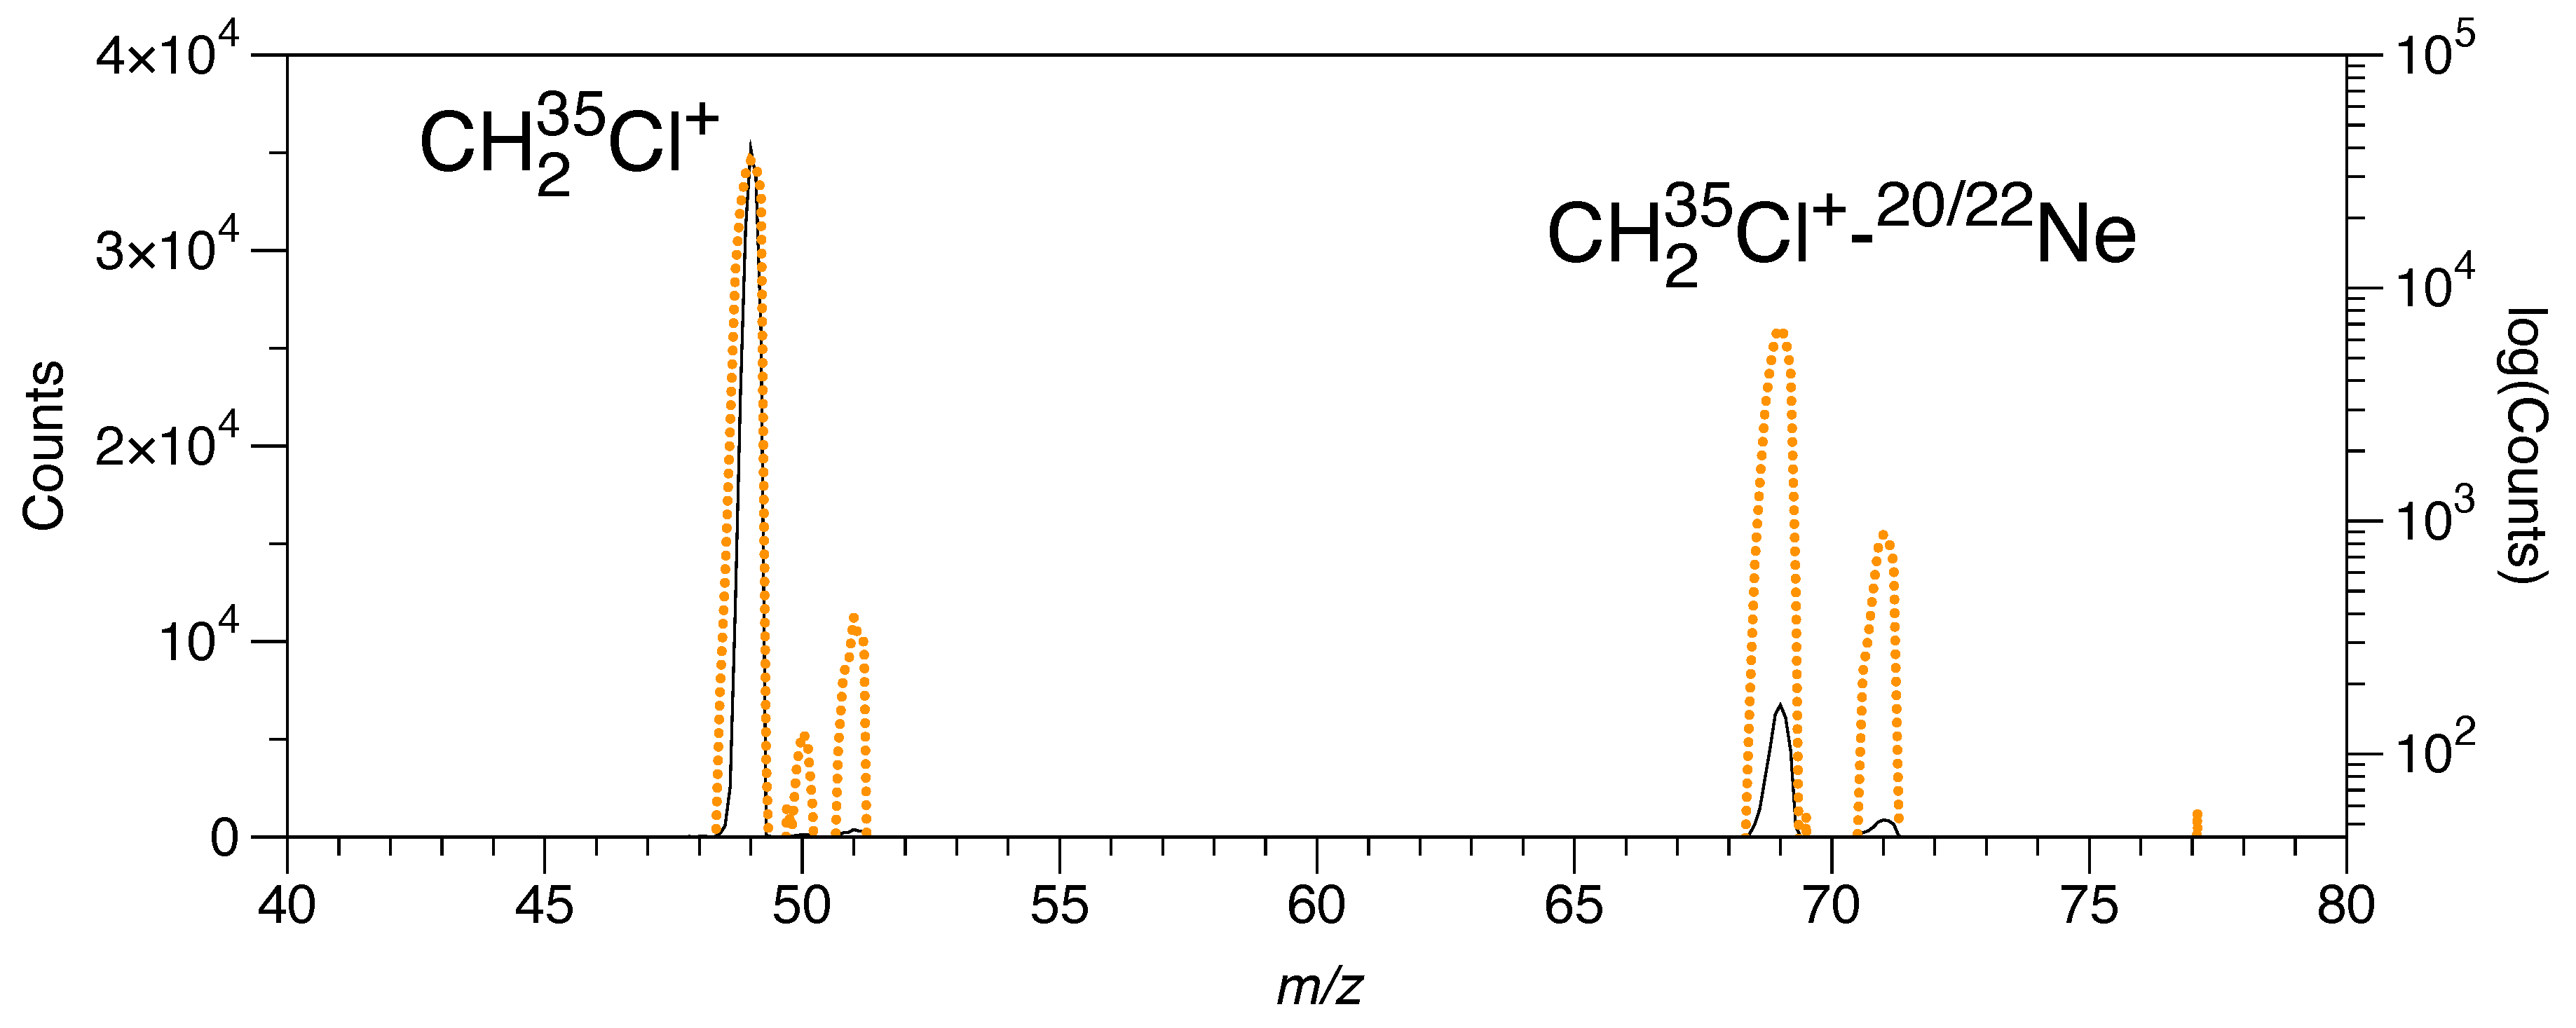
Figure A1. Trap content extracted after initial mass selection for m / z = 49 , trapping and cooling in the 8 K He/Ne-bath of the 22-pole ion trap featuring some 35,000 CH2Cl+ ions and almost 7000 weakly bound clusters with 20Ne available for IRPD. Black trace and left ordinate: linear plot of counts; orange dotted trace and right ordinate: logarithmic plot of counts.
Molecules 29 00665 g0a1

References

  1. Müller, H.S.P.; Thorwirth, S.; Roth, D.A.; Winnewisser, G. The Cologne Database for Molecular Spectroscopy, CDMS. Astron. Astrophys. 2001, 370, L49–L52. [Google Scholar] [CrossRef]
  2. Endres, C.P.; Schlemmer, S.; Schilke, P.; Stutzki, J.; Müller, H.S.P. The Cologne Database for Molecular Spectroscopy, CDMS, in the Virtual Atomic and Molecular Data Centre, VAMDC. J. Mol. Spectrosc. 2016, 327, 95–104. [Google Scholar] [CrossRef]
  3. Blake, G.A.; Keene, J.; Phillips, T.G. Chlorine in dense interstellar clouds—The abundance of HCl in OMC-1. Astrophys. J. 1985, 295, 501–506. [Google Scholar] [CrossRef]
  4. Cernicharo, J.; Guélin, M. Metals in IRC+10216—Detection of NaCl, AlCl, and KCl, and tentative detection of AlF. Astron. Astrophys. 1987, 183, L10–L12. [Google Scholar]
  5. De Luca, M.; Gupta, H.; Neufeld, D.; Gerin, M.; Teyssier, D.; Drouin, B.J.; Pearson, J.C.; Lis, D.C.; Monje, R.; Phillips, T.G.; et al. Herschel/HIFI discovery of HCl+ in the interstellar medium. Astrophys. J. 2012, 751, L37. [Google Scholar] [CrossRef]
  6. Lis, D.C.; Pearson, J.C.; Neufeld, D.A.; Schilke, P.; Müller, H.S.P.; Gupta, H.; Bell, T.A.; Comito, C.; Phillips, T.G.; Bergin, E.A.; et al. Herschel/HIFI discovery of interstellar chloronium (H2Cl+). Astron. Astrophys. 2010, 521, L9. [Google Scholar] [CrossRef]
  7. Fayolle, E.C.; Öberg, K.I.; Jørgensen, J.K.; Altwegg, K.; Calcutt, H.; Müller, H.S.P.; Rubin, M.; van der Wiel, M.H.D.; Bjerkeli, P.; Bourke, T.L.; et al. Protostellar and cometary detections of organohalogens. Nat. Astron. 2017, 1, 703–708. [Google Scholar] [CrossRef]
  8. Acharyya, K.; Herbst, E. Gas-grain Fluorine and Chlorine Chemistry in the Interstellar Medium. Astrophys. J. 2017, 850, 105. [Google Scholar] [CrossRef]
  9. Berné, O.; Martin-Drumel, M.A.; Schroetter, I.; Goicoechea, J.R.; Jacovella, U.; Gans, B.; Dartois, E.; Coudert, L.H.; Bergin, E.; Alarcon, F.; et al. Formation of the methyl cation by photochemistry in a protoplanetary disk. Nature 2023, 621, 56–59. [Google Scholar] [CrossRef] [PubMed]
  10. Andrews, L.; Dyke, J.M.; Jonathan, N.; Keddar, N.; Morris, A.; Ridha, A. The first band in the He(I) photoelectron spectrum of the CH2Cl free radical. Chem. Phys. Lett. 1983, 97, 89–93. [Google Scholar] [CrossRef]
  11. Andrews, L.; Dyke, J.M.; Jonathan, N.; Keddar, N.; Morris, A. Photoelectron spectroscopic study of the ground states of CH2Cl+, CHCl2+, and CHFCl+. J. Am. Chem. Soc. 1984, 106, 299–303. [Google Scholar] [CrossRef]
  12. Ma, R.; Chen, M.; Zhou, M. Infrared Spectra of the Chloromethyl and Bromomethyl Cations in Solid Argon. J. Phys. Chem. A 2009, 113, 12926–12931. [Google Scholar] [CrossRef] [PubMed]
  13. Heck, A.J.; de Koning, L.J.; Nibbering, N.M. On the structure and unimolecular chemistry of protonated halomethanes. Int. J. Mass. Spectrom. Ion Processes 1991, 109, 209–225. [Google Scholar] [CrossRef]
  14. Herman, J.A.; Xu, G.; Herman, K.; McMahon, T.B. Fourier transform ion cyclotron resonance mass spectrometry measurements of rate constants of ion/molecule reactions with continuous ejection of product ions. Reactions of CH3ClH+ with methyl chloride. Int. J. Mass. Spectrom. Ion Processes 1992, 113, 143–155. [Google Scholar] [CrossRef]
  15. Coriani, S.; Marchesan, D.; Gauss, J.; Hättig, C.; Helgaker, T.; Jørgensen, P. The accuracy of ab initio molecular geometries for systems containing second-row atoms. J. Chem. Phys. 2005, 123, 184107. [Google Scholar] [CrossRef] [PubMed]
  16. Thorwirth, S.; Harding, M.E.; Asvany, O.; Brünken, S.; Jusko, P.; Lee, K.L.K.; Salomon, T.; McCarthy, M.C.; Schlemmer, S. Descendant of the X-ogen carrier and a ‘mass of 69’: Infrared action spectroscopic detection of HC3O+ and HC3S+. Mol. Phys. 2020, 118, e1776409. [Google Scholar] [CrossRef]
  17. Thorwirth, S.; Asvany, O.; Harding, M.E.; Jusko, P.; McCarthy, M.C.; Brünken, S.; Schlemmer, S. Infrared action spectroscopy of fundamental nitrilium ions: Protonated vinyl- and ethyl cyanide. J. Mol. Spectrosc. 2022, 386, 111615. [Google Scholar] [CrossRef]
  18. Botschwina, P.; Dutoi, T.; Mladenovic, M.; Oswald, R.; Schmatz, S.; Stoll, H. Theoretical investigations of proton-bound cluster ions. Faraday Discuss. 2001, 118, 433–453. [Google Scholar] [CrossRef]
  19. Botschwina, P.; Oswald, R. Complexes of an argon atom with linear cations: Results of coupled cluster calculations. J. Mol. Spectrosc. 2003, 222, 46–56. [Google Scholar] [CrossRef]
  20. Pivonka, N.L.; Kaposta, C.; Brümmer, M.; von Helden, G.; Meijer, G.; Wöste, L.; Neumark, D.M.; Asmis, K.R. Probing a strong hydrogen bond with infrared spectroscopy: Vibrational predissociation of BrHBr·Ar. J. Chem. Phys. 2003, 118, 5275–5278. [Google Scholar] [CrossRef]
  21. Brünken, S.; Lipparini, F.; Stoffels, A.; Jusko, P.; Redlich, B.; Gauss, J.; Schlemmer, S. Gas-Phase Vibrational Spectroscopy of the Hydrocarbon Cations l-C3H+, HC3H+, and c-C3 H 2 + : Structures, Isomers, and the Influence of Ne-Tagging. J. Phys. Chem. A 2019, 123, 8053–8062. [Google Scholar] [CrossRef] [PubMed]
  22. Smith, S.F.; Chandrasekhar, J.; Jorgensen, W.L. Ab initio study of acid-base interactions. Proton, lithium, and sodium affinities of first- and second-row bases. J. Phys. Chem. 1982, 86, 3308–3318. [Google Scholar] [CrossRef]
  23. Hess, B.A.; Zahradnik, R. Theoretical study of reactivity of methane, methyl fluoride, and methyl chloride: Interaction with their radical cations and proton donors. J. Am. Chem. Soc. 1990, 112, 5731–5735. [Google Scholar] [CrossRef]
  24. Nichols, L.S.; McKee, M.L.; Illies, A.J. An Experimental and Theoretical Investigation of Ion-Molecule Reactions Involving Methyl Halide Radical Cations with Methyl Halides. J. Am. Chem. Soc. 1998, 120, 1538–1544. [Google Scholar] [CrossRef]
  25. Kalescky, R.; Kraka, E.; Cremer, D. Are carbon-halogen double and triple bonds possible? Int. J. Quantum Chem. 2014, 114, 1060–1072. [Google Scholar] [CrossRef]
  26. Raghavachari, K.; Trucks, G.W.; Pople, J.A.; Head-Gordon, M. A 5th-order perturbation comparison of electron correlation theories. Chem. Phys. Lett. 1989, 157, 479–483. [Google Scholar] [CrossRef]
  27. Dunning, T.H. Gaussian basis sets for use in correlated molecular calculations. 1. The atoms boron through neon and hydrogen. J. Chem. Phys. 1989, 90, 1007–1023. [Google Scholar] [CrossRef]
  28. Kendall, R.A.; Dunning, T.H.; Harrison, R.J. Electron affinities of the first-row atoms revisited. Systematic basis sets and wave functions. J. Chem. Phys. 1992, 96, 6796–6806. [Google Scholar] [CrossRef]
  29. Woon, D.E.; Dunning, T.H. Gaussian basis sets for use in correlated molecular calculations. III. The atoms aluminum through argon. J. Chem. Phys. 1993, 98, 1358–1371. [Google Scholar] [CrossRef]
  30. Peterson, K.A.; Dunning, T.H. Accurate correlation consistent basis sets for molecular core–valence correlation effects: The second row atoms Al-Ar and the first row atoms B-Ne revisited. J. Chem. Phys. 2002, 117, 10548–10560. [Google Scholar] [CrossRef]
  31. Dunning, T.H.; Peterson, K.A.; Wilson, A.K. Gaussian basis sets for use in correlated molecular calculations. X. The atoms aluminum through argon revisited. J. Chem. Phys. 2001, 114, 9244–9253. [Google Scholar] [CrossRef]
  32. Watts, J.D.; Gauss, J.; Bartlett, R.J. Open-shell analytical energy gradients for triple excitation many-body, coupled-cluster methods—MBPT(4), CCSD+T(CCSD), CCSD(T), and QCISD(T). Chem. Phys. Lett. 1992, 200, 1–7. [Google Scholar] [CrossRef]
  33. Gauss, J.; Stanton, J.F. Analytic CCSD(T) second derivatives. Chem. Phys. Lett. 1997, 276, 70–77. [Google Scholar] [CrossRef]
  34. Stanton, J.F.; Gauss, J. Analytic second derivatives in high-order many-body perturbation and coupled-cluster theories: Computational considerations and applications. Int. Rev. Phys. Chem. 2000, 19, 61–95. [Google Scholar] [CrossRef]
  35. Mills, I.M. Vibration-Rotation Structure in Asymmetric- and Symmetric-TopMolecules. In Molecular Spectroscopy: Modern Research; Rao, K.N., Mathews, C.W., Eds.; Academic Press: New York, NY, USA, 1972; pp. 115–140. [Google Scholar]
  36. Stanton, J.F.; Lopreore, C.L.; Gauss, J. The equilibrium structure and fundamental vibrational frequencies of dioxirane. J. Chem. Phys. 1998, 108, 7190–7196. [Google Scholar] [CrossRef]
  37. Matthews, D.A.; Cheng, L.; Harding, M.E.; Lipparini, F.; Stopkowicz, S.; Jagau, T.C.; Szalay, P.G.; Gauss, J.; Stanton, J.F. Coupled-cluster techniques for computational chemistry: The CFOUR program package. J. Chem. Phys. 2020, 152, 214108. [Google Scholar] [CrossRef] [PubMed]
  38. Harding, M.E.; Metzroth, T.; Gauss, J.; Auer, A.A. Parallel calculation of CCSD and CCSD(T) analytic first and second derivatives. J. Chem. Theory Comput. 2008, 4, 64–74. [Google Scholar] [CrossRef]
  39. Oepts, D.; van der Meer, A.F.G.; van Amersfoort, P.W. The Free-Electron-Laser user facility FELIX. Infrared Phys. Technol. 1995, 36, 297–308. [Google Scholar] [CrossRef]
  40. Asvany, O.; Bielau, F.; Moratschke, D.; Krause, J.; Schlemmer, S. New design of a cryogenic linear RF multipole trap. Rev. Sci. Instr. 2010, 81, 076102. [Google Scholar] [CrossRef]
  41. Jusko, P.; Brünken, S.; Asvany, O.; Thorwirth, S.; Stoffels, A.; van der Meer, L.; Berden, G.; Redlich, B.; Oomens, J.; Schlemmer, S. The FELion cryogenic ion trap beam line at the FELIX free-electron laser laboratory: Infrared signatures of primary alcohol cations. Faraday Discuss. 2019, 217, 172–202. [Google Scholar] [CrossRef]
  42. Asvany, O.; Thorwirth, S.; Redlich, B.; Schlemmer, S. Spectroscopy of the low-frequency vibrational modes of CH 3 + isotopologs. J. Mol. Spectrosc. 2018, 347, 1–6. [Google Scholar] [CrossRef]
  43. Asvany, O.; Schlemmer, S.; Szidarovszky, T.; Császár, A.G. Infrared Signatures of the HHe n + DHe n + (n = 3 − 6) Complexes. J. Phys. Chem. Lett. 2019, 10, 5325–5330. [Google Scholar] [CrossRef]
  44. Marimuthu, A.N.; Veld, F.H.i.; Thorwirth, S.; Redlich, B.; Brünken, S. Infrared predissociation spectroscopy of protonated methyl cyanide, CH3CNH+. J. Mol. Spectrosc. 2021, 379, 111477. [Google Scholar] [CrossRef]
  45. Schmid, P.C.; Asvany, O.; Salomon, T.; Thorwirth, S.; Schlemmer, S. Leak-Out Spectroscopy, A Universal Method of Action Spectroscopy in Cold Ion Traps. J. Phys. Chem. A 2022, 126, 8111–8117. [Google Scholar] [CrossRef]
  46. Asvany, O.; Thorwirth, S.; Schmid, P.C.; Salomon, T.; Schlemmer, S. High-resolution ro-vibrational and rotational spectroscopy of HC3O+. Phys. Chem. Chem. Phys. 2023. [Google Scholar] [CrossRef]
  47. Gupta, D.; Silva, W.G.D.P.; Doménech, J.L.; Plaar, E.; Thorwirth, S.; Schlemmer, S.; Asvany, O. High-resolution rovibrational and rotational spectroscopy of the singly deuterated cyclopropenyl cation, c-C3H2D+. Faraday Discuss. 2023, 245, 298–308. [Google Scholar] [CrossRef]
  48. Schlemmer, S.; Plaar, E.; Gupta, D.; Silva, W.G.D.P.; Salomon, T.; Asvany, O. High-resolution spectroscopy of the ν3 antisymmetric C–H stretch of C2 H 2 + using leak-out action spectroscopy. Mol. Phys. 2023, e2241567. [Google Scholar] [CrossRef]
  49. Bast, M.; Böing, J.; Salomon, T.; Thorwirth, S.; Asvany, O.; Schäfer, M.; Schlemmer, S. Ro-vibrational spectra of C-C stretching modes of C3H+ and HC3O+. J. Mol. Spectrosc. 2023, 398, 111840. [Google Scholar] [CrossRef]
  50. Silva, W.G.D.P.; Cernicharo, J.; Schlemmer, S.; Marcelino, N.; Loison, J.C.; Agúndez, M.; Gupta, D.; Wakelam, V.; Thorwirth, S.; Cabezas, C.; et al. Discovery of H2CCCH+ in TMC-1. Astron. Astrophys. 2023, 676, L1. [Google Scholar] [CrossRef]
  51. Martinez, O., Jr.; Lattanzi, V.; Thorwirth, S.; McCarthy, M.C. Detection of protonated vinyl cyanide, CH2CHCNH+, a prototypical branched nitrile cation. J. Chem. Phys. 2013, 138, 094316. [Google Scholar] [CrossRef]
  52. Müller, H.S.P.; Maeda, A.; Thorwirth, S.; Lewen, F.; Schlemmer, S.; Medvedev, I.R.; Winnewisser, M.; De Lucia, F.C.; Herbst, E. Laboratory spectroscopic study of isotopic thioformaldehyde, H2CS, and determination of its equilibrium structure. Astron. Astrophys. 2019, 621, A143. [Google Scholar] [CrossRef]
  53. Zakharenko, O.; Ilyushin, V.V.; Lewen, F.; Müller, H.S.P.; Schlemmer, S.; Alekseev, E.A.; Pogrebnyak, M.L.; Armieieva, I.A.; Dorovskaya, O.; Xu, L.H.; et al. Rotational spectroscopy of methyl mercaptan CH332SH at millimeter and submillimeter wavelengths. Astron. Astrophys. 2019, 629, A73. [Google Scholar] [CrossRef]
  54. George, L.; Kalume, A.; Reid, S.A. Pulsed-jet discharge matrix isolation and computational study of CX2Br+ (X = H, F). Chem. Phys. Lett. 2010, 484, 214–218. [Google Scholar] [CrossRef]
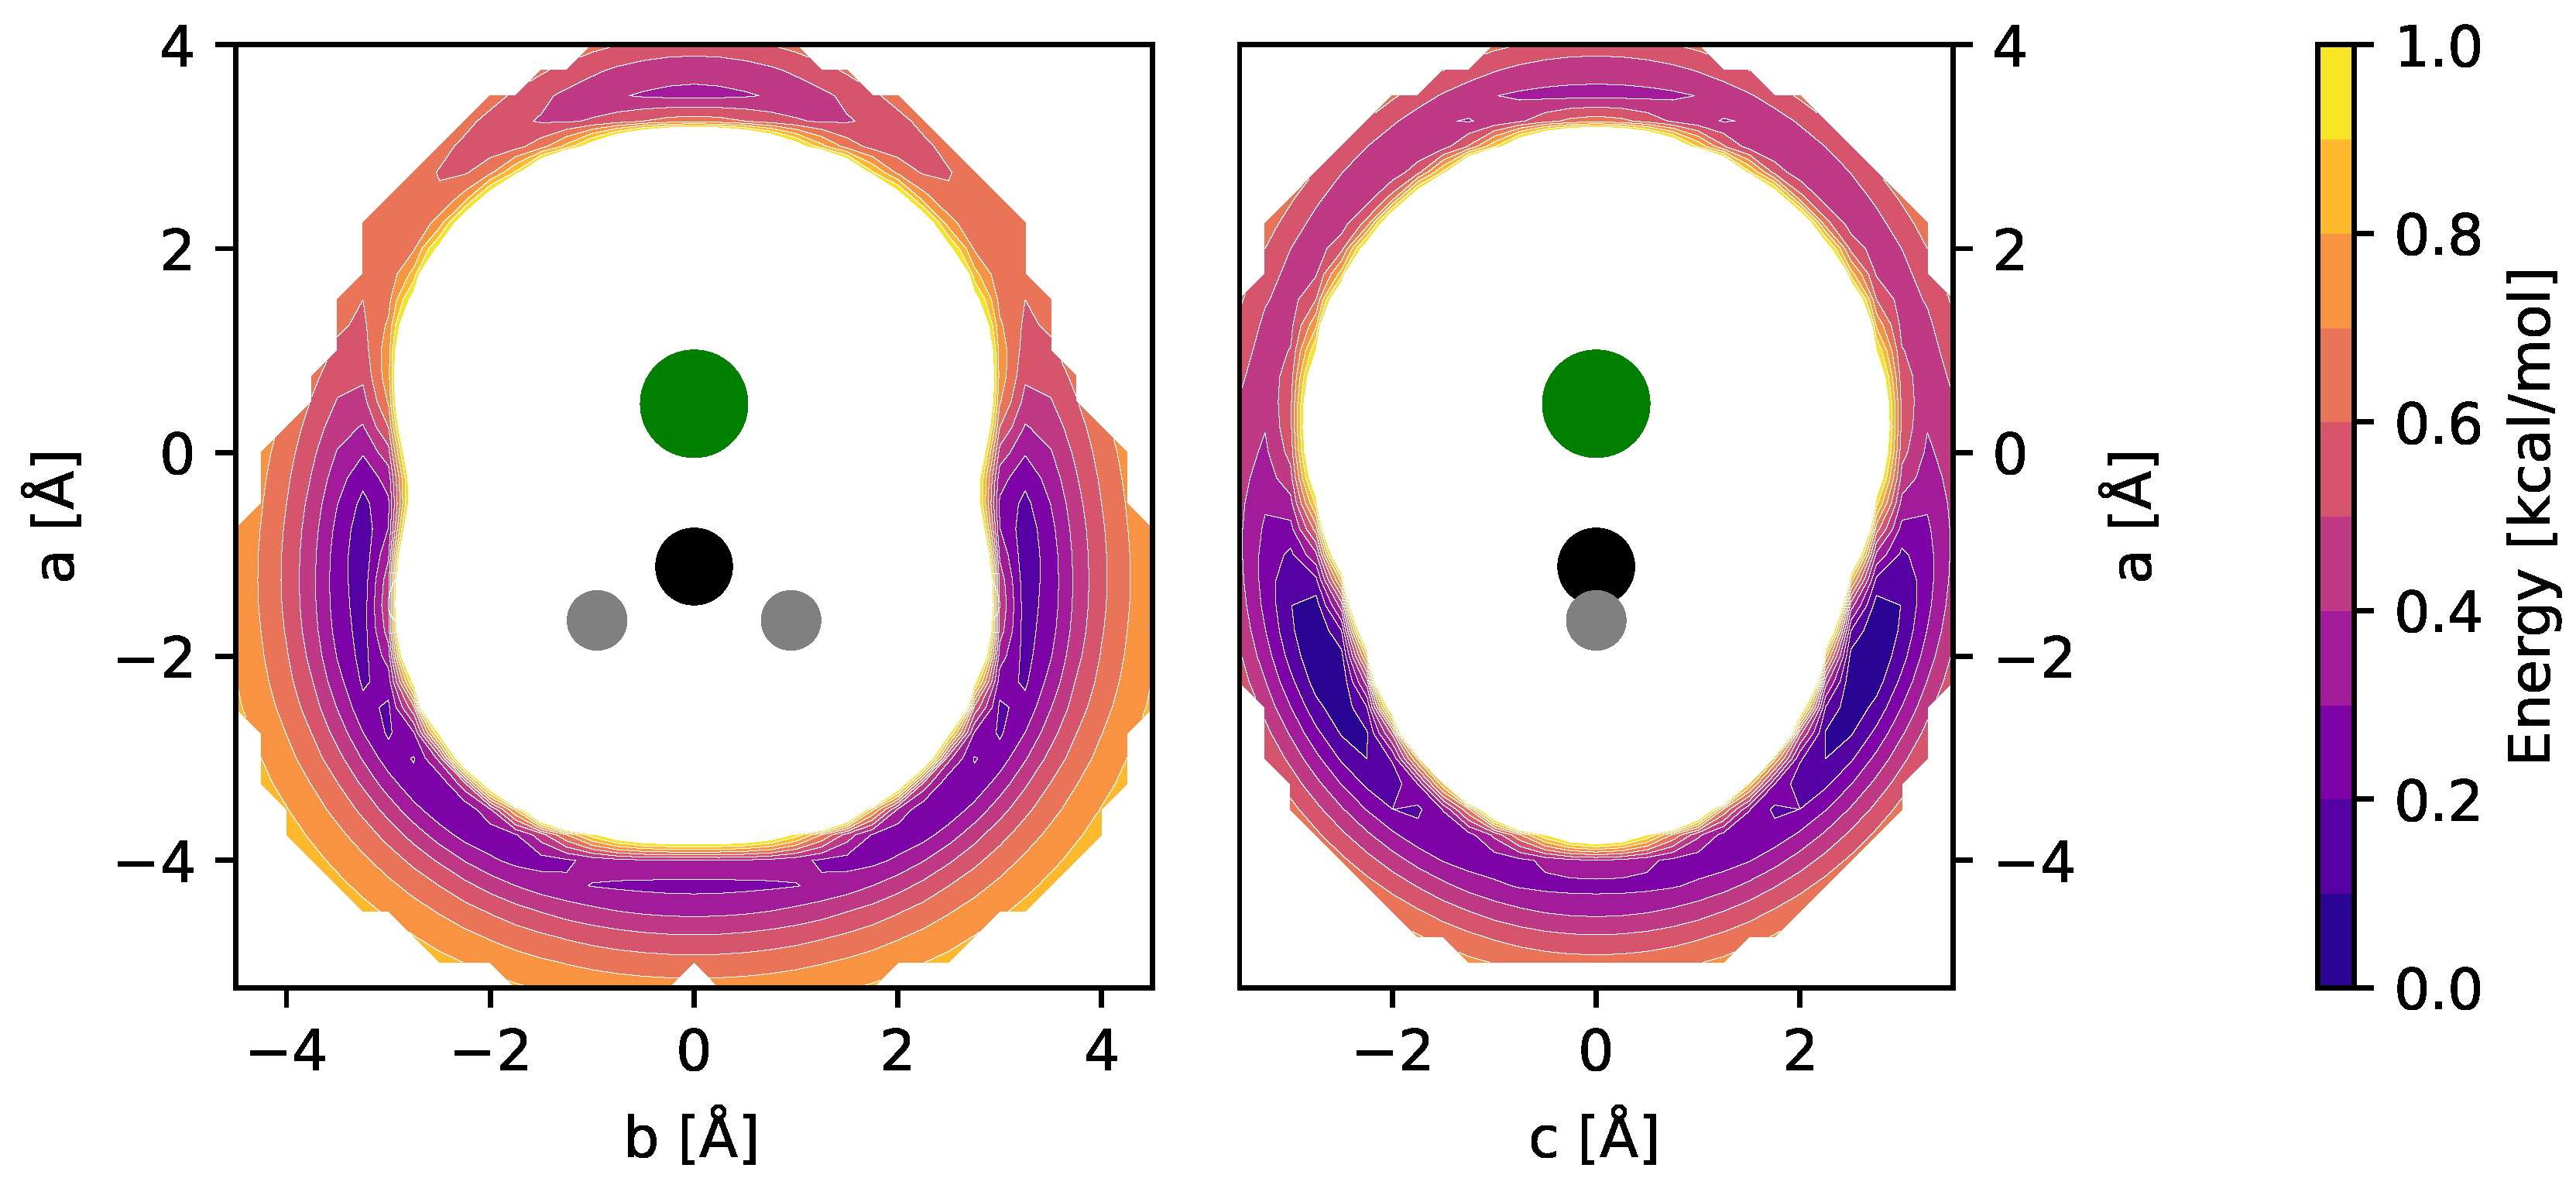
Figure 1. fc-CCSD(T)/aug-cc-pV(T + d)Z potential energy maps of the CH2Cl+–Ne weakly bound complex calculated in the two mirror planes of CH2Cl+ (see text for details). Atom color code: hydrogen (gray), carbon (black), chlorine (green). Contours show the potential energy of the complex as a function of the Ne atom position relative to the ion and cover the interval [0.1, 1.0] kcal/mol in steps of 0.1 kcal/mol above the global minimum.
Molecules 29 00665 g001
Figure 2. Bond lengths of CH2Cl+ and its complexes with neon (in Å; fc-CCSD(T)/aug-cc-pV(T + d)Z values of all three species given in regular font and fc-CCSD(T)/cc-pV(T + d)Z values of the bare species given in italics). Bare CH2Cl+ is of C 2 v symmetry, whereas the symmetry of the Ne-complexes is lowered to C s . Full sets of structural parameters are given in Appendix A. For further details, see text.
Molecules 29 00665 g002
Figure 3. fc-CCSD(T)/aug-cc-pV(T + d)Z potential energy map of the CH3ClH+–Ne weakly bound complex calculated in the mirror plane of CH3ClH+ (see text for details). Atom color code: hydrogen (gray), carbon (black), chlorine (green). Contours show the potential energy of the complex as a function of the Ne atom position relative to the ion and cover the interval [0.1, 1.0] kcal/mol in steps of 0.1 kcal/mol above the global minimum.
Molecules 29 00665 g003
Figure 4. Bond lengths of CH3ClH+ and the p-bound and CH3-bound complexes with neon (in Å; fc-CCSD(T)/aug-cc-pV(T + d)Z values of all three species given in regular font and fc-CCSD(T)/cc-pV(T + d)Z values of the bare species given in italics). All species exhibit C s symmetry. Full sets of structural parameters are given in Appendix A. For further details, see text.
Molecules 29 00665 g004
Figure 5. CH2Cl+–Ne and CH3ClH+–Ne infrared photodissociation (IRPD) spectra as obtained here. The traces indicate m / z = 69 corresponding to the CH235Cl+–Ne species (top spectrum in red), m / z = 71 (isobaric mixture of CH237Cl+–Ne and CH335ClH+–Ne, blue center trace) and m / z = 73 (CH337ClH+–Ne, green bottom trace). For comparison, the vibrational fundamentals from VPT2 calculations (fc-CCSD(T)/cc-pV(T + d)Z) of the bare ions are shown as inverted sticks. For clarity, the intensities of selected calculated and experimental bands have been multiplied by the factors indicated. For the CH3ClH+–Ne species, dashed sticks indicate blueshifts of the ν 8 and ν 7 bands and a redshift of the ν 3 band, which is indicative of Ne being bound to the proton in a near-linear Cl-H⋯Ne fashion. The bands labeled with an asterisk are not vibrational fundamentals. Insets highlight blueshifted satellites, presumably due to combination modes involving the Ne tag. For further details, see text.
Molecules 29 00665 g005
Table 1. Harmonic vibrational wavenumbers of CH235Cl+ and CH235Cl+–Ne calculated at the CCSD(T)/aug-cc-pV(T + d)Z level of theory (in cm−1) 1.
ModeBare IonNe–ipNe–oop
ω 1 CH sym stretching3102 ( a 1 , 18)3106 ( a , 17)3105 ( a , 16)
ω 2 CH2 scissoring1478 ( a 1 , 0.3)1476 ( a , 1)1478 ( a , 0.2)
ω 3 Cl–C stretching1059 ( a 1 , 80)1059 ( a , 78)1058 ( a , 82)
ω 4 oop bending1137 ( b 1 , 22)1138 ( a , 21)1136 ( a , 20)
ω 5 CH asym stretching3239 ( b 2 , 51)3243 ( a , 59)3243 ( a , 50)
ω 6 CH2 wagging1047 ( b 2 , 0.02)1048 ( a , 0.3)1047 ( a , 0.003)
ω 7  2,393 ( a , 21)131 ( a , 1)
ω 8  2,470 ( a , 0.2)89 ( a , 22)
ω 9  2,525 ( a , 1)34 ( a , 4)
1 Mode symmetries and infrared band intensities (km/mol) are given in parentheses. Mode indices of the Ne-tagged variants are borrowed from bare CH2Cl+ for the sake of comparability. 2 Extra-low-frequency vibrational modes introduced through Ne-tag, arbitrary mode index. 3 H–Ne stretching (Ne-ip species) and CH2 twisting (Ne-oop species). 4 C–H–Ne stretching oop bending (Ne-ip species) and C–Ne stretching (Ne-oop species). 5 C–H–Ne ip bending (Ne-ip species) and Cl–C–Ne bending (Ne-oop species).
Table 2. Harmonic vibrational wavenumbers of CH335ClH+ and two CH335ClH+–Ne variants calculated at the CCSD(T)/aug-cc-pV(T + d)Z level of theory (in cm−1) 1.
ModeBare Ionp-boundCH3/Cl-bound
ω 1 C–H asym stretching3220 ( a , 18)3220 ( a , 17)3224 ( a , 20)
ω 2 C–H sym stretching3087 ( a , 5)3087 ( a , 5)3089 ( a , 5)
ω 3 Cl–H stretching2823 ( a , 176)2811 ( a , 307)2824 ( a , 174)
ω 4 CH3 asym bending1472 ( a , 14)1472 ( a , 14)1471 ( a , 13)
ω 5 CH3 umbrella1386 ( a , 11)1386 ( a , 11)1385 ( a , 10)
ω 6 CH3 ip rocking1118 ( a , 3)1120 ( a , 3)1118 ( a , 3)
ω 7 C-Cl-H bending771 ( a , 13)784 ( a , 11)773 ( a , 14)
ω 8 Cl–C stretching565 ( a , 51)570 ( a , 50)566 ( a , 50)
ω 9 C–H asym stretching3238 ( a , 15)3237 ( a , 15)3238 ( a , 15)
ω 10 CH3 asym bending1468 ( a , 14)1469 ( a , 14)1470 ( a , 12)
ω 11 CH3 oop rocking1040 ( a , 0.5)1040 ( a , 0.5)1040 ( a , 0.4)
ω 12 torsion202 ( a , 39)244 ( a , 43)211 ( a , 42)
ω 13  2,390 ( a , 7)69 ( a , 8)
ω 14  2,472 ( a , 7)46 ( a , 0.4)
ω 15  2,520 ( a , 7)40 ( a , 10)
1 Mode symmetries and infrared band intensities (km/mol) are given in parentheses. 2 Extra-low-frequency vibrational modes introduced through Ne-tag, arbitrary mode index. 3 H–Ne stretching. 4 Ne–H–Cl oop bending (p-bound species) and Ne–H–Cl ip bending (CH3/Cl-bound species). 5 Ne–H–Cl ip bending (p-bound species) and Ne–H–Cl oop bending (CH3/Cl-bound species).
Table 3. Harmonic and anharmonic fc-CCSD(T)/cc-pV(T + d)Z vibrational wavenumbers (in cm−1) and infrared band intensities (int, km/mol), experimental wavenumbers (exp, cm−1), full width at half maximum of observed bands (FWHM, cm−1), and difference between observed and calculated anharmonic wavenumbers δ (cm−1) of CH2Cl+.
ModeCH235Cl+
HarmAnharmIntExp 1FWHM δ
ν 1 ( a 1 ) CH sym stretching3105.22993.314 n c
ν 2 ( a 1 ) CH2 scissoring1491.11451.10.7
ν 3 ( a 1 ) Cl–C stretching1061.81045.6811048132
ν 4 ( b 1 ) oop bending1151.91134.127112917−5
ν 5 ( b 2 ) CH asym stretching3243.93101.147 n c
ν 6 ( b 2 ) CH2 wagging1054.81038.2<0.01
ModeCH237Cl+
HarmAnharmIntExp 1FWHM δ
ν 1 ( a 1 ) CH sym stretching3105.22993.314 n c
ν 2 ( a 1 ) CH2 scissoring1491.01451.00.7
ν 3 ( a 1 ) Cl–C stretching1053.61037.682103715−1
ν 4 ( b 1 ) oop bending1151.81134.027112513−9
ν 5 ( b 2 ) CH asym stretching3243.93101.147 n c
ν 6 ( b 2 ) CH2 wagging1054.21037.6<0.01
1 Wavenumber errors amount to 0.5% of the band position; n c : not covered.
Table 4. Harmonic and anharmonic fc-CCSD(T)/cc-pV(T + d)Z vibrational wavenumbers (in cm−1) and infrared band intensities (int, km/mol), experimental wavenumbers (exp, cm−1), full width at half maximum of observed bands (FWHM, cm−1), and difference between observed and calculated wavenumbers δ (cm−1) of CH3ClH+.
ModeCH335ClH+
HarmAnharmIntExp 1FWHM δ
ν 1 ( a ) C–H asym stretching3225.43084.916 n c
ν 2 ( a ) C–H sym stretching3091.62978.85 n c
ν 3 ( a ) Cl–H stretching2829.52713.5173267715−37
ν 4 ( a ) CH3 asym bending1465.11420.615141510−6
ν 5 ( a ) CH3 umbrella1378.21348.11013458−3
ν 6 ( a ) CH3 ip rocking1113.61080.83108392
ν 7 ( a ) C-Cl-H bending768.4757.11476699
ν 8 ( a ) Cl–C stretching569.8544.155551117
ν 9 ( a ) C–H asym stretching3242.93100.614 n c
ν 10 ( a ) CH3 asym bending1462.51419.615141510−5
ν 11 ( a ) CH3 oop rocking1033.21020.61blended
ν 12 ( a ) torsion205.5177.445 n c
ModeCH337ClH+
HarmAnharmIntExp 1FWHM δ
ν 1 ( a ) C–H asym stretching3225.43084.916 n c
ν 2 ( a ) C–H sym stretching3091.62978.85 n c
ν 3 ( a ) Cl–H stretching2827.32711.5173267820−34
ν 4 ( a ) CH3 asym bending1465.11420.515141613−5
ν 5 ( a ) CH3 umbrella1377.91347.910134411−4
ν 6 ( a ) CH3 ip rocking1112.71079.931082112
ν 7 ( a ) C-Cl-H bending768.1756.81476598
ν 8 ( a ) Cl–C stretching565.3539.956547117
ν 9 ( a ) C–H asym stretching3242.93100.614 n c
ν 10 ( a ) CH3 asym bending1462.51419.615141613−4
ν 11 ( a ) CH3 oop rocking1032.81020.211023123
ν 12 ( a ) torsion205.4177.345 n c
1 Wavenumber errors amount to 0.5% of the band position; n c : not covered.
Table 5. Rotational parameters of H2CS, CH235Cl+, CH3SH, and CH335ClH+ (in MHz) 1.
ParameterH2CSCH235Cl+
Calc.Exp. [52]Calc.Scaled
A e 295,043.772278,232.178
B e 17,770.90617,929.887
C e 16,761.34616,844.397
Δ A 0 1928.4022249.656
Δ B 0 76.36691.765
Δ C 0 109.739125.604
A 0 293,115.370291,613.339275,982.522274,568.285
B 0 17,694.54017,698.99417,838.12217,842.613
C 0 16,651.60716,652.49816,718.79316,719.687
ParameterCH3SHCH335ClH+
Calc.Exp. [532Calc.Scaled
A e 103,863.953103,144.040
B e 13,029.84712,472.858
C e 12,493.72312,016.948
Δ A 0 1054.1861069.132
Δ B 0 131.546207.375
Δ C 0 117.267184.225
A 0 102,809.767102,767.147102,074.907102,032.592
B 0 12,898.30112,951.37212,265.48312,315.950
C 0 12,376.45712,388.03311,832.72411,843.792
1 Equilibrium rotational constants and zero-point vibrational contributions calculated at the ae-CCSD(T)/cc-pwCVQZ and fc-CCSD(T)/cc-pV(T + d)Z levels of theory, respectively. 2 For the sake of comparability, the rotational constants from Ref. [53] given in the rho-axis system were converted to the principal axis system. Differences are virtually negligible.
Disclaimer/Publisher’s Note: The statements, opinions and data contained in all publications are solely those of the individual author(s) and contributor(s) and not of MDPI and/or the editor(s). MDPI and/or the editor(s) disclaim responsibility for any injury to people or property resulting from any ideas, methods, instructions or products referred to in the content.