Article

A Comparison of the Impacts of Different Drying Methods on the Volatile Organic Compounds in Ginseng

State Key Laboratory of Chinese Medicine Powder and Medicine Innovation in Hunan (Incubation), Science and Technology Innovation Center, Hunan University of Chinese Medicine, Changsha 410208, China
*
Author to whom correspondence should be addressed.
These authors contributed equally to this work.
Molecules 2024, 29(22), 5235; https://doi.org/10.3390/molecules29225235
Submission received: 11 October 2024 / Revised: 31 October 2024 / Accepted: 4 November 2024 / Published: 5 November 2024
(This article belongs to the Special Issue Applications of Spectroscopic Techniques in Food Sample Analysis)

Abstract

:
Ginseng (Panax ginseng C. A. Meyer) is a valuable plant resource which has been used for centuries as both food and traditional Chinese medicine. It is popular in health research and markets globally. Fresh ginseng has a high moisture content and is prone to mold and rot, reducing its nutritional value without proper preservation. Drying treatments are effective for maintaining the beneficial properties of ginseng post-harvest. In this study, we investigated the effects of natural air drying (ND), hot-air drying (HAD), vacuum drying (VD), microwave vacuum drying (MVD), and vacuum freeze drying (VFD) on volatile organic compounds (VOCs) in ginseng. The results showed that the MVD time was the shortest, followed by the VFD, VD, and HAD times, whereas the ND time was the longest, but the VFD is the most beneficial to the appearance and color retention of ginseng. A total of 72 VOCs were obtained and 68 VOCs were identified using the five drying methods based on gas chromatography–ion mobility spectrometry (GC-IMS) technology, including 23 aldehydes, 19 alkenes, 10 alcohols, 10 ketones, 4 esters, 1 furan, and 1 pyrazine, and the ND method was the best for retaining VOCs. GC-IMS fingerprints, principal component analysis (PCA), Euclidean distance analysis, partial least squares discriminant analysis (PLS-DA), and cluster analysis (CA) can distinguish ginseng from different drying methods. A total of 29 VOCs can be used as the main characteristic markers of different drying methods in ginseng. Overall, our findings provide scientific theoretical guidance for optimizing ginseng’s drying methods, aromatic health effects, and flavor quality research.

1. Introduction

Ginseng (Panax ginseng C. A. Meyer) is a popular natural product often referred to as the king of herbs. Its primary components include ginsenosides, polysaccharides, amino acids, volatile organic compounds (VOCs), and polyacetylene [1], which have beneficial effects, such as enhancing immunity [2], delaying aging [3], antidepressant effects [4], and preventing cardiovascular and cerebrovascular diseases [5]. It has been listed in the “Homology of Medicine and Food” list in the Chinese Ministry of Health Item List since 2014 and has seen widespread application in food, medicine, healthcare, and chemical production.
It is imperative that fresh ginseng be dried promptly after harvesting to prevent mold, bacterial growth, and nutrient loss. Drying is a critical post-harvest operation that retains nutrients, sterilizes, inhibits bacteria, and improves shelf life and storage stability [6]. Traditional and modern methods are used to dry foods and herbs. Traditional methods such as natural air drying (ND), shade drying, and smoke drying have issues related to uncontrolled processes, substandard hygiene, and unreliable quality [7]. Modern technologies include hot-air drying (HAD), microwave vacuum drying (MVD), and vacuum freeze drying (VFD). HAD is the most conventional method due to its low cost and ease of control, but it requires high temperatures and long times, resulting in losses of color, aroma, taste, and nutrients [8]. MVD has a fast speed and uniform heating, but it is costly and energy-intensive [9]. VFD avoids active ingredient destruction and yields low-moisture products, but is costly and has solvent-related limitations [10]. Different drying methods impact aroma-related compounds in foods and herbs. Volatile compounds can be lost during drying, affecting quality and sensory properties [11]. Ginseng has been extensively studied in regard to its ginsenosides and polysaccharides, but the estimation of its VOCs has not received much attention. It is important to determine the quality of herbs based on their odor, which is imparted by VOCs. Pharmacological studies have shown that VOCs have anti-inflammatory, antibacterial, and antitumor effects [12,13,14]. Therefore, ginseng’s quality can be ensured by comparing the effects of different drying methods on its VOCs and screening optimal production methods.
VOCs analysis methods include instrument and sensory analyses [15]. Sensory analysis is often used as an adjunct in VOC detection. The accuracy and reliability of sensory analysis cannot be compared with that of scientific instrumental detection. Instrumental methods include gas chromatography–mass spectrometry (GC-MS), gas chromatography–olfactometry (GC-O), gas chromatography–ion mobility spectrometry (GC-IMS), comprehensive two-dimensional gas chromatography–time-of-flight mass spectrometry (GC×GC-TOF-MS), and electronic nose (E-nose). GC-MS is the most widely used method, but it involves complicated sample pretreatment and long detection times, which is challenging for rapid VOC characterization in traditional Chinese medicine [16,17]. GC-O combines human olfaction with gas chromatography, making it a powerful odor analysis technique [18,19], but lacks reproducibility, stability, and objectivity. GC×GC-TOFMS has strong separation capability, high sensitivity, and automation, but insufficient qualitative ability, slow speed, and low resolution [20]. E-nose is a new aroma detection technology that has high sensitivity, rapid detection, and simple operation [21]; however, it has some disadvantages, such as a limited qualitative and quantitative analysis ability, poor stability, and a significant environmental impact. GC-IMS combines gas chromatography’s high separation capability with ion migration’s fast response, a non-destructive qualitative analysis method using headspace injection for complex target compounds. Compared with other instrumental analysis methods, GC-IMS technology has high efficiency, high sensitivity, high selectivity, no need for sample pretreatment, a short analysis cycle, environmental protection, and a low price. GC-IMS has become an important tool in the field of food flavor and volatile organic compound analysis. The method is widely used in food flavor analysis [22], adulteration identification [23], storage [24], and assessing the influence of food-drying methods [25,26].
Most studies have focused on ginsenosides, total flavonoids, total polysaccharides, and total phenols in ginseng with different drying methods [27,28,29]; however, there has been less research on VOCs. This study aimed to investigate the effects of five drying procedures—namely, ND, HAD, VD, MVD, and VFD—on the appearance and flavor of ginseng. The differences in VOCs in ginseng samples produced using different drying methods were explored using GC-IMS technology combined with principal component analysis (PCA), Euclidean distance analysis, partial least squares discriminant analysis (PLS-DA), and cluster analysis (CA) methods. Our study’s outcomes will help to select the best method for drying ginseng with improved quality, increased production, and enhanced product stability. Additionally, our work provides a valuable reference for large-scale ginseng production.

2. Results

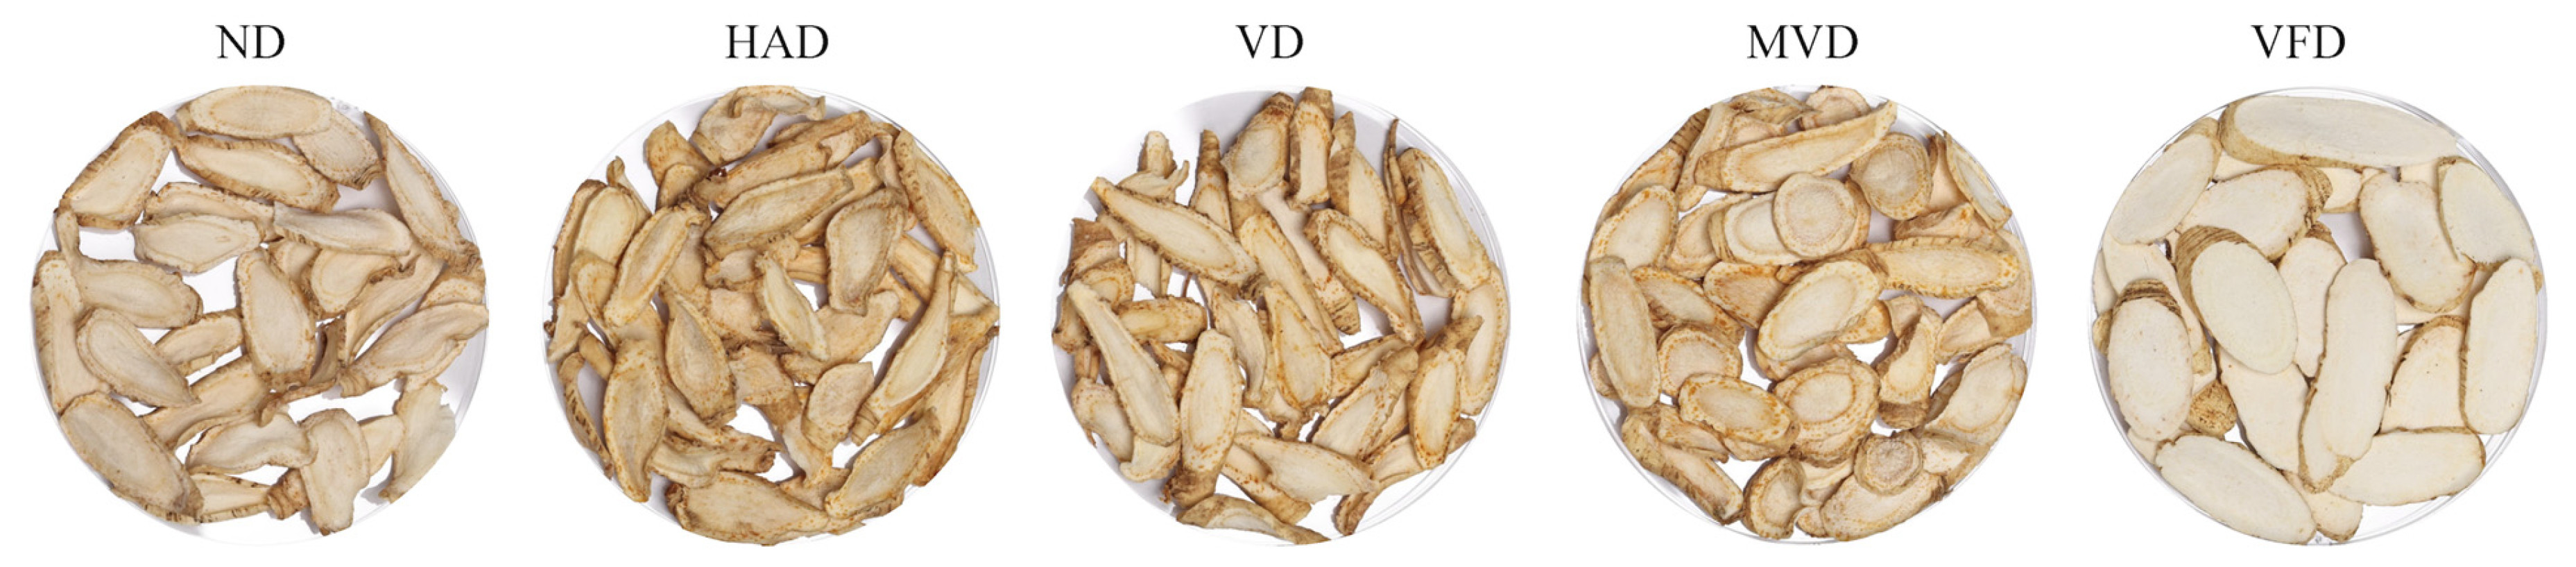
2.1. Analysis of Visual Characteristics and Color Changes

The appearance traits of fresh ginseng samples significantly changed after drying. The visual characteristics and color parameters of ginseng after drying using different methods are shown in Figure 1 and Table 1. Using the five drying methods, the color appearance of the ND and MVD samples was considered similar via visual observation, and the sample surfaces were white or light yellow; however, the ND and MVD processing times were the longest and shortest, respectively. The drying times, appearance, and color of HAD and VD were similar, and the surfaces were yellow or brownish-yellow and wrinkled with yellow spots. The appearance of the VFD samples was white and flat, similar to fresh products.
Color is an important indicator to evaluate the quality of food, which affects consumers’ choice of products [30]. Table 1 shows the effects of the different drying methods on the color of ginseng (L, a, b and ΔE). The brightness value of ginseng decreased from 88.06 ± 1.03 to 70.17 ± 4.22. The brightness values of VF-dried samples were the highest among the different drying methods, while that of the HAD sample was the lowest. This may be because the drying and oxidation reduced the brightness caused by the Maillard reaction, while the low-temperature and vacuum environment inhibited the occurrence of enzymatic Browning and Maillard reaction [31,32], thus ensuring ginseng’s original color. The ΔE values were ordered as VFD, MVD, ND, VD, and HAD from high to low, indicating that the VFD method was the best for color retention during the drying process of ginseng. This was related to the degradation of phenols, glycosides, and other substances in the samples exacerbated by the long-term high-temperature environment, thus reducing ginseng’s color.

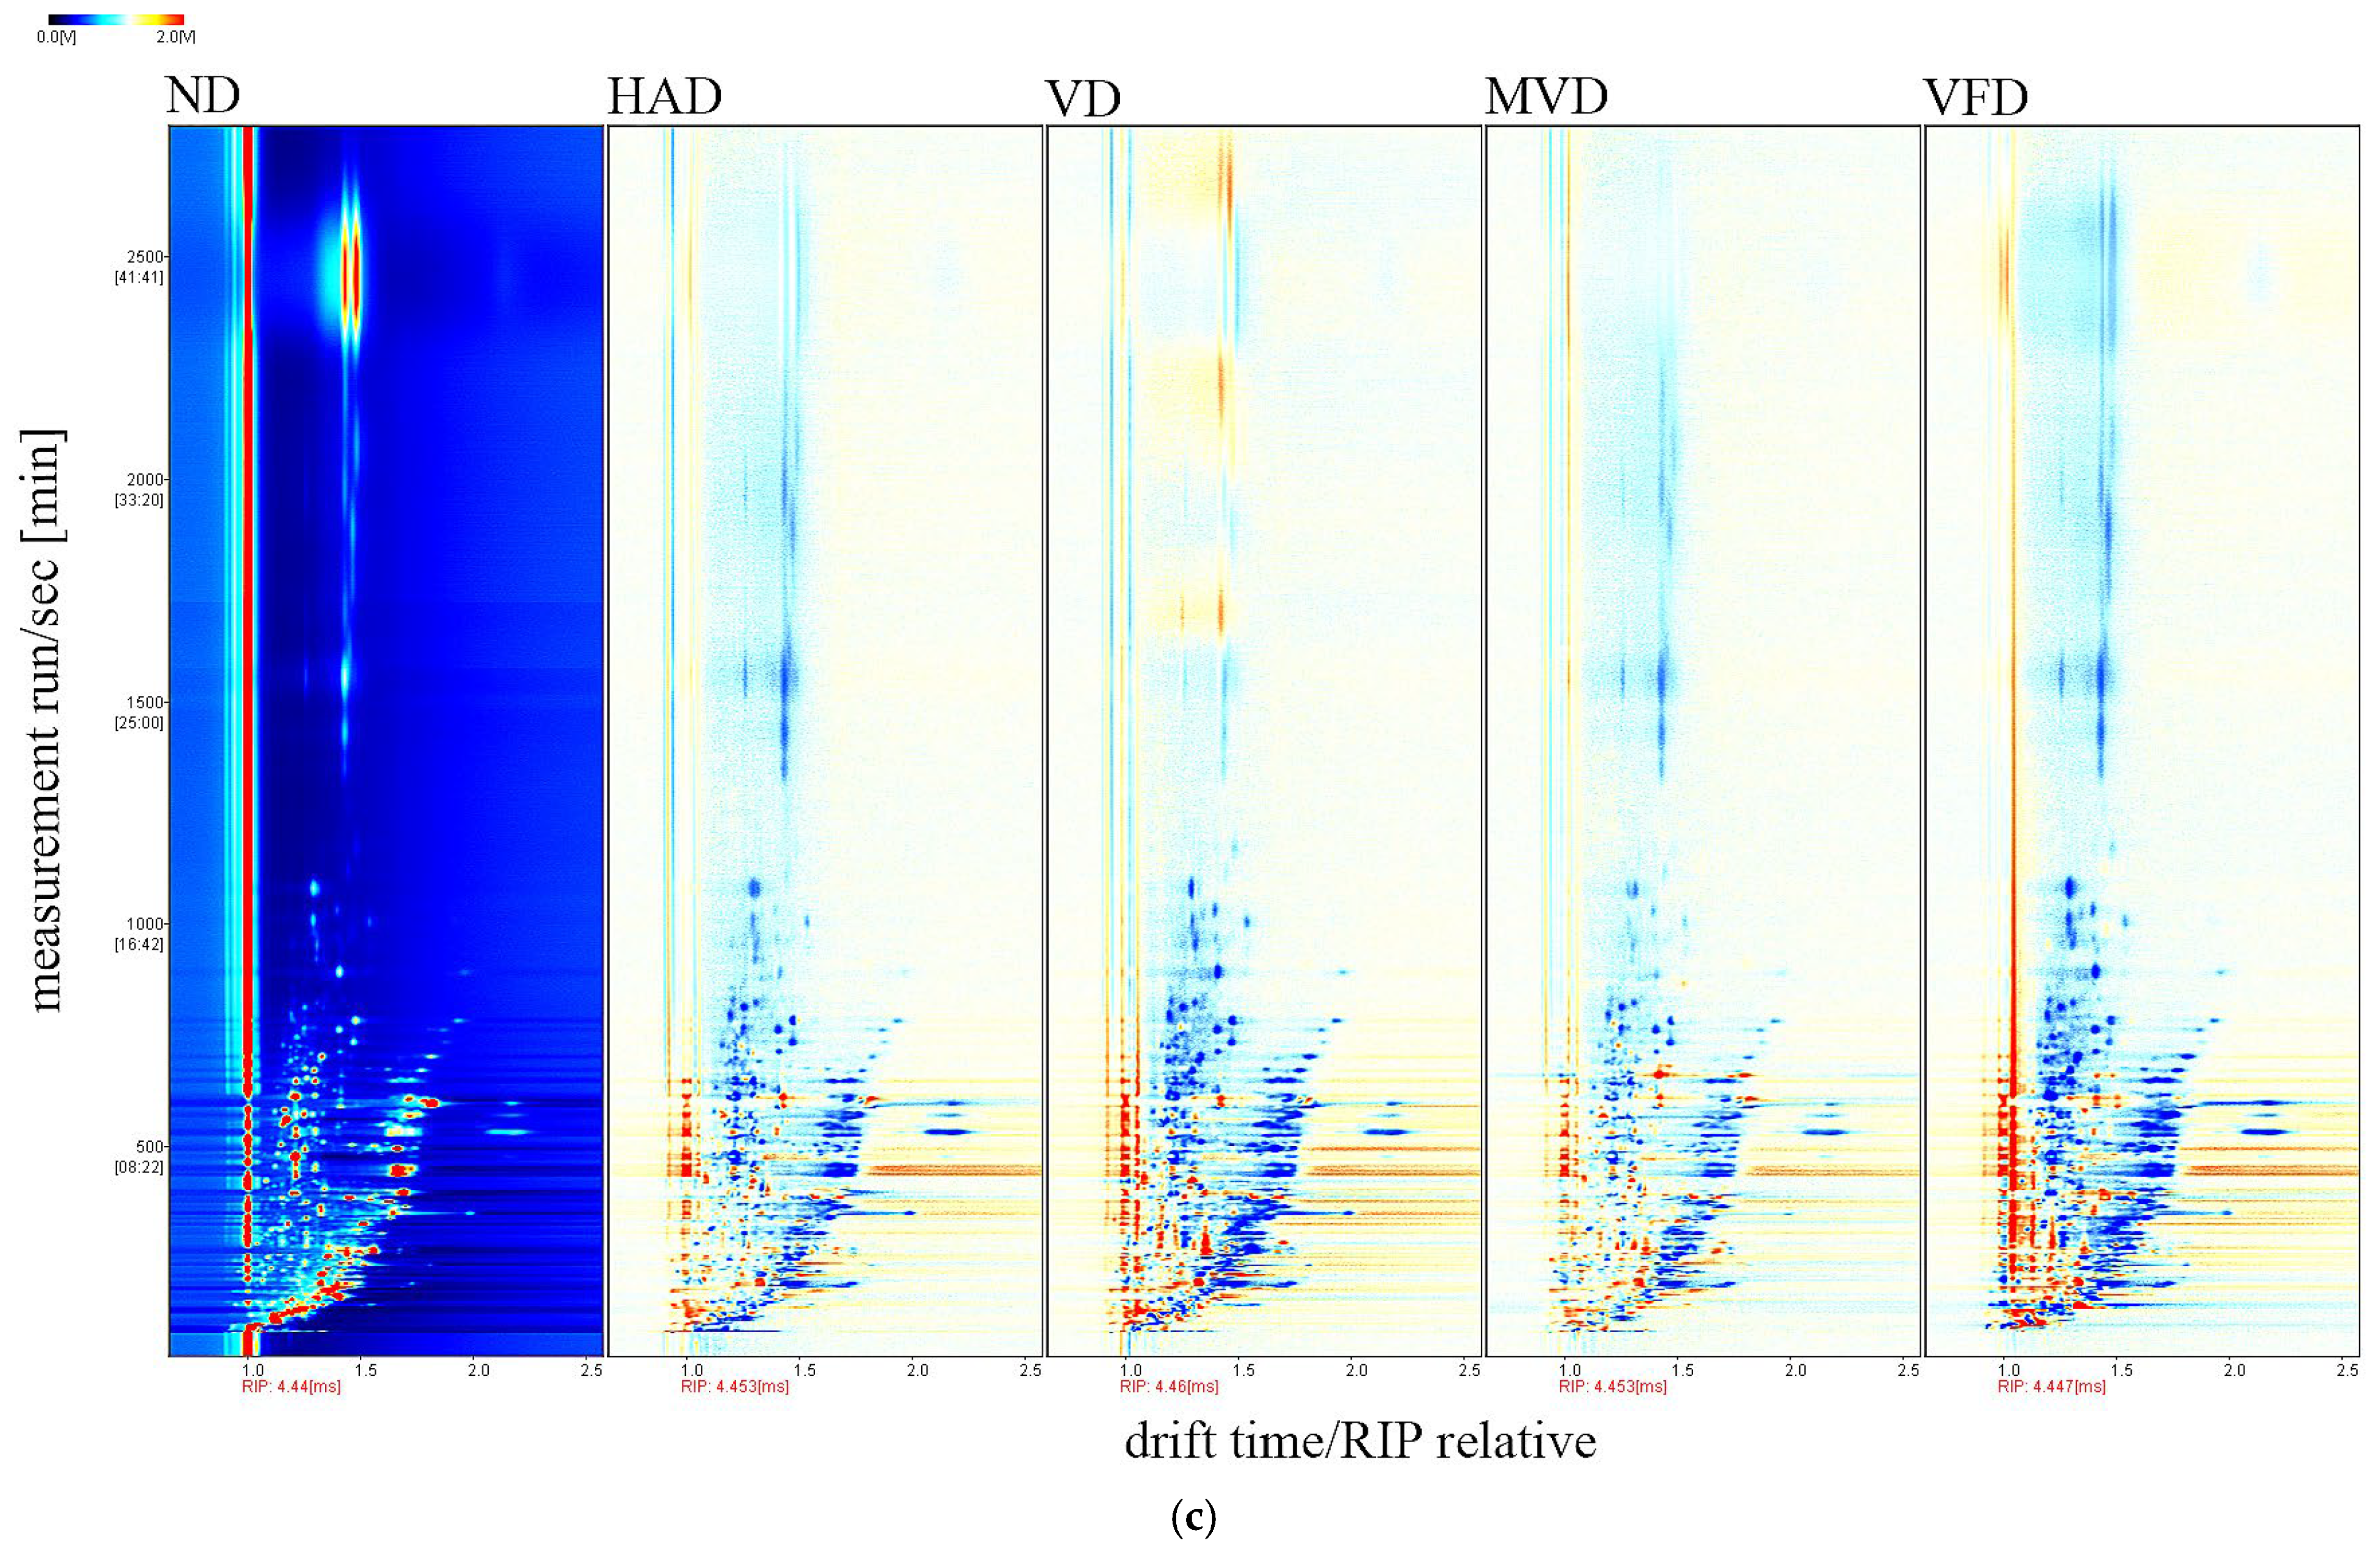
2.2. GC-IMS Analysis of VOCs

GC-IMS technology was used to identify and analyze the VOCs in ginseng, obtained using a difference comparison model. The horizontal axis represents the ion migration time, the vertical axis represents the gas chromatographic retention time, and the left side indicates the treated reactive ion peak (RIP). Each point on both sides of each RIP represents a volatile organic compound. The color represents the substance’s peak intensity, from blue to red, with darker colors indicating a greater peak intensity [33]. In Figure 2, the three axes represent the migration time (X-axis), retention time (Y-axis), and signal peak intensity (Z-axis), respectively. The differences in VOCs between the different samples can be visually seen in Figure 2a. A top view is depicted in Figure 2b for ease of observation. The differences in the VOCs between the five samples are evident in the figure. The ND spectra samples were selected as a reference to further visually compare the VOCs differences, which were subtracted from the other sample spectra to obtain the difference comparison diagram for each sample, as shown in Figure 2c. The subtracted background is white if the target sample and reference have the same VOCs content; red means the target sample has a higher concentration of the substance than the reference; and blue means the target sample has a lower concentration than the reference. The analysis showed that the components represented by red dots were present in all five samples in varying amounts. The red dots were most abundant in ND, suggesting that this drying method was beneficial for preserving the VOCs in ginseng.

2.3. Identification of VOCs in Different Samples

Although the two-dimensional spectrum of GC-IMS could intuitively show the contents and differences in VOCs in ginseng obtained using the different drying methods, it could not accurately judge the individual substances in the samples. GC retention index (NIST 2020) and IMS migration time databases were used to characterize the VOCs in the ginseng samples after using the different drying methods, according to their relative migration time and gas chromatography retention index. The qualitative results and odor descriptions of the VOCs in ginseng after using the different drying methods are shown in Table 2. The odor of VOCs described mainly refer to the database definitions, including https://www.flavornet.org (accessed on 10 October 2004), https://www.femaflavor.org (accessed on 10 October 2024), and https://www.chemicalbook.com (accessed on 10 October 2024). According to the different retention indices and migration times of the characteristic peaks of each substance, 72 signal peaks were determined, and 68 types of VOCs were qualitatively detected, including 23 aldehydes, 19 alkenes, 10 alcohols, 10 ketones, 4 esters, 1 furan, and 1 pyrazine. Some compounds showed multiple signals in the ion migration spectrum during detection, which was due to some components exhibiting dimers and monomers simultaneously. The monomers and dimers were the same substance. However, protonated molecules in the ionization region were promoted to combine with neutral molecules to form dimers due to the high concentration of these compounds. As a result, the reactants’ protons were transferred to these high-proton-affinity compounds, and dimers or polymers were then formed [34].

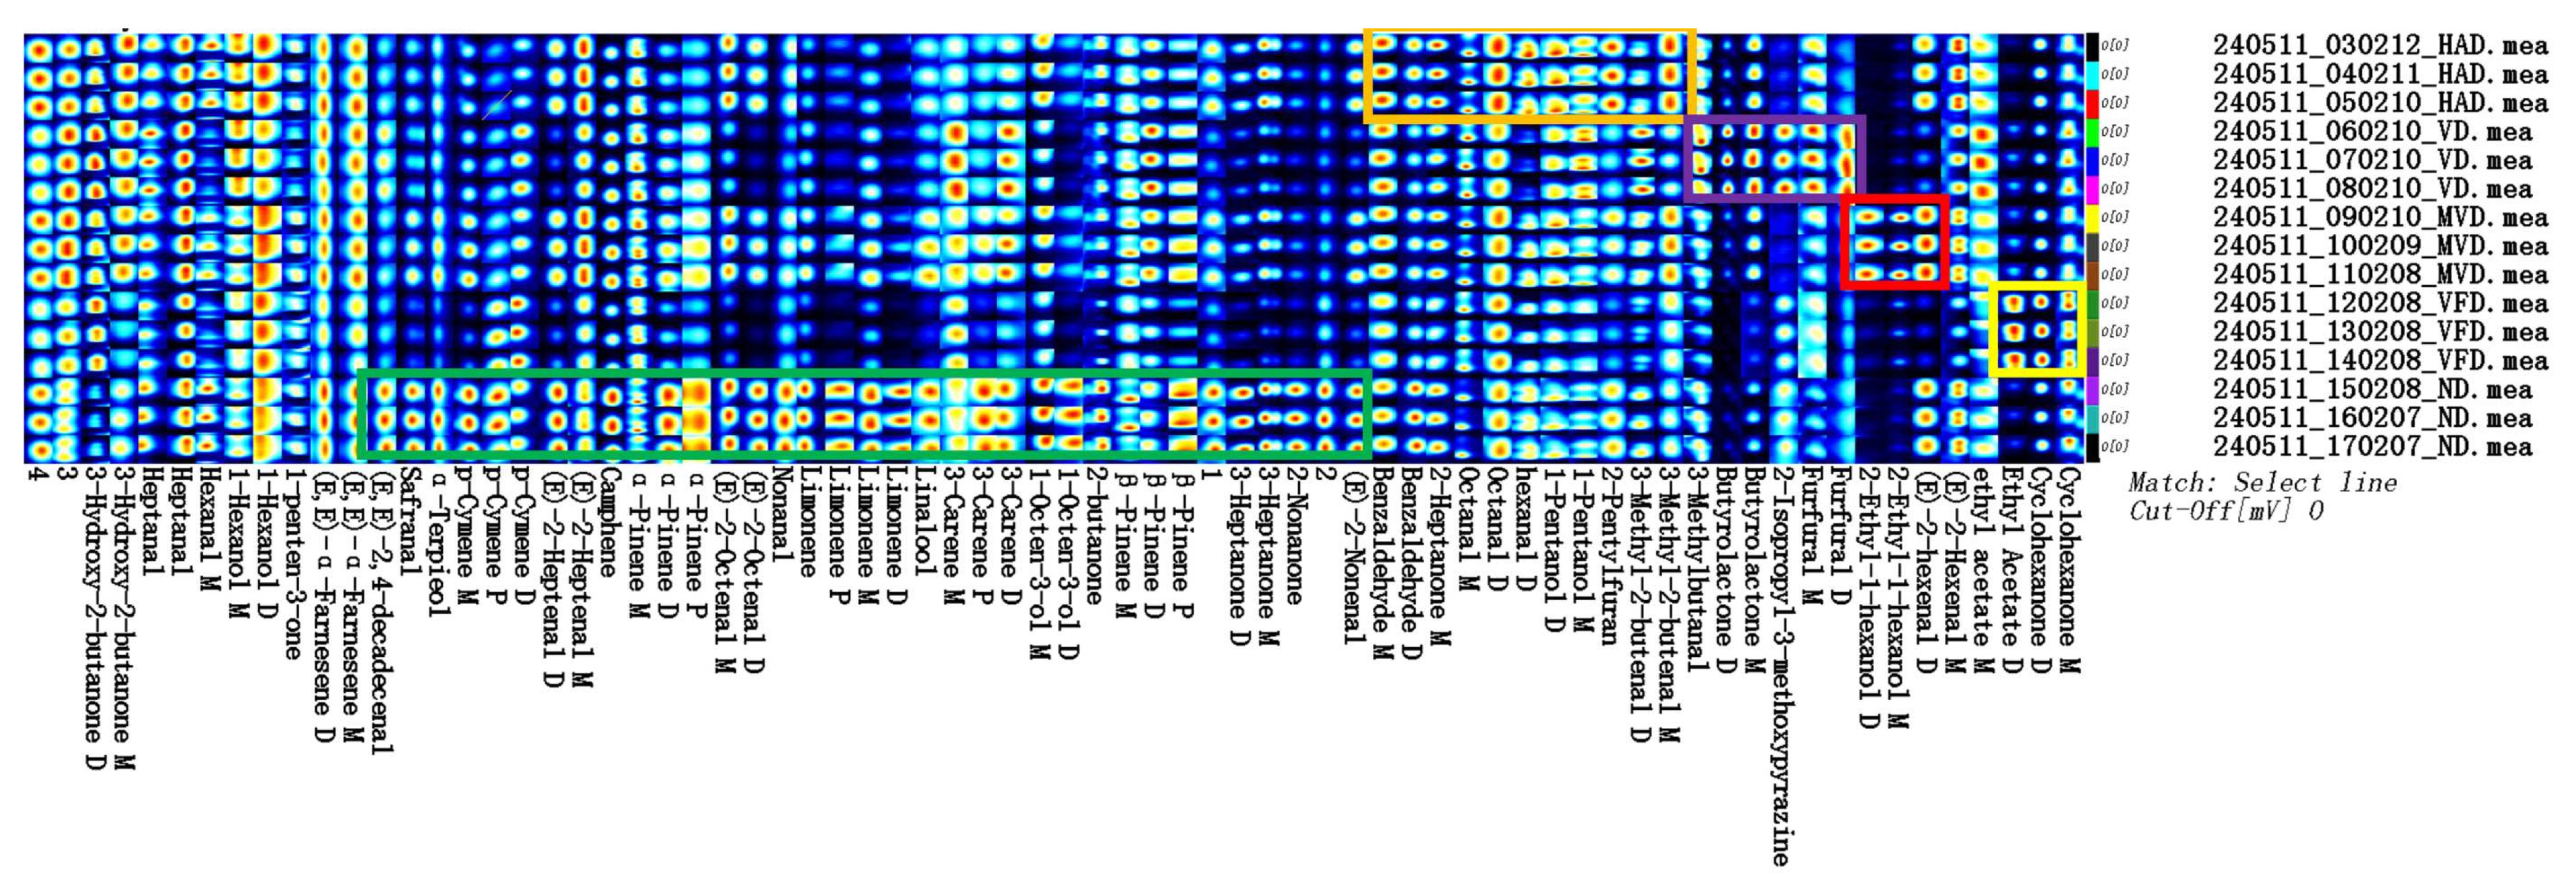
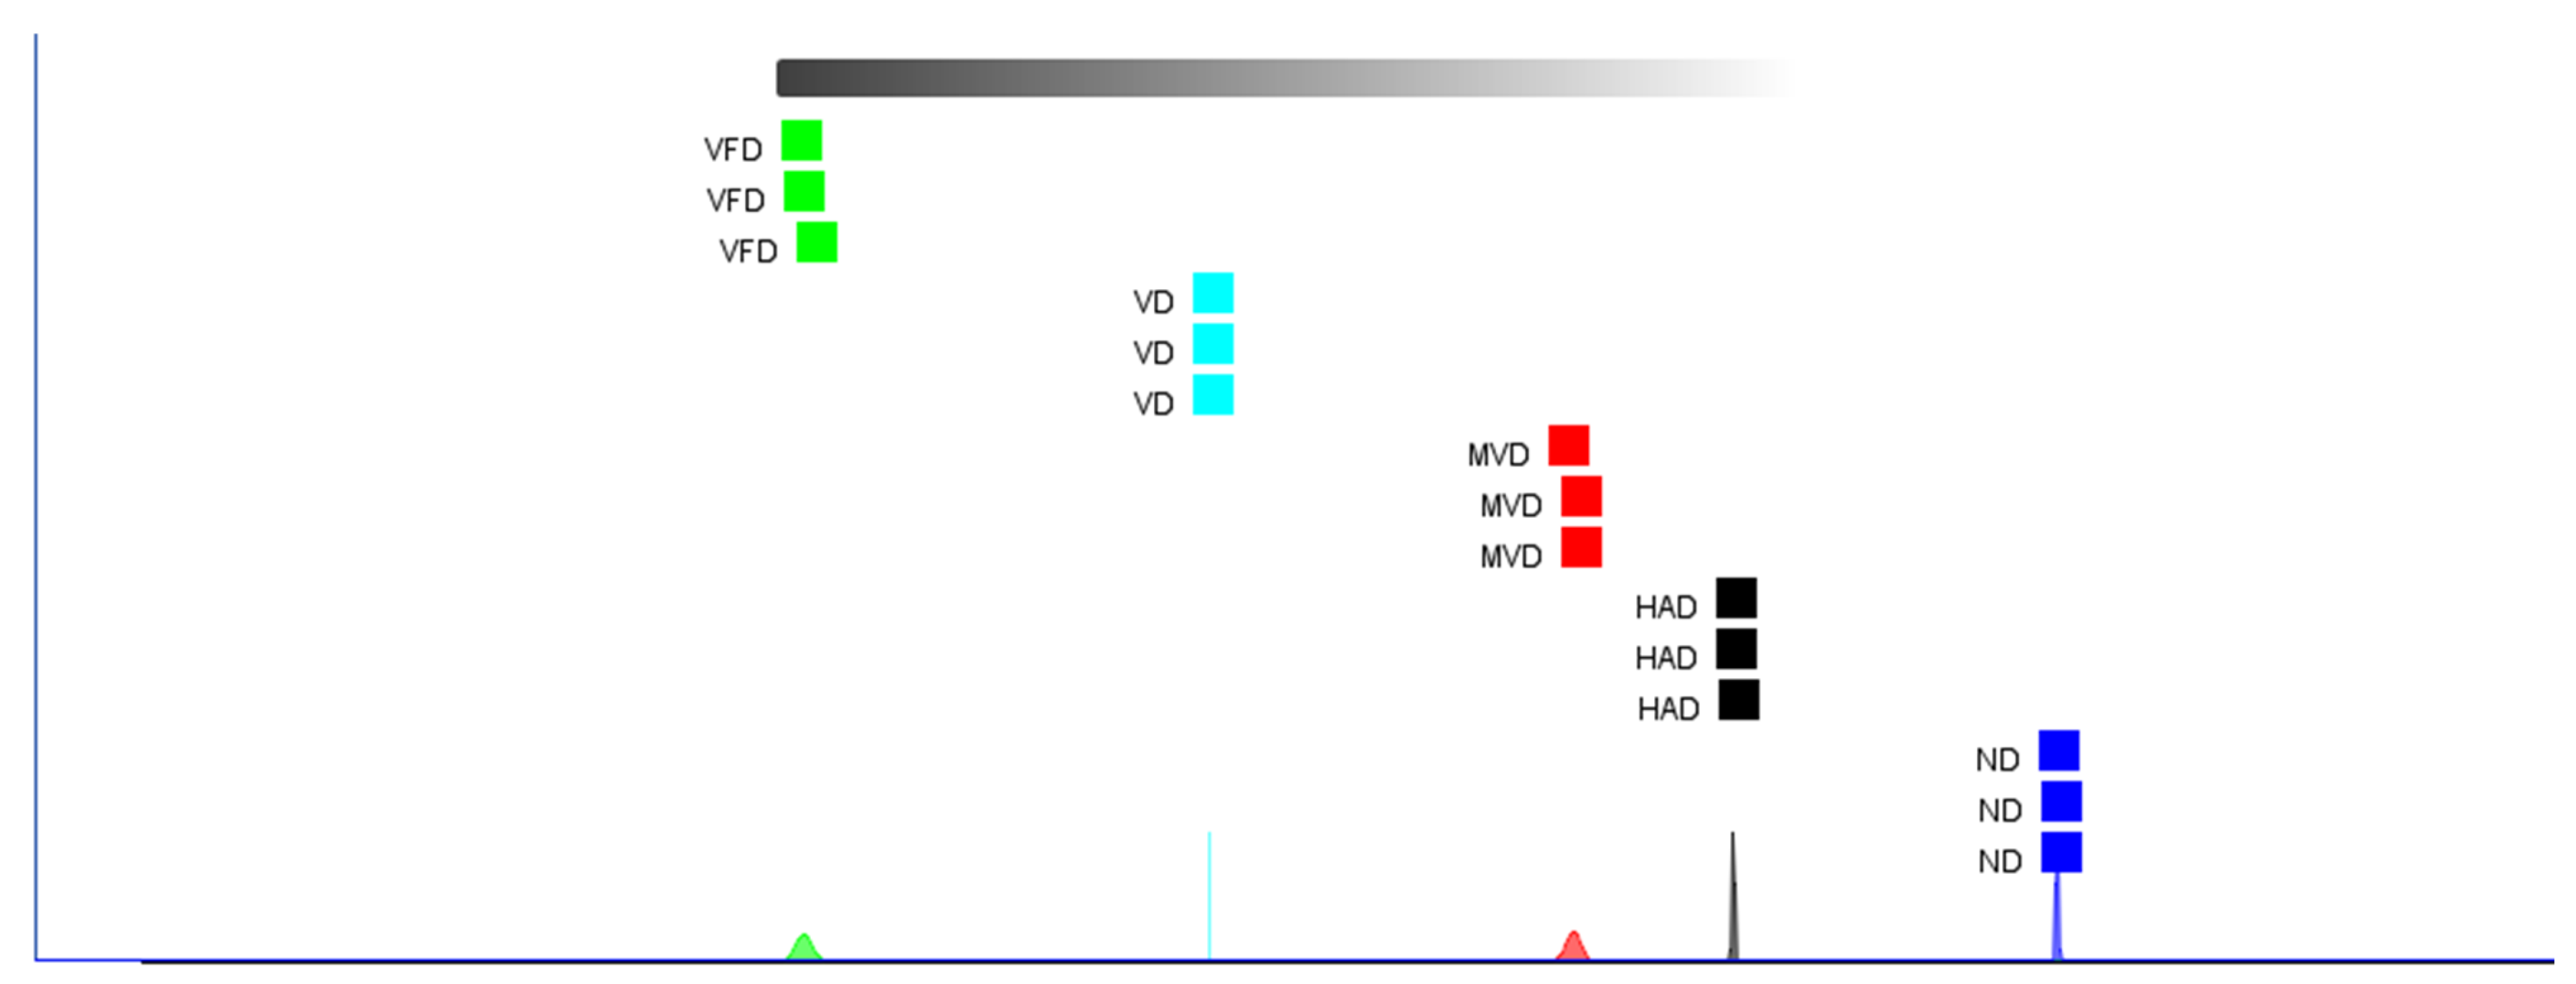
2.4. Comparison of the Fingerprints of VOCs

A fingerprint can show the intensity of VOCs spots in different samples for analysis and comparison, enabling the determination of changes in individual substances [35]. Figure 3 represents the VOCs fingerprints in the ginseng samples produced using the different drying methods. Each row in the fingerprint represents all signal peaks selected from a ginseng sample; each column represents the signal peaks of the same VOCs in different ginseng samples; each unit represents the content of substances at different times; and the color represents the VOCs contents. The brighter the color, the higher the content. The unknown but different components are numbered 1–4. The green box indicates high VOCs contents in ND, the orange box indicates high VOCs contents in HAD, the purple box indicates high VOCs contents in VD, the red box indicates high VOCs contents in MVD, and the yellow box indicates high VOCs contents in VFD. The results show differences in the VOCs compositions using the different drying methods. The ND samples had the reddest bright spots, the most abundant types of VOCs, and the highest contents of some components. The MVD and VFD samples contained few red bright spots, the lowest number of VOCs, and low contents of most components. In Figure 3, the green box represents the characteristic VOCs using ND, which mainly included (E, E)-2,4-decadecenal, safranal, α-terpieol, p-cymene, (E)-2-heptenal, camphene, (E)-2-octenal, α-pinene, β-pinene, nonanal, limonene, linalool, 3-carene, 1-octen-3-ol, 2-butanone, 3-heptanone, 2-nonanone, and (E)-2-nonenal. The orange box represents the characteristic VOCs using HAD, which mainly included 2-heptanone, benzaldehyde, nonanal, hexanal, 1-pentanol, octanal, and 3-methyl-2-butenal. The purple box represents the characteristic VOCs using VD, which mainly included butyrolactone,3-methylbutanal, 2-isopropyl-3-methoxypyrazine, and furfural. The red box represents the characteristic VOCs using MVD, which mainly included 2-ethyl-1-hexanol and (E)-2-hexenal. The yellow box represents the characteristic VOCs using VFD, which mainly included cyclohexanone and ethyl acetate. Therefore, the VOCs contents can serve as an important index for distinguishing between different ginseng-drying methods.

2.5. Chemometric Analysis

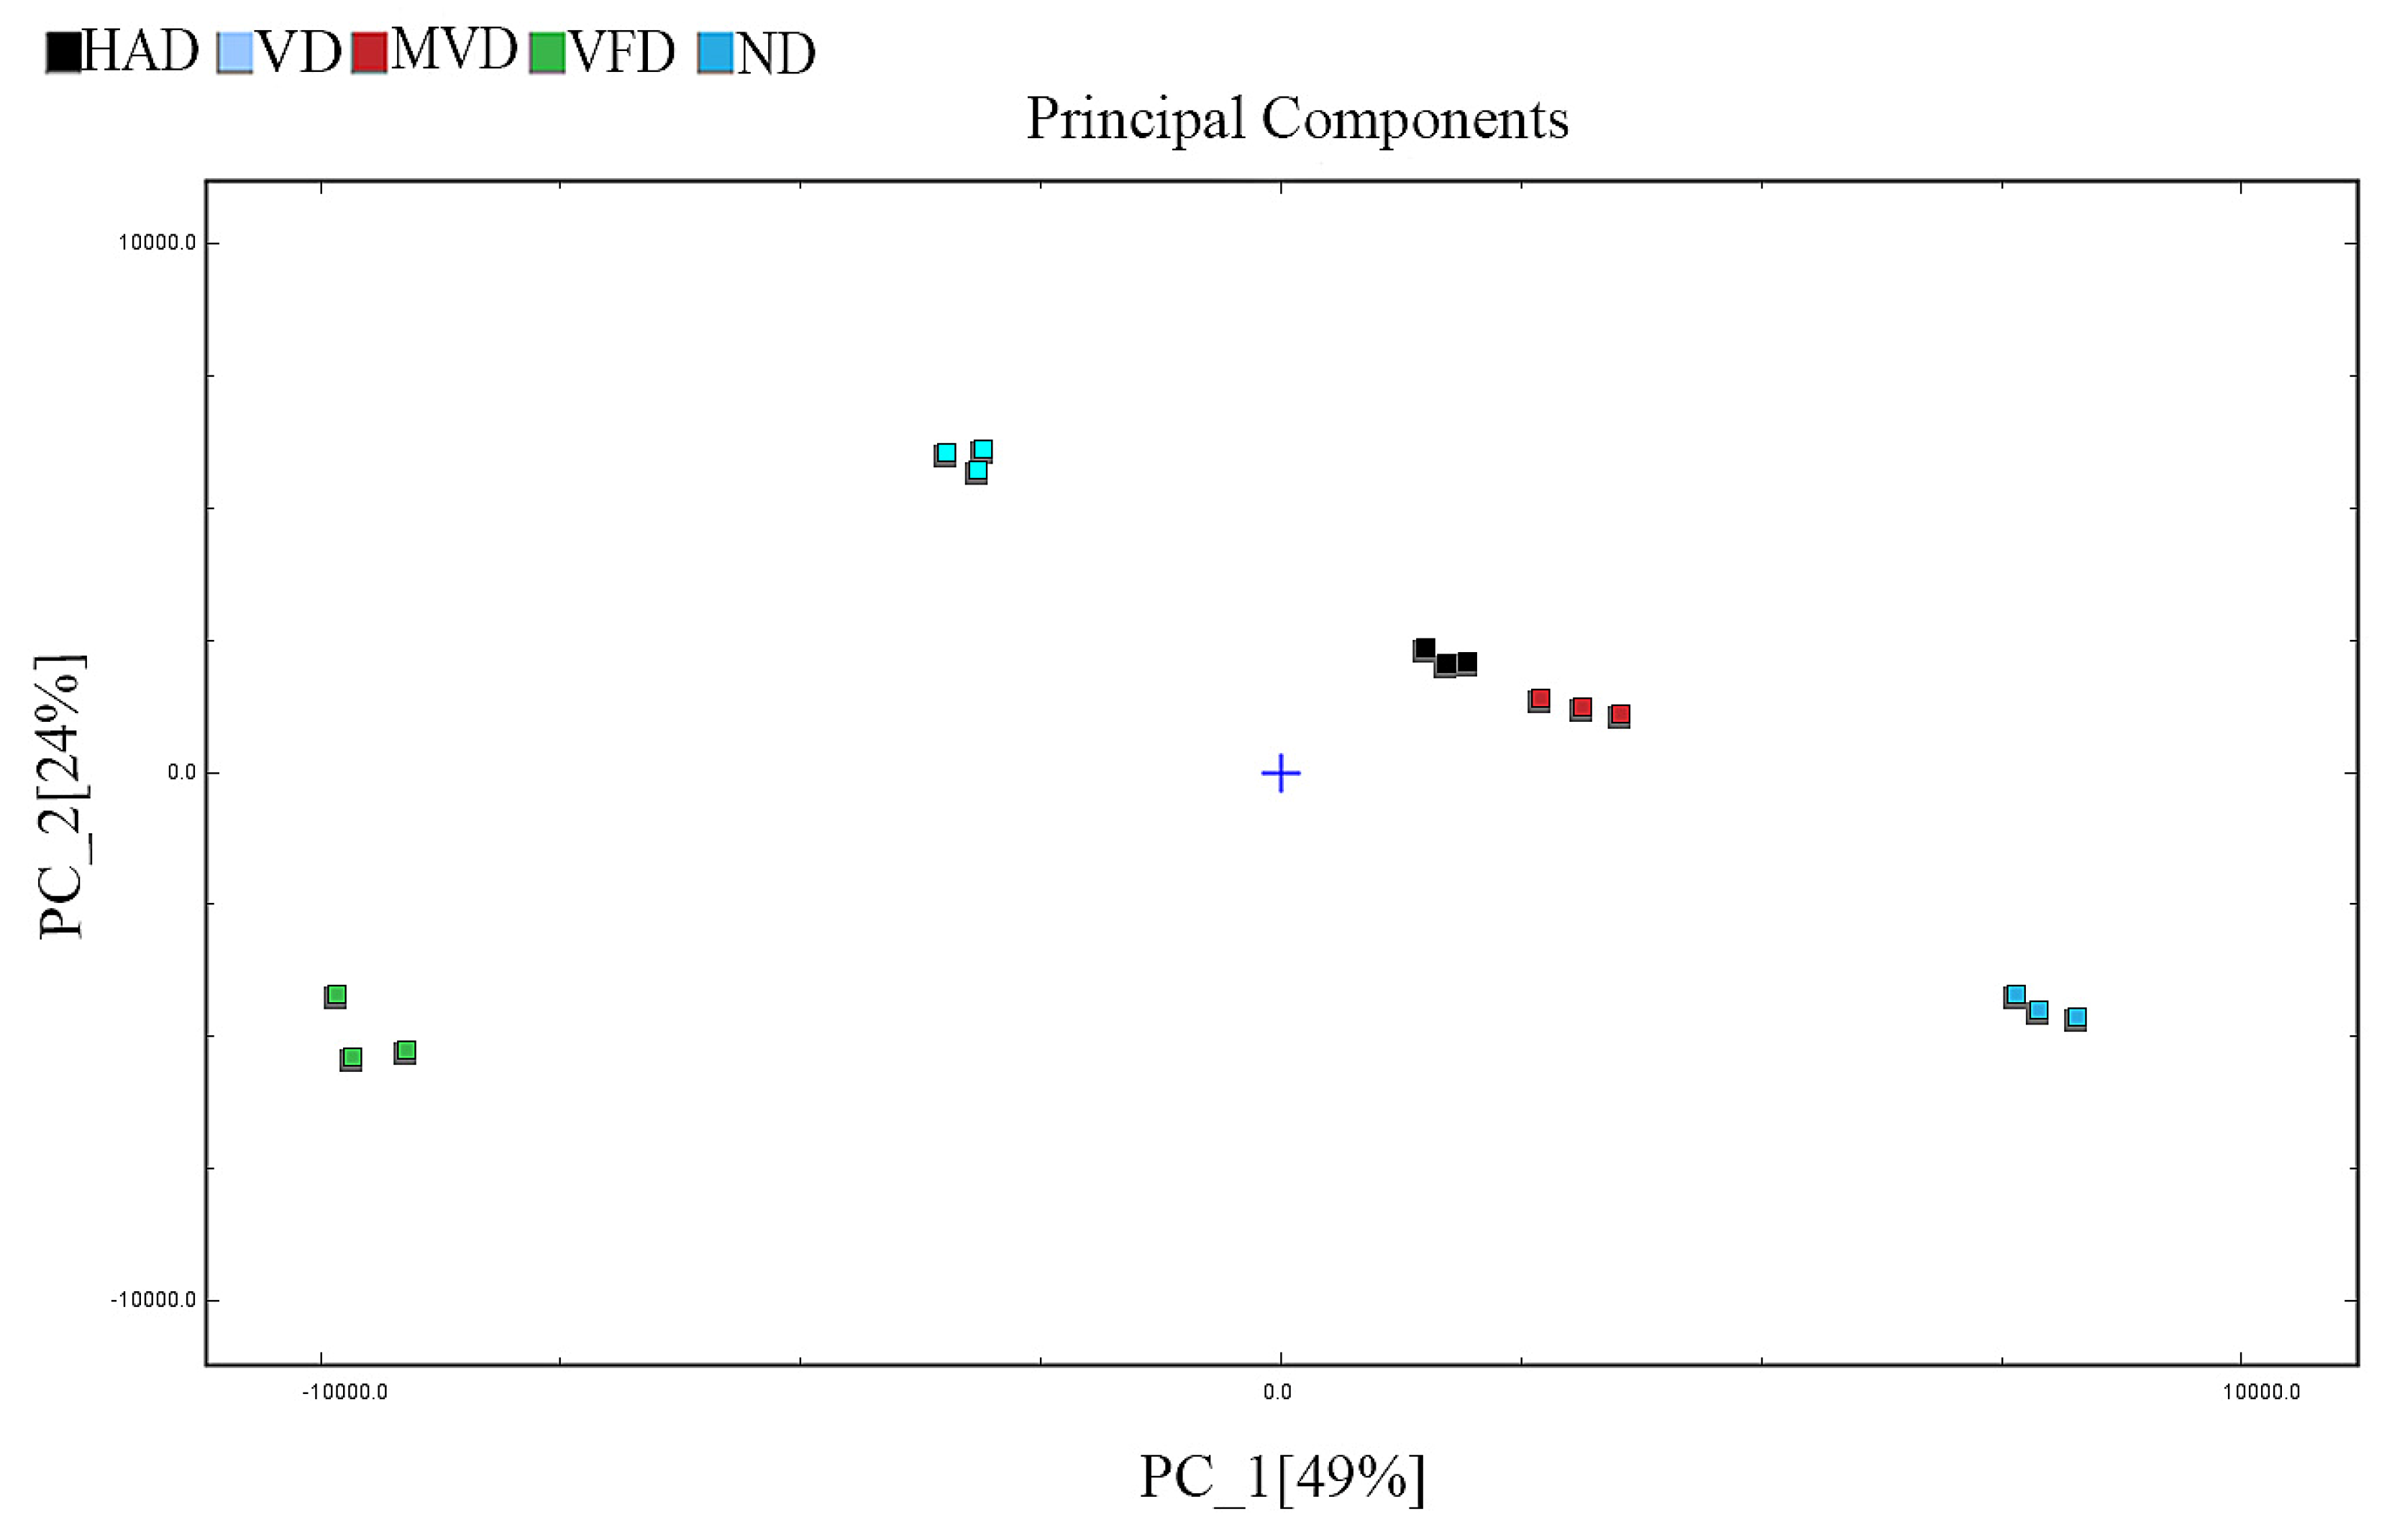
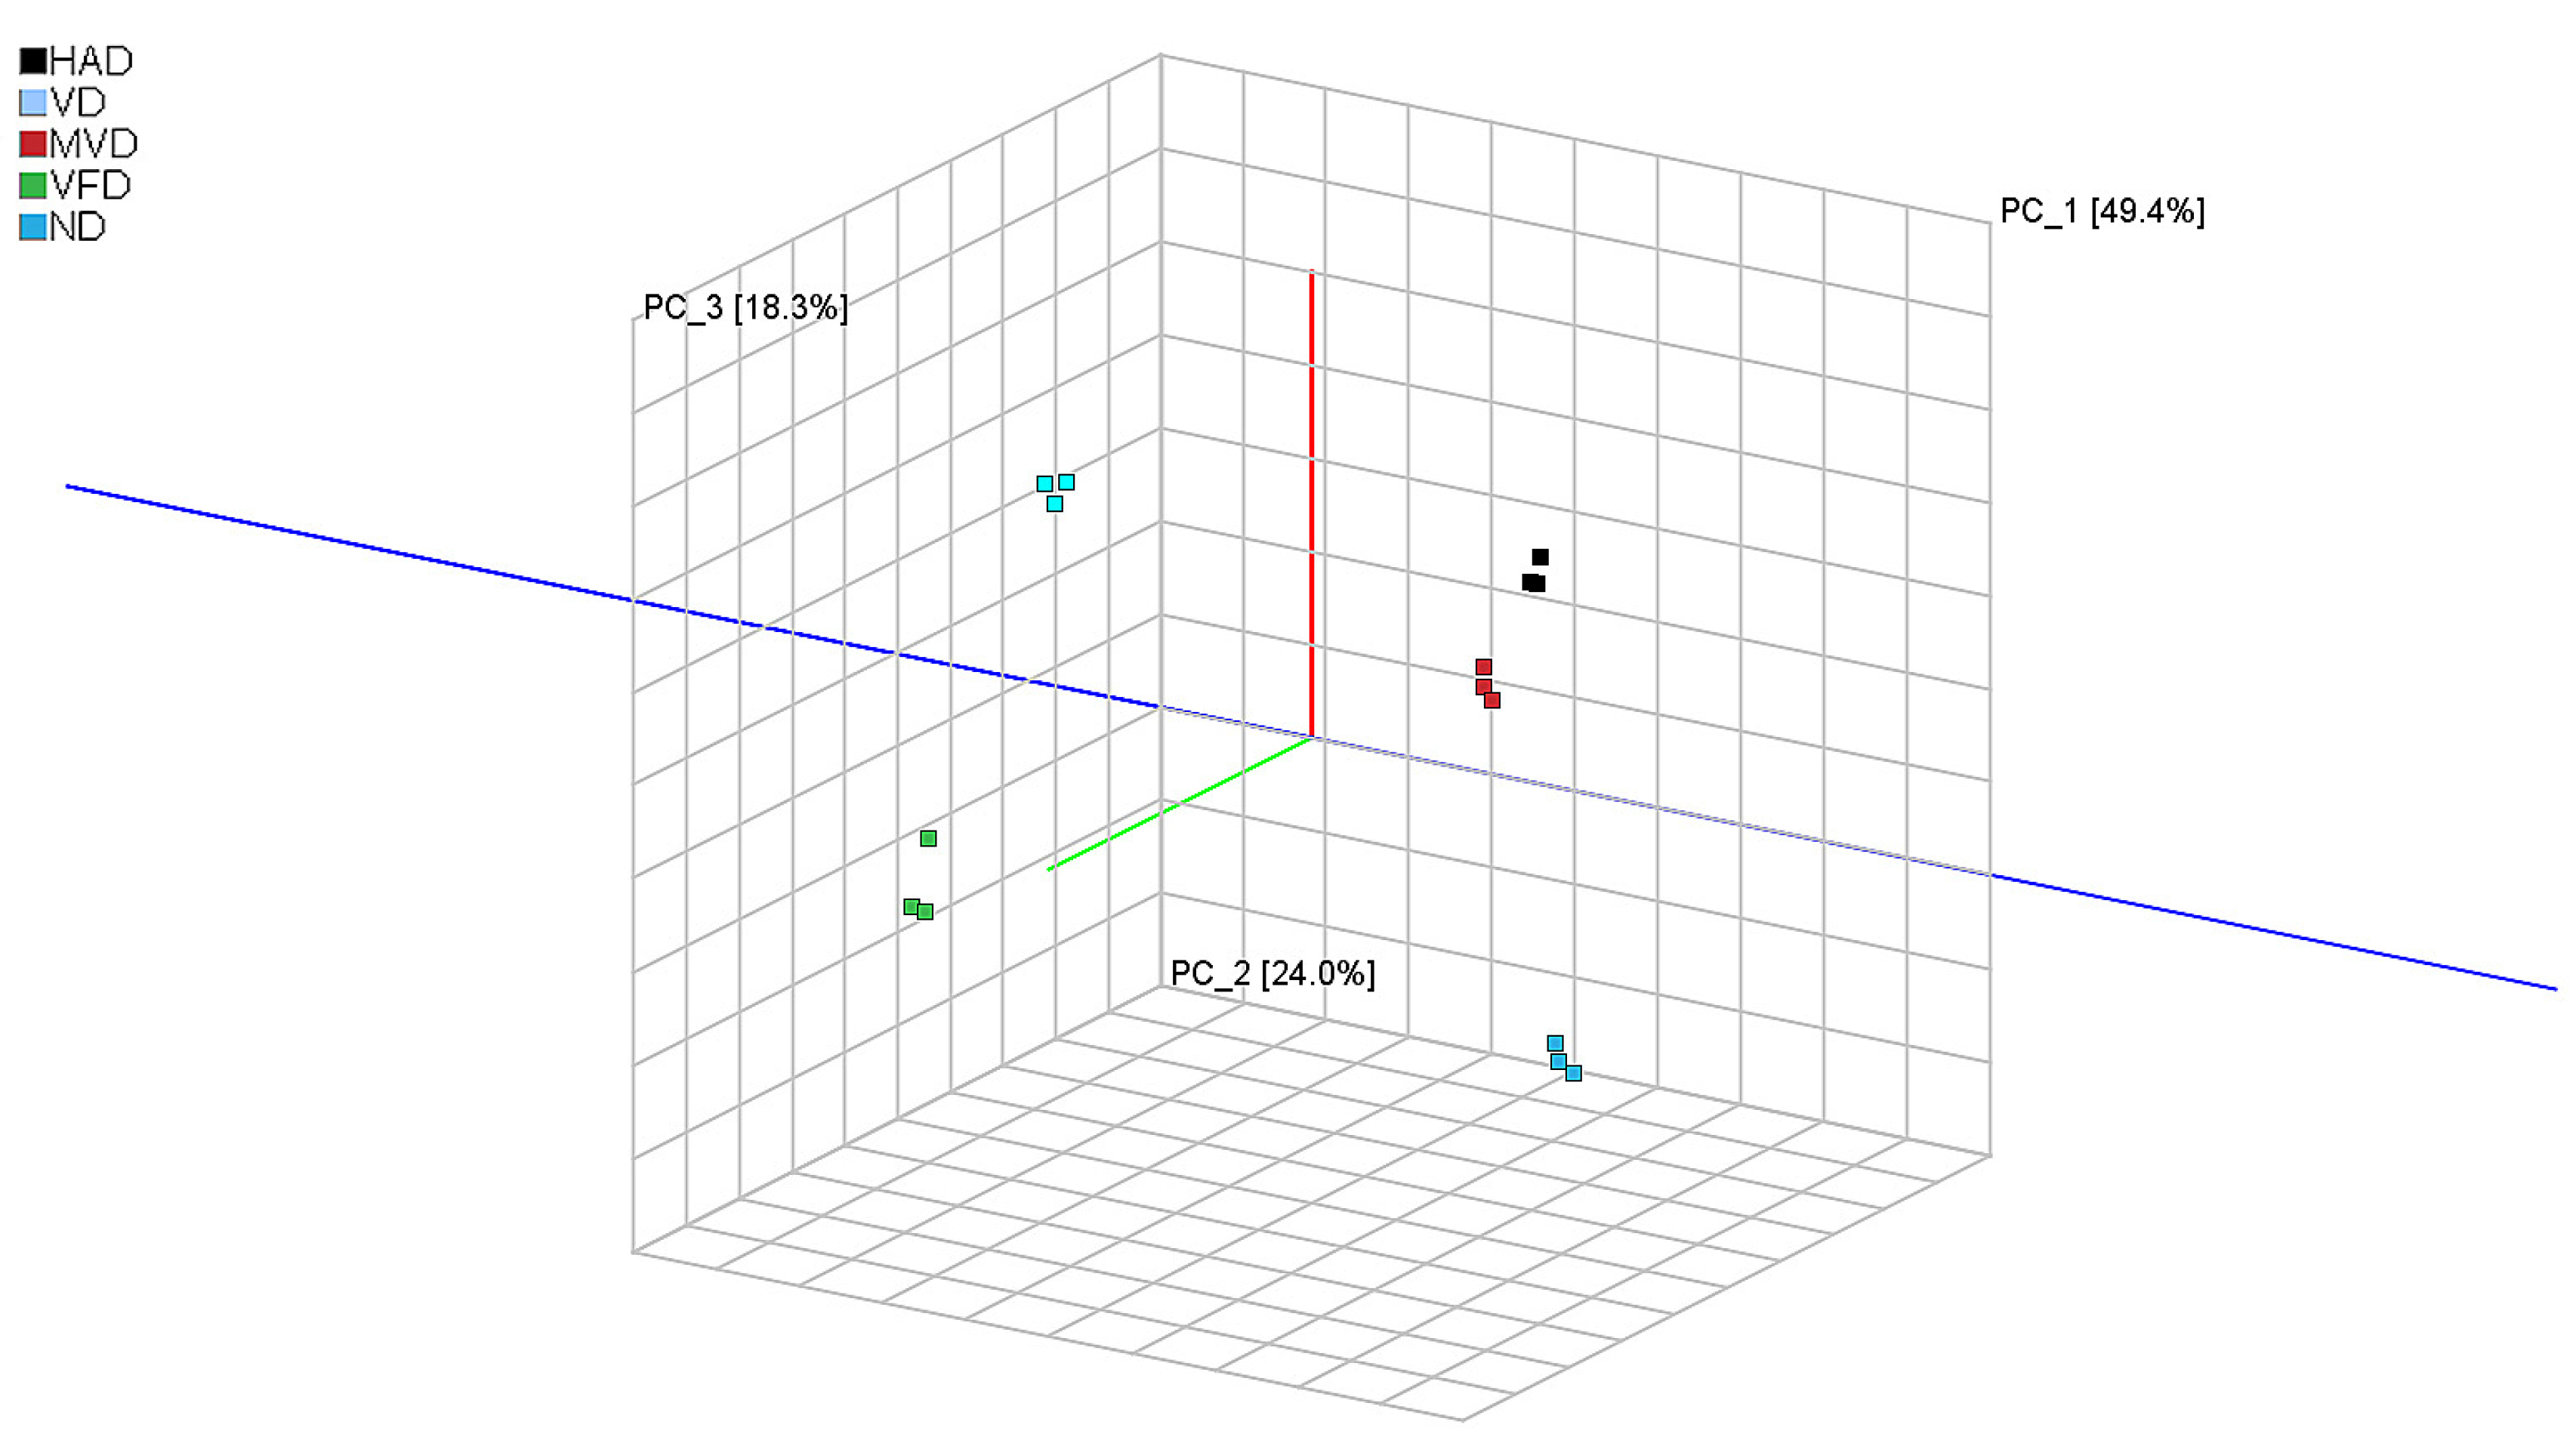
2.5.1. Principal Component Analysis (PCA)

PCA is a multivariate statistical method used to test the correlations between multiple variables, primarily through assessing the signal strength of volatile substances in a substance to highlight differences between samples. The Dynamic PCA plug-in in VOCal data processing software (from G.A.S., Dortmund, Germany, version 2.0.0) was used to analyze the principal components of VOCs in ND, HAD, VD, MVD, and VFD samples, and the results are shown in Figure 4. The figure shows that the first two principal components explained 73% of the total variance among the samples from the five different drying methods (PC1, 49.0%; PC2, 24.0%). It can be clearly seen from the figure that the distance between HAD and MVD is small, indicating that the VOCs were relatively similar. However, the large distances between other samples indicate that there are certain differences in the VOCs content of ginseng after different drying methods. These differences were also visualized in the 3D spatial scatter diagram (Figure 5), in which the first three principal compounds accounted for 91.7% of the total variance. The original variables contained the 3D information of the retention time (PC1), drift time (PC2), and ion signal strength (PC3) (as variables, mainly as observations) for comprehensive analysis and PCA. Therefore, the results revealed that GC-IMS coupled with PCA can rapidly distinguish ginseng undergoing different drying methods.

2.5.2. Euclidean Distance Analysis

Additionally, we used Euclidean distance, a cluster analysis method that refers to the real distance between two points, reflecting the closeness of the study subjects [36]. If the distance was large, the difference between the two was also large and showed a positive correlation. The Euclidean distance of the ginseng samples treated with the different drying methods is shown in Figure 6. The results of the Euclidean distance analysis show that the distances between the ginseng samples of different origins were clearly distinguished. The distance between MVD and HAD was relatively close, indicating little difference between them. Meanwhile, the distance between VFD and ND was the furthest, indicating a big difference between them. This is similar to the PCA results.

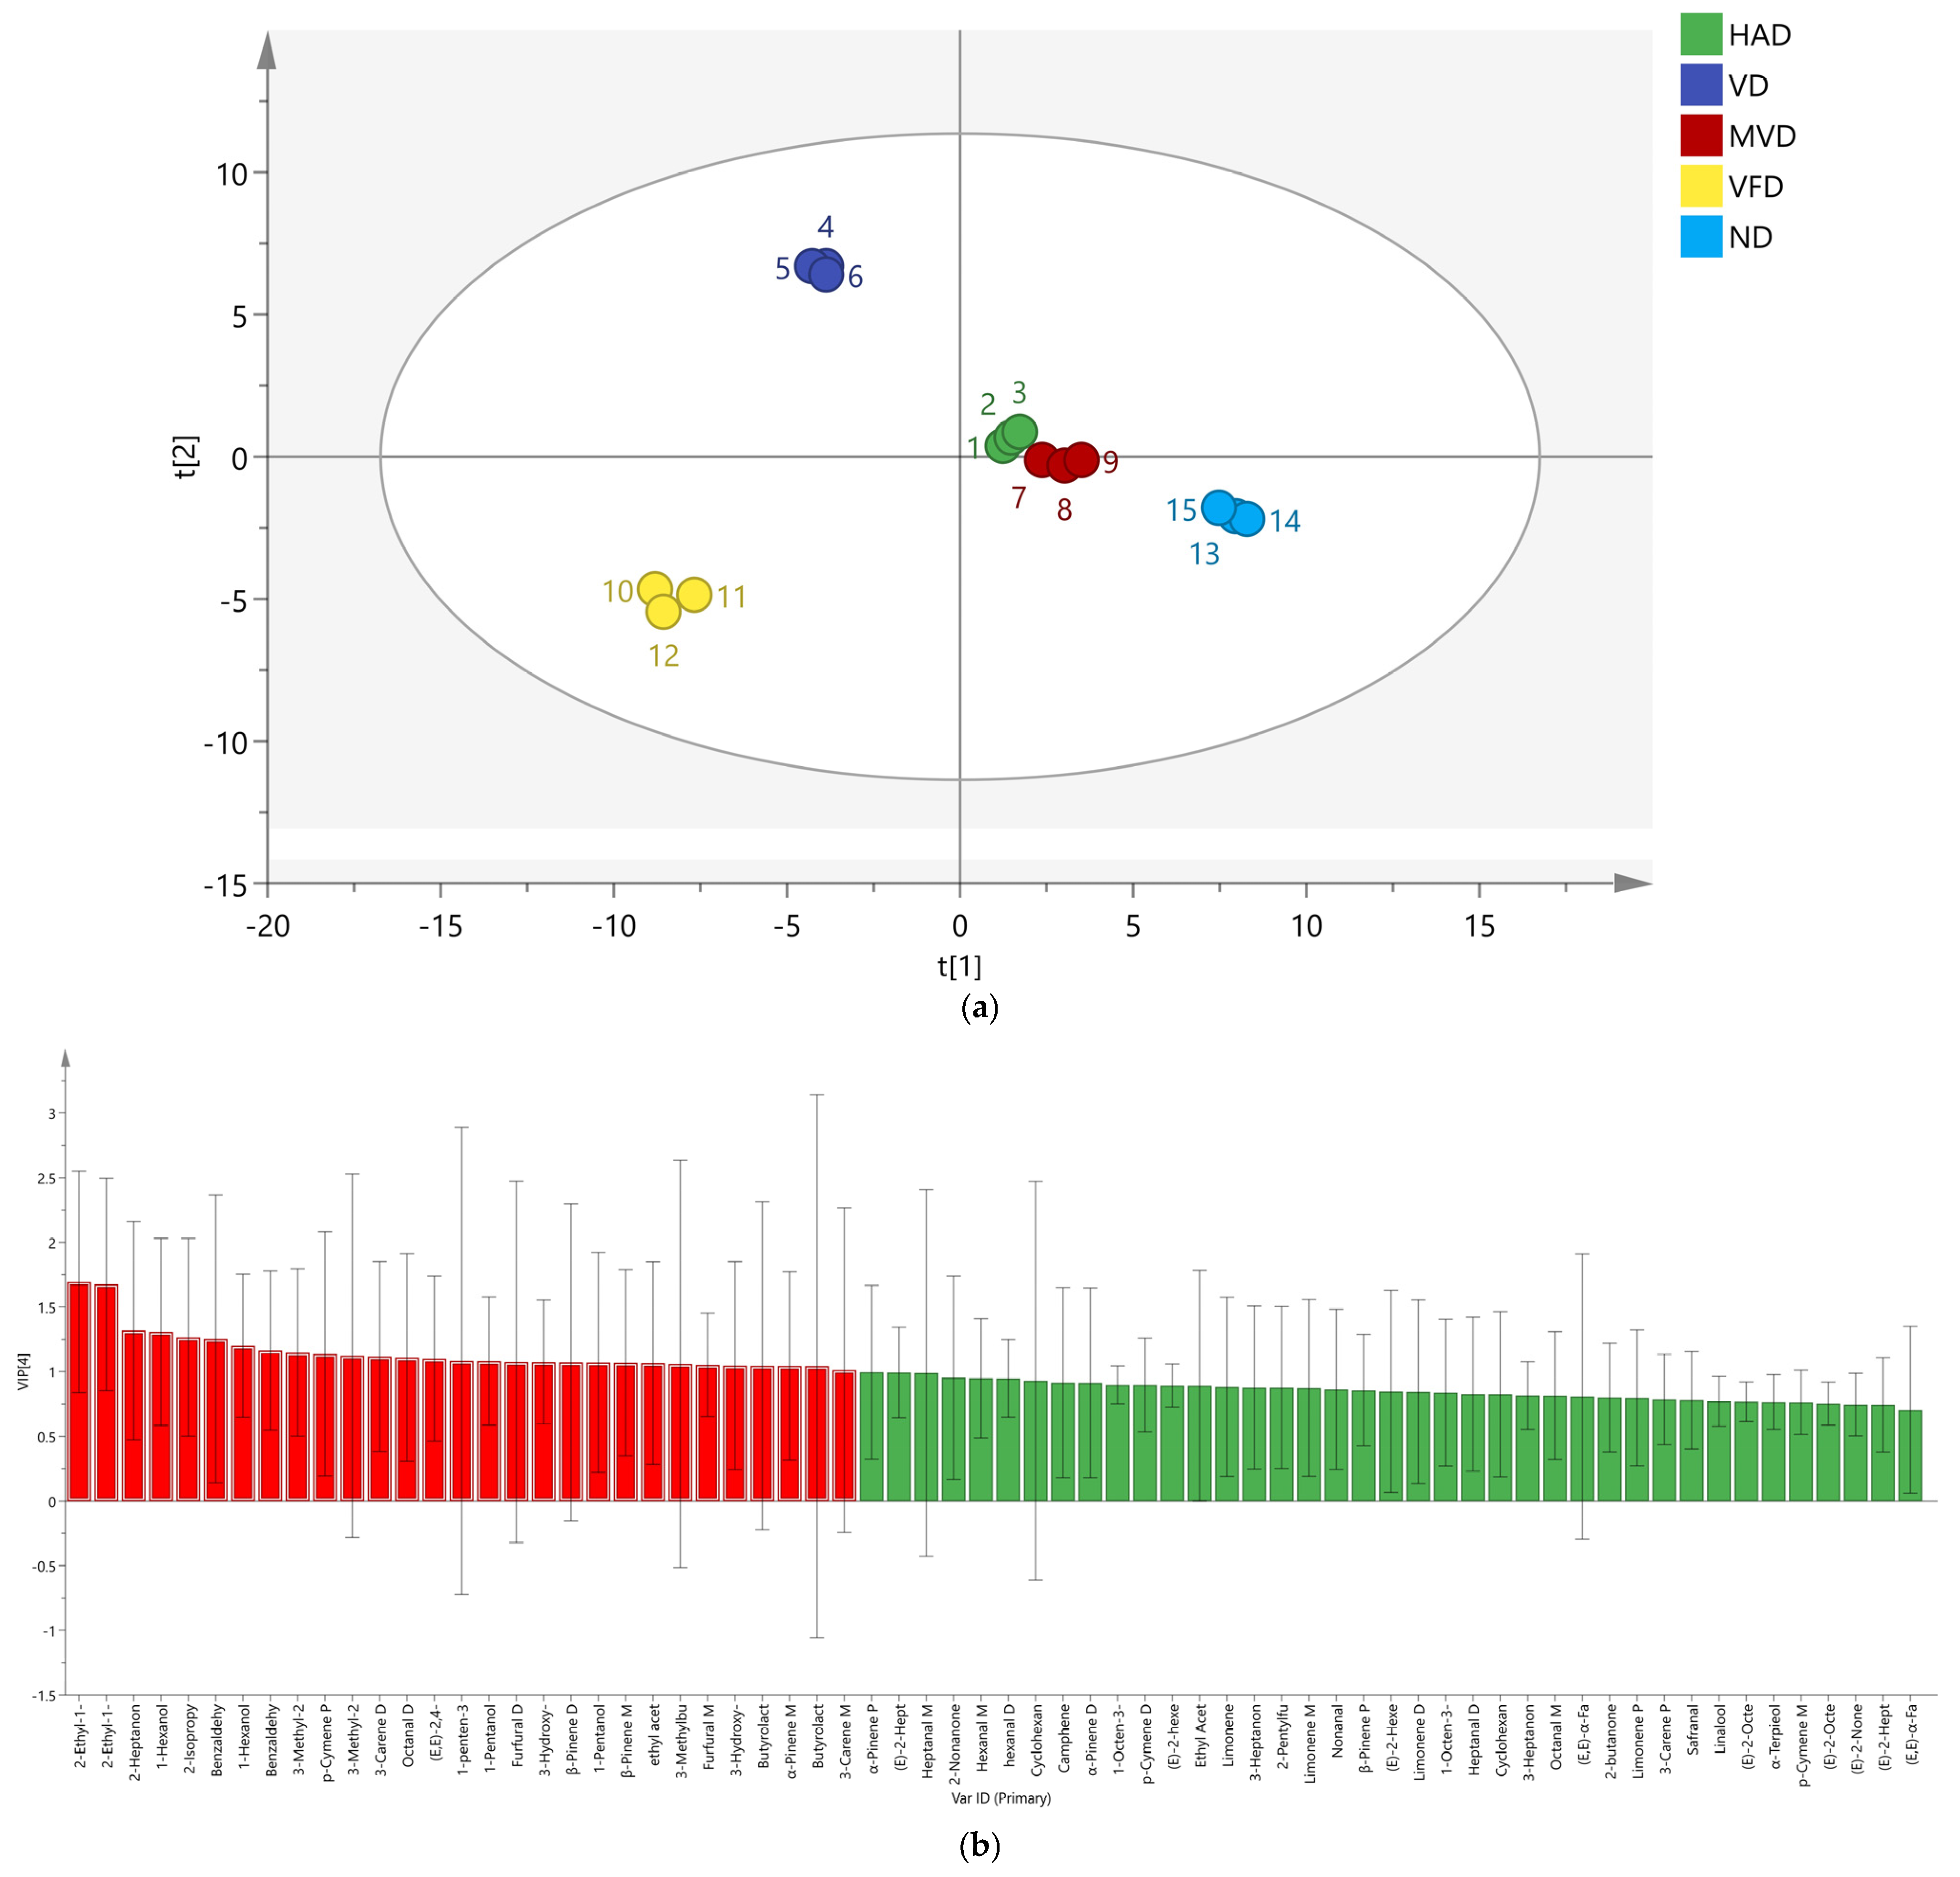
2.5.3. Partial Least Square-Discriminant Analysis (PLS-DA)

PLS-DA is a supervised approach that can identify hidden variables that compromise the robustness of the model and highlight differences between groups [33]. The peak volume results of 68 VOCs from five ginseng samples were normalized and PLS-DA scores were obtained. The results are shown in Figure 7a; R2X = 0.981, R2Y = 0.993, Q2 = 0.983, and are all greater than 0.5, indicating that the established model is stable and reliable. The distance between HAD and MVD was the smallest, and there was a significant gap between the other three groups, consistent with the PCA.
The score chart shows that the supervised analysis method can better distinguish the five ginseng samples, and the variable important in projection (VIP) value can be obtained. VIP values are often used to reflect the importance of PLS-DA model variables, where VIP is greater than 1, indicating a high contribution to the overall discriminant model [33]. As shown in Figure 7b, there are 29 characteristic VOCs with a VIP greater than 1 (indicated by the red bar chart), including 2-Ethyl-1-hexanol D, 2-Ethyl-1-hexanol M, 2-Heptanone M, 1-Hexanol D, 2-Isopropyl-3-methoxypyrazine, Benzaldehyde M, 1-Hexanol M, Benzaldehyde D, 3-Methyl-2-butenal M, p-Cymene P, 3-Methyl-2-butenal D, 3-Carene D, Octanal D, (E,E)-2,4-decadecenal, 1-penten-3-one, 1-Pentanol M, Furfural D, 3-Hydroxy-2-butanone M, β-Pinene D, 1-Pentanol D, β-Pinene M, ethyl acetate M, 3-Methylbutanal, Furfural M, 3-Hydroxy-2-butanone D, Butyrolactone M, α-Pinene M, Butyrolactone D, and 3-Carene M, indicating that they play an important differentiating role in the five ginseng drying methods. To assess model overfitting, we conducted 200 cross-validations of R2 and Q2. The results are shown in Figure 7c, R2 = 0.0998, Q2 = −0.631, indicating that the model was proven to be reliable without overfitting and could be used to describe the differences in VOCs in ginseng using five different drying methods.

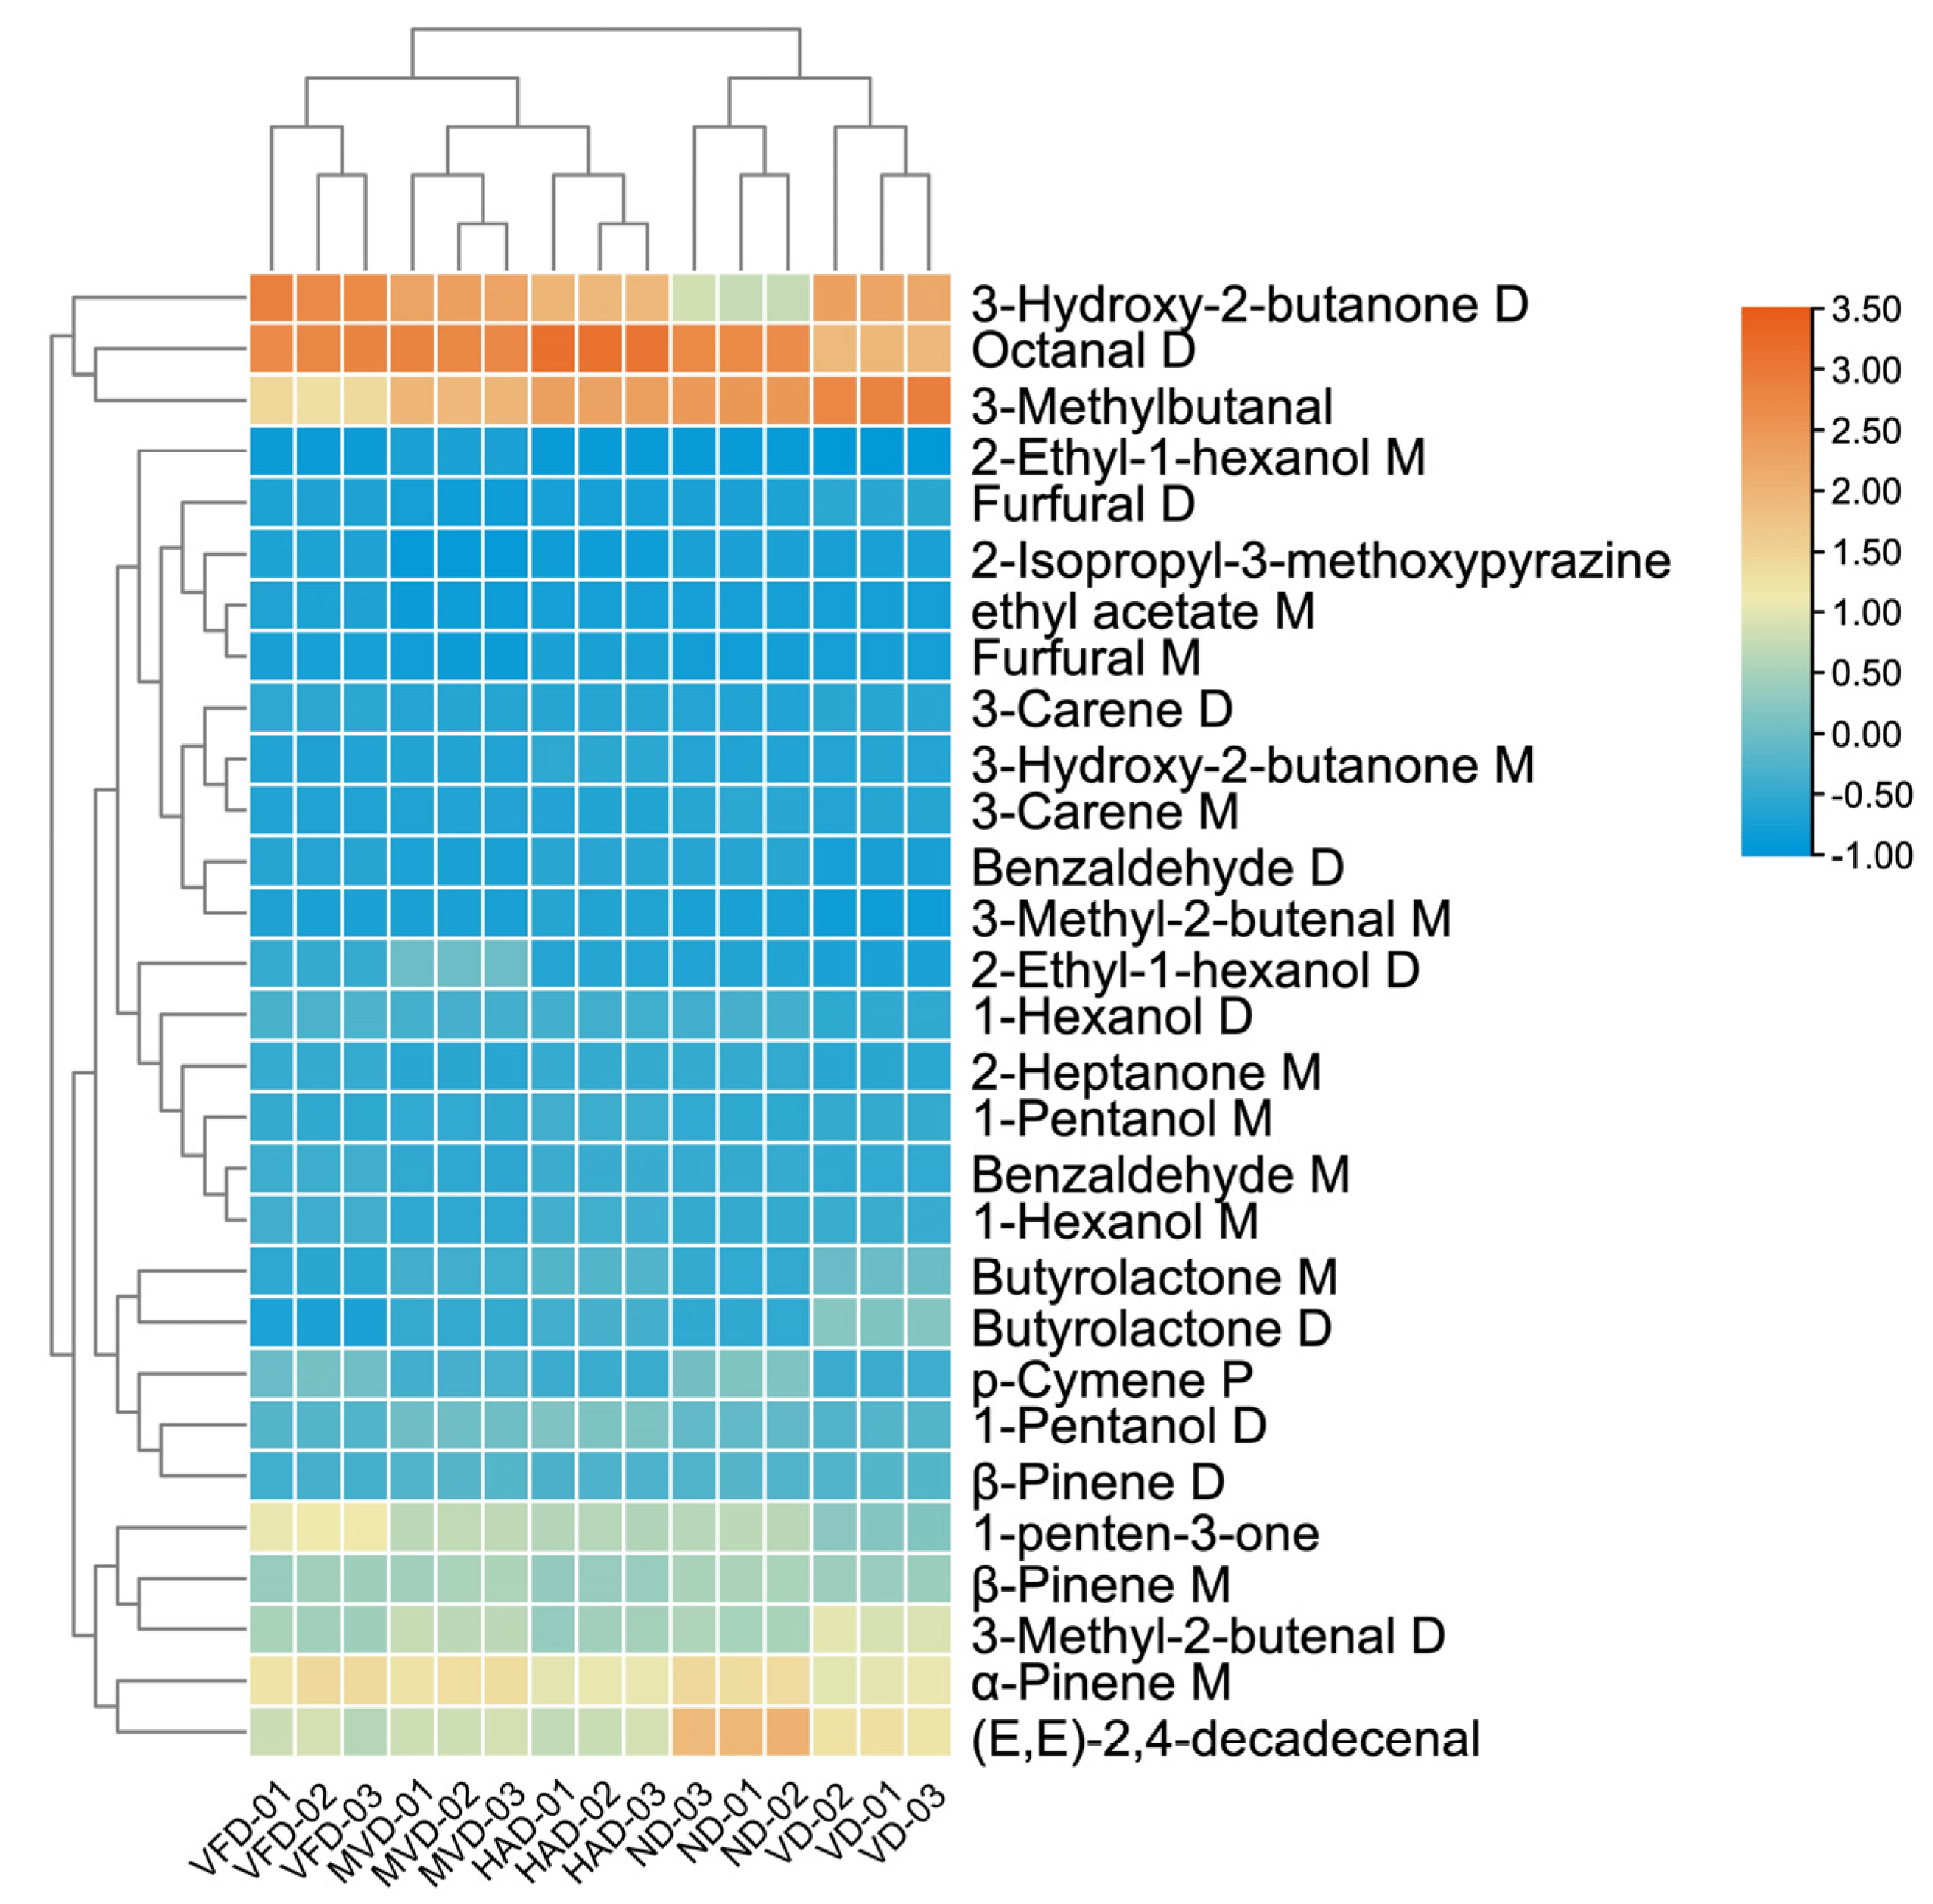
2.5.4. Cluster Analysis (CA)

In order to further elucidate whether the 29 components can serve as characteristic VOCs to distinguish and identify the five drying methods of ginseng, clustering heat maps are generated based on their peak intensity values. As shown in Figure 8, the horizontal coordinate represents different samples, and the vertical coordinate represents VOCs. Orange indicates an increase in the relative peak intensity value, while blue indicates a decrease. The 29 VOCs can effectively distinguish and identify the five drying methods of ginseng, and visually show the relative content of components among different drying methods. The markers of MVD are not obviously defined by VOCs, and the contents of 1-penten-3-one, Octanal D, (E, E)-2,4-decadecenal, and 3-Methylbutanal are relatively high in VFD, HAD, ND, and VD, respectively. In addition, based on the heat maps combined with CA, we can distinguish the VOCs’ differences in the five drying methods in ginseng, which are similar to the results of PCA, PLS-DA, and Euclidean distance. The CA roughly categorizes the five sample groups into three categories, VFD, MVD and HAD, and ND and VD, with good reproducibility within each group.

3. Discussion

In this study, GC-IMS technology was applied to analyze the VOCs in ginseng using different drying methods for the first time. Fresh ginseng was treated using ND, HAD, VD, MVD, and VFD. The color and appearance of the VFD-treated ginseng samples were most similar to those of fresh ginseng via visual observation. The ginseng samples after treatment with MVD and ND were white or light yellow, while the ginseng samples with HAD and VD treatment were yellowish or brown-yellow and wrinkled. In terms of color, the L (88.06 ± 1.03) of the VFD samples was the highest, and the ΔE (11.94 ± 1.41) was the lowest, indicating that the dry products’ brightness after VFD treatment was the highest and the Browning was the smallest. Moreover, the ΔE (26.52 ± 3.23) after HAD treatment was the largest, indicating that this method was not conducive to ginseng color retention. According to these results, the appearance of the ginseng samples was greatly influenced by the environment’s temperature and pressure during drying. This is due to the rapid evaporation of surface water during drying, resulting in significant structural and shape changes. Furthermore, the long-term high-temperature environment increases the probability of sample oxidation and Maillard reactions. Similar results have also been reported by Ning [37] for red ginseng. In contrast, ND uses sunlight and circulating air to evaporate water in traditional Chinese medicine more gently than heating and drying, but takes longer. The ΔE (20.05 ± 1.73) of MVD was low, which may have been due to the inactivation of oxidase and peroxidase in the samples caused by electromagnetic waves, thus reducing the occurrence of enzymatic Browning reaction [38]. VFD at lower temperatures resulted in ice crystals in vacuum freeze-dried samples. After sublimation, the samples largely maintained their original structure and shape. In summary, VDF is the most beneficial to the appearance and color retention of ginseng in the drying process, followed by MVD and ND.
However, sensory evaluation is subjective, so GC-IMS technology was used to objectively analyze the ginseng samples’ odor and compare the different drying methods’ effects on the ginseng’s VOCs. A total of 72 VOCs were obtained and 68 VOCs were identified in ginseng samples using GC-IMS. The identified VOCs included 23 aldehydes, (33.8%), 19 alkenes (27.9%), 10 alcohols (14.7%) and 10 ketones (14.7%), 4 esters (5.9%), 1 furan (1.5%) and 1 pyrazine (1.5%). Through a comparative fingerprint analysis of VOCs using the five different drying methods, it was found that the types of VOCs were basically the same, but the contents of VOCs were quite different. The VOCs contents in ginseng dried using ND were higher and its odor was best preserved. Most aldehydes, alkenes, ketones, and alcohols had high content in this method. However, this method was susceptible to natural conditions and was time-consuming. These problems would be noteworthy in large-scale production processes. The VOCs contents in ginseng dried using HAD, VD, and MVD were reduced and differed less. This phenomenon may have resulted from the ambient temperature during heating and drying, which can significantly influence the VOCs’ matter content in ginseng samples. As a food and Chinese herbal medicine, ginseng inevitably contains numerous VOCs with poor stability. These compounds are decomposed by heat after temperature rise, which may also be one of the reasons why the VOCs’ matter content in ginseng after heating and drying is relatively similar. The VOCs content in ginseng dried using VFD also decreased, and the difference was significant compared to other drying methods. This may have been due to the low temperature inhibiting the activity of the synthase enzyme involved in ginseng VOCs production. In general, compounds with poor stability in food and Chinese medicine are easily destroyed by heat. Compared with drying methods such as high temperature heating, VFD can better retain active ingredients and thus maintain the efficacy of Chinese medicinal materials. However, in this study, it was found that VFD has a greater impact on the VOCs of ginseng, resulting in odor loss. Similar results were also reported in the related literature [39,40]. The VOCs in VFD are mainly ethyl acetate and other esters, which have a fruity odor and are often used in the preparation of fruity and wine flavors.
The results of PCA, Euclidean distance analysis, PLS-DA analysis, and CA showed that the five drying methods in ginseng were well-separated and could be distinctly distinguished. In general, the types and contents of VOCs in MVD and HAD had been similar and close. Moreover, based on the importance of variables in the PLS-DA model, the contribution of each variable to the classification is quantified. If the VIP value is greater than 1, the compound can be used as potential characteristic markers. The higher the VIP value, the greater the difference in VOCs between different dried ginseng samples. A total of 29 VOCs can serve as primary characteristic markers to distinguish different drying methods in ginseng, including 2-Ethyl-1-hexanol M, 2-Ethyl-1-hexanol D, 2-Heptanone M, 1-Hexanol D, 2-Isopropyl-3-methoxypyrazine, Benzaldehyde M, and others. HCA confirmed that these VOCs could be used as the signature substances of five drying methods in ginseng. 1-penten-3-one is a major characteristic VOCs in VFD, with strong pungent odors, and the ability to induce the production of reactive oxygen species (ROS) and activate downstream defense responses in plants [41]. Octanal D can be used as a main characteristic VOC in HAD, and it possesses aldehyde, waxy, citrus, orange, fruity, and fatty odors. It is commonly used to produce a sweet orange aroma in the food industry. (E, E)-2,4-decadecenal is a major characteristic VOCs in ND, with cucumber, melon, citrus, pumpkin, and nutty odors. 3-Methylbutanal is a key characteristic VOCs in VD, with chocolate and fat odors, and is mainly used for food flavoring.
In this study, the GC-IMS rapid analysis method for the VOCs in ginseng using different drying methods was established. Compared with HS-SPME/GC-MS [42] analysis results, more compounds were detected in this study, the samples did not require pretreatment, and the analysis cycle was shorter. Therefore, GC-IMS technology has significant advantages in the analysis of VOCs. Furthermore, ND was determined to be the most suitable for retaining the VOCs and odor of ginseng, based on a comprehensive comparison of the effects of the different drying methods on the ginseng’s VOC types, content, and appearance. This study provides scientific theoretical guidance for optimizing ginseng-drying methods and studying flavor quality.

4. Materials and Methods

4.1. Samples

Ginseng was collected from Songjiang Town, Fusong County, Baishan City, Jilin Province, China; was transported to the laboratory within 24 h of harvest using a cold chain; and was frozen at −40 °C until the drying experiments.

4.2. Drying Procedures

The ginseng was washed with clean water, sliced, and then randomly divided into groups for the different drying methods, including natural air drying (ND), hot-air drying (HAD), vacuum drying (VD), microwave vacuum drying (MVD), and vacuum freeze drying (VFD). All freshly harvested ginseng samples were dried to a constant weight. For ND, the samples were evenly spread on stainless steel trays and exposed to natural sunlight for 14 h. For HAD, a hot-air oven (ZXRD-A7140, Zhicheng Analytical Instrument Manufacturing Co., Ltd., Shanghai, China) was heated to 60 °C, and the samples were then placed in the oven and dried at 60 °C for 11 h. For VD, the samples were treated using a vacuum oven (BZF-50, Boxun Medical Biological Instrument Co., Ltd., Shanghai, China) at −0.09 MPa and 60 °C for 10 h. For VFD, the samples were pre-frozen at −80 °C and then dried using a freeze-dryer (Alpha 2-4 LSCbasic, CHRIST, Hagen, Germany) for 7 h, where the condenser temperature and chamber pressure were −80 °C and −0.1 MPa, respectively. For MVD, the samples were placed in a microwave oven (WB-5, Famouk Co., Ltd., Fuzhou, China) and dried at 560 W for 1.5 h. The temperature and pressure were maintained at 60 °C and −0.08 MPa, respectively. Each drying process was repeated three times.
Portions of the ginseng samples prepared using the different drying methods were pulverized with a universal high-speed pulverizer (DFT-100A, Lin Da Machinery Co., Ltd., Wenling, China), sieved through a 60-mesh sieve, packed in closed plastic bags, and stored at −40 °C for VOC analysis.

4.3. Color Measurement

The color parameters (L, a, and b values) of the dried samples were quantitatively determined using a fully automatic colorimetric analyzer (Color Quest XE, Hunter Lab, Boston, MA, USA). The color difference (ΔE) was calculated using Equation (1) [43].
Δ E = L * L 2 + b * b 2 + a * a 2
where L, a, and b are the brightness, red–green, and blue–yellow values. L* = 91.75, a* = −1.73, and b* = 3.52 were the color values of the standard white plate.

4.4. GC-IMS Analysis

4.4.1. Headspace Sampling Conditions

Ginseng samples of 0.5 g were accurately weighed and placed in a 20 mL headspace bottle. The incubation temperature was 70 °C and 500 rpm for 20 min in a shaker. The injection volume was 500 µL, and the injection needle temperature was 85 °C. Three parallel groups were determined for each sample.

4.4.2. GC-IMS Conditions

The temperature of the MXT-5 capillary chromatography column (15 m × 0.53 mm × 1 μm, Restek Company of the United States, Bellefonte, PA, USA) and IMS were 60 °C and 45 °C, respectively. The ionization source was tritium (3H), the migration tube length was 53 mm, and the electric field strength was 500 V/cm. High-purity nitrogen (purity ≥ 99.999%) was used as the carrier and drift gas. The flow rate of the drift gas was set at 75 mL/min. The programmed flow rate of the whole phase was as follows: the initial flow rate of 2.00 mL/min was maintained for 2 min, linearly increased to 10.00 mL/min within 8 min, then linearly increased to 100.00 mL/min within 10 min, and maintained for 39 min. The total analysis time was 59 min, and the inlet temperature was 85 °C.

4.4.3. Statistical Analysis

The mixing of 6 ketones (2-butanone, 2-pentanone, 2-hexanone, 2-heptanone, 2-octanone and 2-nonone) was tested to establish a calibration curve of the retention time and retention index. Then, the retention index of the target substance was calculated from the retention time. A qualitative analysis of the target was performed using the built-in GC Retention Index (NIST 2020) database and IMS migration time database in the VOCal data-processing software.
The VOCal plug-in data-processing software, such as Reporter (Version 11.x), Gallery Plot (Version 1.1.0.2), and Dynamic PCA (version 0.0.3) were used to generate the three-dimensional spectrum, two-dimensional spectrum, difference spectrum, fingerprint, PCA, and Euclidean distance diagram of the VOCs for comparison between the samples. The CA was performed by TBtools software (version v2.119). The PLS-DA VIPs were calculated using the SIMCA software (version 14.1).

5. Conclusions

In summary, this study established a GC-IMS rapid analysis method for ginseng VOCs using different drying methods. A total of 72 VOCs were obtained and 68 VOCs were identified using the five drying methods, including 23 aldehydes, 19 alkenes, 10 alcohols, 10 ketones, 4 esters, 1 furan, and 1 pyrazine. Among them, aldehydes and alkene compounds were the primary components of the VOCs in ginseng. In addition, the effects of five different drying methods (ND, HAD, VD, MVD, and VFD) on ginseng’s appearance characteristics and VOCs were evaluated. The results showed that VFD produced a better appearance than other drying methods, while ND was the best drying method for ginseng in order to retain its VOCs and odor. Based on statistical analysis, including PCA, Euclidean distance, CA, and PLS-DA, the similarities and differences between the five different drying methods were found. A total of 29 VOCs can be used as key factors for the identification and differentiation of drying methods, and it was proved that these VOCs could be used to distinguish the five drying methods in ginseng. After a comprehensive comparison, it was concluded that the ND method was better than the other four drying methods. Nonetheless, its drying time was longer, and it was affected by external factors.
Furthermore, this study has limitations: the experiment did not investigate the effect of different drying temperatures on ginseng using the same drying method. There is no systematic study on the effects of different drying methods on the microstructure, physical properties (such as drying time, rehydration ratio, and shrinkage rate), and non-volatile components of ginseng. Future research should explore a wider range of the drying conditions, ginseng varieties, and analytical methods to fully understand and optimize the drying processing techniques of ginseng varieties.
This study provides new ideas and directions for the drying and processing technology of ginseng production. However, when selecting the drying method, we need to comprehensively consider the material characteristics, production conditions, economic factors, environmental impacts, and safety aspects to ensure the efficiency, economy, and safety of the ginseng-drying process.

Author Contributions

Conceptualization, Y.X. (Yun Xiang) and M.Z.; methodology, Y.X. (Yun Xiang) and M.Z.; software, F.O. and L.Z.; validation, Y.X. (Yingying Xu) and Q.Z.; formal analysis, Y.X. (Yun Xiang) and M.Z.; investigation, F.O. and L.Z.; resources, Y.X. (Yingying Xu) and Q.Z.; data curation, C.L.; writing—original draft preparation, Y.X. (Yun Xiang); writing—review and editing, C.L.; visualization, Y.X. (Yun Xiang) and M.Z.; supervision, C.L.; project administration, C.L.; funding acquisition, C.L. All authors have read and agreed to the published version of the manuscript.

Funding

This research was funded by the Undergraduate Research and Innovation Fund Project of Hunan University of Chinese Medicine (No. 2023BKS150), the Innovation and Entrepreneurship training plan of Hunan University of Chinese Medicine (No. 2024210), and the domestic First-Class Construction Discipline of Chinese Medicine in Hunan University of Chinese Medicine (No. 2024).

Institutional Review Board Statement

Not applicable.

Informed Consent Statement

Not applicable.

Data Availability Statement

Data are contained within the article.

Conflicts of Interest

The authors declare no conflicts of interest.

References

  1. Su, J.; Su, Q.; Hu, S.; Ruan, X.; Ouyang, S. Research Progress on the Anti-Aging Potential of the Active Components of Ginseng. Nutrients 2023, 15, 3286. [Google Scholar] [CrossRef] [PubMed]
  2. Liu, S.; Liu, F.; Wang, T.; Liu, J.; Hu, C.; Sun, L.; Wang, G. Polysaccharides Extracted from Panax Ginseng C.A. Mey Enhance Complement Component 4 Biosynthesis in Human Hepatocytes. Front. Pharmacol. 2021, 12, 734394. [Google Scholar] [CrossRef] [PubMed]
  3. Xu, H.Y.; Li, Q.C.; Zhou, W.J.; Zhang, H.B.; Chen, Z.X.; Peng, N.; Gong, S.Y.; Liu, B.; Zeng, F. Anti-Oxidative and Anti-Aging Effects of Probiotic Fermented Ginseng by Modulating Gut Microbiota and Metabolites in Caenorhabditis elegans. Plant Foods Hum. Nutr. 2023, 78, 320–328. [Google Scholar] [CrossRef]
  4. Wang, H.; Lv, J.; Jiang, N.; Huang, H.; Wang, Q.; Liu, X. Ginsenoside Re protects against chronic restraint stress-induced cognitive deficits through regulation of NLRP3 and Nrf2 pathways in mice. Phytother. Res. 2021, 35, 2523–2535. [Google Scholar] [CrossRef] [PubMed]
  5. Zhang, H.; Hu, C.; Xue, J.; Jin, D.; Tian, L.; Zhao, D.; Li, X.; Qi, W. Ginseng in vascular dysfunction: A review of therapeutic potentials and molecular mechanisms. Phytother. Res. 2022, 36, 857–872. [Google Scholar] [CrossRef]
  6. Fathi, F.; Ebrahimi, S.N.; Matos, L.C.; Oliveira, M.B.P.P.; Alves, R.C. Emerging drying techniques for food safety and quality: A review. Compr. Rev. Food Sci. Food Saf. 2022, 21, 1125–1160. [Google Scholar] [CrossRef]
  7. Shi, X.; Yang, Y.; Li, Z.; Wang, X.; Liu, Y. Moisture transfer and microstructure change of banana slices during contact ultrasound strengthened far-infrared radiation drying. Innov. Food Sci. Emerg. Technol. 2020, 66, 102537. [Google Scholar] [CrossRef]
  8. Liu, Y.; Chen, W.; Fan, L. Effects of different drying methods on the storage stability of barley grass powder. J. Sci. Food Agric. 2022, 102, 1076–1084. [Google Scholar] [CrossRef]
  9. Zhang, D.; Huang, D.; Zhang, X.; Zhao, H.; Gong, G.; Tang, X.; Li, L. Drying performance and energy consumption of Camelliaoleifera seeds under microwave-vacuum drying. Food Sci. Biotechnol. 2023, 32, 969–977. [Google Scholar] [CrossRef]
  10. Nunes, J.C.; Lago, M.G.; Castelo-Branco, V.N.; Oliveira, F.R.; Torres, A.G.; Perrone, D.; Monteiro, M. Effect of drying method on volatile compounds, phenolic profile and antioxidant capacity of guava powders. Food Chem. 2016, 197, 881–890. [Google Scholar] [CrossRef]
  11. Xia, J.; Guo, Z.; Fang, S.; Gu, J.; Liang, X. Effect of Drying Methods on Volatile Compounds of Burdock (Arctium lappa L.) Root Tea as Revealed by Gas Chromatography Mass Spectrometry-Based Metabolomics. Foods 2021, 10, 868. [Google Scholar] [CrossRef] [PubMed]
  12. Zhao, Y.; Sun, X.; Zhang, T.; Liu, S.; Cai, E.; Zhu, H. Study on the antidepressant effect of panaxynol through the IκB-α/NF-κB signaling pathway to inhibit the excessive activation of BV-2 microglia. Biomed. Pharmacother. 2021, 138, 111387. [Google Scholar] [CrossRef] [PubMed]
  13. Xu, L.Y.; Zhang, X.Z.; Du, H.L.; Tao, S.J.; Wang, X.M.; Chen, G.; Dong, J.H. Synthesis and antitumor activity of β-elemene derivatives bearing amino acid moiety. Chin. J. Mater. Med. Chem. 2013, 23, 169–175. [Google Scholar] [CrossRef]
  14. Cho, J.Y.; Chang, H.J.; Lee, S.K.; Kim, H.J.; Hwang, J.K.; Chun, H.S. Amelioration of dextran sulfate sodium-induced colitis in mice by oral administration of beta-caryophyllene, a sesquiterpene. Life Sci. 2007, 80, 932–939. [Google Scholar] [CrossRef]
  15. Wu, D.; Xia, Q.; Cheng, H.; Zhang, Q.; Wang, Y.; Ye, X. Changes of Volatile Flavor Compounds in Sea Buckthorn Juice during Fermentation Based on Gas Chromatography-Ion Mobility Spectrometry. Foods 2022, 11, 3471. [Google Scholar] [CrossRef] [PubMed]
  16. Zhang, J.; Li, J.; Ding, B.; Qiao, Q.; Wang, H.; Liang, Y.; Song, P.; Wu, Y.; Wang, C.; Tang, K.; et al. Electron ionization mass spectrometry feature peak relationships combined with deep classification model to assist similarity algorithm for fast and accurate identification of compounds. Rapid Commun. Mass. Spectrom. 2024, 38, e9752. [Google Scholar] [CrossRef]
  17. Song, Z.; Cao, Y.; Qiao, H.; Wen, P.; Sun, G.; Zhang, W.; Han, L. Analysis of the effect of Tenebrio Molitor rennet on the flavor formation of Cheddar cheese during ripening based on gas chromatography-ion mobility spectrometry (GC-IMS). Food Res. Int. 2023, 171, 113074. [Google Scholar] [CrossRef]
  18. de-la-Fuente-Blanco, A.; Ferreira, V. Gas Chromatography Olfactometry (GC-O) for the (Semi)Quantitative Screening of Wine Aroma. Foods 2020, 9, 1892. [Google Scholar] [CrossRef]
  19. Mishra, P.K.; Tripathi, J.; Gupta, S.; Variyar, P.S. GC-MS olfactometric characterization of odor active compounds in cooked red kidney beans (Phaseolus vulgaris). Heliyon 2019, 5, e02459. [Google Scholar] [CrossRef]
  20. Sun, Y.; Wu, Y.; Liu, B.; Chen, R.; Qiao, Y.; Zhang, Q.; Li, Q.; Wang, X.; Wang, Z. Analysis for different flavor compounds in mature milk from human and livestock animals by GC×GC-TOFMS. Food Chem. X 2023, 19, 100760. [Google Scholar] [CrossRef]
  21. Peng, Q.; Li, S.; Zheng, H.; Meng, K.; Jiang, X.; Shen, R.; Xue, J.; Xie, G. Characterization of different grades of Jiuqu hongmei tea based on flavor profiles using HS-SPME-GC-MS combined with E-nose and E-tongue. Food Res. Int. 2023, 172, 113198. [Google Scholar] [CrossRef] [PubMed]
  22. Zhang, K.; Gao, L.; Zhang, C.; Feng, T.; Zhuang, H. Analysis of Volatile Flavor Compounds of Corn Under Different Treatments by GC-MS and GC-IMS. Front. Chem. 2022, 10, 725208. [Google Scholar] [CrossRef]
  23. Mao, Y.; Zhu, L.; Fu, F.; Zhu, L.; Chen, J.; Liu, J.; Huang, D.; Lei, C. A Comparison of Volatile Organic Compounds in Puerariae Lobatae Radix and Puerariae Thomsonii Radix Using Gas Chromatography–Ion Migration Spectrometry. Separations 2024, 11, 31. [Google Scholar] [CrossRef]
  24. Yuan, J.; Li, H.; Cao, S.; Liu, Z.; Li, N.; Xu, D.; Mo, H.; Hu, L. Monitoring of Volatile Compounds of Ready-to-Eat Kiwifruit Using GC-IMS. Foods 2023, 12, 4394. [Google Scholar] [CrossRef] [PubMed]
  25. Lai, P.; Li, L.; Wei, Y.; Sun, J.; Tang, B.; Yang, Y.; Chen, J.; Wu, L. GC-IMS-Based Volatile Characteristic Analysis of Hypsizygus marmoreus Dried by Different Methods. Foods 2024, 13, 1322. [Google Scholar] [CrossRef]
  26. Sun, M.; Ni, L.; Huang, Y.; Yang, M.; Cheng, G.; Zhang, M.; Wu, M.; Ma, C. Effects of different drying treatments on the microstructure, free amino acids, volatile compounds and antioxidant activity of Flammulina velutipes root. Food Chem. X 2023, 18, 100656. [Google Scholar] [CrossRef] [PubMed]
  27. Wang, H.; Cui, Y.F.; Jiang, H.Z.; Wang, S.P.; Song, X.G.; Han, L.J.; Dai, L.; Li, N.; Zhang, J.Y. Effects of different drying methods on ginsenosides based on UHPLC-Q-Exactive Orbitrap MS technique. China J. Chin. Mater. Medica 2022, 47, 5246–5255. [Google Scholar] [CrossRef]
  28. Song, L.H.; Zhang, R.; Xu, T.Y.; Yu, P. Effects of different drying methods and temperatures on the content of chemical components and antioxidant activity of Ginseng decoction pieces. LiShiZhen Med. Mater. Medica Res. 2023, 34, 2412–2418. [Google Scholar] [CrossRef]
  29. Guo, N.; Bai, Y.; Huang, X.; Liu, X.; Cai, G.; Liu, S.; Guo, Y.; Gong, J. Comparison of the Saponins in Three Processed American Ginseng Products by Ultra-High Performance Liquid Chromatography-Quadrupole Orbitrap Tandem Mass Spectrometry and Multivariate Statistical Analysis. Int. J. Anal. Chem. 2022, 2022, 6721937. [Google Scholar] [CrossRef]
  30. Ai, Z.; Lin, Y.; Xie, Y.; Mowafy, S.; Zhang, Y.; Li, M.; Liu, Y. Effect of High-Humidity Hot Air Impingement Steaming on Cistanche deserticola Slices: Drying Characteristics, Weight Loss, Microstructure, Color, and Active Components. Front. Nutr. 2022, 9, 824822. [Google Scholar] [CrossRef]
  31. Wu, B.; Guo, X.; Guo, Y.; Ma, H.; Zhou, C. Enhancing jackfruit infrared drying by combining ultrasound treatments: Effect on drying characteristics, quality properties and microstructure. Food Chem. 2021, 358, 129845. [Google Scholar] [CrossRef] [PubMed]
  32. Benzing-Purdie, L.M.; Ripmeester, J.A.; Ratcliffe, C.I. Effects of temperature on Maillard reaction products. J. Agric. Food Chem. 1985, 33, 31–33. [Google Scholar] [CrossRef]
  33. Zhu, L.; Ou, F.; Xiang, Y.; Wang, B.; Mao, Y.; Zhu, L.; Zhang, Q.; Lei, C. Detection and Comparison of Volatile Organic Compounds in Four Varieties of Hawthorn Using HS-GC-IMS. Separations 2024, 11, 100. [Google Scholar] [CrossRef]
  34. Shi, D.H.; Dai, Y.P.; Lu, Q.; Sun, L.L.; Zhang, X.L.; Zhang, J. Primary study on identification of carbonizing degree of Platycladi Cacumen based on odor detection by GC-IMS. Chin. Tradit. Herb. Drugs 2021, 52, 6510–6517. [Google Scholar]
  35. Peng, J.; Ai, W.; Yin, X.; Huang, D.; Li, S. A Comparison Analysis of Four Different Drying Treatments on the Volatile Organic Compounds of Gardenia Flowers. Molecules 2024, 29, 4300. [Google Scholar] [CrossRef]
  36. Zhou, S.Q.; Feng, D.; Zhou, Y.X.; Zhao, J.; Zhao, J.Y.; Guo, Y.; Yan, W.J. HS-GC-IMS detection of volatile organic compounds in cistanche powders under different treatment methods. Lebensm. Wiss. Technol. 2022, 165, 113730. [Google Scholar] [CrossRef]
  37. Ning, X.; Lee, J.; Han, C. Drying characteristics and quality of red ginseng using far-infrared rays. J. Ginseng Res. 2015, 4, 371–375. [Google Scholar] [CrossRef]
  38. Zhang, Z.P.; Huang, X.P.; Ma, G.J.; Zhang, J.; Jiang, C.H.; Wang, F.X. Evaluation of drying characteristics and physicochemical properties of Angelicae Sinensis Radix under different drying methods based on combination entropy weight and variable coefficient method. Chin. Tradit. Herb. Drugs 2022, 23, 7403–7413. [Google Scholar] [CrossRef]
  39. Wang, Y.C.; Zhang, M.M.; Ma, W.Y.; Zhao, H.Q.; Liu, J.; Cui, L.; Wang, X. Effect of Different Drying Methods on Volatile Components in Pseudostellariae Radix Based on GC-IMS. Chin. J. Exp. Tradit. Med. Formulae. 2022, 28, 100–107. [Google Scholar] [CrossRef]
  40. Kang, M.; Tao, N.P.; Yu, J.; Wang, X.C.; Ji, L.J.; Le, C.H.; Yin, M.Y. Comparison of texture quality and volatile components of dried figs by different drying methods. Food Ferment. Ind. 2020, 46, 204–210. [Google Scholar] [CrossRef]
  41. Zhang, Q.H.; Chen, Y.Y.; Zhang, H.L.; Shen, Y.B. The role of 1-penten-3-one in plant defense responses. Plant Physiol. J. 2019, 55, 225–231. [Google Scholar] [CrossRef]
  42. Kim, Y.; Lee, J.W.; Jo, I.H.; Kwon, N.; Kim, D.; Chung, J.W.; Bang, K.H.; Sung, J. Volatile Compositions of Panax ginseng and Panax quinquifolium Grown for Different Cultivation Years. Foods 2022, 12, 136. [Google Scholar] [CrossRef] [PubMed]
  43. Hu, D.; Liu, X.; Qin, Y.; Yan, J.; Li, R.; Yang, Q. The impact of different drying methods on the physical properties, bioactive components, antioxidant capacity, volatile components and industrial application of coffee peel. Food Chem. X 2023, 19, 100807. [Google Scholar] [CrossRef] [PubMed]
Figure 1. Appearance of ginseng using different drying methods.
Molecules 29 05235 g001
Figure 2. Three-dimensional (a) and two-dimensional (b,c) topographic plots of VOCs in ginseng with different drying methods.
Molecules 29 05235 g002aMolecules 29 05235 g002b
Figure 3. The VOCs fingerprints of ginseng with different drying methods.
Molecules 29 05235 g003
Figure 4. PCA score plot.
Molecules 29 05235 g004
Figure 5. PCA 3D scatter plot.
Molecules 29 05235 g005
Figure 6. Fingerprint similarity based on Euclidean distance of different samples.
Molecules 29 05235 g006
Figure 7. The PLS-DA score plots of region multi-classification (a); VIP diagram of the PLS-DA model (b); the permutation test results (n = 200) of the PLS-DA model (c).
Molecules 29 05235 g007aMolecules 29 05235 g007b
Figure 8. CA of characteristic VOCs in ginseng with different drying methods.
Molecules 29 05235 g008
Table 1. The color parameters of ginseng using different drying methods.
DryingLabΔE
ND72.72 ± 6.89 c1.68 ± 0.76 bc15.91 ± 1.76 bc23.32 ± 5.66 ab
HAD70.17 ± 4.22 c2.64 ± 0.70 a18.01 ± 1.61 a26.52 ± 3.23 a
VD70.44 ± 2.04 c1.89 ± 0.31 b17.87 ± 0.34 a25.98 ± 1.69 a
MVD77.68 ± 1.96 b1.18 ± 0.43 c17.41 ± 1.45 ab20.05 ± 1.73 b
VFD88.06 ± 1.03 a−0.91 ± 0.2 d14.82 ± 1.27 c11.94 ± 1.41 c
where L, a, b, ΔE are the brightness, red–green and blue–yellow values, and color difference. Different numbers in the same column with different letters as superscript were significantly (p < 0.05) different.
Table 2. VOCs in ginseng with different drying methods by GC-IMS.
NoCompoundsCASMolecular FormulaRIRt/sDt/msOdor Description
1(E, E)-α-Farnesene DC502614C15H241487.12464.6541.48579citrus, herbal, lavender, neroli
2(E, E)-α-Farnesene MC502614C15H241485.72454.6041.42258citrus, herbal, lavender, green
3SafranalC116267C10H14O1208.91077.331.28714herbal, phenolic, tobacco, spicy
4α-TerpieolC10482561C10H14O1188.81014.8451.28968floral, lilac, terpenic
5NonanalC124196C9H18O1104.8790.4761.49418rose, citrus, strong oily
62-Isopropyl-3-methoxypyrazineC25773404C8H12N2O1095.1768.111.25062mung bean
7LinaloolC78706C10H18O1086.2748.0991.21862citrus, rose, woody, blueberry
8(E)-2-Octenal MC2548870C8H14O1065.5703.3661.32707fresh cucumber, fatty, green herbal, banana, green leaf
9(E)-2-Octenal DC2548870C8H14O1065.5703.3661.82308fresh cucumber, fatty, green herbal, banana, green leaf
10p-Cymene MC99876C10H141020.4615.0791.21506fresh, citrus, terpene, woody, spice
11p-Cymene DC99876C10H141021.1616.2561.31284resh, citrus, terpene, woody, spice
12p-Cymene PC99876C10H141017.8610.3711.7253fresh, citrus, terpene, woody, spice
13Octanal DC124130C8H16O1013.9603.3081.81241aldehyde, waxy, citrus, orange, fruity, fatty
14Octanal MC124130C8H16O1008592.7131.41418aldehyde, waxy, citrus, orange, fruity, fatty
151-Octen-3-ol DC3391864C8H16O983.8545.9351.59477mushroom, lavender, rose, hay
16Benzaldehyde MC100527C7H6O961.9502.3471.1525bitter almond, cherry, nutty
17Benzaldehyde DC100527C7H6O961.9502.3471.46539bitter almond, cherry, nutty
18(E)-2-Heptenal DC18829555C7H12O959.7498.1281.6621spicy, green vegetables, fresh, fatty
19(E)-2-Heptenal MC18829555C7H12O957.8494.6131.25811spicy, green vegetables, fresh, fatty
20Heptanal DC111717C7H14O899.9396.8911.69906fresh, aldehyde, fatty, green herbs, wine, fruity
21Heptanal MC111717C7H14O902.7401.1091.35053fresh, aldehyde, fatty, green herbs, wine, fruity
22Cyclohexanone DC108941C6H10O893.3387.0491.44426strong pungent, earthy
23Cyclohexanone MC108941C6H10O892.3385.6431.15646strong pungent, earthy
241-Hexanol MC111273C6H14O869.7354.7091.32808fresh, fruity, wine, sweet, green
251-Hexanol DC111273C6H14O867.2351.4471.64167fresh, fruity, wine, sweet, green
26(E)-2-Hexenal MC6728263C6H10O853.9334.5441.17881green, banana, fat
27(E)-2-hexenal DC6728263C6H10O849.1328.5691.51598green, banana, fat
28hexanal DC66251C6H12O797.3271.211.55279fresh, green, fat, fruity
29Hexanal MC66251C6H12O800.8274.7951.26863fresh, green, fat, fruity
301-Pentanol DC71410C5H12O767.1241.3351.52334balsamic
311-Pentanol MC71410C5H12O768.4242.531.24801balsamic
323-MethylbutanalC590863C5H10O668.3164.9791.40801chocolate, fat
33Ethyl Acetate DC141786C4H8O2628.6144.911.33439fresh, fruity, sweet, grassy
34ethyl acetate MC141786C4H8O2633.5147.2261.0998fresh, fruity, sweet, grassy
353-Hydroxy-2-butanone DC513860C4H8O2715.4196.241.32556butter, cream
363-Hydroxy-2-butanone MC513860C4H8O2722.2201.6441.07231butter, cream
37Furfural DC98011C5H4O2831.1307.3931.33734sweet, woody, almond, bready
38Furfural MC98011C5H4O2829305.0771.08507sweet, woody, almond, bready
39Butyrolactone MC96480C4H6O2918.2425.4691.08166cream, fat, caramel
40β-Pinene MC127913C10H16977.3532.6261.21289resin, green
41β-Pinene DC127913C10H16976529.8561.29733resin, green
42β-Pinene PC127913C10H16975528.0091.63287resin, green
43CampheneC79925C10H16952.5484.6051.20951woody, camphor
44α-Pinene MC80568C10H16932.7449.651.21413fresh, camphor, sweet, pine wood
45α-Pinene DC80568C10H16934451.7271.67103fresh, camphor, sweet, pine wood
46α-Pinene PC80568C10H16934.3452.2461.72246fresh, camphor, sweet, pine wood
473-Methyl-2-butenal DC107868C5H8O786260.171.35635fruity
483-Methyl-2-butenal MC107868C5H8O779.3253.4221.08907fruity
491-penten-3-oneC1629589C5H8O667.2164.3891.30212strong pungent odors
502-butanoneC78933C4H8O601.2132.4941.23571fruity, camphor
512-Heptanone MC110430C7H14O885.6376.1571.26226pear, banana, fruity, slight medicinal fragrance
523-Heptanone DC106354C7H14O889.3381.3151.62728fruity, grass, oil
53Butyrolactone DC96480C4H6O2917.2423.8681.29782cream, fat, caramel
54Limonene MC138863C10H161039.9651.8781.21338lemon, sweet, orange, pine oil
55Limonene DC138863C10H161038.1648.351.29803lemon, sweet, orange, pine oil
56LimoneneC138863C10H161038.5649.0551.6614lemon, sweet, orange, pine oil
57Limonene PC138863C10H161038.5649.0551.72667lemon, sweet, orange, pine oil
582-PentylfuranC3777693C9H14O996.3572.4131.25131bean, fruity, earthy, green, vegetable
593-Carene MC13466789C10H16997.9575.1751.21279citrus, lemon, woody
603-Carene DC13466789C10H16995.3570.2041.30035citrus, lemon, woody
613-Carene PC13466789C10H16995.5570.7561.71712citrus, lemon, woody
621-Octen-3-ol MC3391864C8H16O985.8550.1111.15382mushroom, lavender, rose, hay
633-Heptanone MC106354C7H14O899.9396.8921.19904fruity, grass, oil
64(E, E)-2,4-decadecenalC25152845C10H16O1331.61552.1471.4288cucumber, melon, citrus, pumpkin, nutty
65(E)-2-NonenalC18829566C9H16O1147.7898.0661.41052fatty, green, waxy, cucumber, melon
662-Ethyl-1-hexanol MC104767C8H18O1044.2660.1071.41773citrus, fresh floral, greasy
672-Ethyl-1-hexanol DC104767C8H18O1045.6662.8761.79912citrus, fresh floral, greasy
682-NonanoneC821556C9H18O1092.8762.8171.4051fresh, sweet, green, herb
Note: RI: retention index, Rt: retention time, Dt: relative migration time.
Disclaimer/Publisher’s Note: The statements, opinions and data contained in all publications are solely those of the individual author(s) and contributor(s) and not of MDPI and/or the editor(s). MDPI and/or the editor(s) disclaim responsibility for any injury to people or property resulting from any ideas, methods, instructions or products referred to in the content.

