Article

The Experimental and Modeling Study on the Thermodynamic Equilibrium Hydrate Formation Pressure of Helium-Rich Natural Gas in the Presence of Tetrahydrofuran

1
State Key Laboratory of Heavy Oil Processing, China University of Petroleum-Beijing at Karamay, Karamay 834000, China
2
State Key Laboratory of Heavy Oil Processing, China University of Petroleum (Beijing), Beijing 102249, China
*
Author to whom correspondence should be addressed.
Molecules 2024, 29(20), 4827; https://doi.org/10.3390/molecules29204827
Submission received: 12 August 2024 / Revised: 2 October 2024 / Accepted: 10 October 2024 / Published: 11 October 2024
(This article belongs to the Section Physical Chemistry)

Abstract

:
Hydrate-based gas separation (HBGS) has good potential in the separation of helium from helium-rich natural gas. HBGS should be carried out under a pressure higher than the thermodynamic equilibrium hydrate formation pressure (Peq) to ensure the formation of hydrate so that the accurate prediction of Peq is the basis of the determination of HBGS pressure. In this work, the Peq of the helium-rich natural gases with different helium contents (1 mol%, 10 mol%, and 50 mol%) in gas and different tetrahydrofuran (THF) contents (5 wt%, 10 wt%, and 19 wt%) in liquid at different temperatures were experimentally investigated through the isothermal pressure search method. A new thermodynamic model was proposed to predict the Peq of helium-rich natural gas. This model can quantitatively describe the effects of THF and helium on Peq, and it predicts the Peq of the helium-rich natural gases in this work accurately. The average relative deviation of the model is less than 3%. This model can guide the determination of the operating condition of the HBGS of helium-rich natural gas.

1. Introduction

Helium (He) is widely used in aerospace, cryogenic science, electronic production, medicine treatment, instrument manufacturing, and other high-tech industries [1] due to its stable chemical properties [2], low boiling temperature (4.2 K), and small radius (0.26 nm) [3]. The global annual demand of helium exceeded 3000 tons in 2020 [4], and it continuously increases. The helium recovery from natural gas (NG) is the only method for industrial-scale helium production [5]. The mole fraction of helium in NG is extremely low. NG is treated as helium-rich natural gas (HNG) and holds industrial value when the mole fraction of the helium in NG is higher than 0.3 mol% [6].
Though many technologies were proposed to purify the helium from HNG, pressure swing adsorption (PSA), membrane, and cryogenic separation are the main separation methods for the industrial production of helium. PSA and membrane are used to produce helium of high purity with small-scale industrial production [7]. Pressure swing adsorption (PSA) requires lower energy consumption, but the recovery of helium limits the use of PSA for low-purity helium separation [8]. The membranes have high selectivity and lower energy consumption, but a larger surface area is required for membranes leading to high capital cost for low-purity helium separation [9]. Trace amounts of hydrogen sulfide (H2S) NGs are harmful to SPA and membrane [10]. Pressure swing adsorption (PSA) [8] and membrane separation [9] are used as supplementary steps to purify high-purity helium gas from crude helium gas (the mixture of CH4 and helium), which is produced by cryogenic separation because those two methods cannot efficiently separate helium from the gas with low helium content. Cryogenic separation has high helium recovery but causes high energy consumption for purifying high-purity helium gas. About 90% of helium is recovered by cryogenic separation [11]. Therefore, a separation method with low energy consumption and low equipment costs is expected.
Hydrate-based gas separation (HBGS) is an accepted separation method with low energy consumption, low equipment costs, and is not negatively affected by H2S [10]. HBGS is suitable for separating the small gases when the diameter of the gas molecules is much smaller than the diameter of the water molecule cage in hydrate, like hydrogen. HBGS has been used to separate hydrogen from fluid catalytic cracking dry gas (H2 + CH4 + C2H6 + CO2) [10], hydrogenation tail gas (H2 + CH4 + C2H6 + C3H8) [12,13], and hydrogen-compressed natural gas (H2+ CH4 + C2H6 + C3H8) [14]. Han et al. [14] recovered hydrogen with a purity of 98.73% from a feed gas comprising H2 (30.0 mol%), CH4 (63.0 mol%), C2H6 (4.9 mol%), and C3H8 (2.1 mol%) by using three-stage-HBGS in the presence of tetrahydrofuran (THF). Helium, which has a smaller molecular diameter than hydrogen, is the most suitable target gas for HBGS. Therefore, helium recovery from HNGs by using HBGS is an accepted separation method.
Gas hydrates are non-stoichiometric crystals formed by water and guest molecules. The guest molecules are gas and liquid molecules which are trapped in cages of water molecules, like methane (CH4) [15], carbon dioxide (CO2) [16], and THF [17]. Different gases require different thermodynamic conditions for hydrate formation [10]. The gas compositions of HNGs from different sources are different. Generally, the HNG consists of helium, CH4, CO2, H2S, and other hydrocarbons [18,19]. During the HBGS process of the HNG, the gases that have smaller molecular diameters (such as helium and hydrogen) can hardly form hydrate and are enriched in the gas phase, while the other gases form hydrate and are enriched in the hydrate phase [20], which is shown in Figure 1.
The application of HBGS is limited by the requirement of hydrate formation conditions with low temperatures and high pressures [21]. Since high pressure leads to high energy consumption, how to decrease the thermodynamic equilibrium hydrate formation pressure (Peq) is crucial to the HBGS of the helium from HNGs in the industry. Peq can be shifted toward lower pressures by using thermodynamic promoters [22], such as THF. THF is a thermodynamic promoter which is soluble in water and can significantly reduce Peq [23]. The Peq of hydrate formation in the presence of THF is much lower than that of hydrate formation in the absence of THF. The effect of THF in the HBGS of hydrogen is better than other promoters [10,12,13,14]. Helium is similar to hydrogen in hydrate formation; for instance, it has a similar high Peq [24]. Therefore, THF was chosen as a thermodynamic promoter in this work.
Since HBGS separates gas mixtures by forming hydrate, the HBGS pressure should be higher than Peq to ensure the formation of hydrate [24]. It is crucial to accurately predict the Peq of different HNGs with different THF solutions. However, no model can ensure the accurate prediction of the Peq of the corresponding systems, and the experimental data that can support the establishment of the prediction model is very little. The van der Waals and Platteeuw model [25,26,27] and Chen–Guo model [28] are the two most-used models for predicting the Peq of THF hydrate with NGs. In the Chen–Guo model, hydrate formation is a two-step process: the quasi-chemical reaction equilibrium of basic cages and the physical adsorption equilibrium of gas molecules in the link cages, which is different from the van der Waals and Platteeuw model. For sII hydrate (24 Gas · 136 H2O), 8 larger cages (51264, a hexahedron with 12 pentagons and 4 hexagons) are the large cages (or basic cage) and 16 smaller cages (512, a dodecahedron with 12 pentagons) are the small cages (linked cages) [28]. The basic cages are filled with calculated quasi-chemical reaction equilibrium; this is different from the van der Waals and Platteeuw model, which is calculated using Langmuir adsorption. The Chen–Guo model has significant improvements in the prediction accuracy of hydrate formation conditions [29,30]. Both the Chen–Guo model and van der Waals–Platteeuw model rely on fitting the Langmuir adsorption, so the experimental study on Peq is the prerequisite for modeling.
In this work, the Peq of HNGS in the presence of THF was experimentally investigated and was accurately predicted to verify the feasibility of the HBGS process of helium from HNGs. The effects of the THF content in liquid and helium content in gas on the Peq were quantitatively described by the model in this work. To reveal the effect of helium on hydrate formation, the binary gas (CH4 and helium) and ternary gas (CH4, helium, and CO2) were used in this work. This is the first work that accounted for the effects of helium in a gas mixture on Peq in a thermodynamic model. The model can quantitatively describe the effects of THF and helium on Peq, and it predicts the Peq of the helium-rich natural gases in this work accurately. The new thermodynamic model and experimental data in this work can help to further understand the effects of helium and THF on Peq and can guide the prediction and control of the HBGS of helium from HNGs.

2. Model

In this work, we proposed a thermodynamic model based on the Chen–Guo model for Peq [20,29]. The model used the Patel–Teja (PT) equation of state (EoS) [31] to calculate the fugacity of CH4, CO2, and helium, which are provided in Appendix A. Calculation for the Fugacity of Gases, and used the Wilson activity coefficient model to calculate the activity of water and the fugacity of THF [28]. The Wilson activity coefficient model is a simple and accurate method for gas–liquid phase equilibria of nonionic solutions [32], which is suitable for the CH4-THF-water system [28]. This is the first thermodynamic model that accounted for the effects of helium in a gas mixture on Peq. The model can quantitatively describe the effects of THF and helium on Peq, and it predicts the Peq of the model’s helium-rich natural gases in this work accurately.
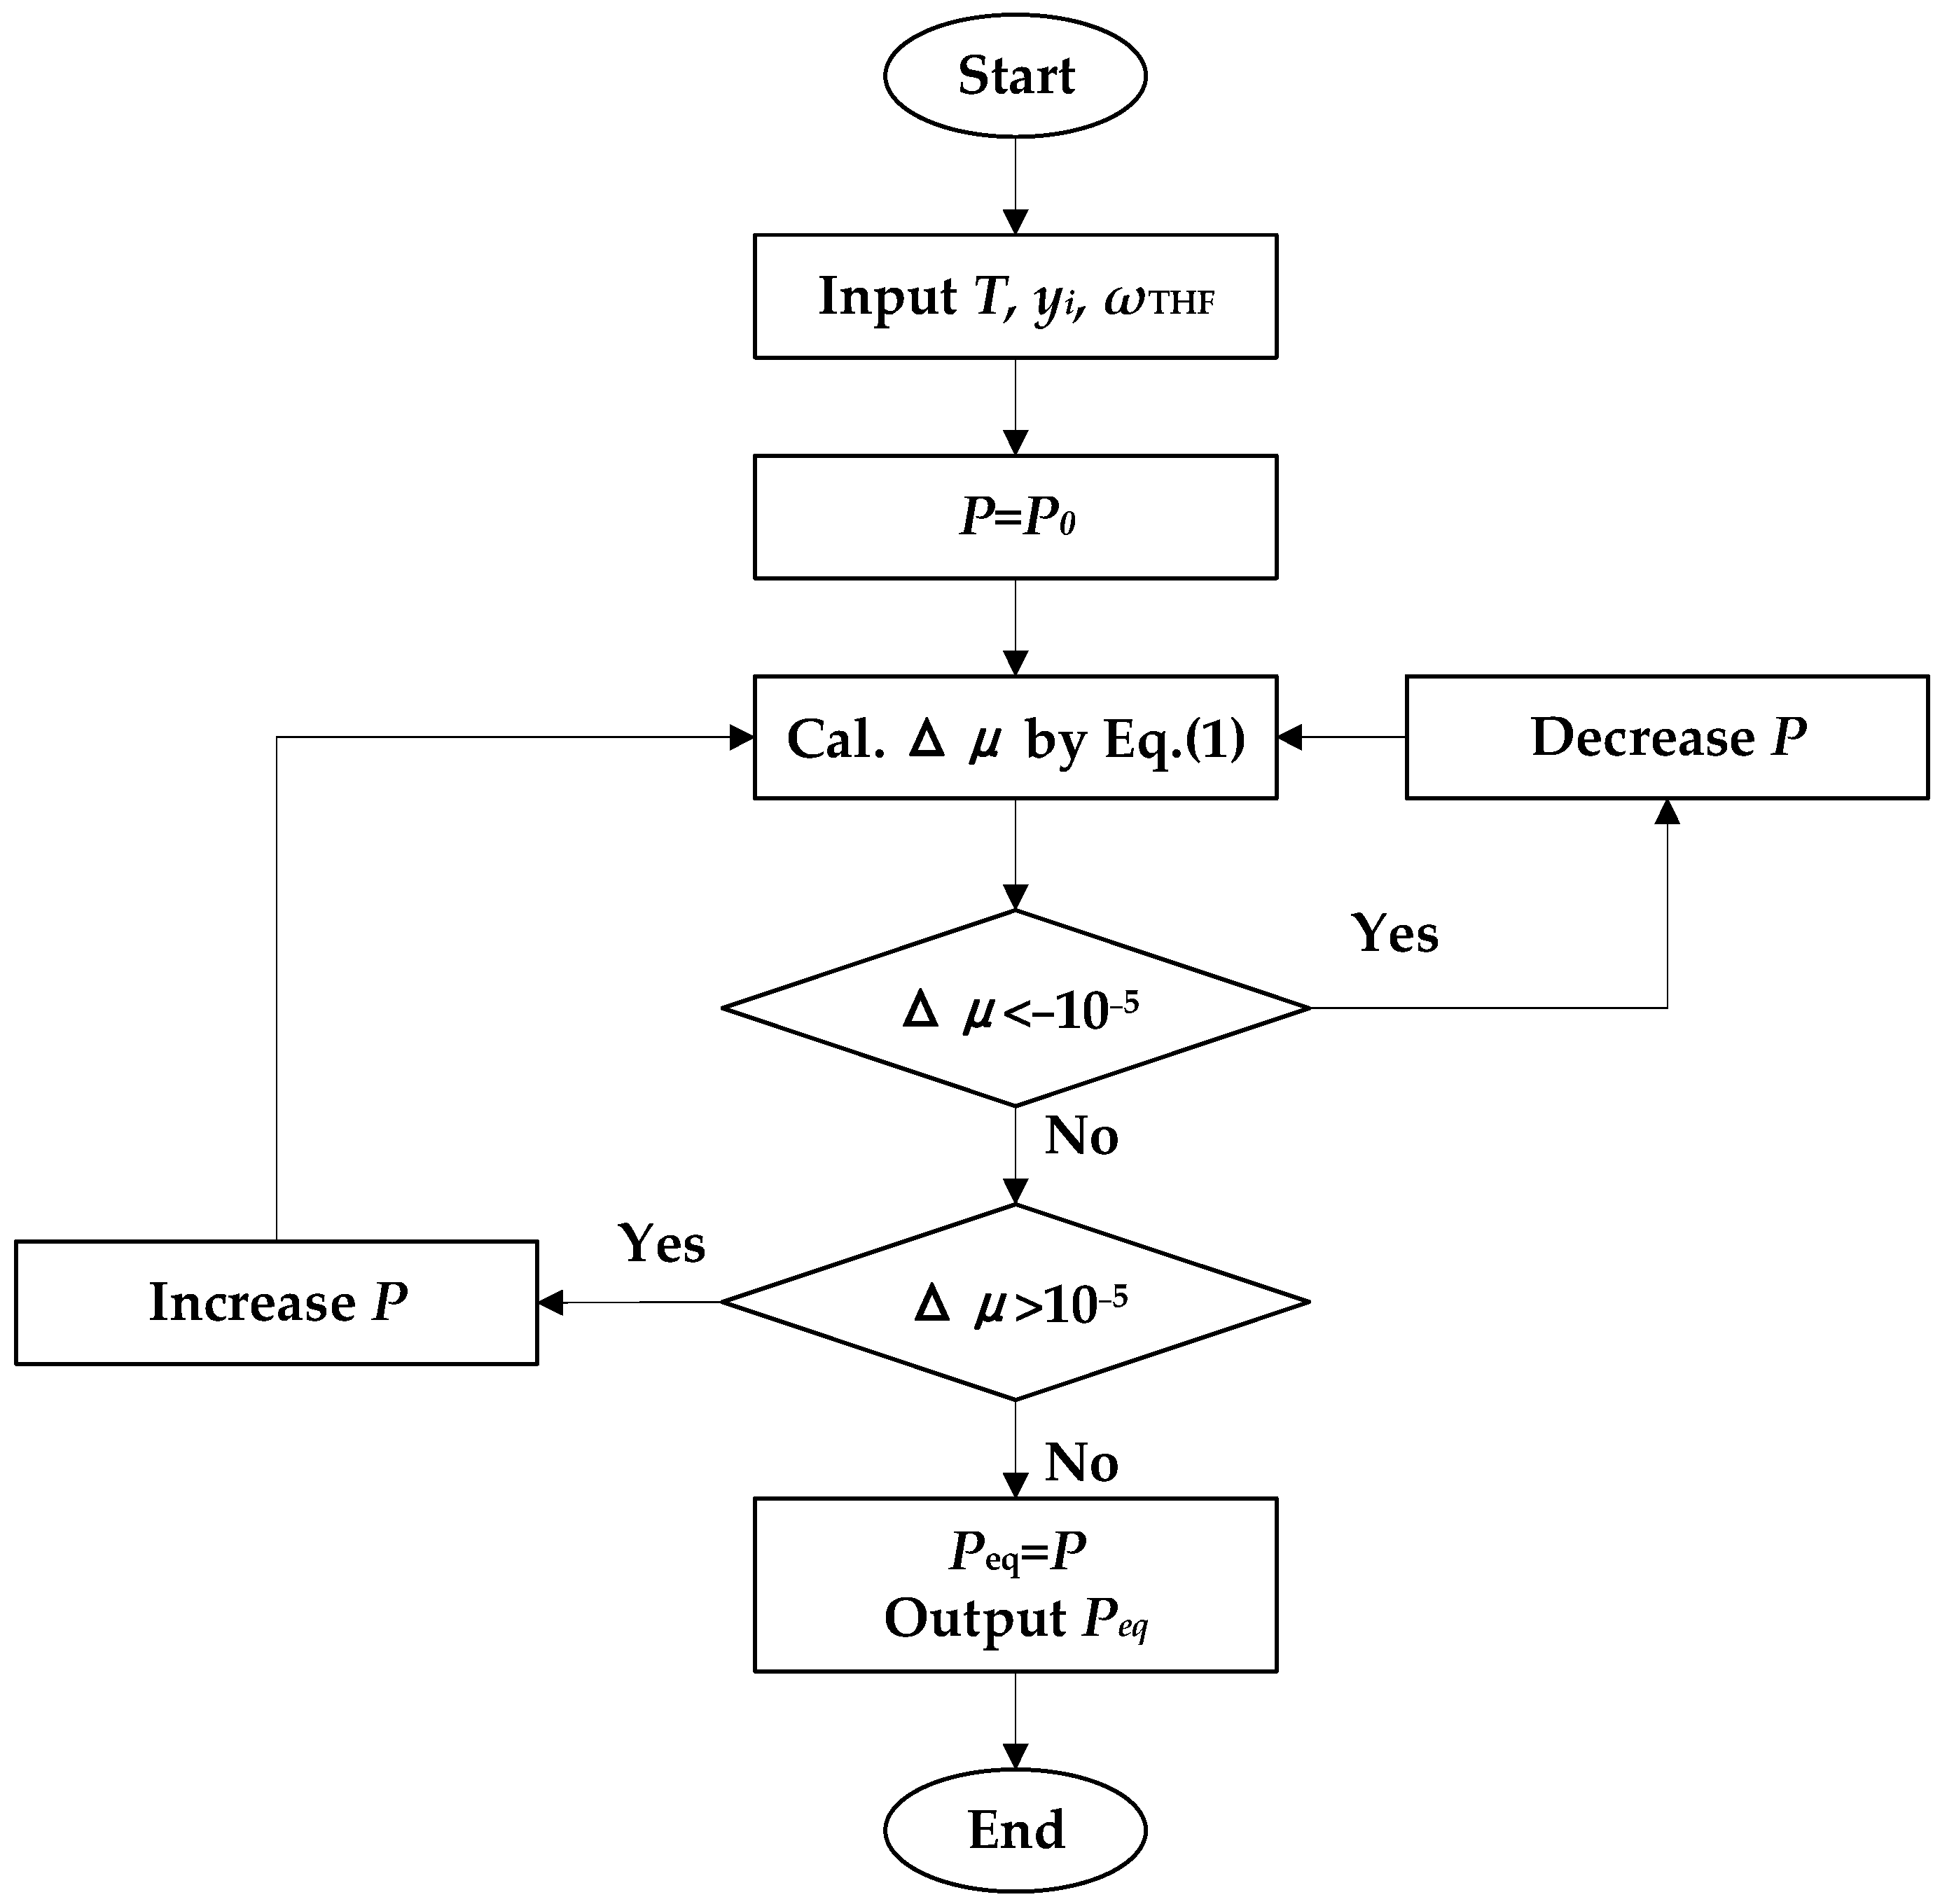
The phase equilibrium conditions of the systems in this work are determined by the difference in chemical potential between phases (Δμ). When the Δμ = 0, the pressure of the system is the Peq [15]. The procedure for predicting Peq is illustrated in Figure 2.
The Δµ can be calculated as follows [28,29]:
Δ μ = RT λ 2   ln f T H F H f T H F + i λ 1 ln 1 θ i
where θ i is the occupation fraction of the linked cages in hydrates filled by gas and i is the CH4, CO2, and helium, respectively. f T H F and f T H F H are the fugacity of THF in the liquid phase and the basic hydrate under the experimental condition, respectively. R is the gas constant (8.314 J·K−1·mol−1). λ 1 is the ratio of the linked-cage number to the water-molecule number. λ 2 is the ratio of the basic-cage number to the water-molecule number. λ 1 and λ 2 are determined by the hydrate structure (sII). For THF hydrate (sII), λ 1 is 2/17 and λ 2 is 1/17 [20,29].
Based on the Langmuir adsorption theory, the occupation fraction of the linked cages in hydrates θ i can be expressed as follows [29]:
θ i = f i C i 1 + i ( f i C i )
where f i is the fugacity of CH4, CO2, and helium calculated by PT EOS. C i is the Langmuir constant of CH4, CO2, and helium correlated as an Antoine-type equation [29]:
C i = X exp Y T Z
where X , Y , and Z are the Antoine parameters. The parameters for CH4, CO2, and helium are fitted by the experimental data of this work, as shown in Table 1.
Based on the Chen–Guo model, the fugacity of tetrahydrofuran in the hydrate phases ( f T H F H ) is calculated as follows [33]:
f T H F H = f T H T · exp β P T · α w 1 λ 2
where β is the parameter of hydrate structure, which is 10.244 K/MPa [20,29]. α w is the activity of the water calculated by the Wilson model. f T , j H T is a faction of temperature in the Chen–Guo model, which can be written as follows [33]:
f T H ( T ) = e x p ( i A i θ i T ) · A e x p ( B T C )
where A , B , and C are the Antoine parameters. For THF hydrate, A is 1.80 × 1024 Pa, B is −2.0 × 10⁴ K, and C is −130 K. The A i is the binary interaction parameter between gas i and THF in the hydrate. For THF hydrate, A C H 4 is 300, A C O 2 is 300, and A H e is 100. All the parameters are fitted by Peq from the literature and this study.
The activity of water in solution was calculated by the Wilson model to be written as follows [28]:
l n γ 1 = l n x 1 + Λ 12 x 2 + x 2 Λ 12 x 1 + Λ 12 x 2 Λ 21 x 2 + Λ 21 x 1
l n γ 2 = l n x 2 + Λ 21 x 1 + x 1 Λ 21 x 2 + Λ 21 x 1 Λ 12 x 1 + Λ 12 x 2
Λ 12 = v 2 L v 1 L e x p λ 12 λ 11 R T
Λ 21 = v 1 L v 2 L e x p λ 21 λ 22 R T
α w = γ 1 x 1
where x 1 and x 2 are the mole fractions of water and THF, respectively. v 2 L and v 1 L are the mole volumes of water and THF, respectively. The mole volumes of water and THF can be calculated by fitting polynomials from the literature [32]. γ 1 and γ 2 are the activity coefficients of water and THF, respectively. λ 12 λ 11 is 1865.2097 J/mol and λ 21 λ 22 is 1927.6307 J/mol according to the literature [34].
The fugacity of THF in liquid is corrected by polynomials as follows:
f T H F = γ 2 x 2 P 2 s a t e x p ( v 2 L ( p P 2 s a t ) R T ) f c o r
f c o r = 8.7774 w 2 + 0.444 w + 1.3176
where P 2 s a t is the saturated vapor pressure of THF. w is the mass fraction of THF in the solution. f c o r is fitted by Peq from the literature and this study. The effects of f c o r are discussed in Section 4.
Average relative deviation (ARD), goodness of fit (GF), and standard deviation (SD) are used to calculate the deviation between experimental (exp) and predicted (pre) Peq.
A R D = ii   n   P eq ,   exp , ii   P eq ,   pre , ii   P eq ,   exp , ii   / n 100 %
G F = 1 i i n   P e q , e x p , i i P e q , p r e , i i 2 i i n   P e q ,   exp , ii   i i n n   P e q , p r e , i i / n 2
S D = i i   n   P e q ,   e x p , i i   P e q ,   p r e , i i   P e q ,   e x p , i i   2 n

3. Results

To show the effects of THF on hydrate formation, the initial concentrations of THF in aqueous solutions are 5.0 wt%, 10.0 wt%, and 19.0 wt%. In 19 wt% THF aqueous solution, the mole ratio of THF to water is 1/17, which is the same as the mole ratio of THF to the water of sII hydrate ( λ 2 = 1/17).
To show the effects of helium on hydrate formation, the mixture of CH4 and helium was used in this work. The mole ratios of CH4-helium in the binary gas mixture are 99.0/1.0 (HNG1), 90.0/10.0 (HNG2), and 50.0/50.0 (HNG3). The actual HNG from Aksu, Xinjiang (Aksu gas) consists primarily of CH4, CO2, helium, and other hydrocarbons. The total mole fraction of other hydrocarbons in Aksu gas is less than 1 mol%. The Aksu gas is simplified to a ternary gas system to confirm the HBGS is not negatively affected by the acidic gas components (CO2). The composition of the simplified natural gas (HNG4) is CH4 95.6 mol%, CO2 4.0 mol%, and helium 0.4 mol%.

3.1. Single Gas System

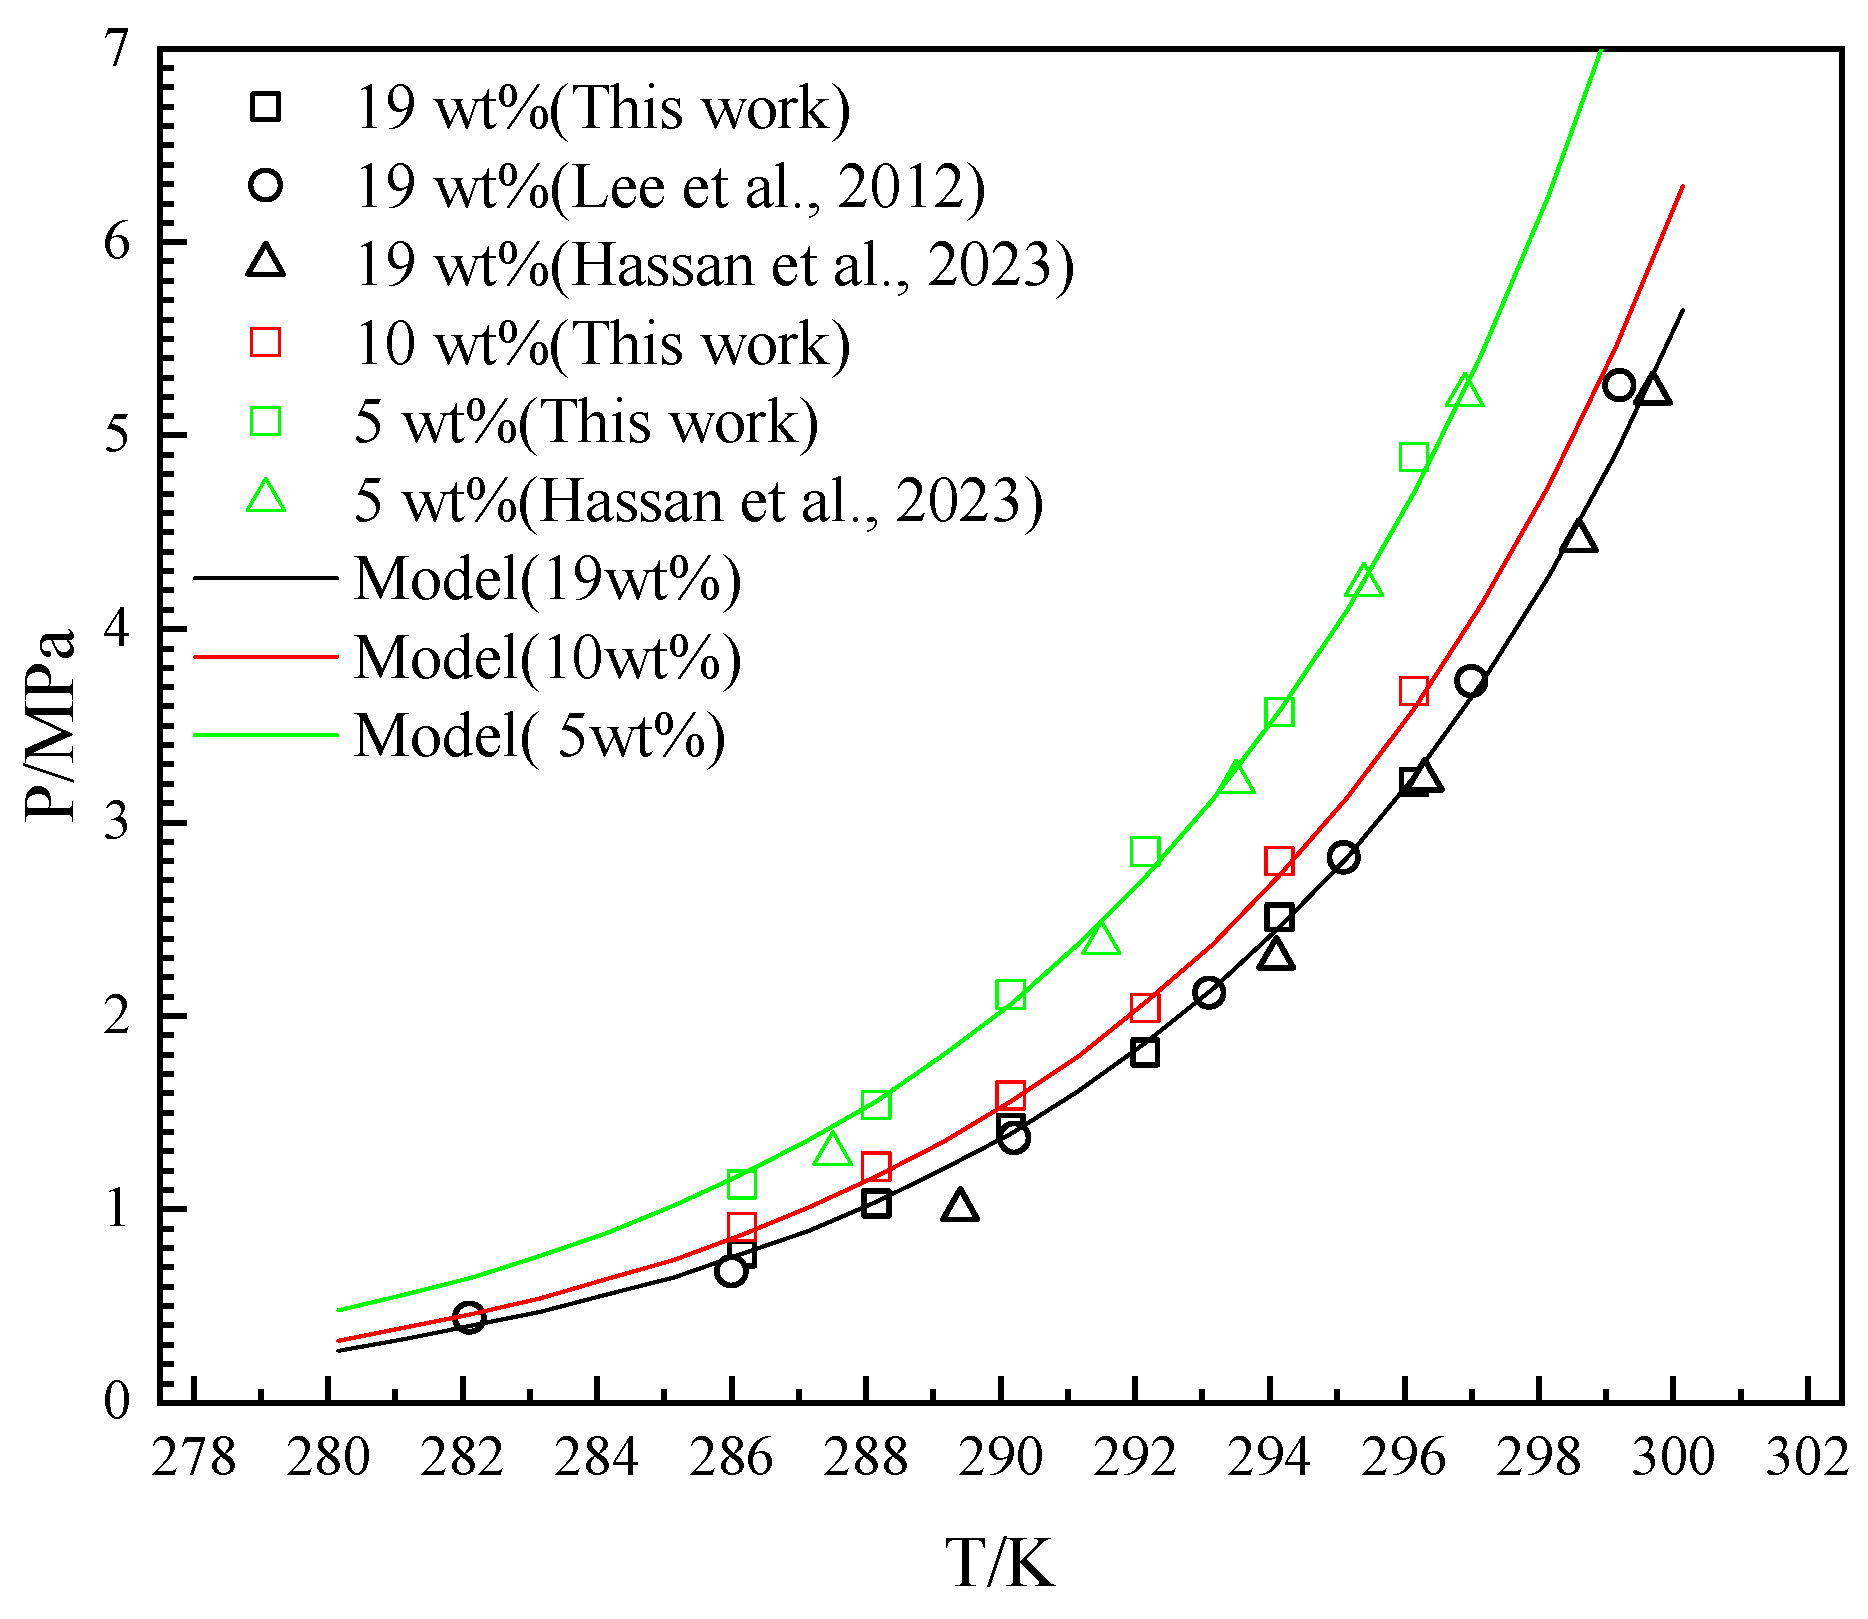
The accuracy of the experimental methods and devices used in this work was quantitatively investigated through a comparison with literature data [21,35] and the Chen–Guo model of THF-CH4 hydrate [34]. The experimental results were measured over a temperature range of 286.15–296.15 K in the presence of 5 wt%, 10 wt%, and 19 wt% THF in the aqueous solution. The experimental and the predicted results are depicted in Figure 3.
As illustrated in Figure 3, the Peq increased with the increase in temperature from 282.1 K to 299.7 K in every gas–THF system. The Peq decreased with the increase in the initial concentration of THF in aqueous solutions. The difference between the Peq of 10 wt% and the Peq of 19 wt% is less than the difference between the Peq of 10 wt% and the Peq of 5 wt%. The difference between the Peq of different THF solutions increases in temperature. The model in this work describes the trend well, and the experimental results in this work are consistent with the literature data [21,35]. The ARD between the Chen–Guo model and the literature data [21,35] is 5.2%, while the ARD between the Chen–Guo model and the experimental result of this work is 2.6%. The GF between the Chen–Guo model and the literature data [21,35] is 0.997, while the GF between the Chen–Guo model and the experimental result of this work is 0.998. The SD between the Chen–Guo model and the literature data [21,35] is 0.123, while the SD between the Chen–Guo model and the experimental result of this work is 0.070. The ARD and SD of the literature data [21,35] are higher than the experimental results of this work because the literature data are taken from different publications with different experimental apparatuses and different methods. It can be found that some data deviate (like 289.4 K and 1.00 MPa at 19 wt% THF and 299.2 K and 5.26 MPa at 19 wt% THF) significantly from other data, which is the other reason for the larger ARD and SD. It confirms the accuracy of the experimental apparatus and methods used in this work.

3.2. Binary Gas System

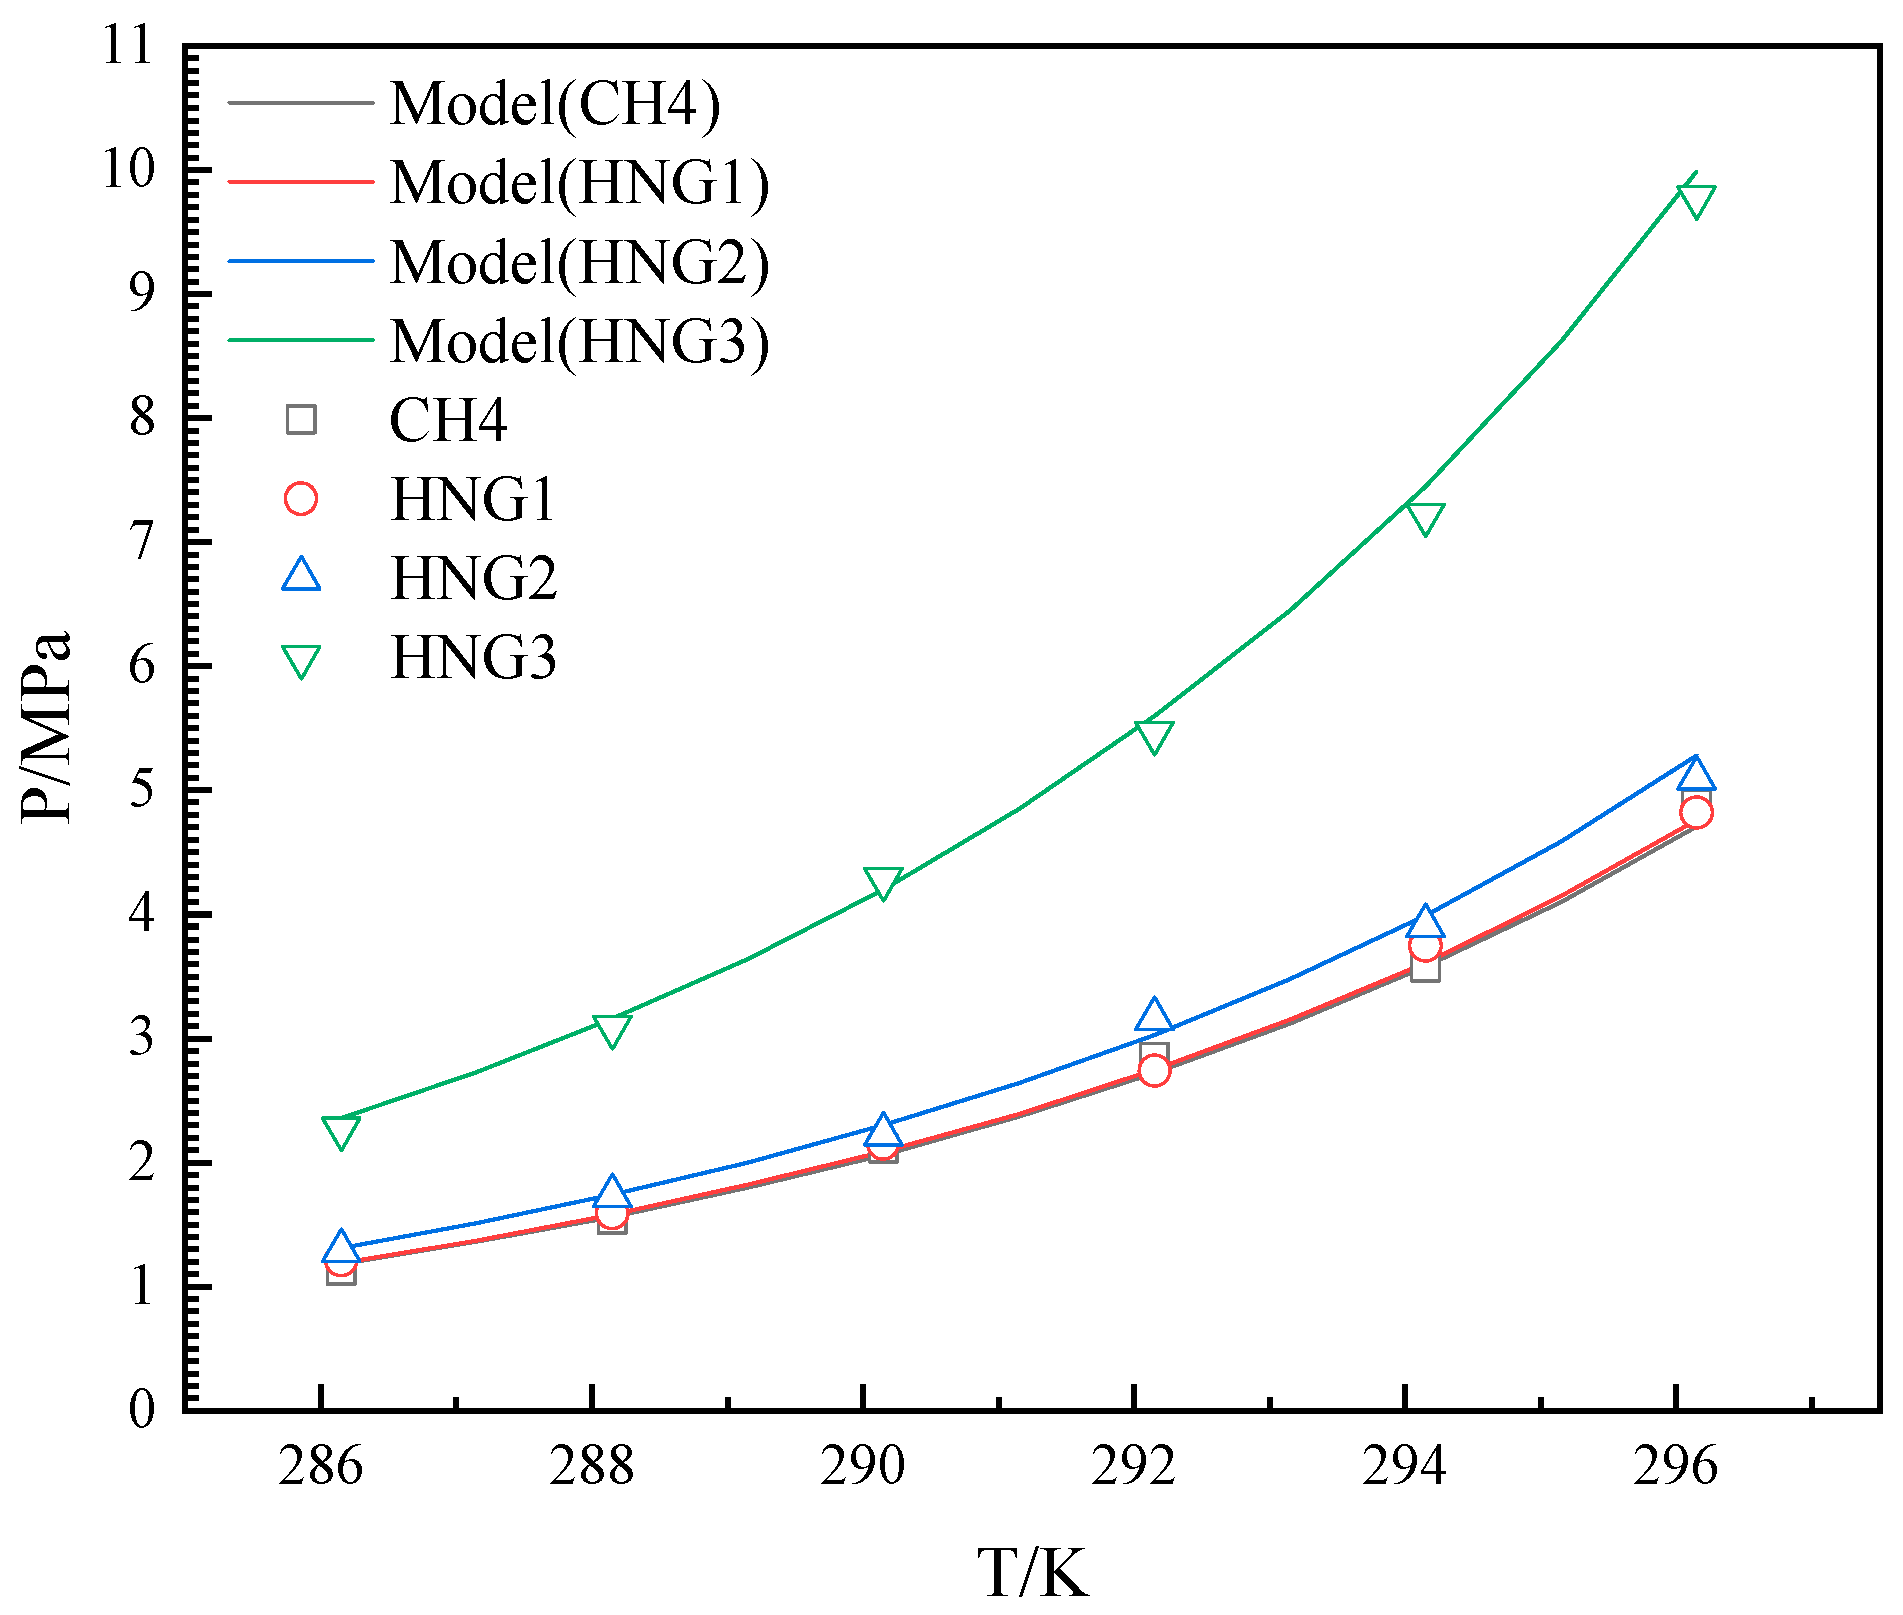
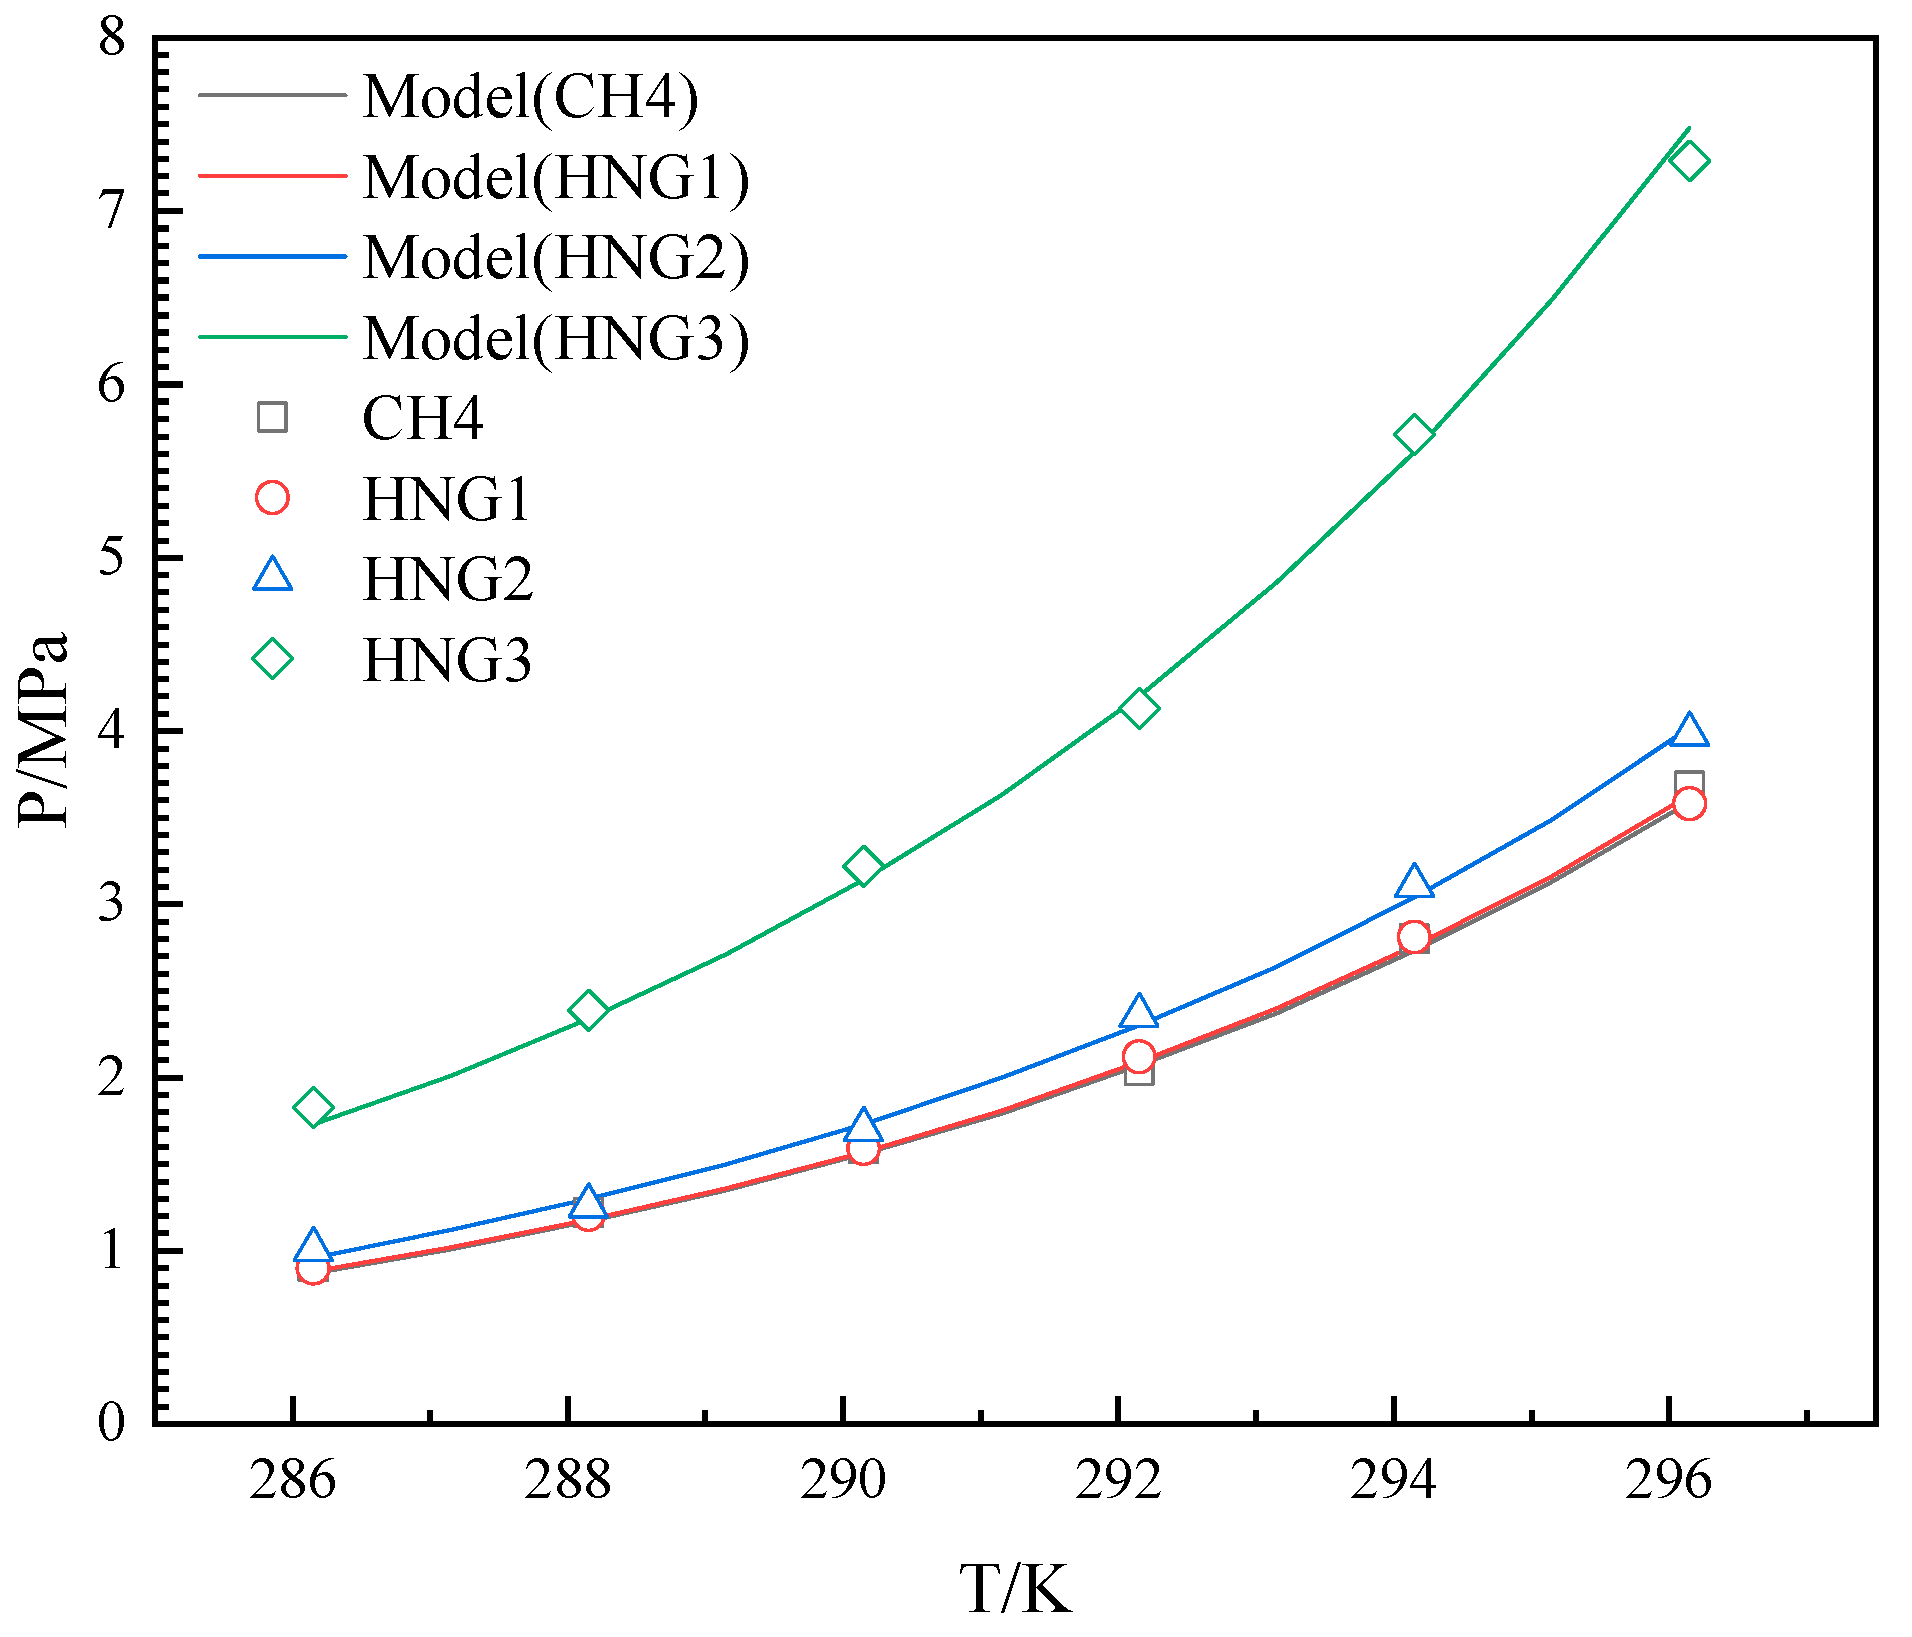
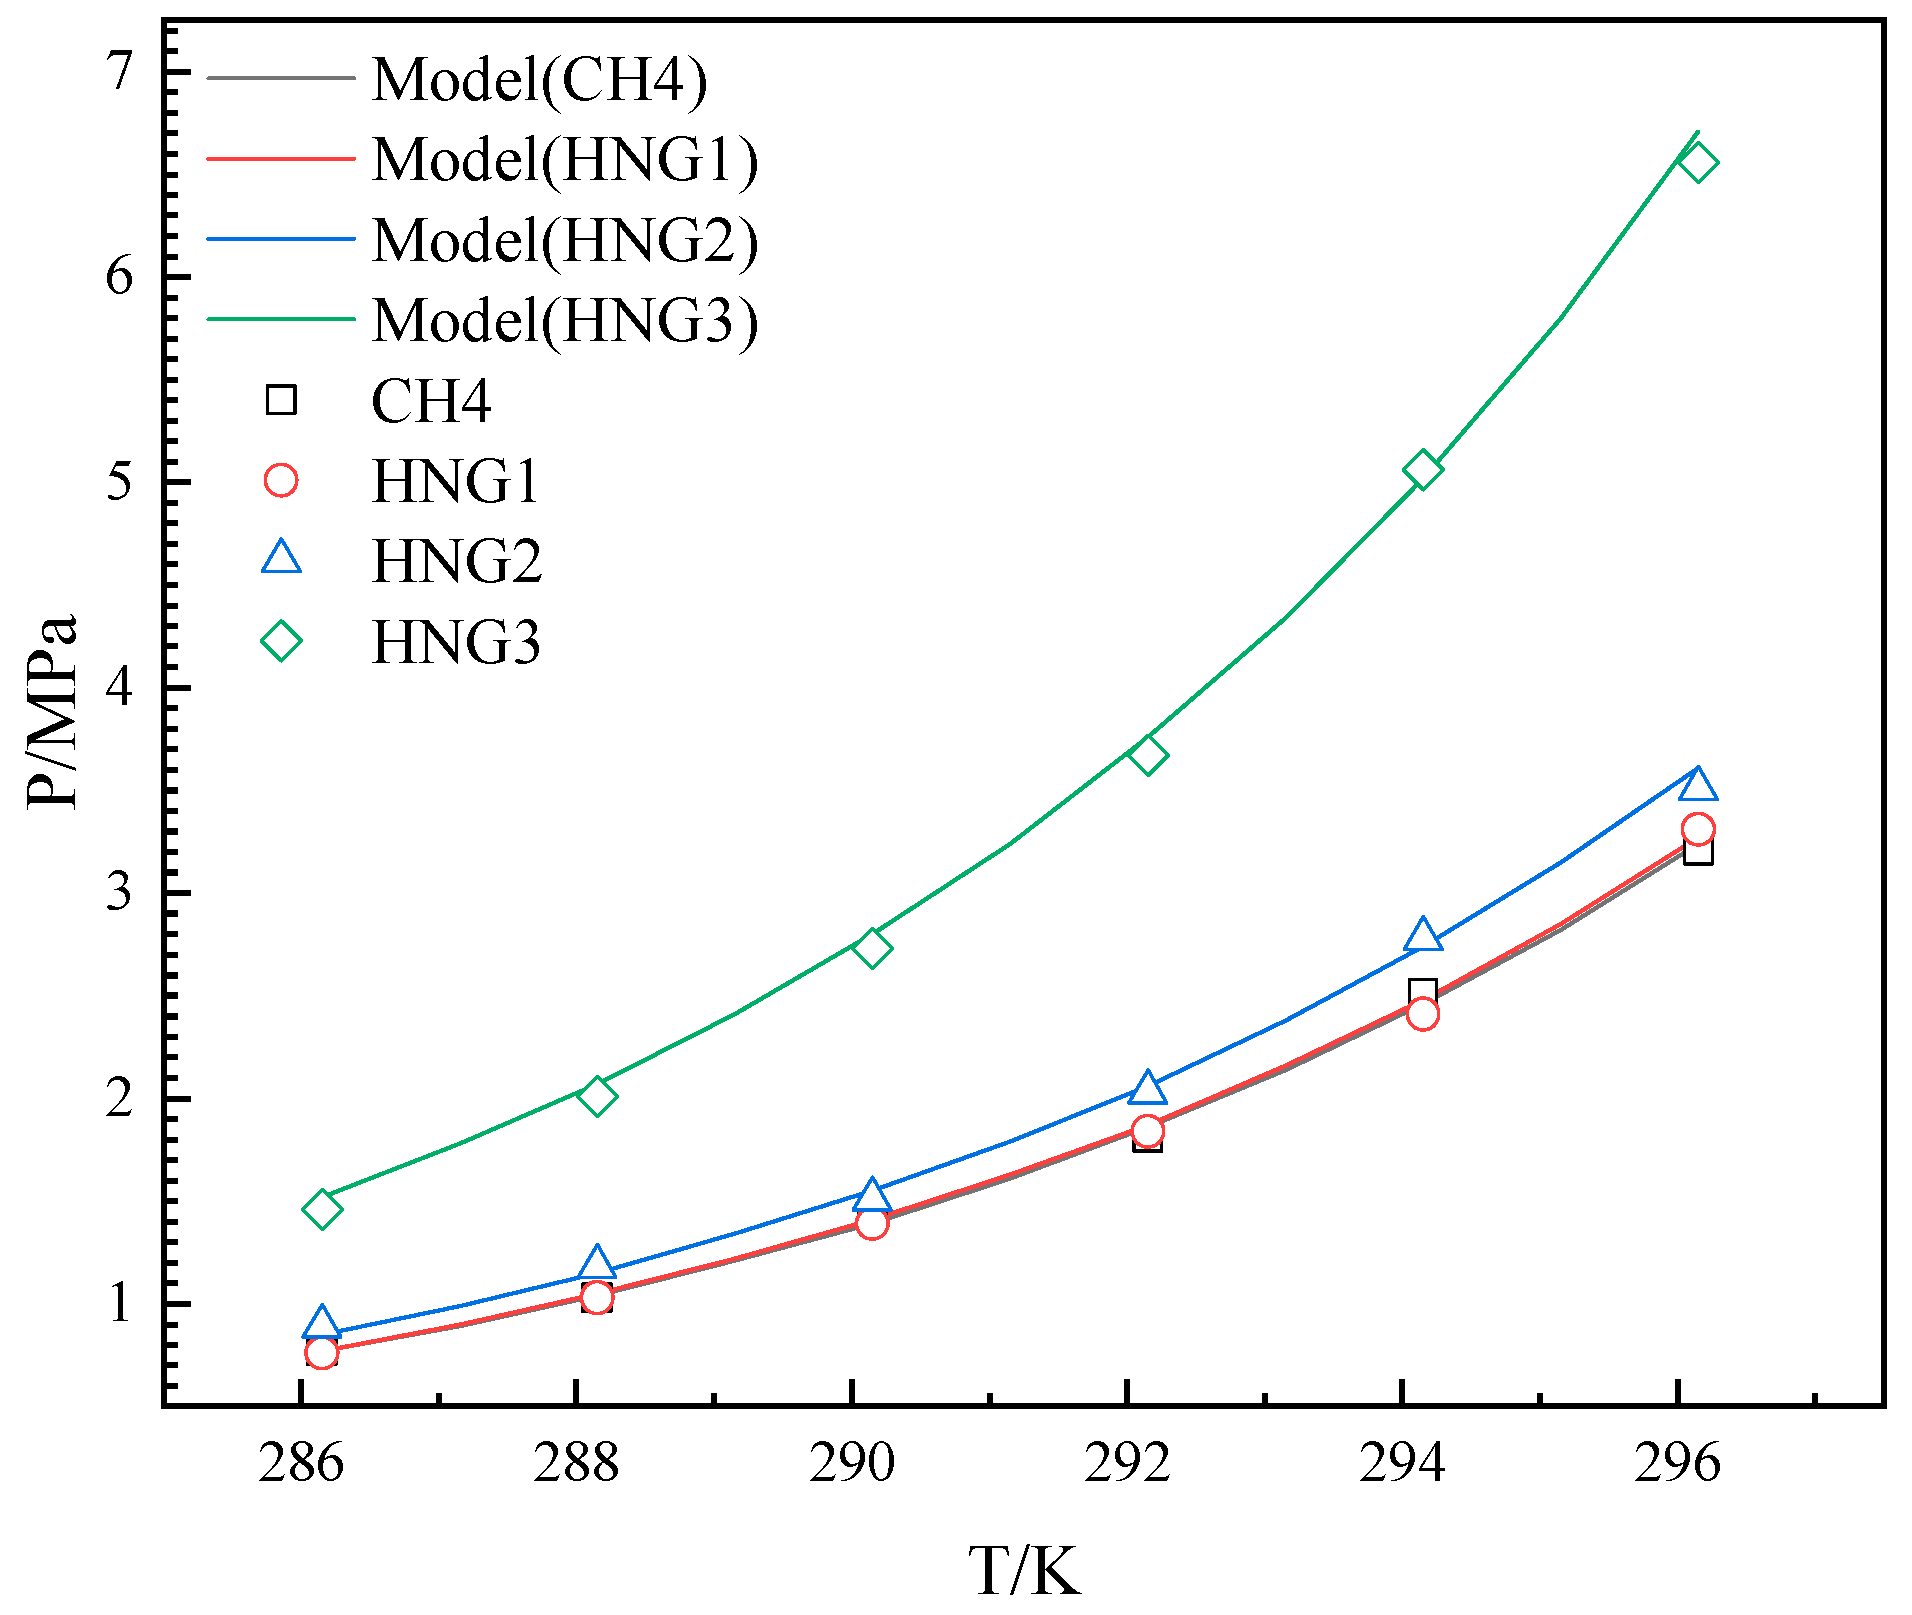
The experimental results were measured over a temperature range of 286.15 K–296.15 K for the HNGs-THF-water system. The experimental and predicted results for HNGs are depicted in Figure 4, Figure 5 and Figure 6. The experimental and predicted results for pure CH4 are also shown in Figure 4, Figure 5 and Figure 6, as contrasted with gas mixtures.
As illustrated in Figure 4, Figure 5 and Figure 6, the Peq increased with the increase in temperature from 286.15 K to 296.15 K in the presence of different THF concentrations. The Peq increased with the increase in the mole fraction of helium in the gas mixture (HNG1, HNG2, and HNG3) in each initial concentration of THF in aqueous solutions. The difference between the Peq of pure CH4 and HNG1 (99.0 mol% CH4) is less than 0.1 MPa in each initial concentration of THF in aqueous solutions. The HNG1 and pure CH4 have no significant difference in the Peq of pure CH4. The Peq is decreased with the increase in the initial concentration of THF in aqueous solutions with different mole fractions of helium in the gas mixture (HNG1, HNG2, and HNG3). The difference in Peq between 10 wt% and 19 wt% is less than the difference in Peq between 10 wt% and 5 wt%. The promoting effect of THF on Peq is nonlinear with the initial concentration of THF in aqueous THF solutions. The two effects of helium and THF are discussed in Section 4. The ARDs and GF between experimental and predicted Peq are listed in Table 2. All the ARDs for HNGs-THF-water systems are less than 3%, and the GFs for HNGs-THF-water systems are more than 0.998. The maximum value of SD is 0.151 for the HNG3-5 wt% THF system. This confirms that the accuracy of the model in this work meets the application of HBGS.

3.3. Ternary Gas System

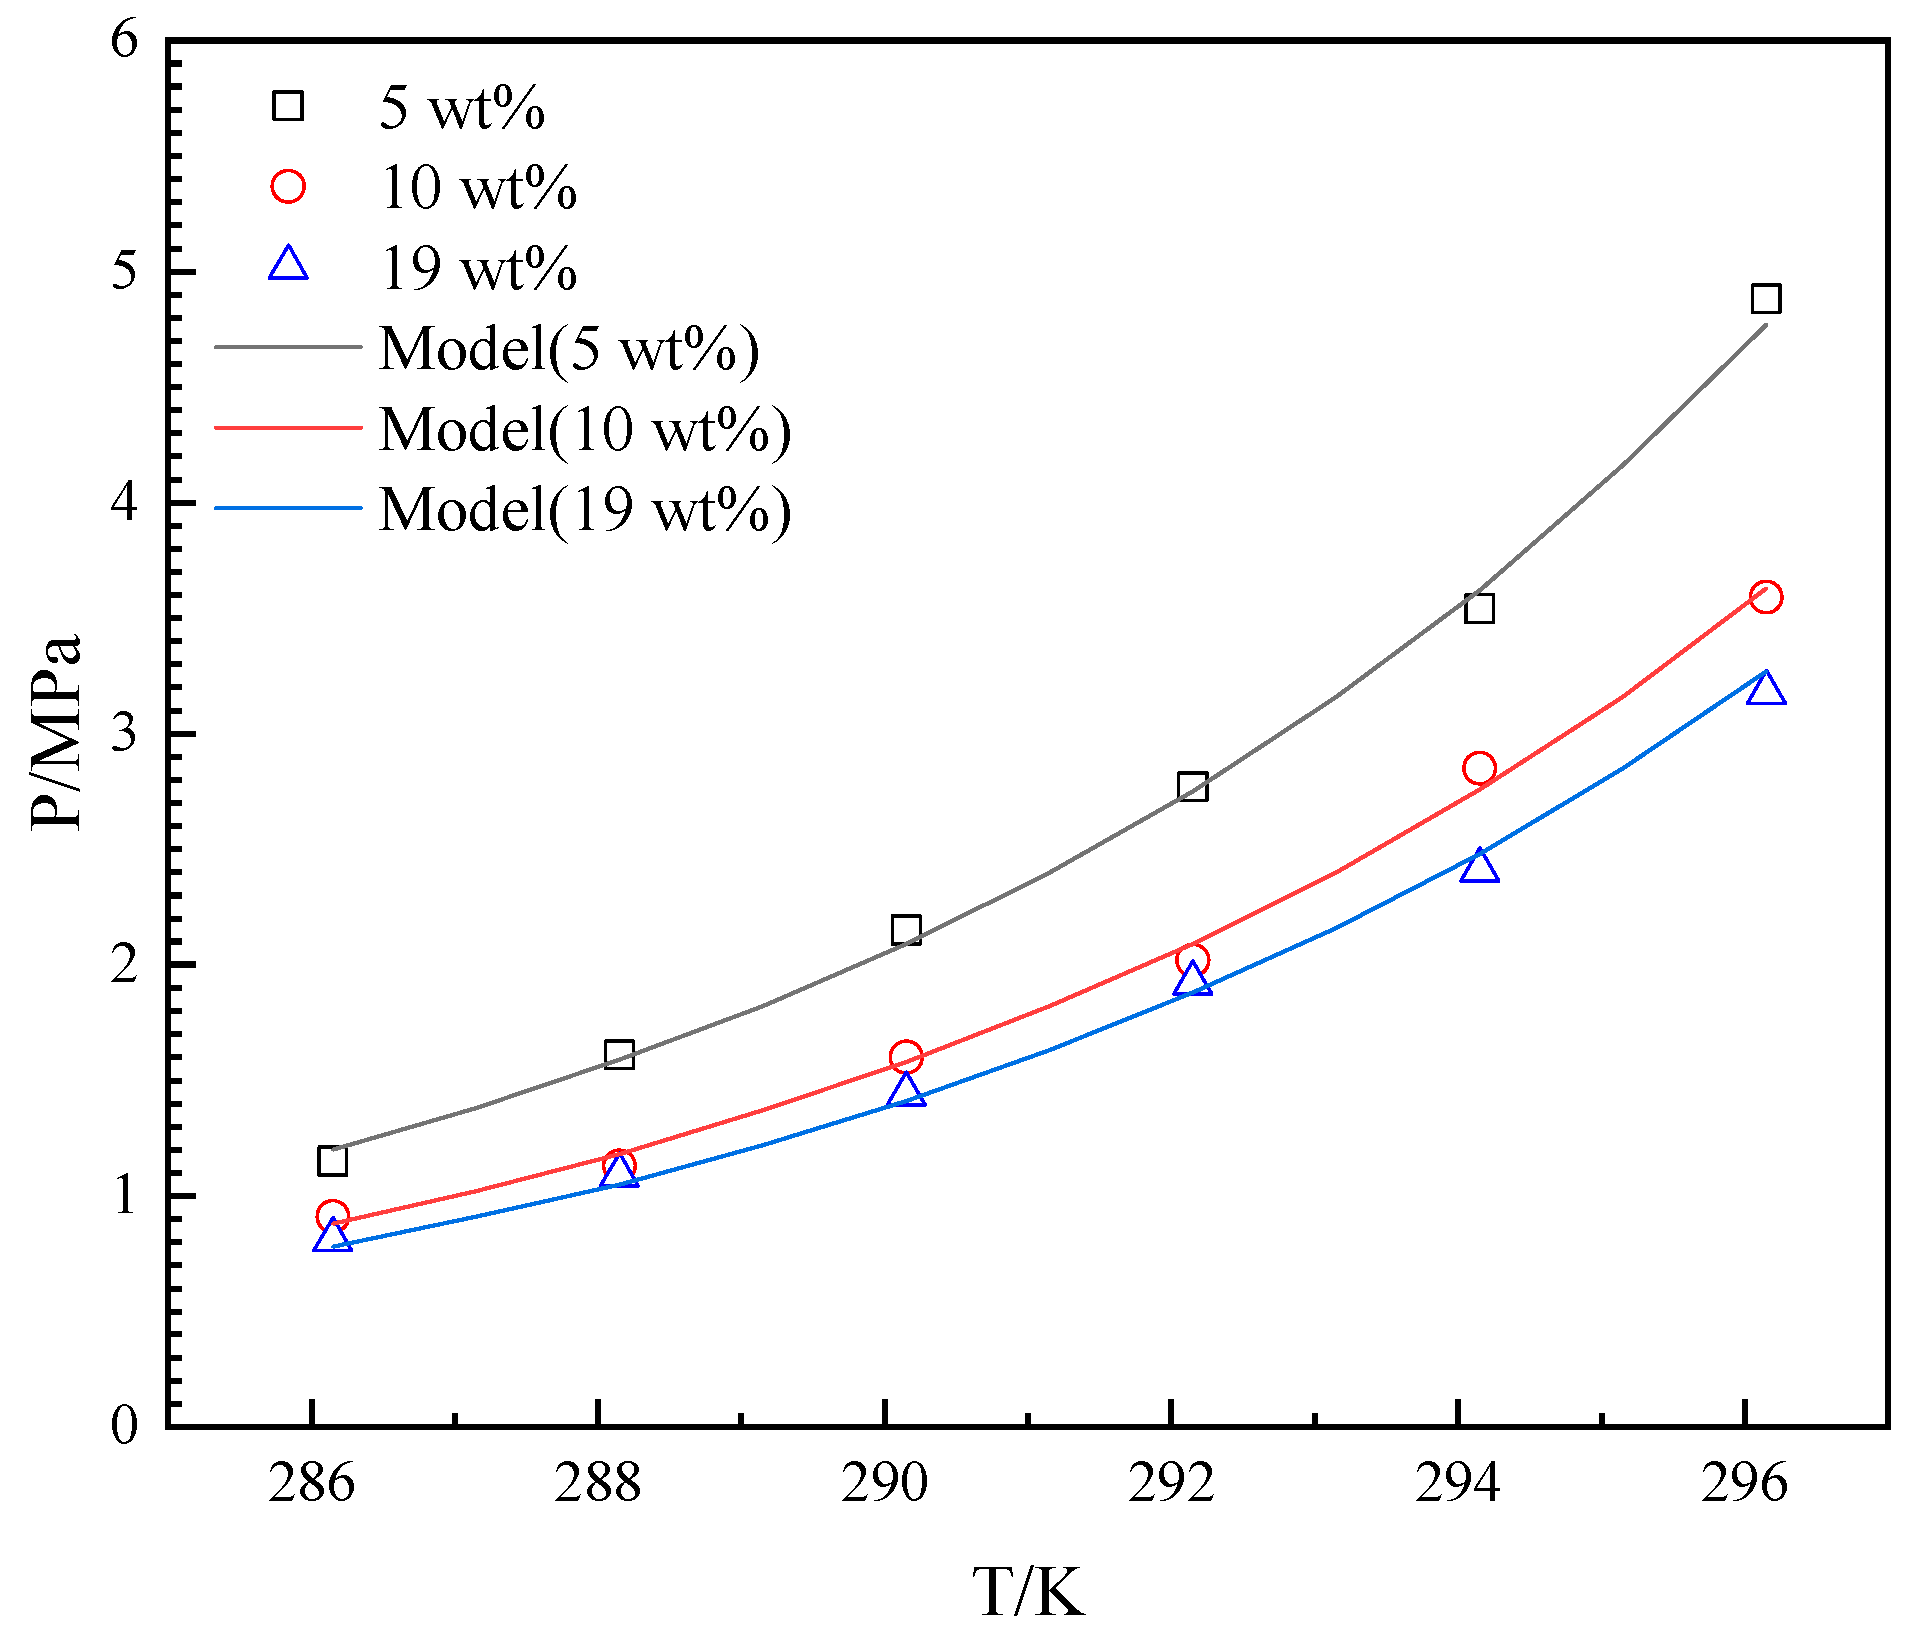
The experimental results were measured over a temperature range of 286.15 K–296.15 K for the HNG4-THF-water system. The experimental and predicted results for HNG4 are depicted in Figure 7.
As illustrated in Figure 7, the Peq increased with the increase in temperature from 286.15 K to 296.15 K in the presence of different THF concentrations. The Peq increased with the increase in the initial concentration of THF in the aqueous solution. The promoting effect of THF on Peq is nonlinear with the initial concentration of THF in aqueous solutions of THF, which has the same tendency with CH4-helium-THF-water systems. As listed in Table 2. All the ARDs for HNG4 systems are less than 3%, GFs for HNGs-THF-water systems are more than 0.998, and SDs for HNG4 systems are less than 0.065. This confirms that the accuracy of the model in this work meets the prediction of HBGS.

4. Discussion

4.1. The Effects of Helium

To quantify the effect of helium on Peq, the difference in Peq (∆P%) between the pure CH4 and HNGs (HNG1~HNG3) were proposed as follows:
P % = P H N G P C H 4 P C H 4 × 100 %
where P H N G and P C H 4 are the Peq for HNG and pure CH4 at the same temperature and in presence of the same initial concentration of THF. The results of P % in the 19 wt% THF for HNG1, HNG2, and HNG3 are shown in Figure 8.
As illustrated in Figure 8, the increase in Peq is positively correlated with the increase in mole fractions of helium in the HNGs. The difference in Peq between CH4 and HNG1 is not significant. The average of ∆P% for HNG1 is 2.0% for 5 wt% THF, −0.1% for 10 wt% THF, and −0.3% for 19 wt% THF. However, the mole fractions of helium in HNGs increase to 10 mol% (HNG2) from 1 mol% (HNG1), and the difference in Peq between CH4 and HNG1 increases to around 10%. The average of ∆P% for HNG2 is 9.5% (for 5 wt% THF), 9.3% for 10 wt% THF, and −11.5% for 19 wt% THF. When the mole fraction of helium in HNGs increases to 50 mol% (HNG2), the difference in Peq between CH4 and HNG1 increases to around 100% of Peq for CH4. The average of ∆P% for HNG2 is 99.7% for 5 wt% THF, 100.7% for 10 wt% THF, and 97.6% for 19 wt% THF. It can be inferred that helium almost does not participate in the formation of hydrate. As the mole fraction of helium in the gas phase increases from HNG1 to HNG3, helium dilutes the mole fraction of CH4 in the gas phase and reduces the fugacity of CH4, thus increasing the Peq of hydrate formation.

4.2. The Effects of THF

The experimental results for CH4 and HNGs with different initial THF concentration systems in 290.15 K are shown in Figure 9. To better obtain the tendency of the Peq with the different initial THF concentrations, the experimental results of Peq for CH4 with more initial concentrations of THF (7.5 wt% and 15 wt%) were supplied.
As illustrated in Figure 9, the promoting effect of THF on Peq is nonlinear with the concentration of THF in aqueous solutions. When the initial concentration of THF in aqueous solution is less than 15 wt%, the promoting effect of THF on Peq increases with an increase in the initial concentration of THF in aqueous solution. The 15 wt% and 19 wt% THF solutions have no significant difference in Peq of pure CH4. The data of Peq of binary gas systems (CH4 + helium) was used to correct the fugacity of THF in Equation (12) to match the effects on Peq. The introduction of Equation (12) represents no significant difference in the promotion effects of THF on Peq at high concentrations (15 wt%~19 wt%).

4.3. The Effects on Peq in the Model

According to the effects of helium and THF on Peq, the Chen–Guo model has been modified to adapt to the effects. Helium almost does not participate in the formation of hydrate. As the mole fraction of helium in the gas phase increases, helium dilutes the mole fraction of CH4 in the gas phase and reduces the fugacity of CH4, thus increasing the Peq of hydrate formation. Therefore, the Langmuir constant of helium ( C 3 ) in Equation (3) should be much smaller than that of CH4 ( C 1 ) at the same temperature. In the model of this work, the C 3 is the 1.5% of C 1 at 290.15 K calculated by Equation (3). The fugacity of THF is corrected by quadratic polynomial to express how the promoting effect varies with THF concentration in Equation (12). The expression can help further understand the effects of THF on Peq and can guide the control of THF concentrations in other THF-containing HBGS.

5. Materials and Methods

The experimental gases, HNGs, are the gas mixture of CH4–helium and CH4–CO2–helium. The mole ratio of CH4–helium (±0.05 mol%) in the binary gas mixture is 99.0/1.0 (HNG1), 90.0/10.0 (HNG2), and 50.0/50.0 (HNG3). The mole ratio of CH4–CO2–helium (±0.05 mol%) in the ternary gas mixture is 95.6/4.0/0.4 (HNG4). The HNGs were provided by Beijing Yongsheng Gas Industry Company (Beijing, China). THF (purity ≥ 99%) was provided by Shanghai Denou Chemical Company (Shanghai, China). The deionized water (18 × 106 Ω·cm) and THF were weighed by an electronic balance (±0.1 mg).
Figure 10 shows the experimental apparatus in this work, which is the same as that in our previous works [15,16]. The temperature range of the crystallizer is from 253.15 to 323.15 K, which is adjusted by air bath. The maximum pressure of the crystallizer is 20.00 MPa. The volume of the crystallizer was adjusted by using a manual pump with a maximum volume of 465.0 mL. The uncertainties of the measured pressure and measured temperature are ±0.005 MPa and ±0.05 K, respectively.
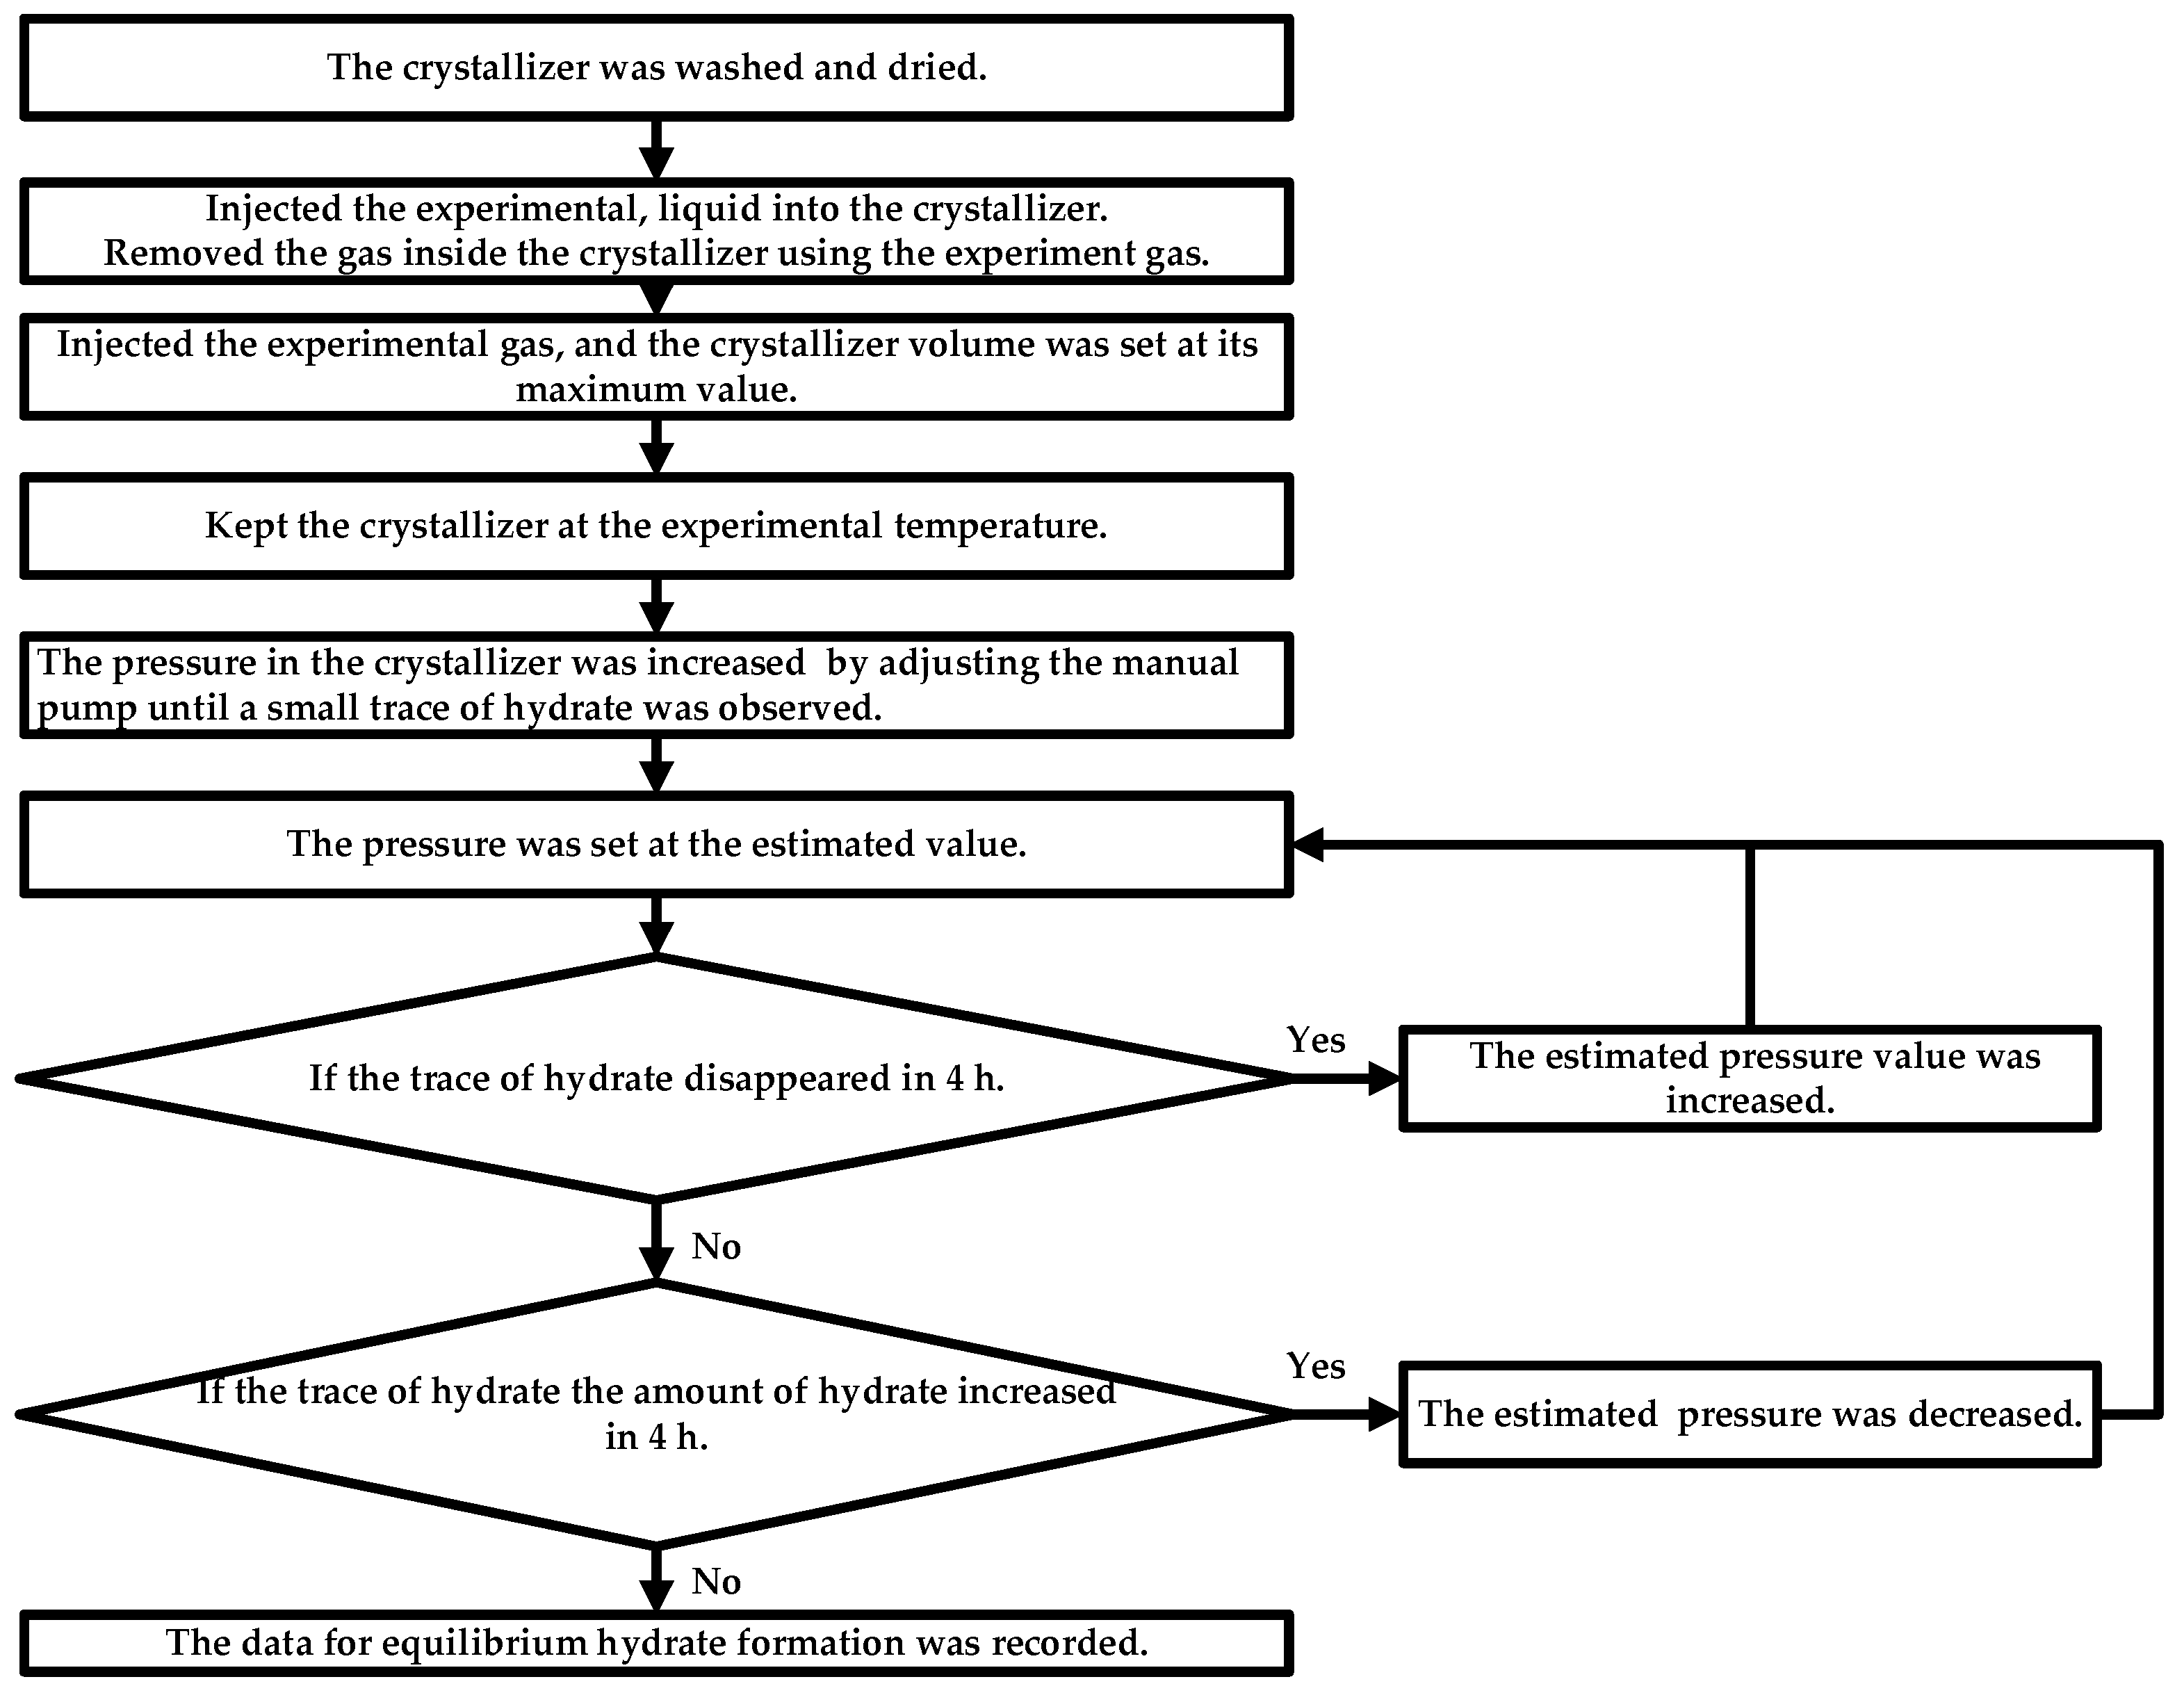
The pressure search method was used to measure the Peq [36]. The values of Peq were measured for different HNGs-liquid systems. The initial concentration of THF was set at 0, 10 wt%, and 19 wt%. The experimental procedure is the same as that in our previous works [15,16] shown in Figure 11. The amount of each feed in the experiment is controlled by volume. The volume of experimental liquid is 40.0 mL and the uncertainty in volume is ±0.05 mL. The volume of the experimental crystallizer is 465.0 mL (40.0 mL of experimental liquid and 425.0 mL of experimental gas in the crystallizer), the uncertainty in volume is ±0.05 mL. All the mole ratios of the gases (HNG1-4) are the same as in the cylinder. The uncertainty of the mole ratio is ±0.05 mol%, which is equal to the volume ratio ±0.05 vol% under standard condition (273.15 K and 101.325 kPa). The value of pressure adjustment is not a fixed value in each step. The value of pressure adjustment is fixed at 0.01 MPa, which is the uncertainty of the device measurement when traces of hydrate can be maintained for more than 2 h. The experimental uncertainty of measured Peq is ±0.005 MPa, the experimental uncertainty of the measured temperature is ±0.05 K.

6. Conclusions

This work explored the prediction of equilibrium hydrate formation conditions of HNGs-THF hydrate. A new thermodynamic model was proposed to predict the Peq of sII hydrate for CH4-helium-THF and applied in CH4-helium-CO2-THF hydrate. The effects of helium and THF on Peq were described in the proposed model. The model accurately can predict the Peq of CH4-helium-THF systems and CH4-helium-CO2-THF systems. The ARDs are less than 3% and GFs for HNGs-THF-water systems are more than 0.998.
The effect of helium on Peq is the dilution effect on CH4. Helium almost does not participate in the formation of hydrate. As the mole fraction of helium in the gas phase increases, helium dilutes the mole fraction of CH4 in the gas phase and reduces the fugacity of CH4, thus increasing the Peq of hydrate formation. A small Langmuir adsorption constant is used to represent the weak effect on Peq in the proposed model. The Langmuir adsorption of helium is 1.5% that of CH4 at 290.15 K
The effect of THF on Peq varies with the initial concentration of THF in the aqueous solution. There is no significant difference in the promotion effects of THF on Peq at high concentrations (15 wt%~19 wt%).
The new thermodynamic model and experimental data in this work can help to further understand the effects of helium and THF on Peq and can guide the prediction and control of HBGS of helium from HNGs. The other gas components of HNGs (like other hydrocarbons and nitrogen) play an important role in the hydrate formation process, which will be considered in our next work. This work showed the feasibility of HBGS, and the separation effect needs to be further experimented and studied in our next work.

Author Contributions

Conceptualization, Z.L.; data curation, Z.X., S.F., Q.S., Y.W. and X.G.; formal analysis, Z.L.; funding acquisition, Z.X., S.F. and Y.W.; investigation, G.Z., F.L. and Q.R.; methodology, Z.L.; project administration, Q.S., Y.W. and X.G.; resources, X.G.; supervision, Q.S., Y.W. and X.G.; validation, Q.S. and X.G.; writing—original draft, Z.L., G.Z., Z.X. and S.F.; writing—review and editing, Z.L. and Y.W. All authors have read and agreed to the published version of the manuscript.

Funding

This work was supported by Basic Research Funds for Universities of Xinjiang Uygur Autonomous Region (XJEDU2022P152), Natural Science Foundation of Xinjiang Uygur Autonomous Region (2023D01F43), Chinese National Natural Science Foundation (22478428, 22278424), Distinguished Youth Foundation of the Tianshan Program of Xinjiang Uygur Autonomous Region (2022TSYCJC0013), Science Foundation of China University of Petroleum, Beijing (2462023YJRC002), Xinjiang Uygur Region “One Case, One Policy” Strategic Talent Introduction Project (No. XQZX20240054), Xinjiang Tianshan Innovation Team (2022TSYCTD0002), and the Karamay District Science and Technology Project Soft Science Research Project (20232023kqrkx0006), which are greatly acknowledged.

Institutional Review Board Statement

Not applicable.

Informed Consent Statement

Not applicable.

Data Availability Statement

Data are contained within the article.

Conflicts of Interest

The authors declare no conflicts of interest.

Nomenclature

Abbreviation
ARDaverage relative deviation
EoSequation of state
GFgoodness of fit
HBGShydrate-based gas separation
HNGhelium-rich natural gas
NGnatural gas
PTPatel–Teja
sIstructure I
sIIstructure II
THFtetrahydrofuran
Symbols
A the Antoine parameters of f T H F H
A i the binary interaction parameter between gas i and THF in the hydrate
athe parameters of PT EoS
B the Antoine   parameters   of   f T H F H
bthe parameters of PT EoS
C the Antoine   parameters   of   f T H F H
C i the Langmuir constant of gas i
cthe parameters of PT EoS
Fthe constant associated with the gas molecule in the PT EoS
f c o r correction factor for f T H F
f i the fugacity of CH4, CO2, and helium
f T H F the fugacity of THF in the liquid phase
f T H F H the fugacity of THF in the basic hydrate
P H N G the Peq for HNG
P C H 4 the Peq for pure CH4
Peqthermodynamic equilibrium hydrate formation pressure
P % the difference in Peq
P 2 s a t saturated vapor pressure of THF
Rthe gas constant (8.314 J K−1 mol−1)
v 1 L the mole volumes of water
v 2 L the mole volumes of THF
x 1 the mole fractions of water
x 2 the mole fractions of THF
X the Antoine   parameters   of   C i
y i the mole fractions of gases in the gas phase
Y the Antoine   parameters   of   C i
Z the Antoine   parameters   of   C i
α T H F the activity of THF
α w the activity of water
βthe parameter of hydrate structure
γ 1 the activity coefficients of water
γ 2 the activity coefficients of THF
ζthe constant associated with the gas molecule in the PT EoS
θ i the occupation fraction of the linked cages in hydrates filled by gas i
Λ 12 the parameter of Wilson model
Λ 21 the parameter of Wilson model
λ 12 λ 11 the parameter of Wilson model
λ 21 λ 22 the parameter of Wilson model
λ 1 the ratio of the linked-cage number to the water-molecule number
  λ 2 the   ratio   of   the   basic - cage   number   to   the   water - molecule   number
Δµthe difference in chemical potential
w the mass fraction of THF

Appendix A. Calculation for the Fugacity of Gases

The PT EoS to calculate the fugacity of CH4, CO2, and helium. It is expressed as follows [31]:
P = R T v b a [ T ] v ( v + b ) + c ( v b )
a ( T ) = Ω a α ( T ) R 2 T c 2 P c
  b = Ω b R T c P c
c = Ω c R T c P c
Ω a = 3 3 ζ 2 + 3 1 2 ζ Ω b + Ω b 2 + 1 3 ζ
Ω b 3 + 2 3 ζ Ω b 2 + 3 3 ζ 2 Ω b ζ 3 = 0
Ω a = 1 3 ζ
α = 1 + F 1 T Γ 0.5 2
where ζ and F are the constants associated with the gas molecule in the PT EoS, and the values are listed in Table A1.
Table A1. Parameters of PT EOS.
GasesζF
CH40.3240.455336
CO20.3090.707727
helium0.3290.452413
THF0.3130.733317
The P 2 s a t is calculated by pressure–temperature flash using PT EoS. The procedure is shown in Figure A1.
Figure A1. The pressure–temperature flash procedure for calculating P 2 s a t . fG and fL are the fugacity of THF in gas and liquid phase in a pure THF system.
Molecules 29 04827 g0a1

References

  1. Zhang, P.; Gong, C.; Zhou, T.; Du, P.; Song, J.; Shi, M.; Wang, X.; Gu, X. Helium extraction from natural gas using DD3R zeolite membranes. Chin. J. Chem. Eng. 2022, 49, 122–129. [Google Scholar] [CrossRef]
  2. Wu, X.; Jia, P.; Jia, W.; Li, C. A new process for high-efficiency crude helium extraction and purification from natural gas. Gas Sci. Eng. 2024, 124, 205278. [Google Scholar] [CrossRef]
  3. Grenev, I.V.; Gavrilov, V.Y. High-throughput screening of Metal−Organic frameworks for helium recovery from natural gas. Microporous Mesoporous Mater. 2024, 368, 113021. [Google Scholar] [CrossRef]
  4. Al-Sobhi, S.A.; Alnouss, A.; Alsaba, W.; Elkamel, A. Sustainable design and analysis for helium extraction from sale gas in liquefied natural gas production. J. Nat. Gas Sci. Eng. 2022, 102, 104599. [Google Scholar] [CrossRef]
  5. Zhao, D.; Wang, X.; Liu, W.; Zhang, D.; Li, X. Main characteristics and effectiveness analysis of potential helium source rocks in crust-source helium-rich natural gas reservoirs. J. Nat. Gas Geosci. 2024, 9, 209–218. [Google Scholar] [CrossRef]
  6. Choi, S.; Sultan, M.M.B.; Alsuwailem, A.A.; Zuabi, S.M. Preparation and characterization of multilayer thin-film composite hollow fiber membranes for helium extraction from its mixtures. Sep. Purif. Technol. 2019, 222, 152–161. [Google Scholar] [CrossRef]
  7. Yu, L.; Mayne, B.; Nobandegani, M.S.; Grekou, T.; Hedlund, J. Recovery of helium from natural gas using MFI membranes. J. Membr. Sci. 2022, 644, 120113. [Google Scholar] [CrossRef]
  8. Weh, R.; Xiao, G.; Pouya, E.S.; May, E.F. Direct helium recovery from natural gas by dual reflux pressure swing adsorption cascade. Chem. Eng. J. 2022, 450, 137894. [Google Scholar] [CrossRef]
  9. Krishnan, K.; Potter, A.L.; Koh, C.A.; Carreon, M.A. Helium recovery from natural gas over CC3 membranes. J. Membr. Sci. Lett. 2023, 3, 100042. [Google Scholar] [CrossRef]
  10. Wang, Y.; Qian, Y.; Liu, Z.; Xu, T.; Sun, Q.; Liu, A.; Yang, L.; Gong, J.; Guo, X. The hydrate-based separation of hydrogen and ethylene from fluid catalytic cracking dry gas in presence of n-octyl-β-d-glucopyranoside. Int. J. Hydrogen Energy 2022, 47, 31350–31369. [Google Scholar] [CrossRef]
  11. Jiang, H.; Gao, P.; Li, H. Optimization of co-production process of cryogenic helium concentration and liquefied natural gas. Appl. Therm. Eng. 2023, 225, 120153. [Google Scholar] [CrossRef]
  12. Sun, Q.; Yuan, G.; Liu, Z.; Gao, J.; Wang, Y.; Guo, X.; Yang, L. Directional separation of hydrogen-containing gas mixture by hydrate-membrane coupling method. Int. J. Hydrogen Energy 2022, 47, 14580–14588. [Google Scholar] [CrossRef]
  13. Gao, J.; Xu, Z.; Wu, Y.; Luo, J.; Liu, Z.; Wang, Y.; Sun, Q.; Guo, X. Simulation and optimization of hydrogen separation from hydrogenation tail gas by hydrate-membrane coupled method. Int. J. Hydrogen Energy 2024, 64, 58–64. [Google Scholar] [CrossRef]
  14. Han, G.; Lee, W.; Kim, M.; Lee, J.W.; Ahn, Y. Hydrogen separation from hydrogen-compressed natural gas blends through successive hydrate formations. Chem. Eng. J. 2024, 483, 149409. [Google Scholar] [CrossRef]
  15. Liu, Z.; Zhang, S.; Liu, Y.; Sun, Q.; Xu, Z.; Liu, A.; Wang, Y.; Guo, X. Thermodynamic effects of the interaction of multiple solutes and dodecahedral-cage deformation on the semi-clathrate hydrate formation with CH4-CO2. Chem. Eng. Sci. 2023, 269, 118468. [Google Scholar] [CrossRef]
  16. Fu, Q.; Chen, M.; Pang, W.; Liu, Z.; Xu, Z.; Lei, X. The Phase Equilibria of Natural Gas Hydrate in the Presence of 1,3-Dimethylcyclohexane and Octyl-β-D-glucopyranoside. Molecules 2024, 29, 3604. [Google Scholar] [CrossRef]
  17. Pahlavanzadeh, H.; Nouri, S.; Aghajanloo, M.; Mohammadi, A.H.; Mohammadi, S. Experimental measurements and thermodynamic modeling of hydrate dissociation conditions for CO2 + THF + MgCl2 + water systems. Fluid Phase Equilib. 2023, 564, 113626. [Google Scholar] [CrossRef]
  18. Smith, C.; Barifcani, A.; Pack, D. Helium substitution of natural gas hydrocarbons in the analysis of their hydrate. J. Nat. Gas Sci. Eng. 2016, 35, 1293–1300. [Google Scholar] [CrossRef]
  19. Li, Z.; Han, T.; Lai, W.; Ma, J.; Zhang, Y.; Wu, Q.; Wang, C.; Liao, C.; Luo, S. Enhanced plasticization resistance of hollow fiber membranes for helium recovery from natural gas based on a novel thermally crosslinkable polyimide. J. Membr. Sci. 2023, 688, 122126. [Google Scholar] [CrossRef]
  20. Maekawa, T. Gas Hydrate Formation for Mixtures of Methane + Helium and Ethane + Helium. J. Chem. Eng. Data 2003, 48, 1283–1285. [Google Scholar] [CrossRef]
  21. Lee, Y.; Kawamura, T.; Yamamoto, Y.; Yoon, J. Phase Equilibrium Studies of Tetrahydrofuran (THF) + CH4, THF + CO2, CH4 + CO2, and THF + CO2 + CH4 Hydrates. J. Chem. Eng. Data 2012, 57, 3543–3548. [Google Scholar] [CrossRef]
  22. Wang, M.; Sun, Z.; Qiu, X.; Zhu, M.; Li, C.; Zhang, A.; Li, J.; Li, C.; Huang, H. Hydrate Dissociation Equilibrium Conditions for Carbon Dioxide + Tetrahydrofuran. J. Chem. Eng. Data 2017, 62, 812–815. [Google Scholar] [CrossRef]
  23. Kumar, A.; Yeo, C.S.H.; Kumar, S.; Linga, P. Calorimetric Assessment of Ternary Methane–Carbon Dioxide–Tetrahydrofuran (CH4–CO2–THF) Hydrates: Application in Storage and Transport of CO2 Lean Natural Gas. Energy Fuels 2021, 35, 13249–13255. [Google Scholar] [CrossRef]
  24. Papadimitriou, N.I.; Tsimpanogiannis, I.N.; Stubos, A.K.; Martin, A.; Rovetto, L.J.; Florusse, L.J.; Peters, C.J. Experimental and computational investigation of the sII binary He-THF hydrate. J. Phys. Chem. B 2011, 115, 1411–1415. [Google Scholar] [CrossRef] [PubMed]
  25. Wang, Y.; Wang, L.; Hu, Z.; Li, Y.; Sun, Q.; Liu, A.; Yang, L.; Gong, J.; Guo, X. The Thermodynamic and Kinetic Effects of Sodium Lignin Sulfonate on Ethylene Hydrate Formation. Energies 2021, 14, 3291. [Google Scholar] [CrossRef]
  26. Khurana, M.; Veluswamy, H.P.; Daraboina, N.; Linga, P. Thermodynamic and kinetic modelling of mixed CH4-THF hydrate for methane storage application. Chem. Eng. J. 2019, 370, 760–771. [Google Scholar] [CrossRef]
  27. Zheng, R.; Li, X.; Negahban, S. Phase boundary of gas hydrates in single and mixed electrolyte solutions: Using a novel unified equation of state. J. Mol. Liq. 2022, 345, 117825. [Google Scholar] [CrossRef]
  28. Zheng, R.; Wang, Z.; Li, X.; Fan, Z.; Negahban, S. Structural and dynamic analyses of CH4-C2H6-CO2 hydrates using thermodynamic modeling and molecular dynamic simulation. J. Chem. Thermodyn. 2022, 169, 106749. [Google Scholar] [CrossRef]
  29. Sun, Q.; Guo, X.; Chapman, W.G.; Liu, A.; Yang, L.; Zhang, J. Vapor–hydrate two-phase and vapor–liquid–hydrate three-phase equilibrium calculation of THF/CH4/N2 hydrates. Fluid Phase Equilib. 2015, 401, 70–76. [Google Scholar] [CrossRef]
  30. Chen, G.; Guo, T. Thermodynamic modeling of hydrate formation based on new concepts. Fluid Phase Equilib. 1996, 122, 43–65. [Google Scholar] [CrossRef]
  31. Chen, G.; Guo, T. A new approach to gas hydrate modelling. Chem. Eng. J. 1998, 71, 145–151. [Google Scholar] [CrossRef]
  32. Patel, N.C.; Teja, A.S. A new cubic equation of state for fluids and fluid mixtures. Chem. Eng. Sci. 1982, 37, 463–473. [Google Scholar] [CrossRef]
  33. Ivanov, E.V. To the issue of temperature-dependent behavior of standard molar volumes of components in the binary system (water + tetrahydrofuran) at ambient pressure. J. Chem. Thermodyn. 2014, 72, 37–43. [Google Scholar] [CrossRef]
  34. Sun, Q.; Zhao, J.; Gao, J.; Xu, Z.; Wang, Y.; Guo, X. Experimental and Modeling Study on Phase Equilibria of the Methane + Ethane Gas Mixture. J. Chem. Eng. Data 2023, 68, 2345–2352. [Google Scholar] [CrossRef]
  35. Hassan, H.; Romanos, J. Effects of Sea Salts on the Phase Behavior and Synthesis of Methane Hydrates + THF: An Experimental and Theoretical Study. Ind. Eng. Chem. Res. 2023, 62, 12305–12314. [Google Scholar] [CrossRef]
  36. Zheng, R.; Fan, Z.; Li, X.; Negahban, S. Phase behavior of high-pressure CH4-CO2 hydrates in NaCl solutions. Fuel 2020, 280, 118549. [Google Scholar] [CrossRef]
Figure 1. The schematic of differences in equilibrium hydrate formation. The bule background is the liquid phase, and the white background is the gas phase.
Molecules 29 04827 g001
Figure 2. Schematic diagram of the prediction of Peq.  y i is the mole fractions of gases in the gas phase and w is the mass fraction of THF.
Molecules 29 04827 g002
Figure 3. Equilibrium hydrate formation conditions with experimental, literature, and predicted data for CH4-THF-water system. (Lee et al., 2012) stands for [21] and (Hassan et al., 2023) stands for [35].
Molecules 29 04827 g003
Figure 4. Equilibrium hydrate formation conditions with experimental and predicted data for CH4 and HNG1-HNG3 in the presence of 5 wt% THF.
Molecules 29 04827 g004
Figure 5. Equilibrium hydrate formation conditions with experimental, literature, and predicted data for CH4 and HNG1-HNG3 in the presence of 10 wt% THF.
Molecules 29 04827 g005
Figure 6. Equilibrium hydrate formation conditions with experimental data, literature, and predicted data for CH4 and HNG1-HNG3 in the presence of 19 wt% THF.
Molecules 29 04827 g006
Figure 7. Equilibrium hydrate formation conditions with experimental data and predicted data for HNG4 in the presence of 5, 10, and 19 wt% THF.
Molecules 29 04827 g007
Figure 8. The differences in Peq between pure CH4 and HNG1–HNG3 in the presence of THF.
Molecules 29 04827 g008
Figure 9. The experimental results for CH4 and HNGs in the presence of different concentrations of THF.
Molecules 29 04827 g009
Figure 10. Schematic diagram of experimental apparatus for the measurements of the equilibrium hydrate formation conditions.
Molecules 29 04827 g010
Figure 11. The experimental procedure of investigating the Peq through the isothermal pressure search method.
Molecules 29 04827 g011
Table 1. The parameters of C i used for the model.
C i X (Pa) Y (K) Z (K)
C 1 ( C H 4 )6.2728 × 10−154879.2923.01
C 2 ( C O 2 ) 1.6464 × 10−112799.6615.90
C 3 ( h e l i u m ) 6.0000 × 10−122034.896.31
Table 2. The ARDs, GFs, and SDs for all the systems in this work.
GasesLiquidsARDGFSD
HNG15 wt% THF1.7%0.9990.068
HNG22.5%0.9980.101
HNG32.7%0.9990.151
HNG110 wt%THF1.8%0.9990.036
HNG22.6%0.9980.050
HNG32.7%0.9990.108
HNG119 wt% THF1.7%0.9990.037
HNG22.6%0.9990.053
HNG32.5%0.9990.086
HNG45 wt% THF2.3%0.9990.065
10 wt% THF2.8%0.9980.055
19 wt% THF2.9%0.9990.055
Disclaimer/Publisher’s Note: The statements, opinions and data contained in all publications are solely those of the individual author(s) and contributor(s) and not of MDPI and/or the editor(s). MDPI and/or the editor(s) disclaim responsibility for any injury to people or property resulting from any ideas, methods, instructions or products referred to in the content.