
Preparation of Progressive Driving Bilayer Polymer-Dispersed Liquid Crystals Possessing a PDLC-PVA-PDLC Structure


Abstract
1. Introduction
2. Results and Discussions
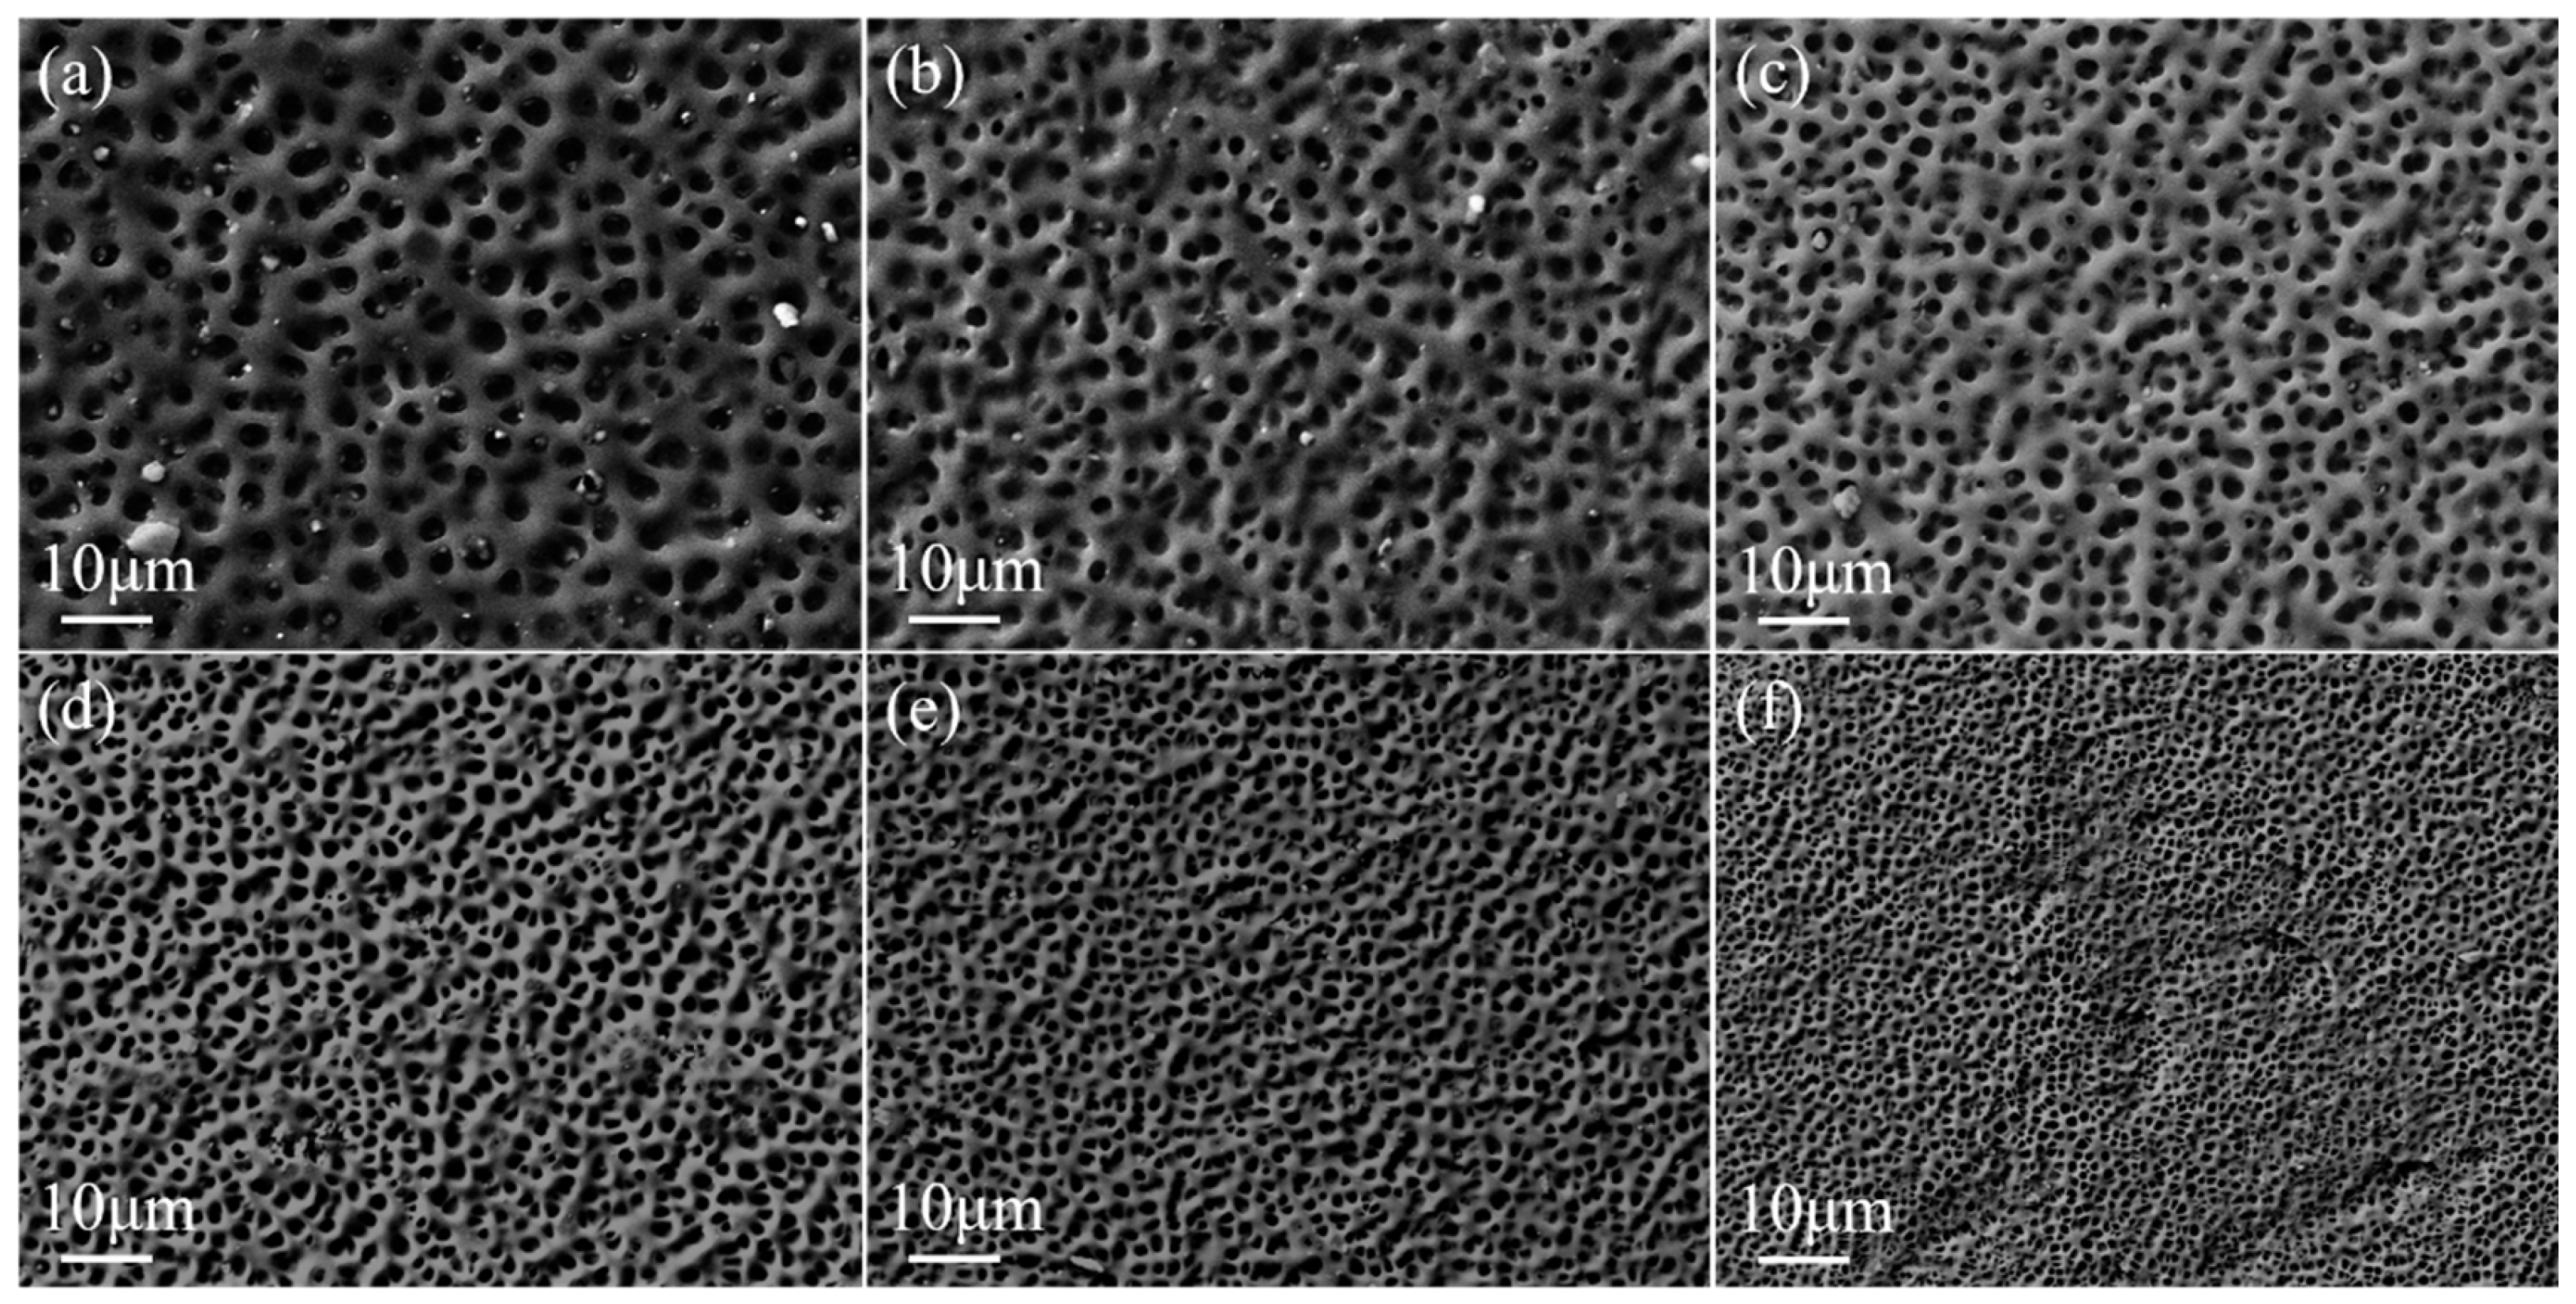
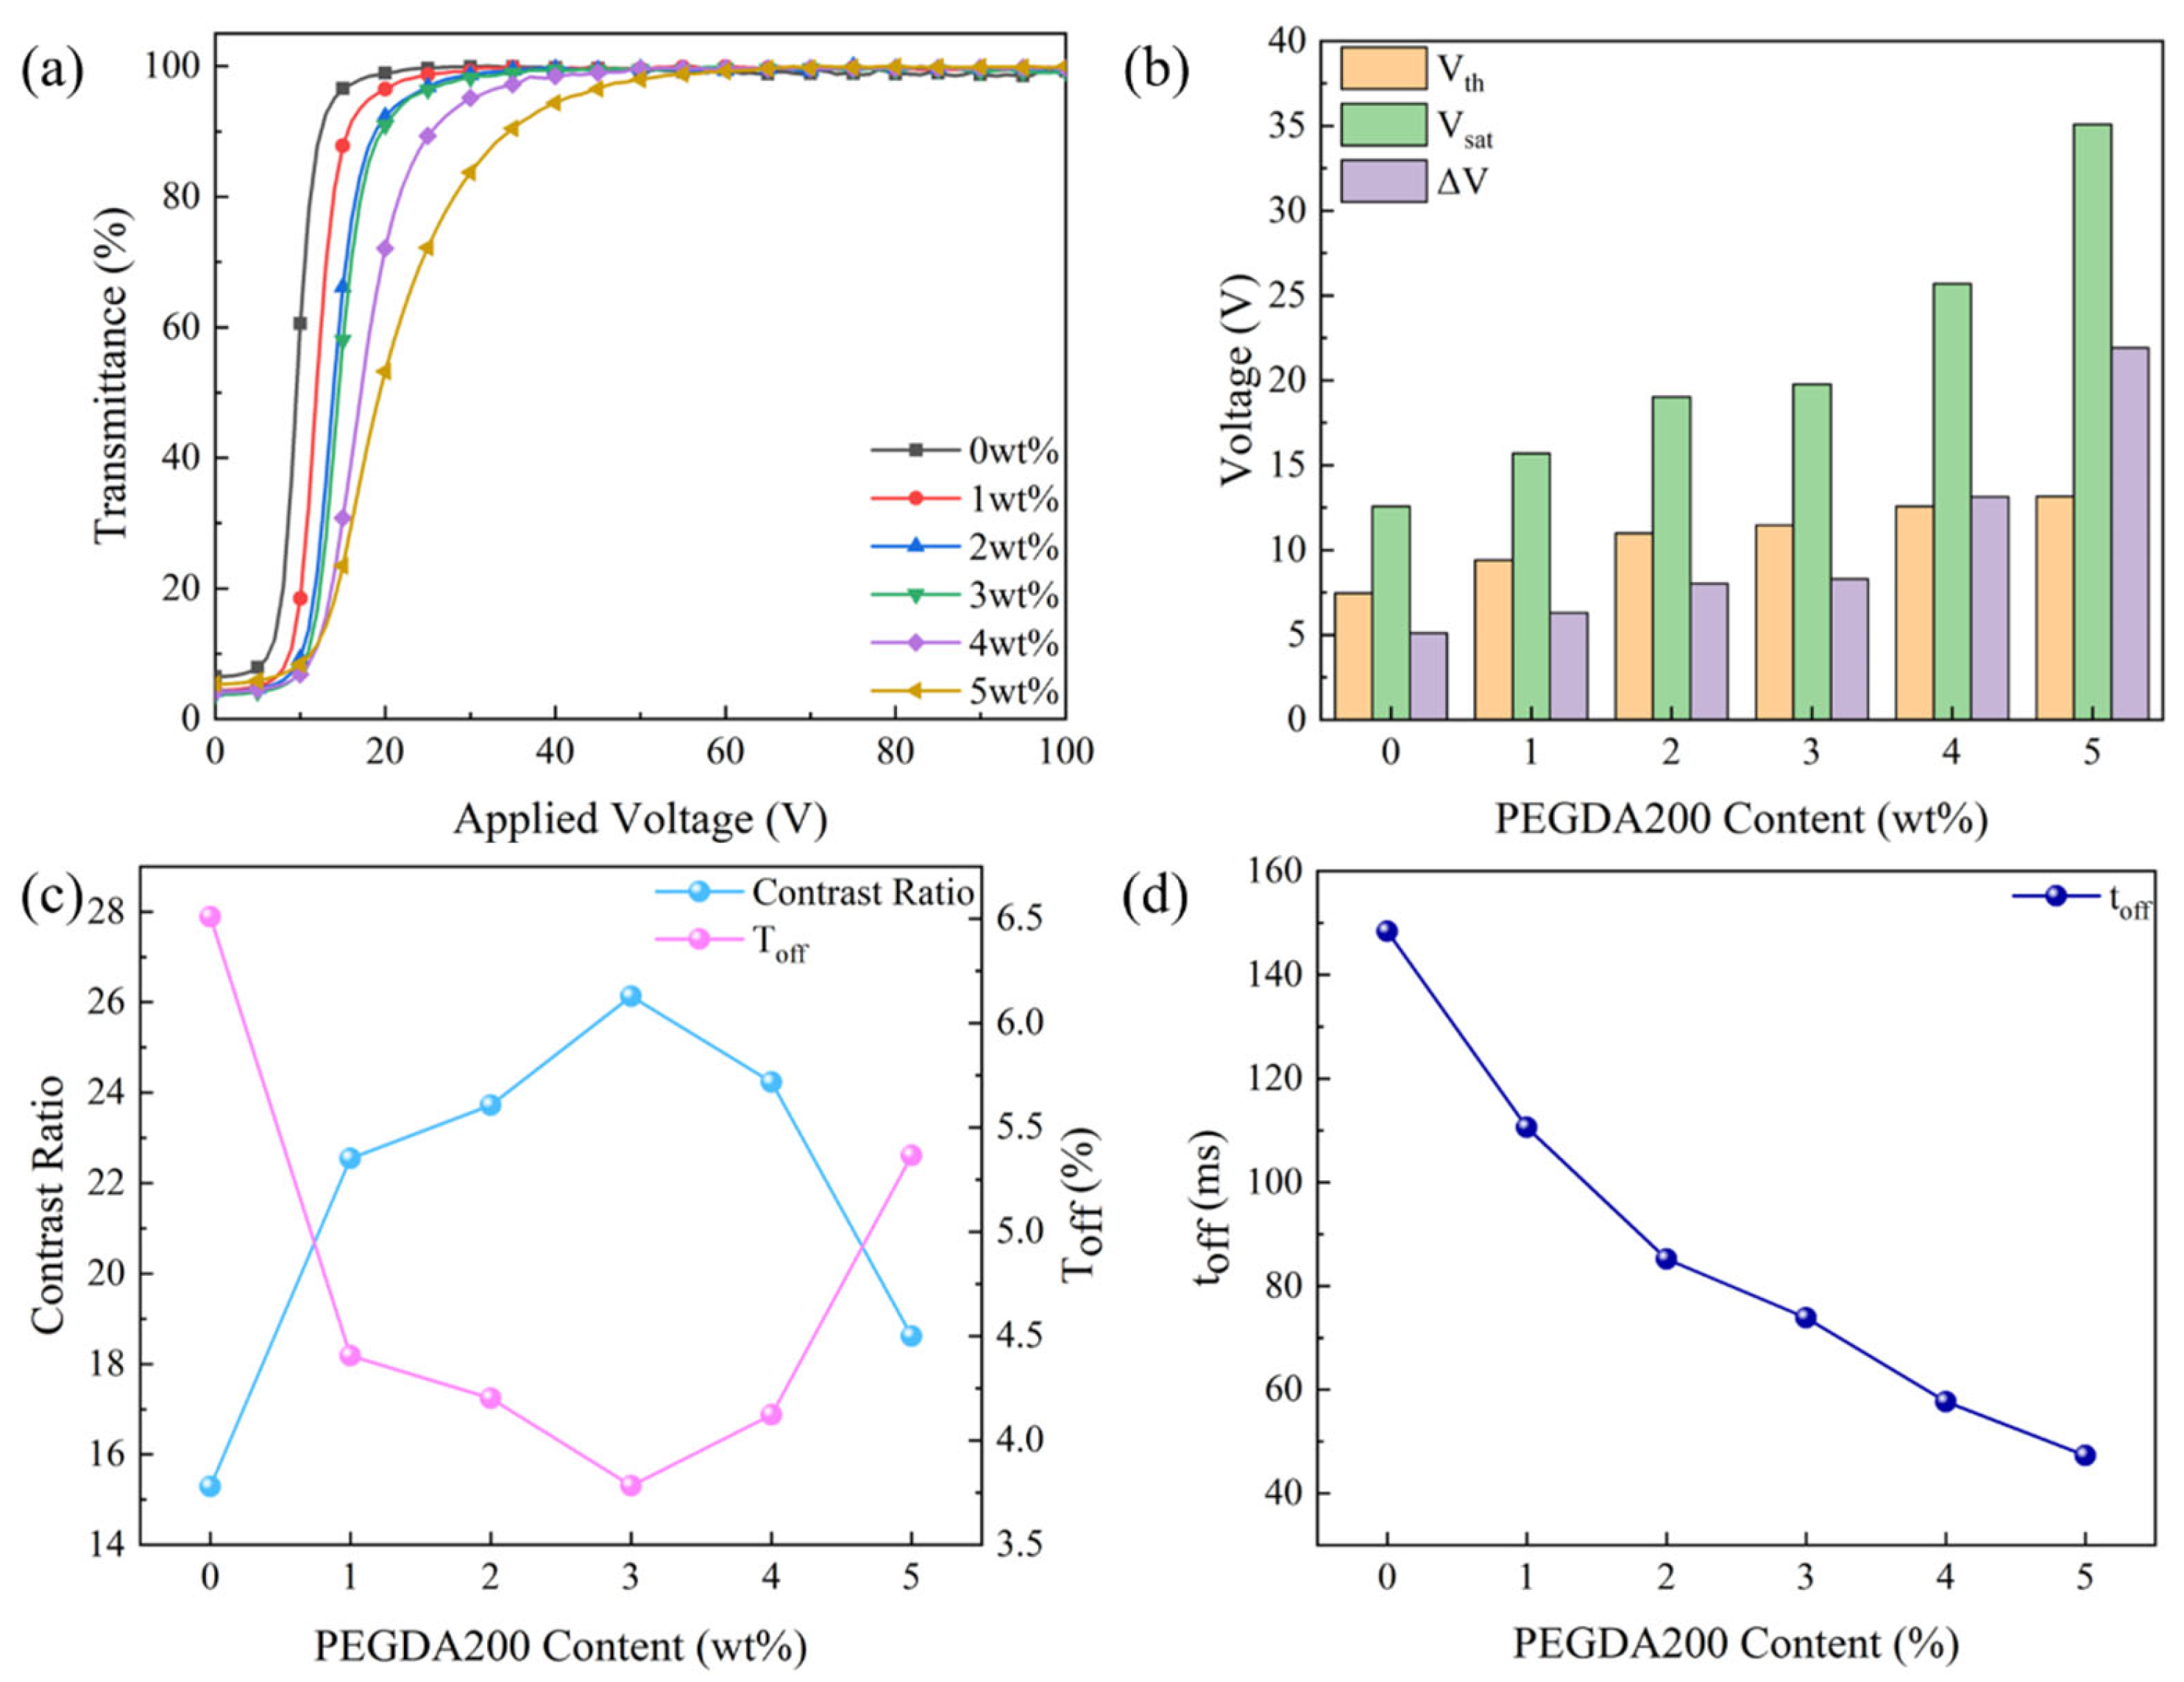
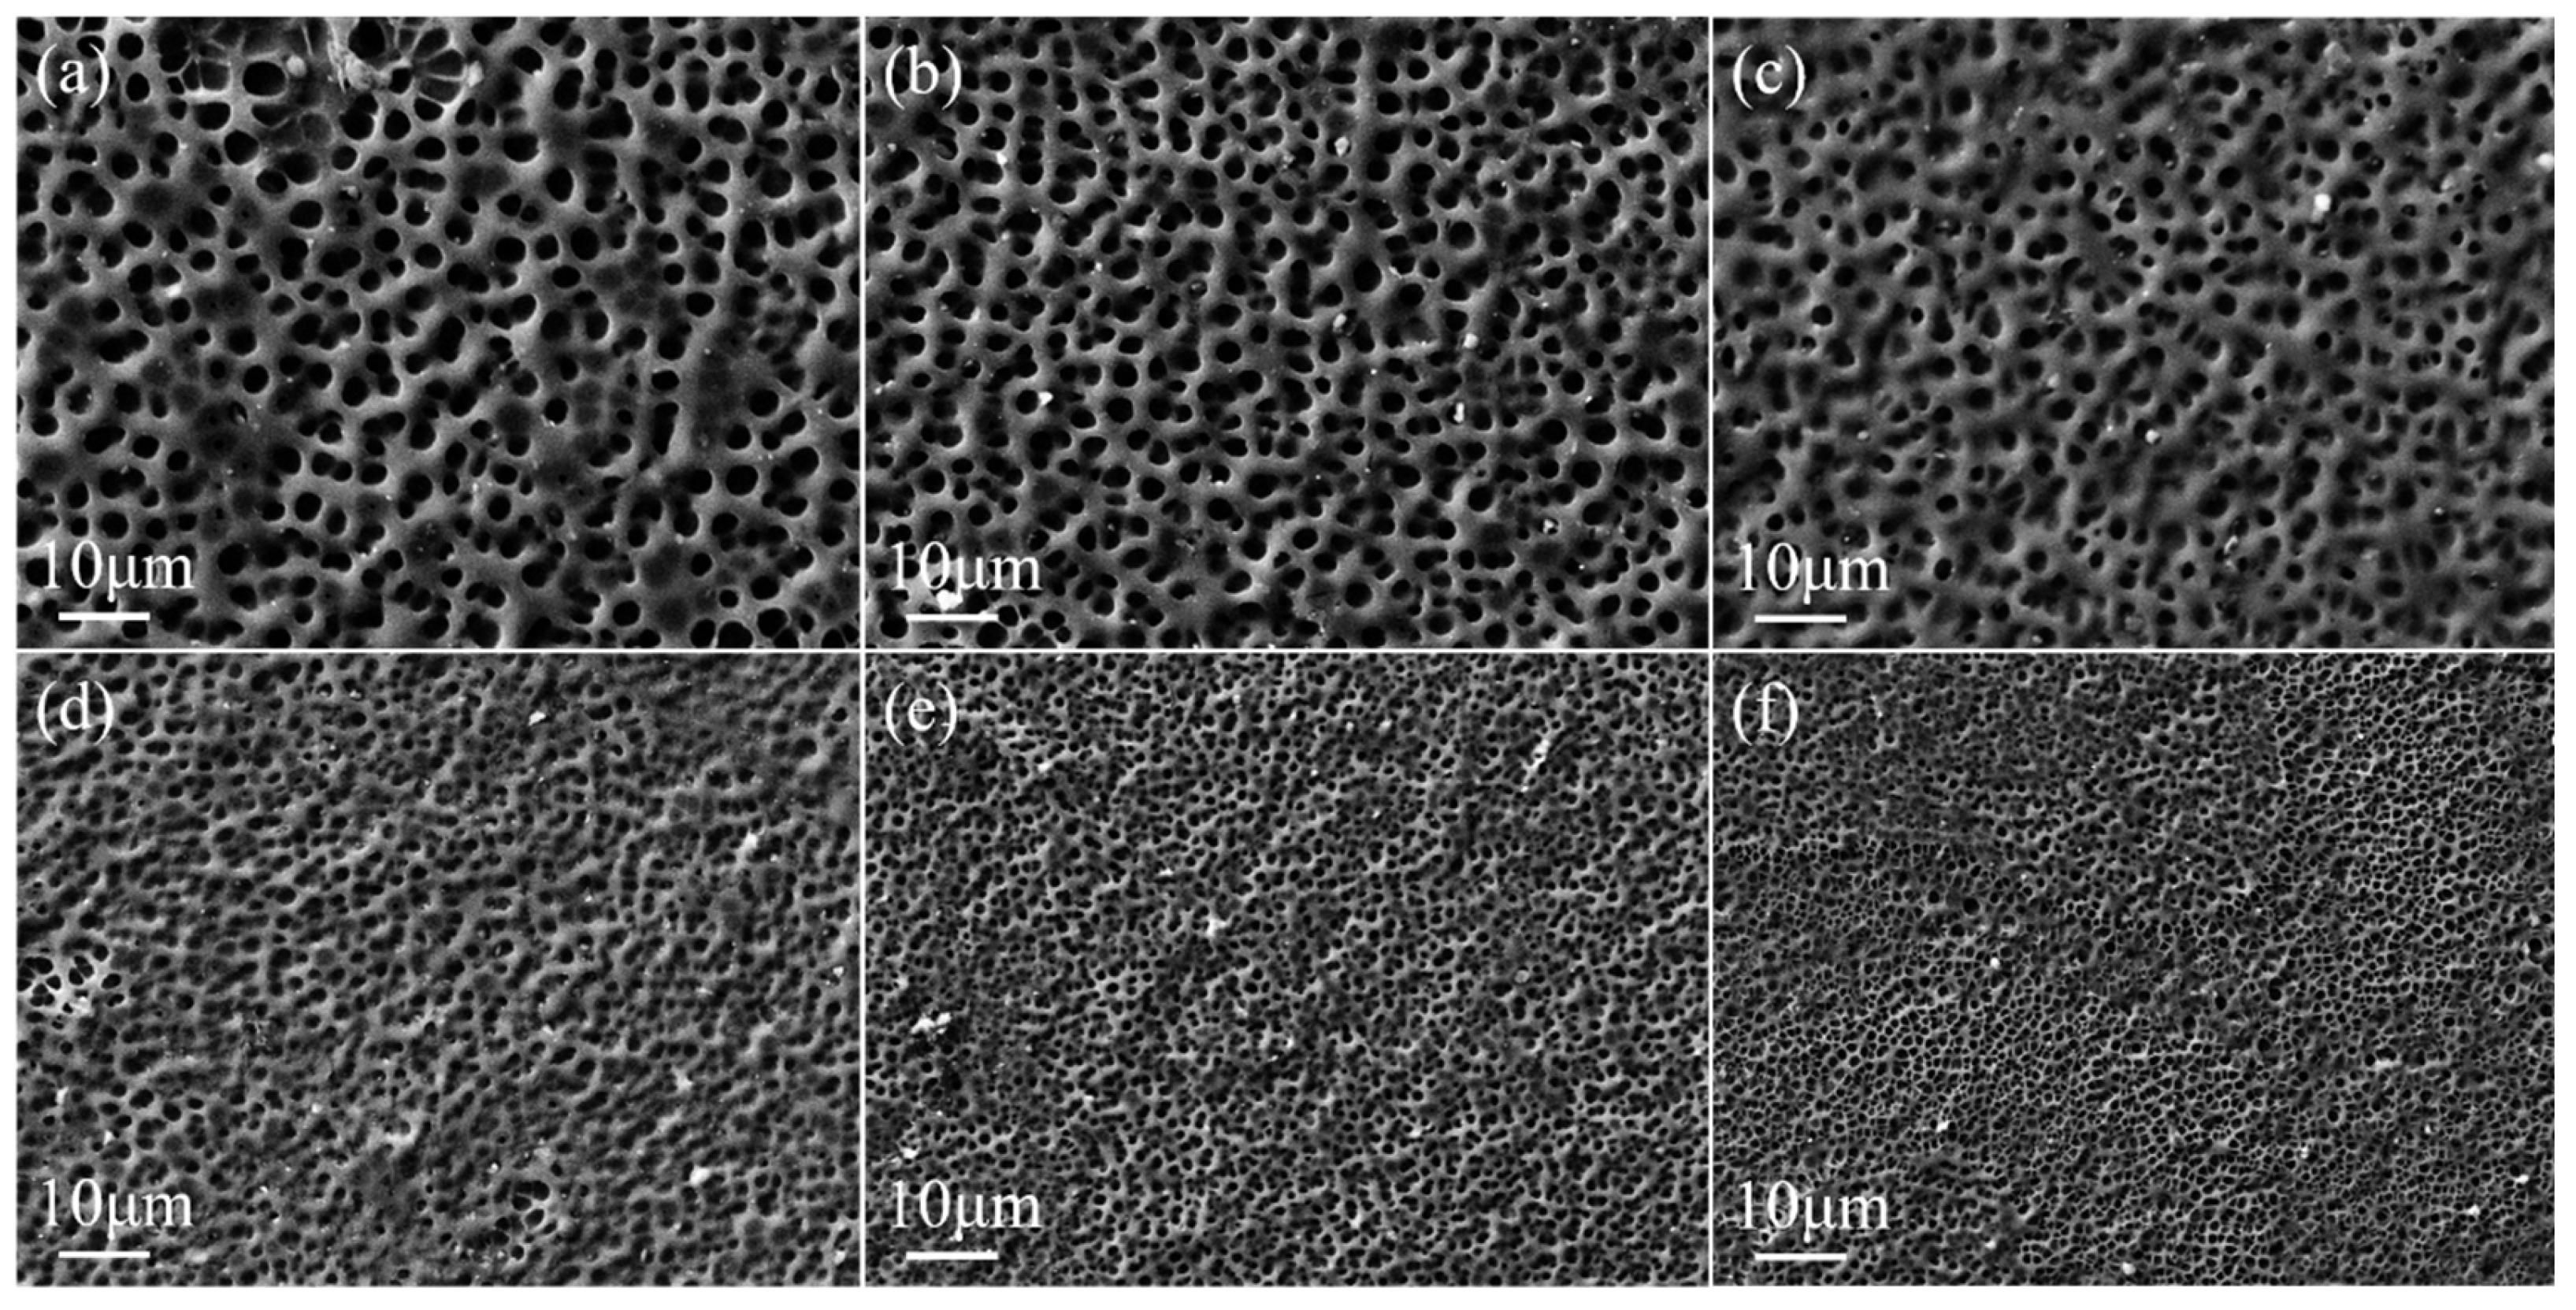
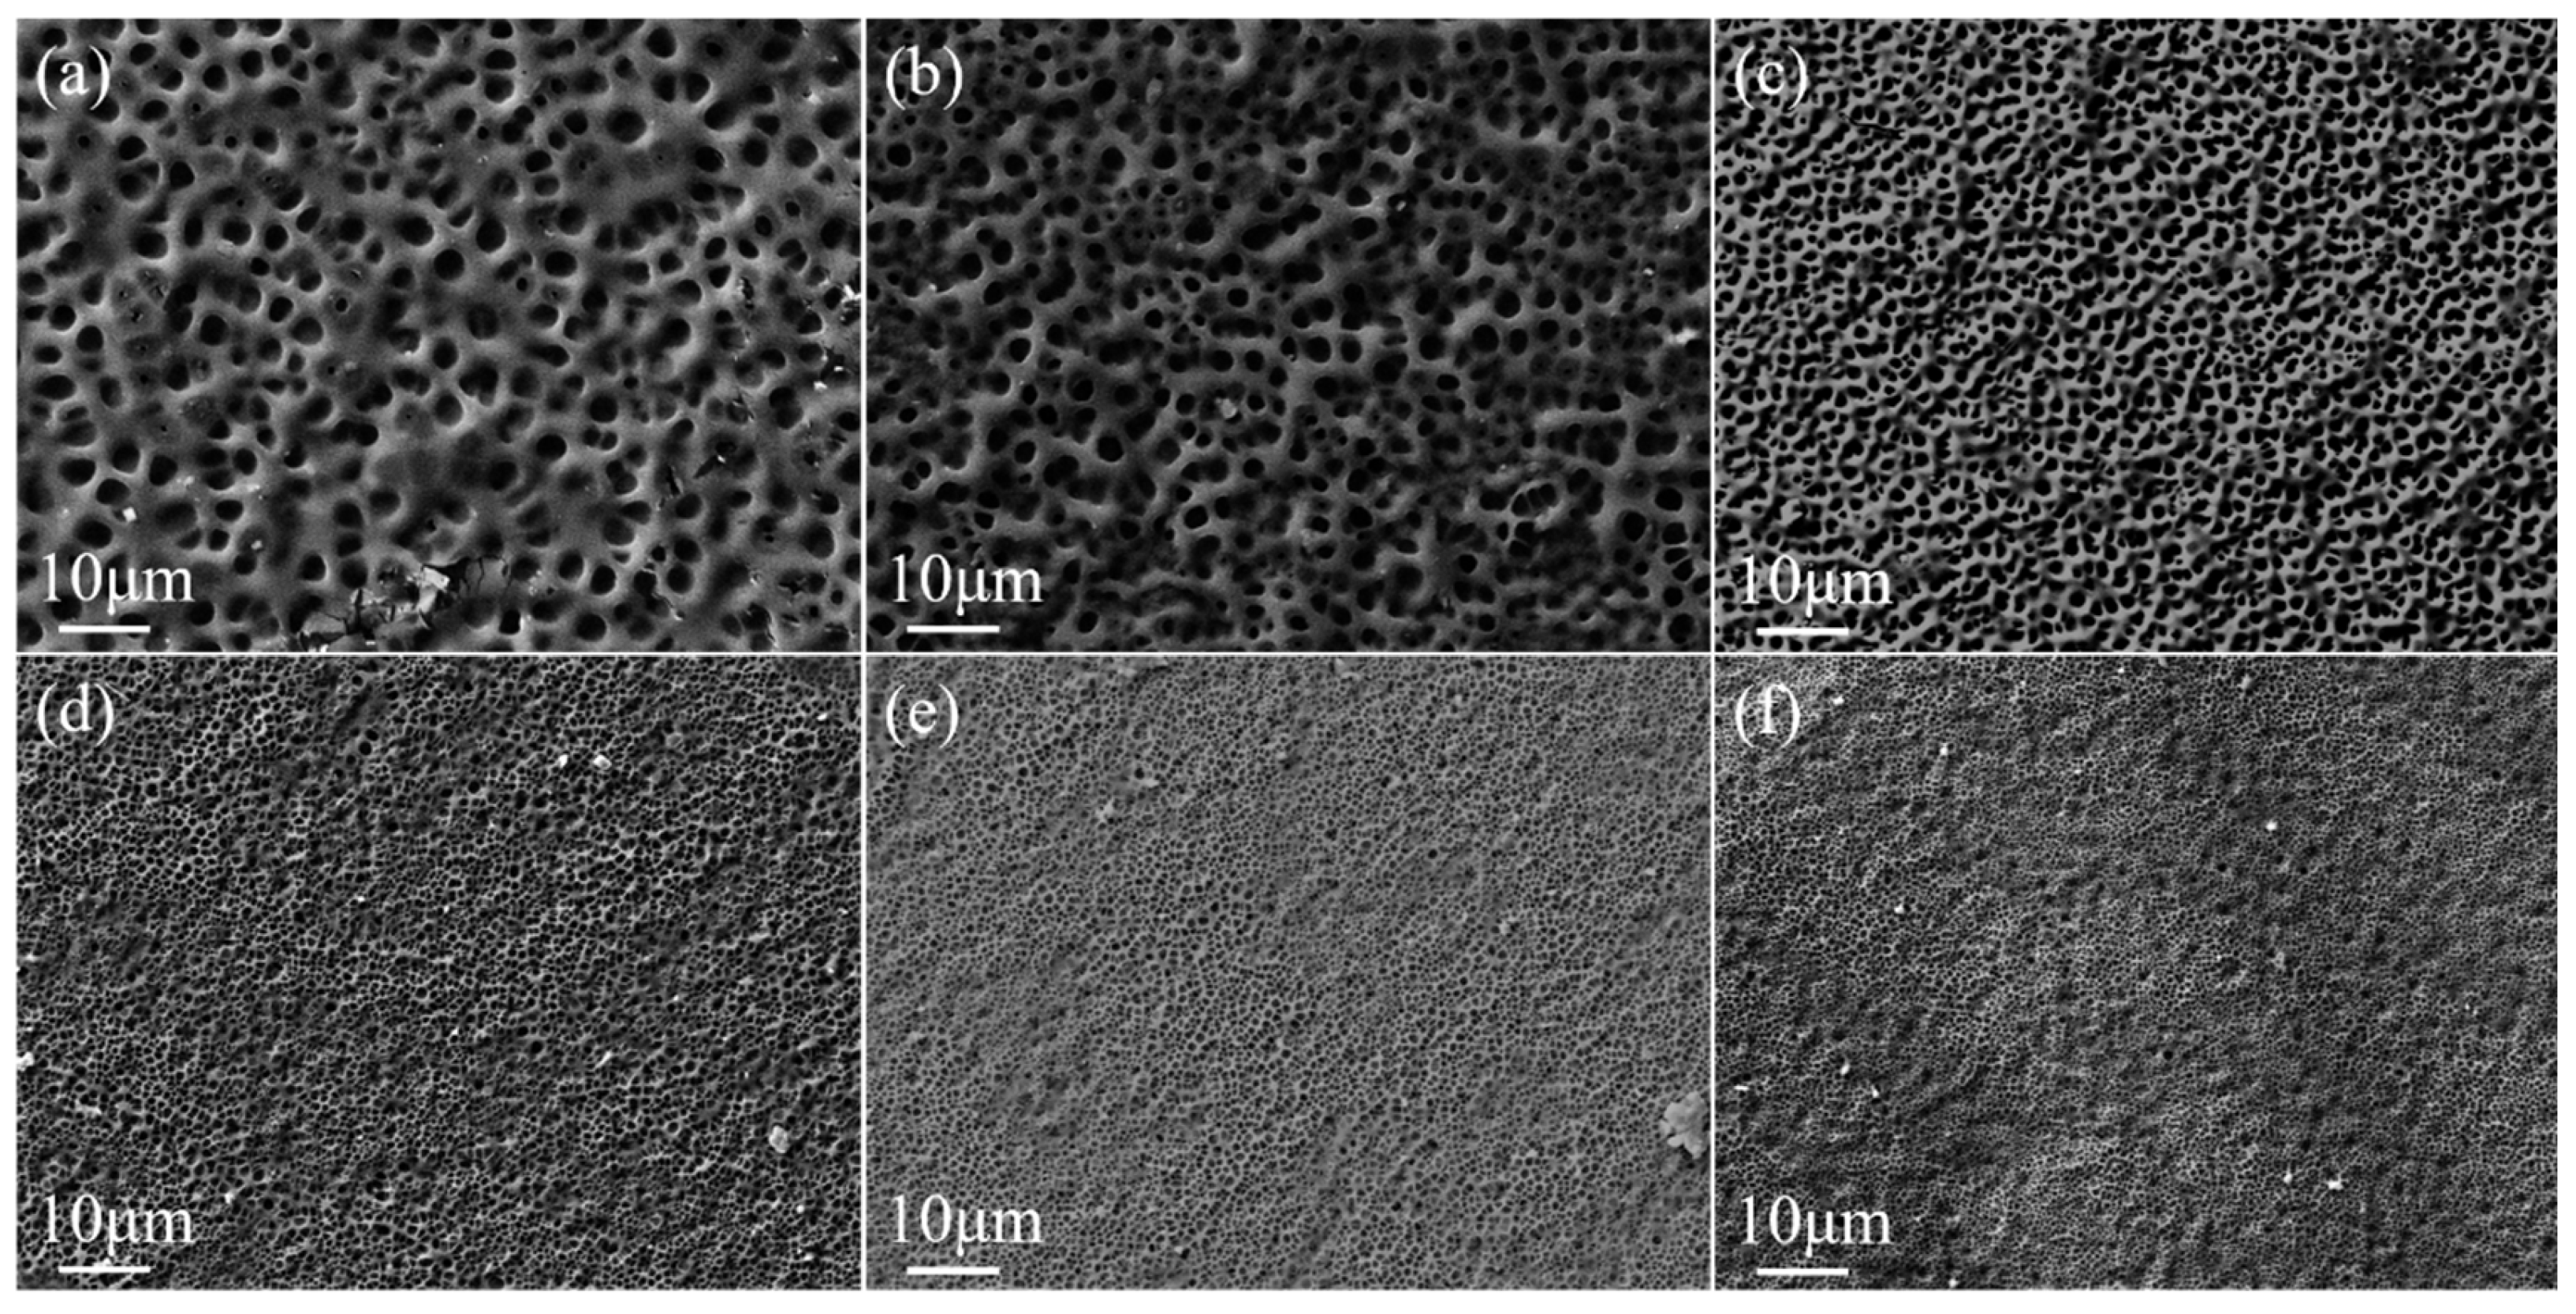
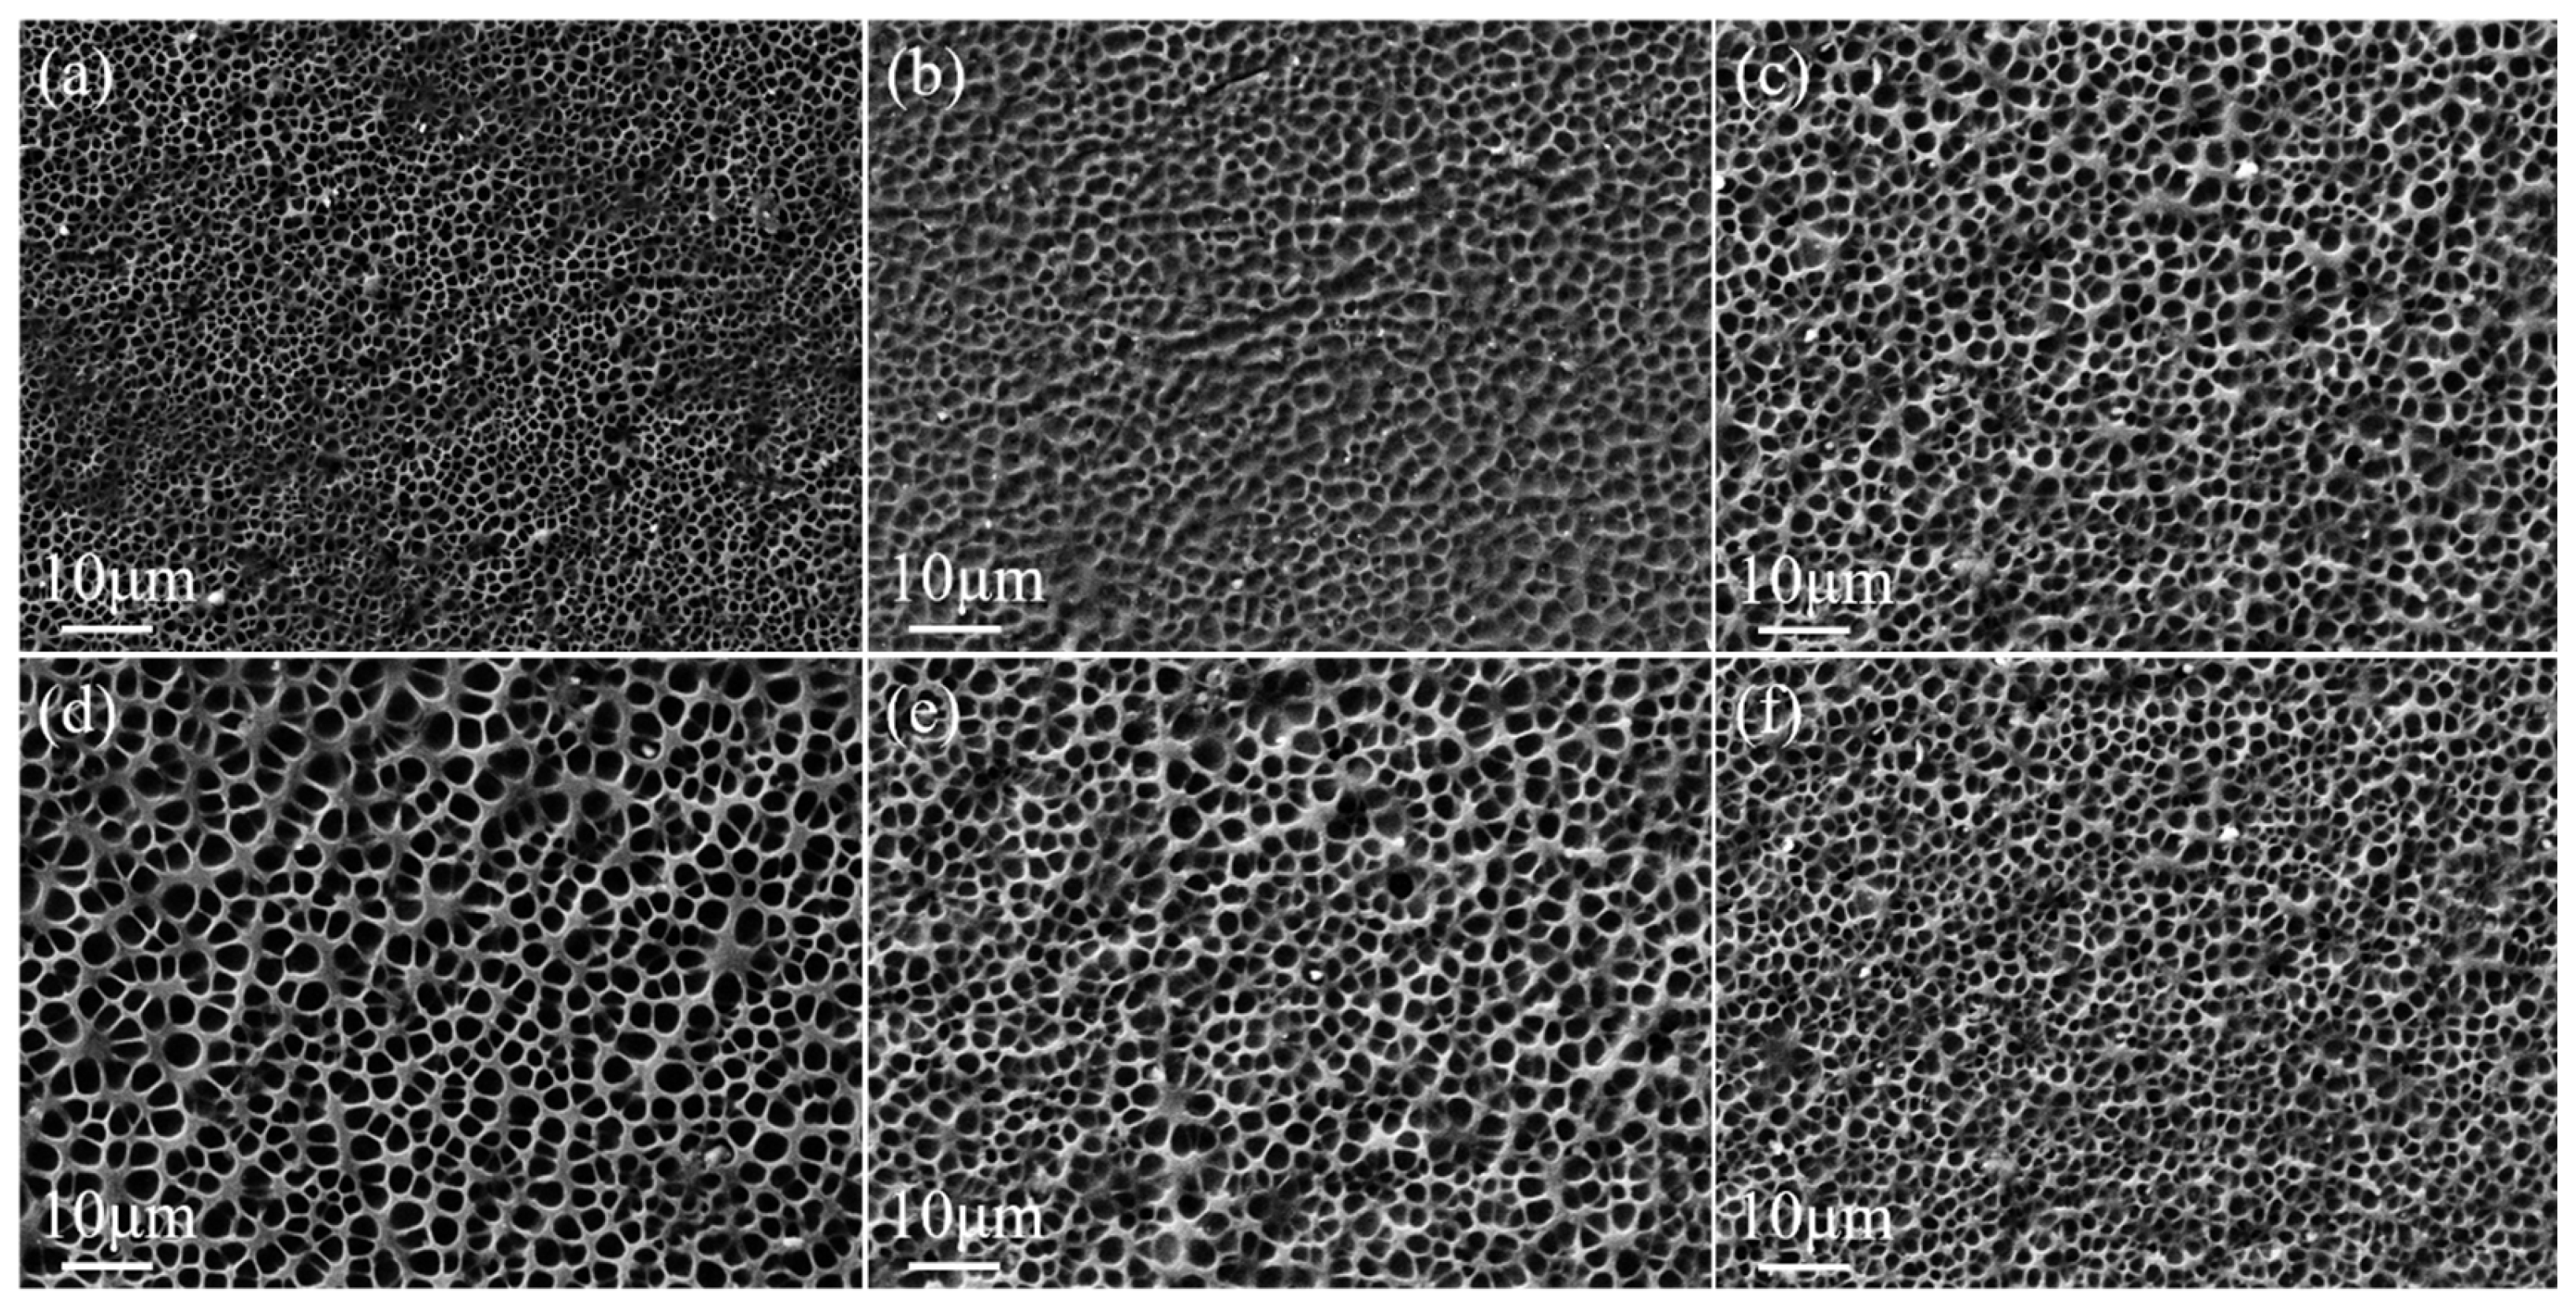
2.1. Effect of Crosslinker Content on the Property of Monolayer PDLC
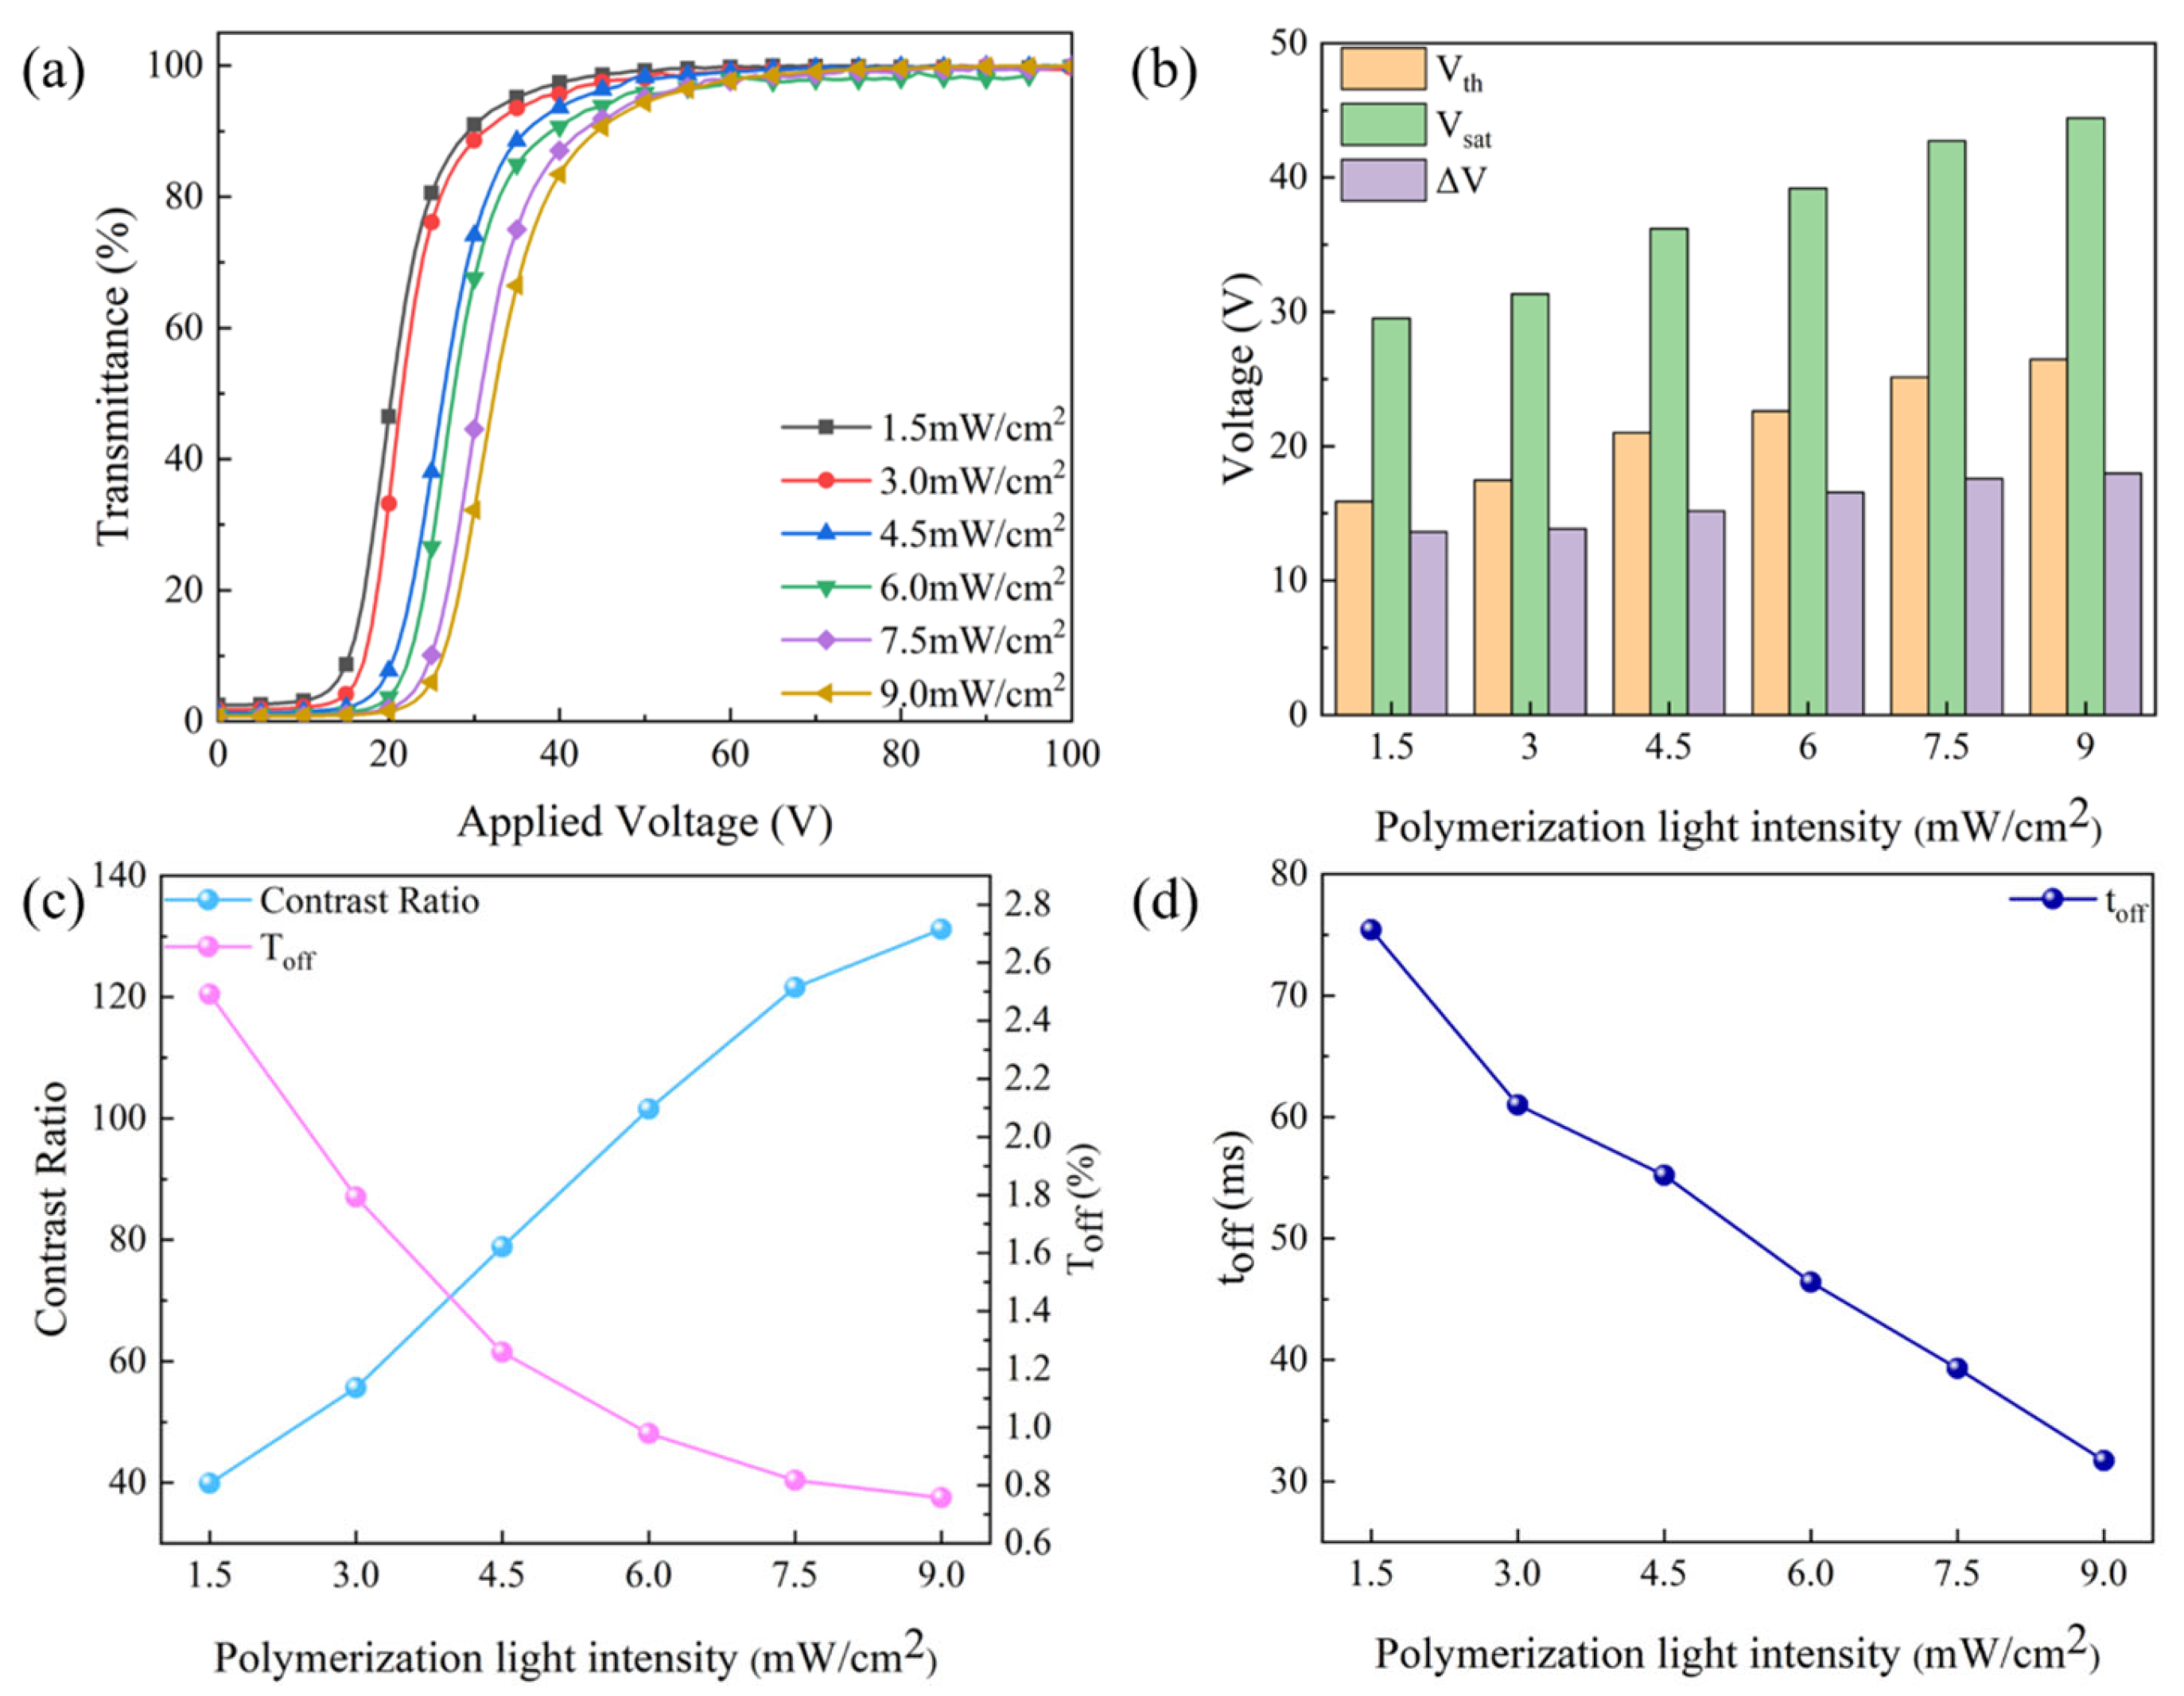
2.2. Effect of UV Light Intensity on the Property of Bilayer PDLC
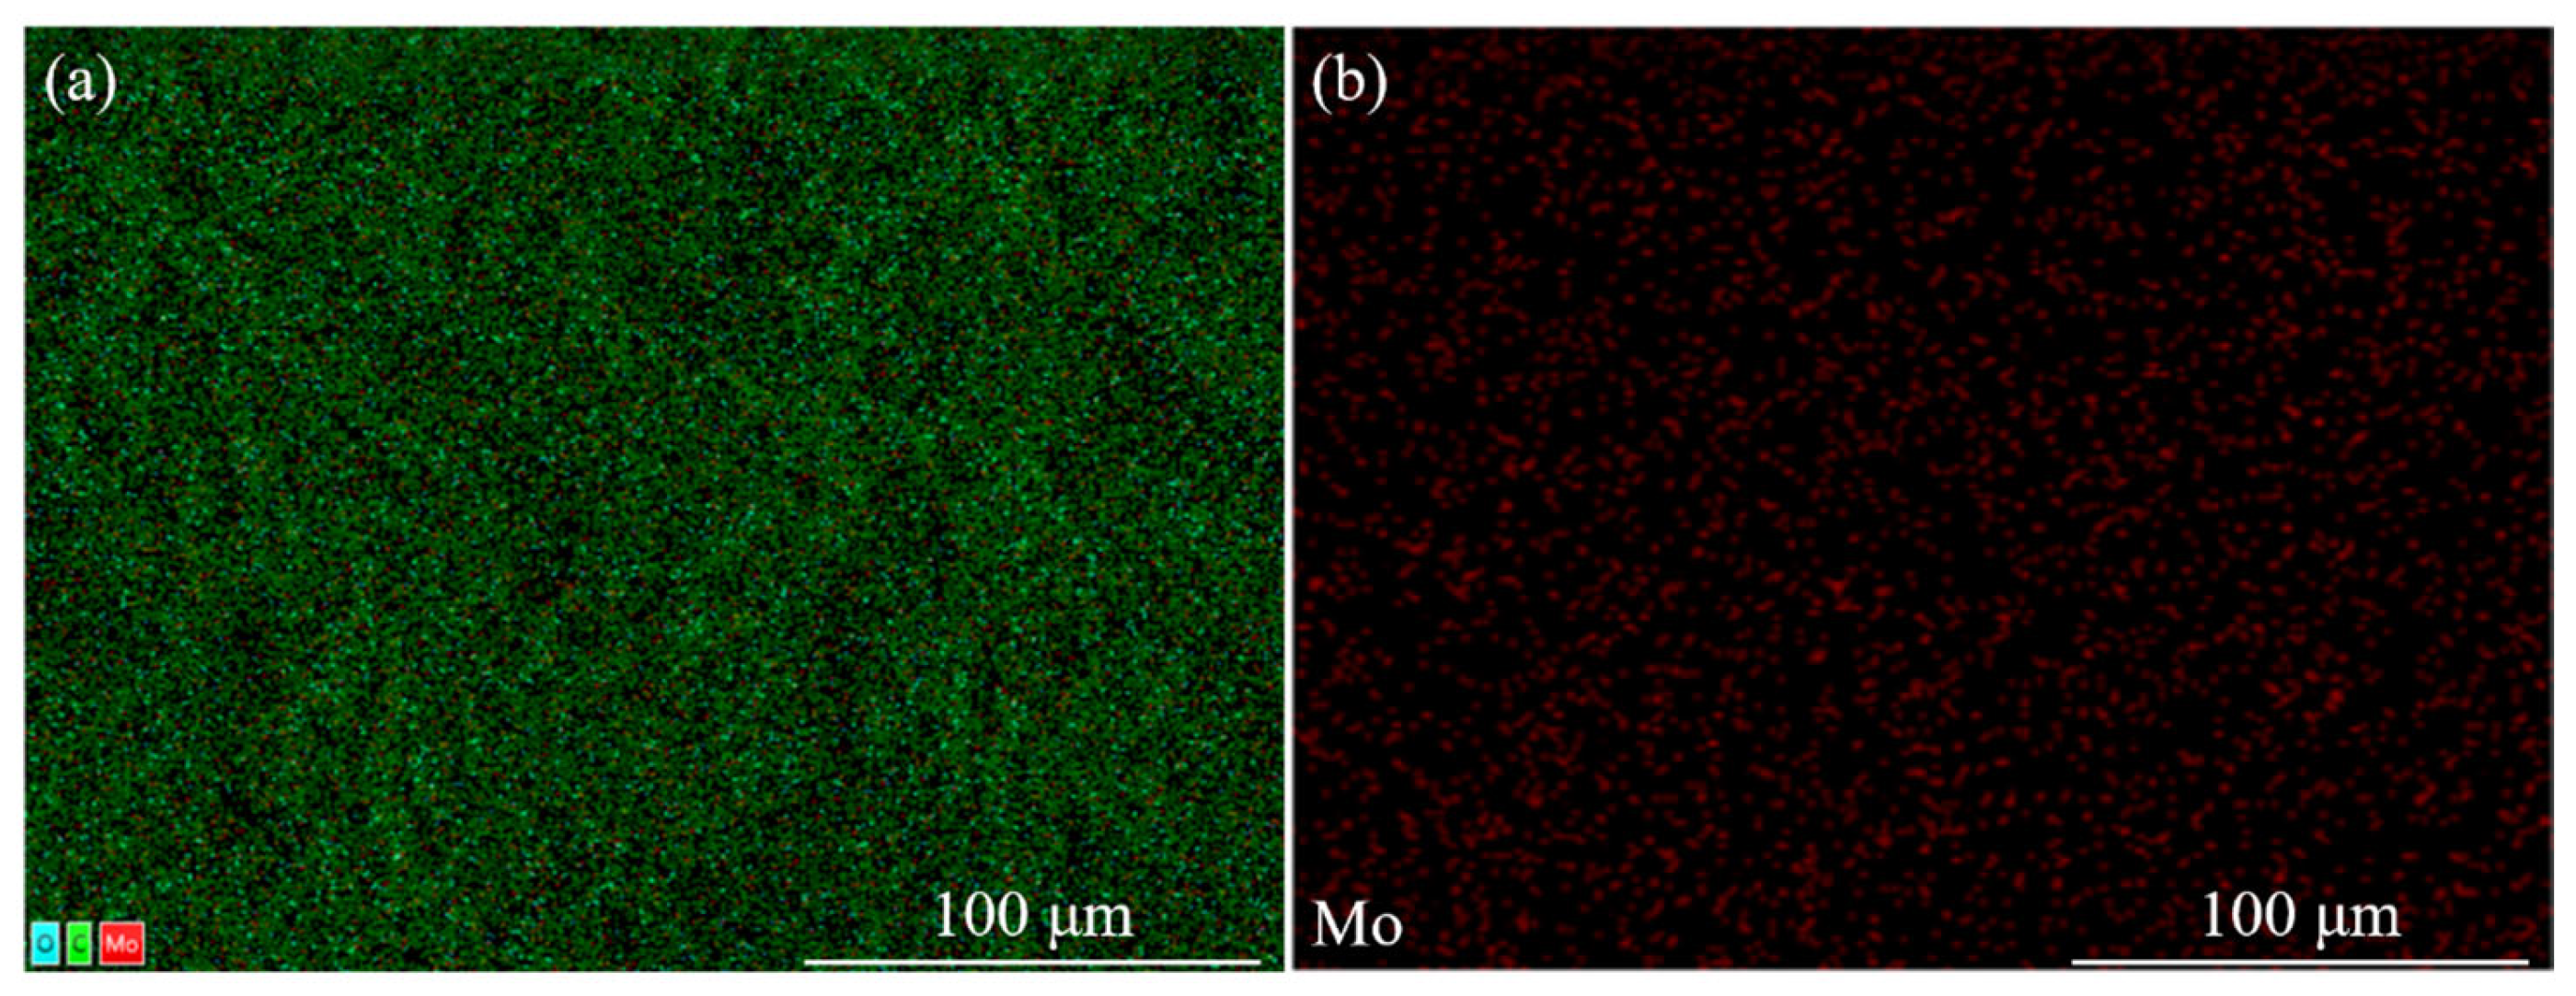
2.3. MoO2 Nanoparticles Doped Bilayer PDLC
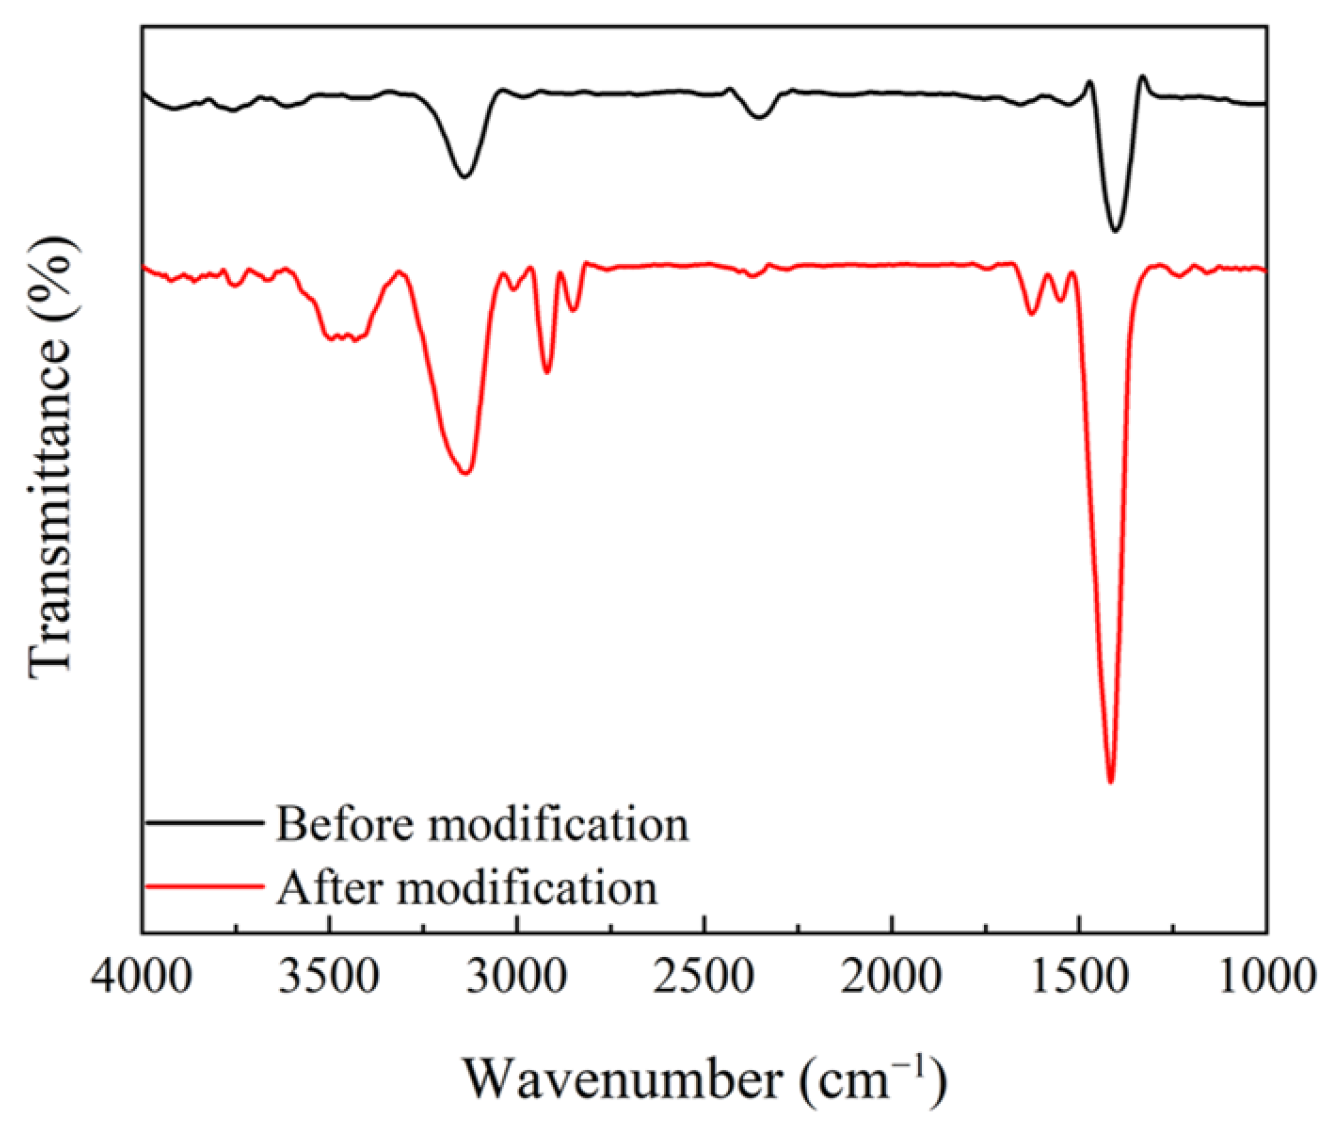
2.3.1. Modification of MoO2 Nanoparticles
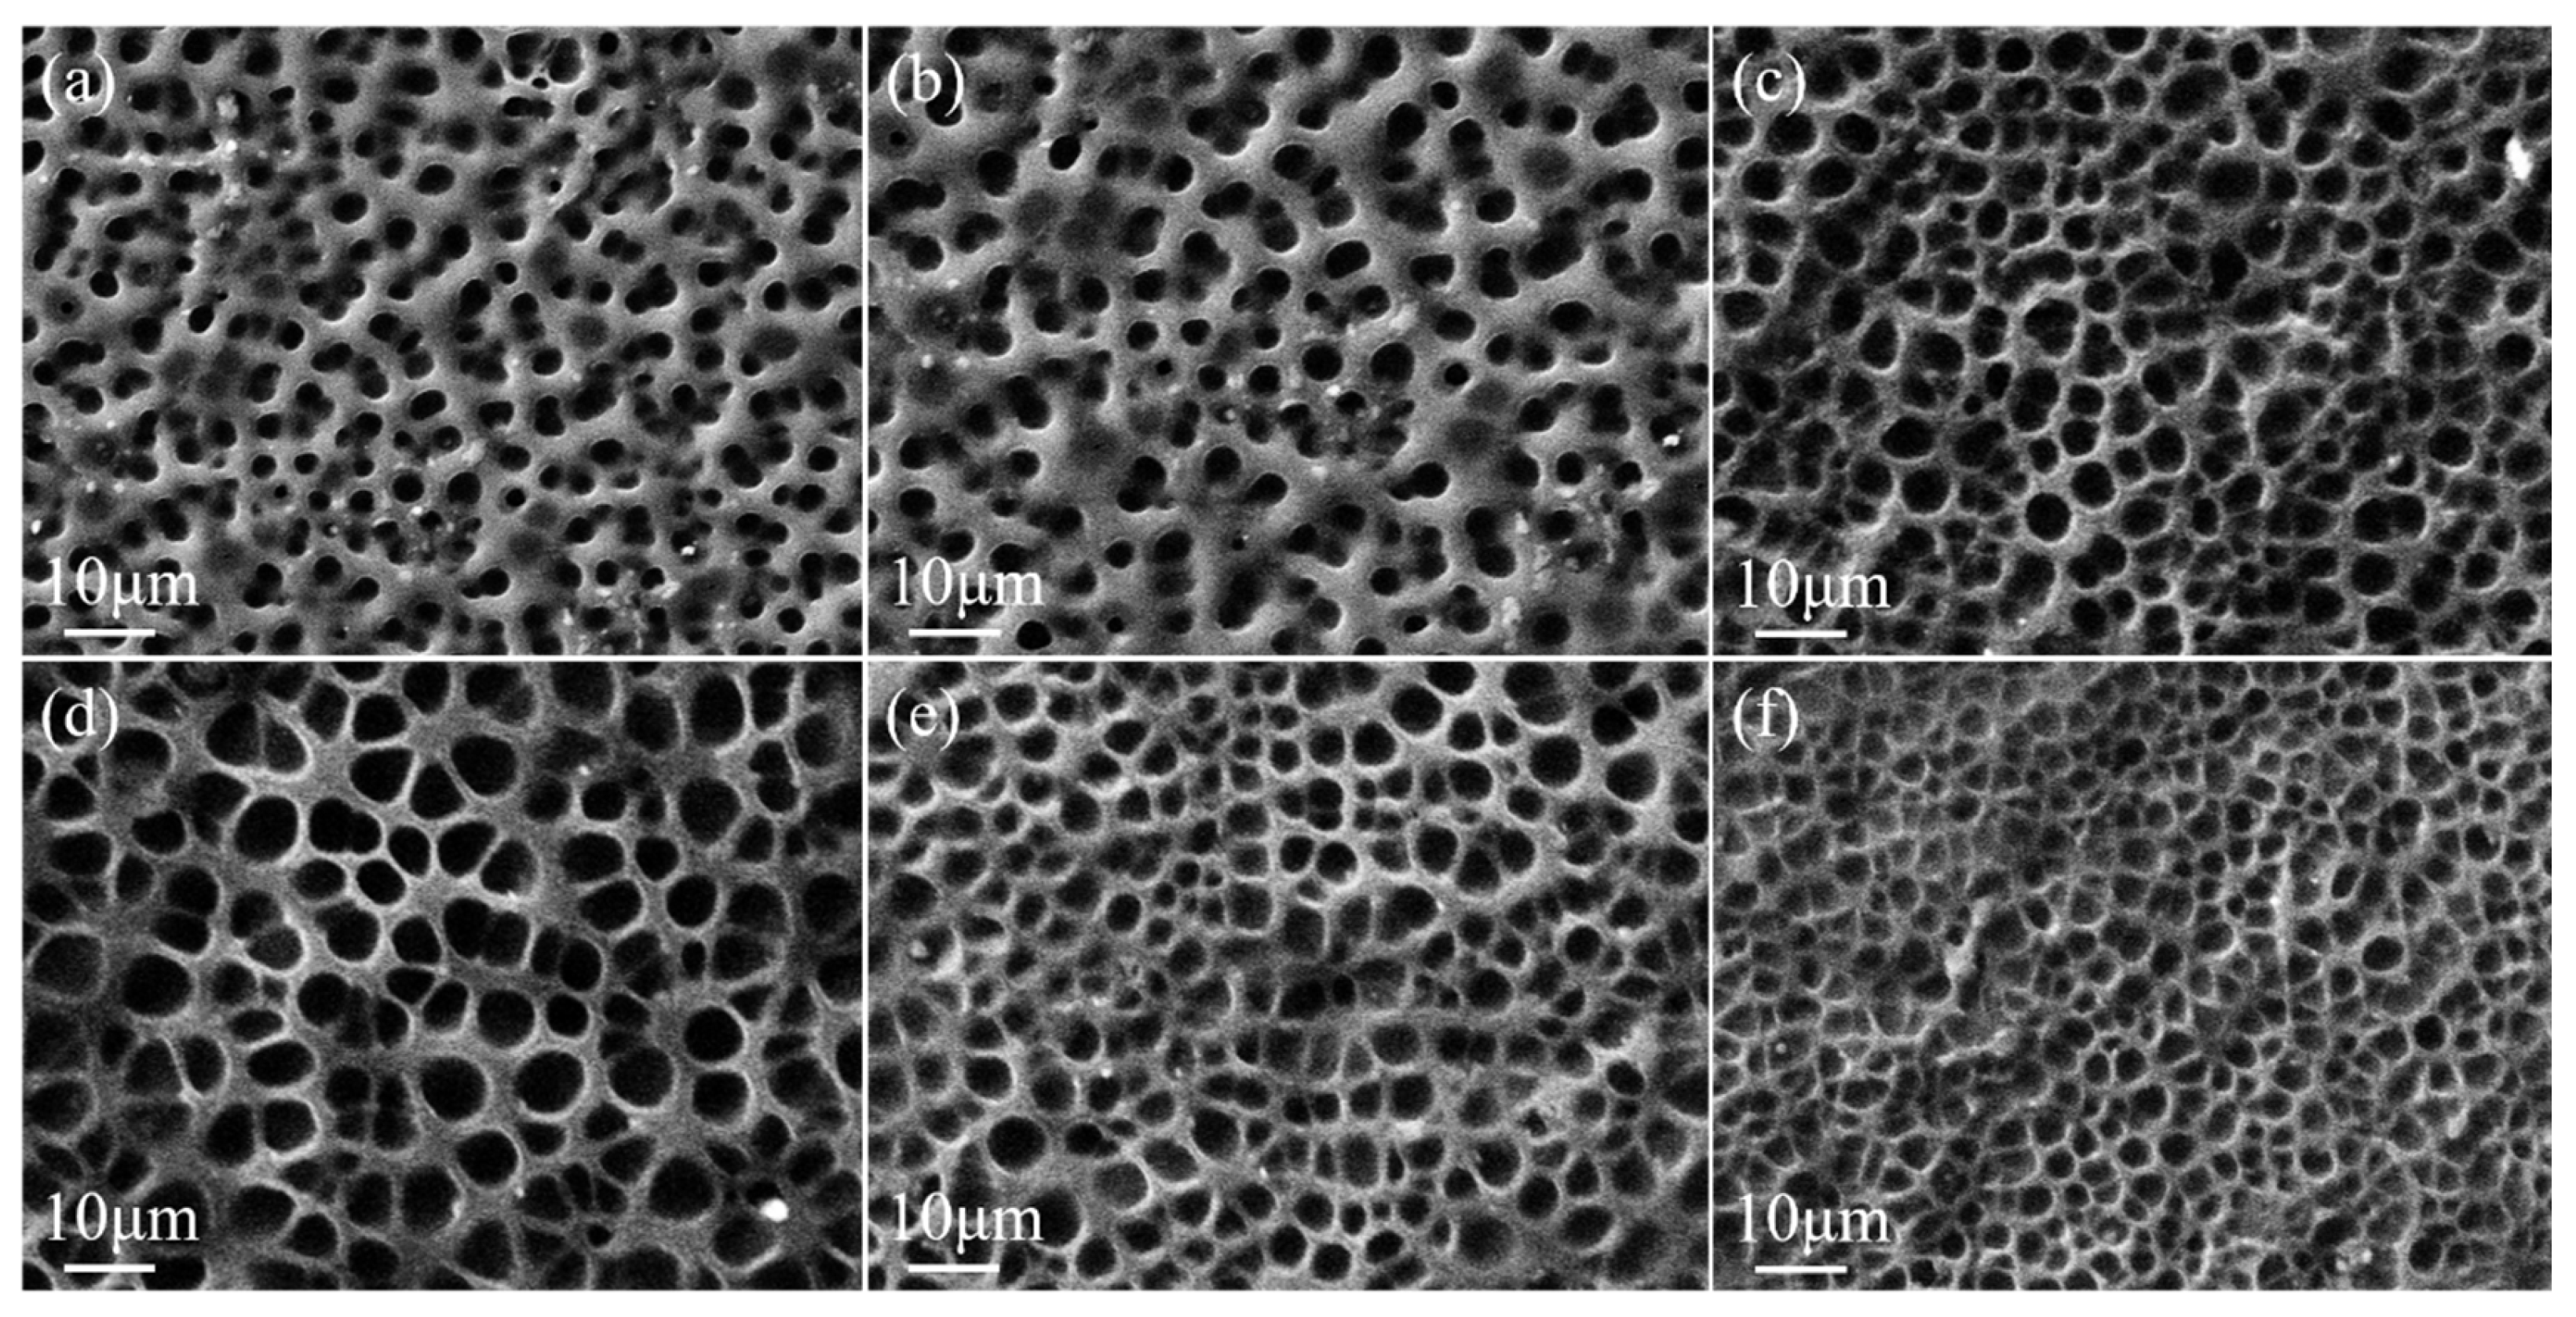
2.3.2. Effect of MoO2 Nanoparticles Content on the Property of Bilayer PDLC
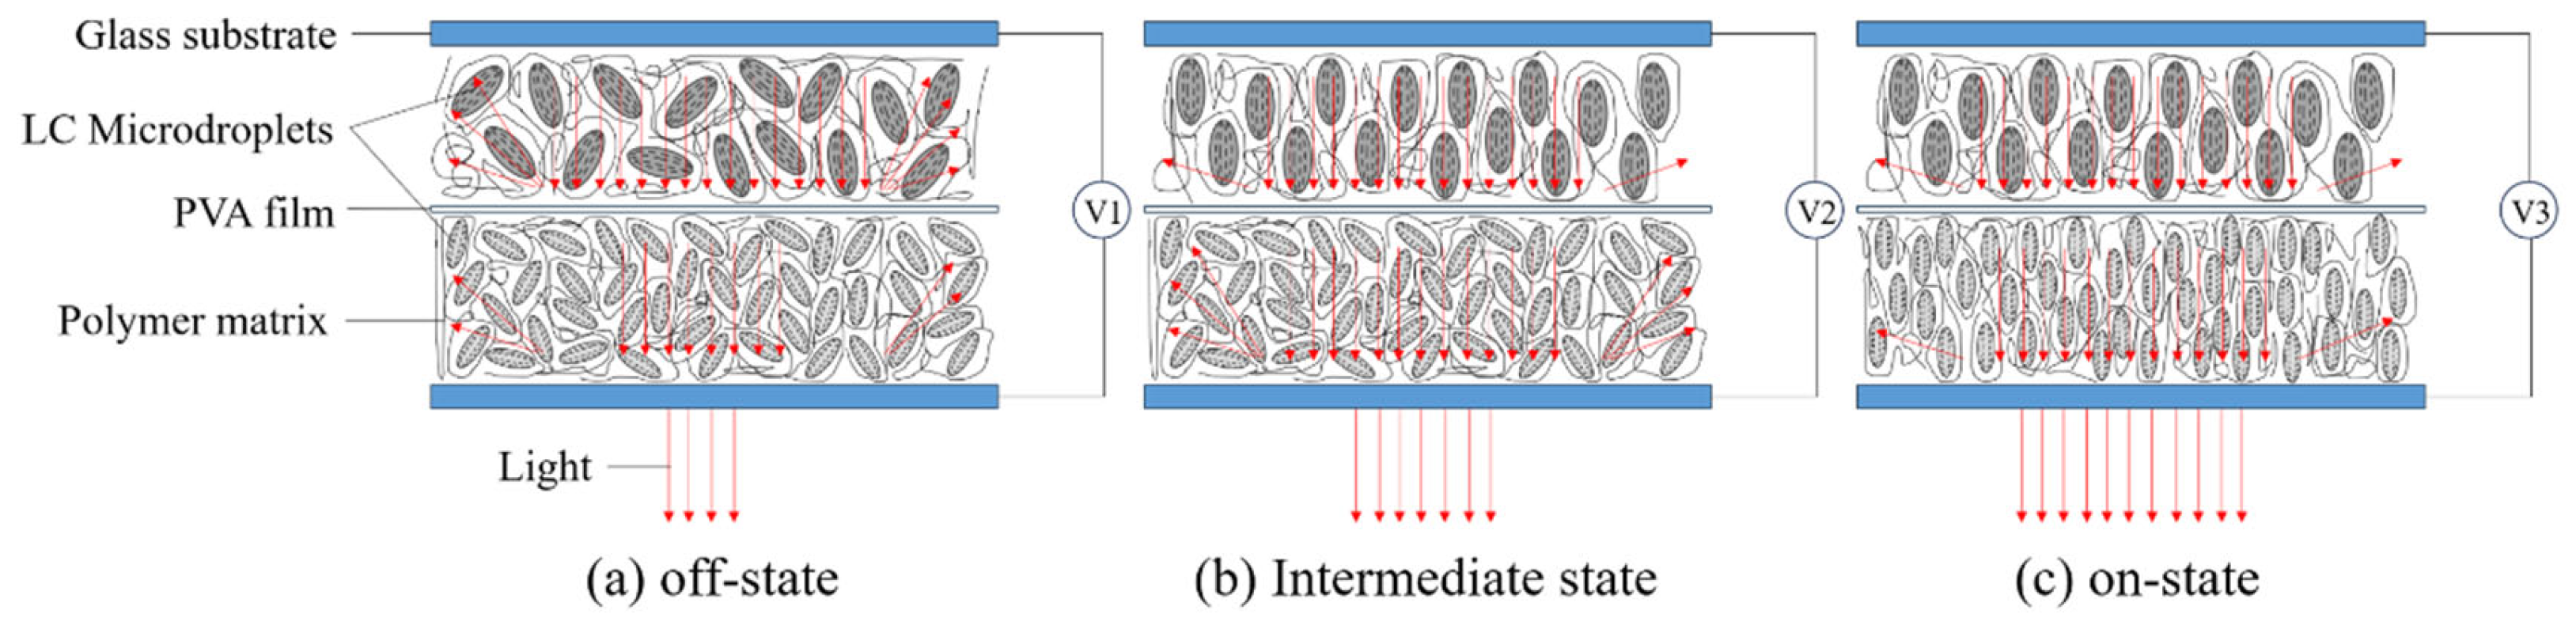
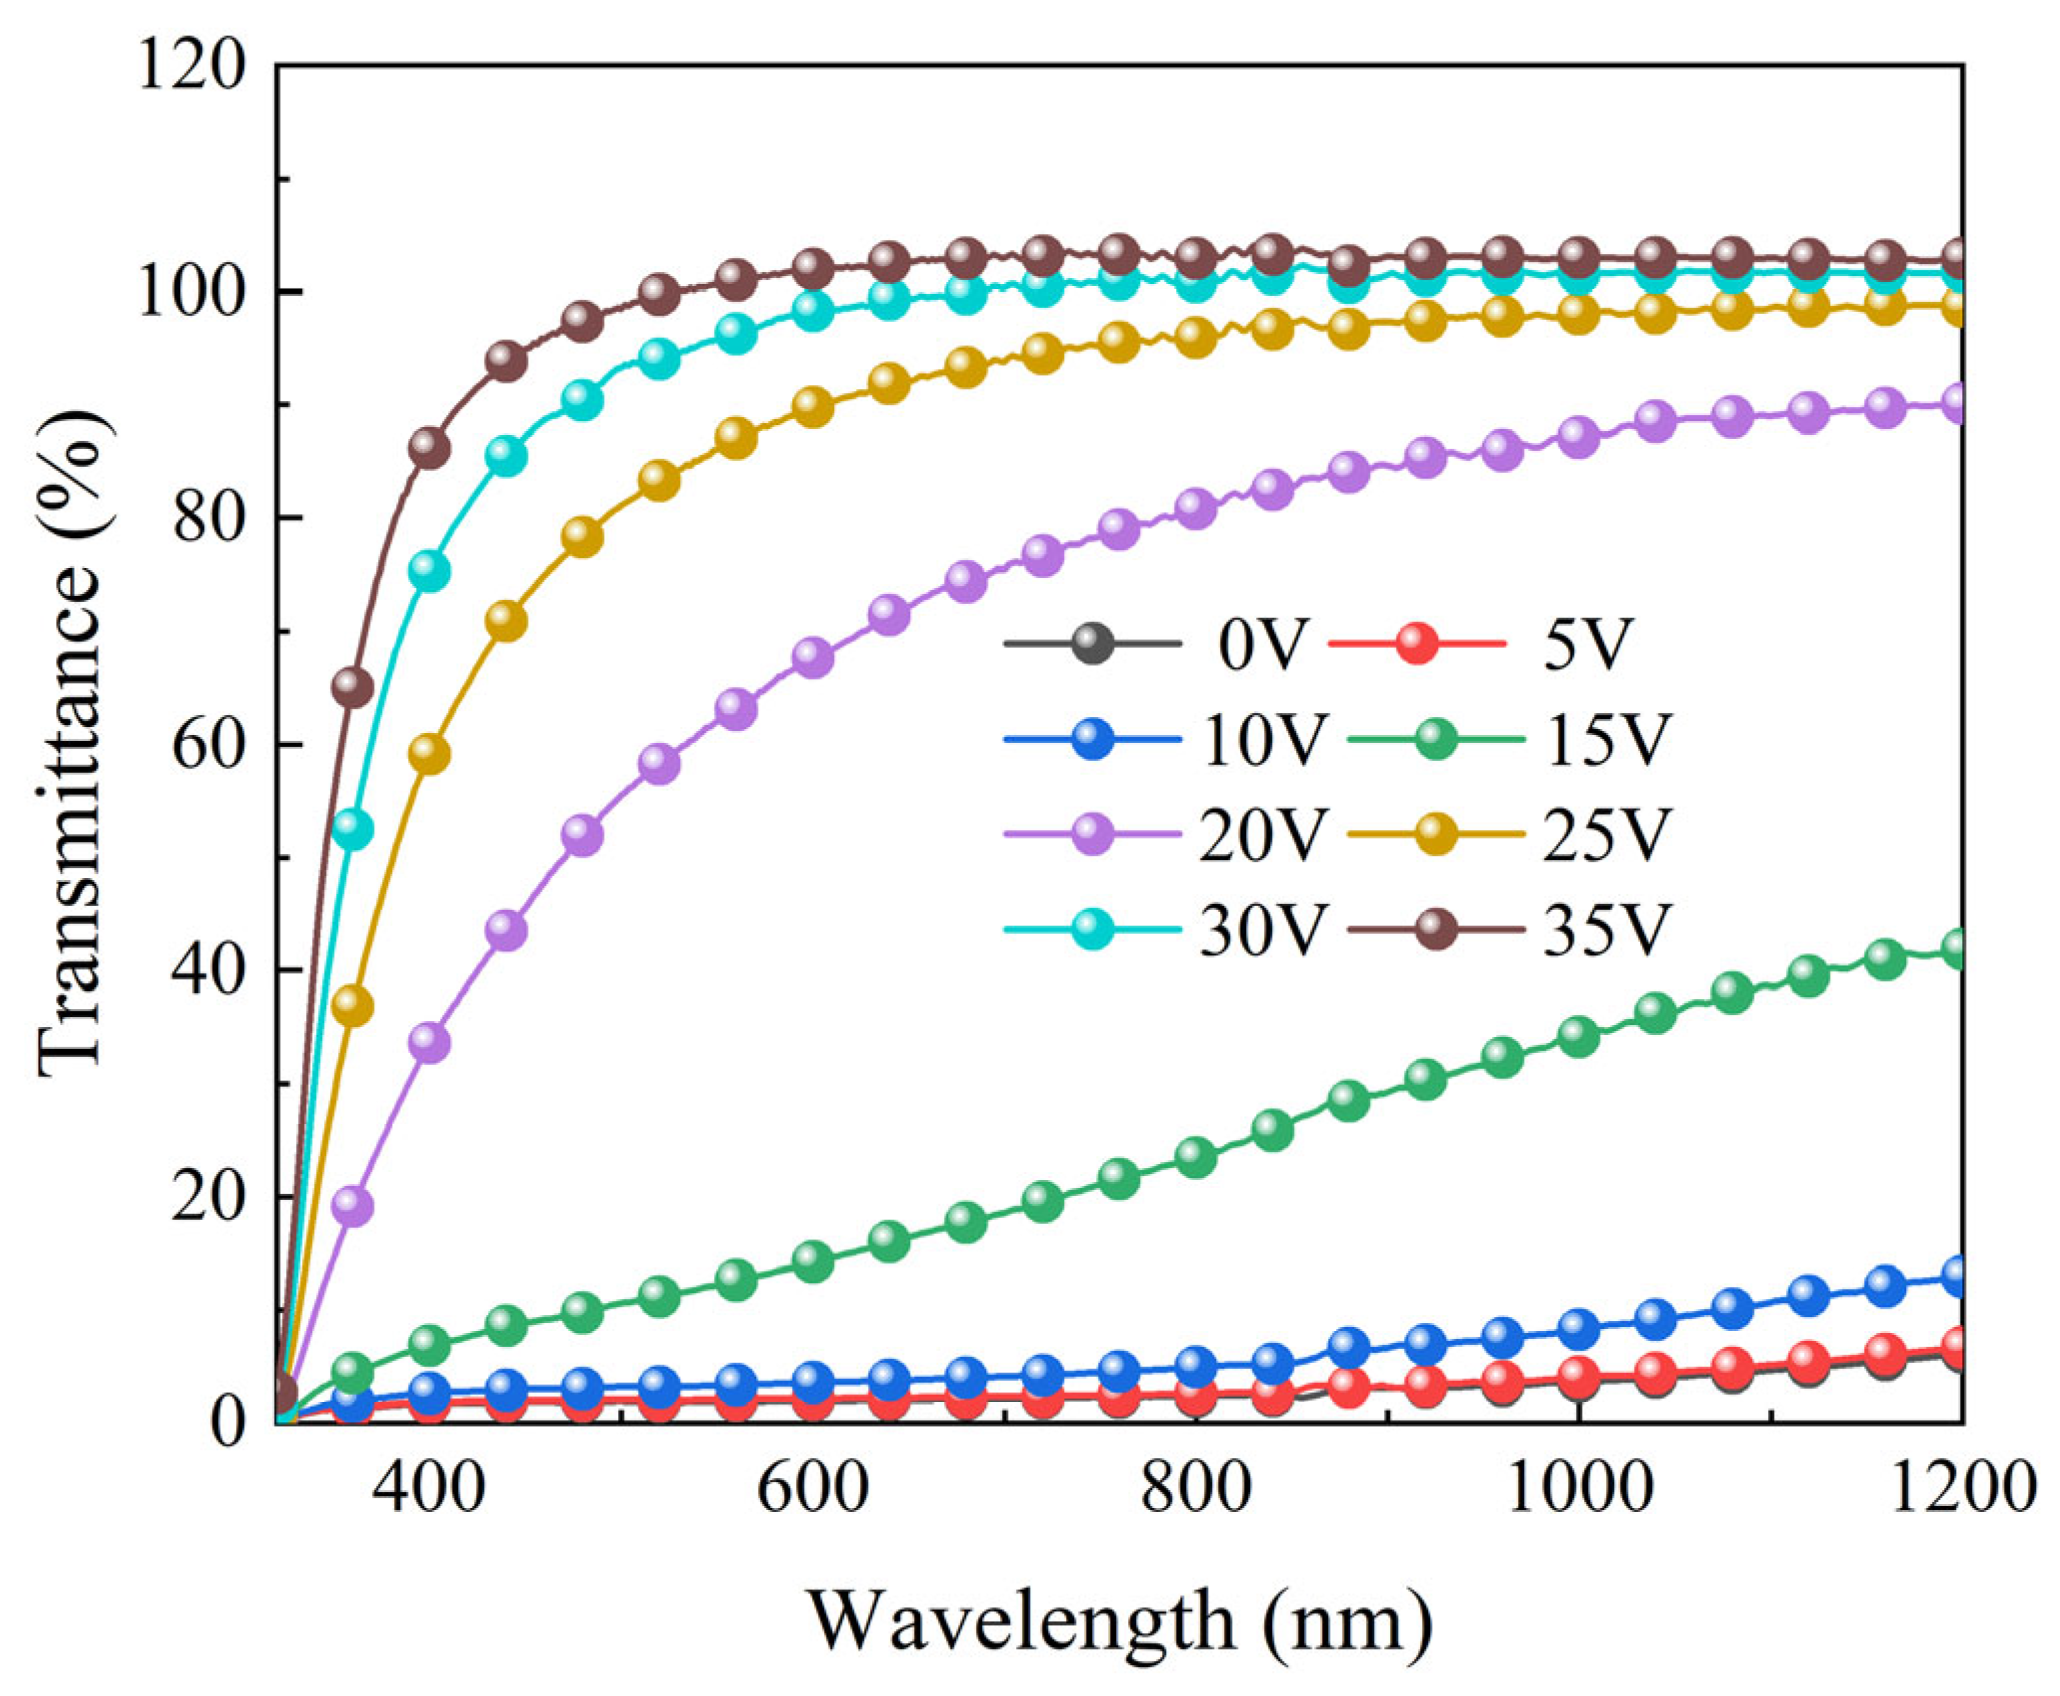
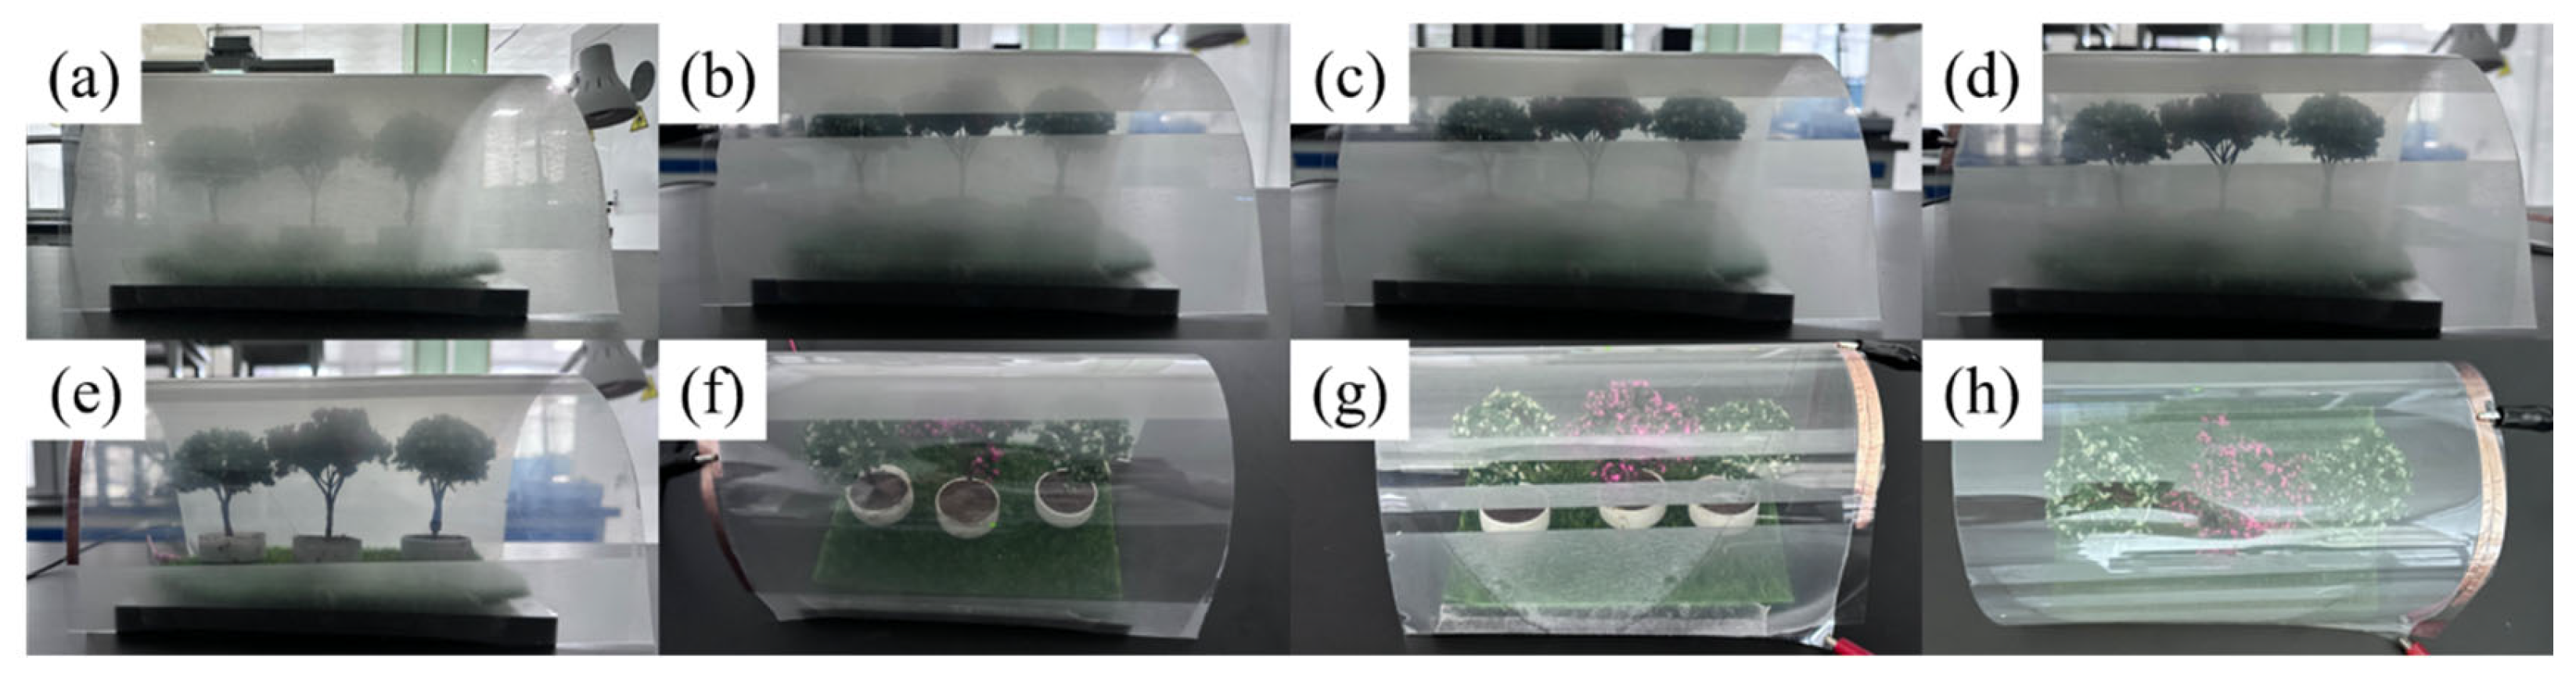
2.4. Progressive Driving Performance Testing of Bilayer PDLC
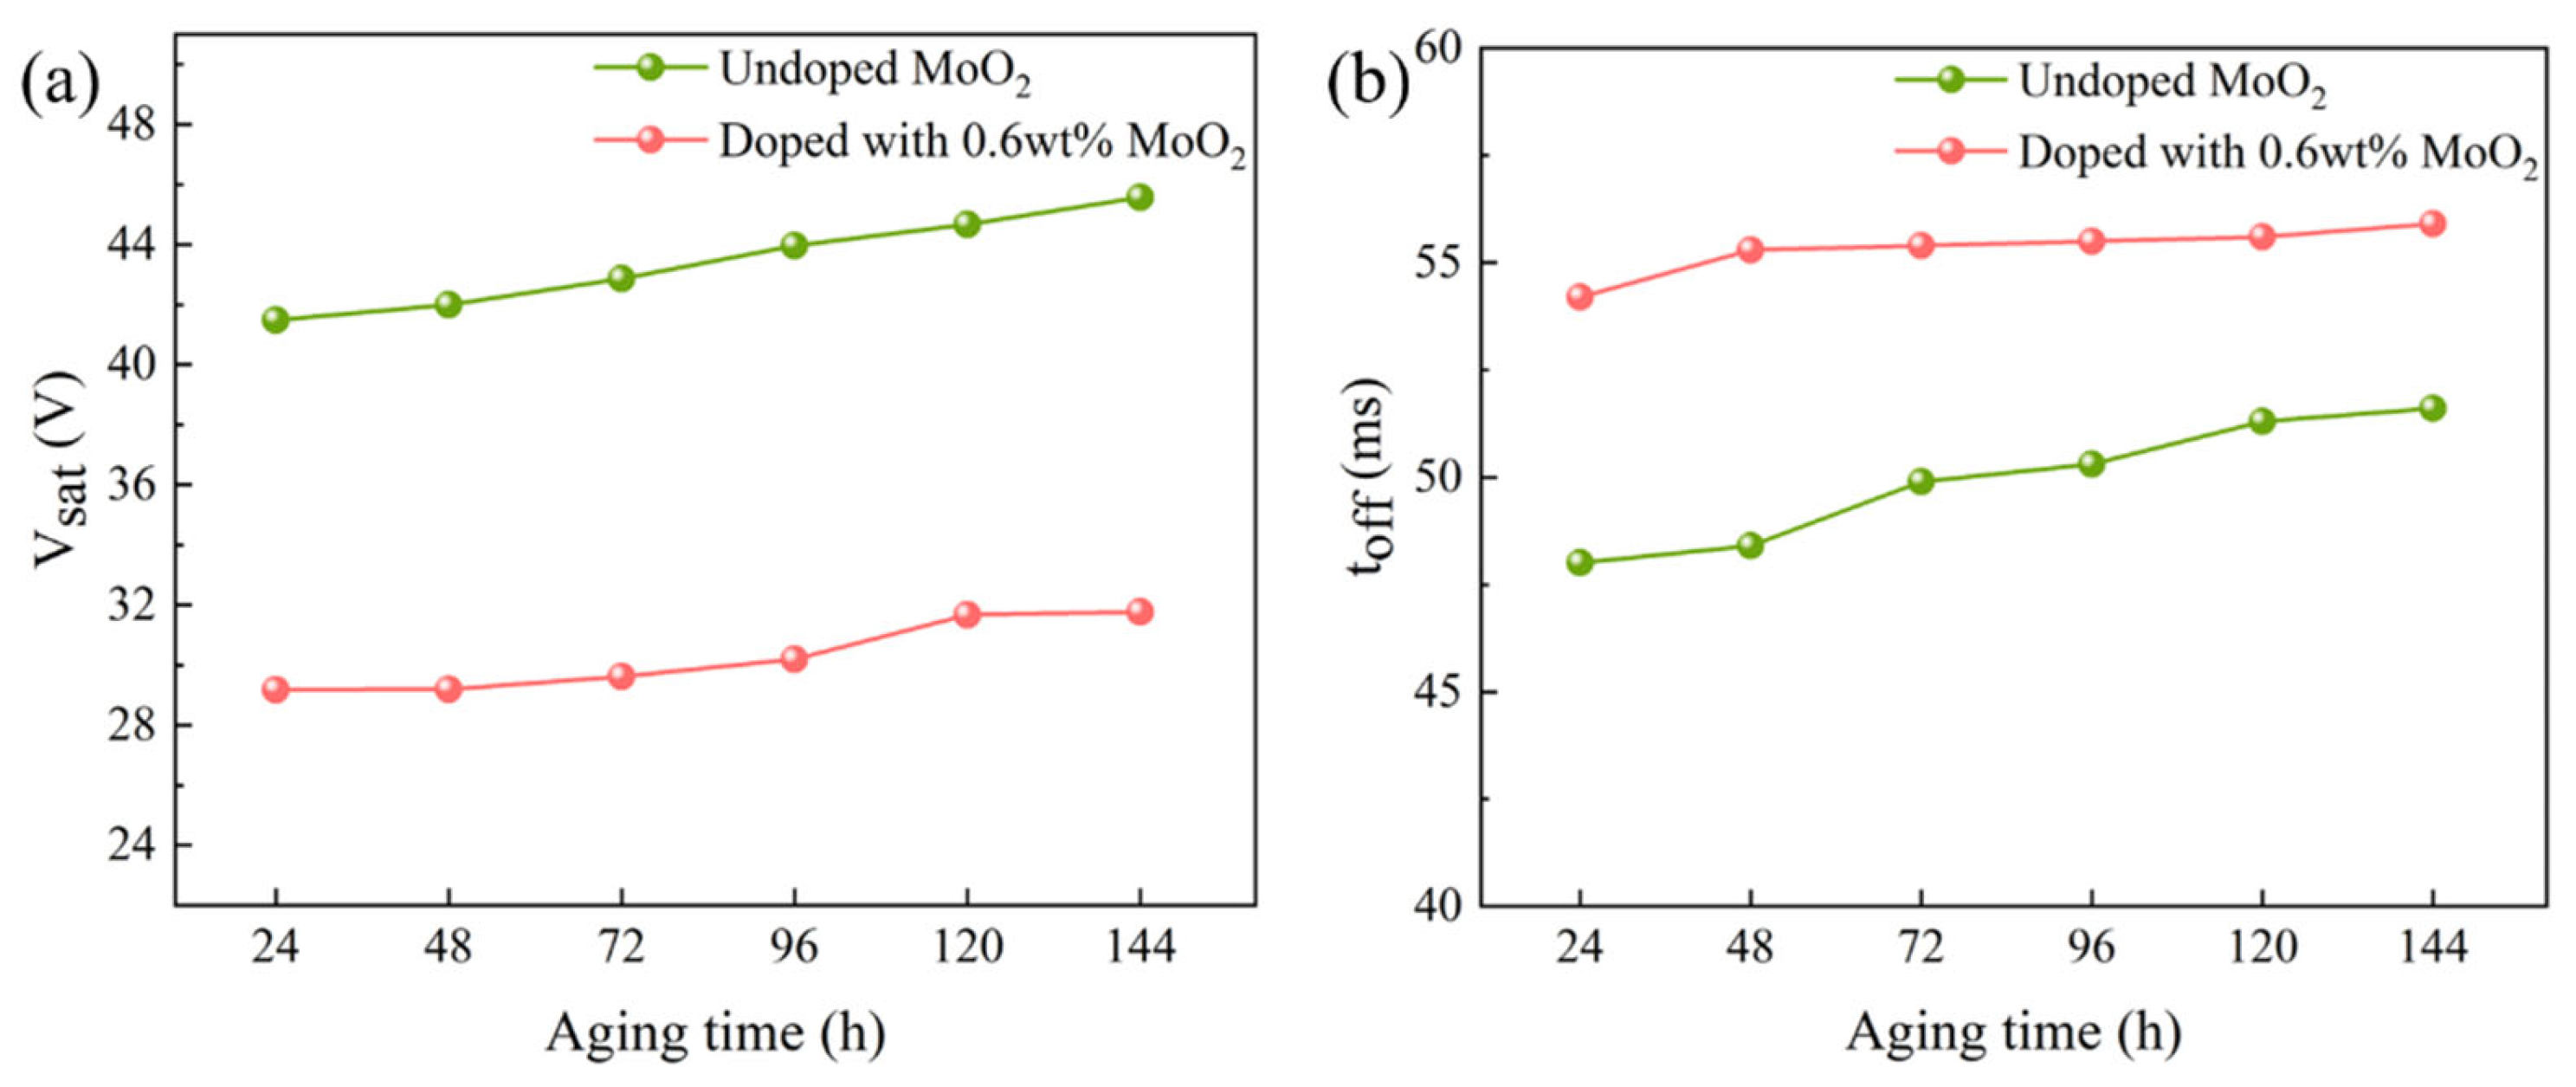
2.5. Aging Resistance Testing of Bilayer PDLC
2.6. Application of Bilayer PDLC in Flexible Smart Light Control Film
3. Experimental
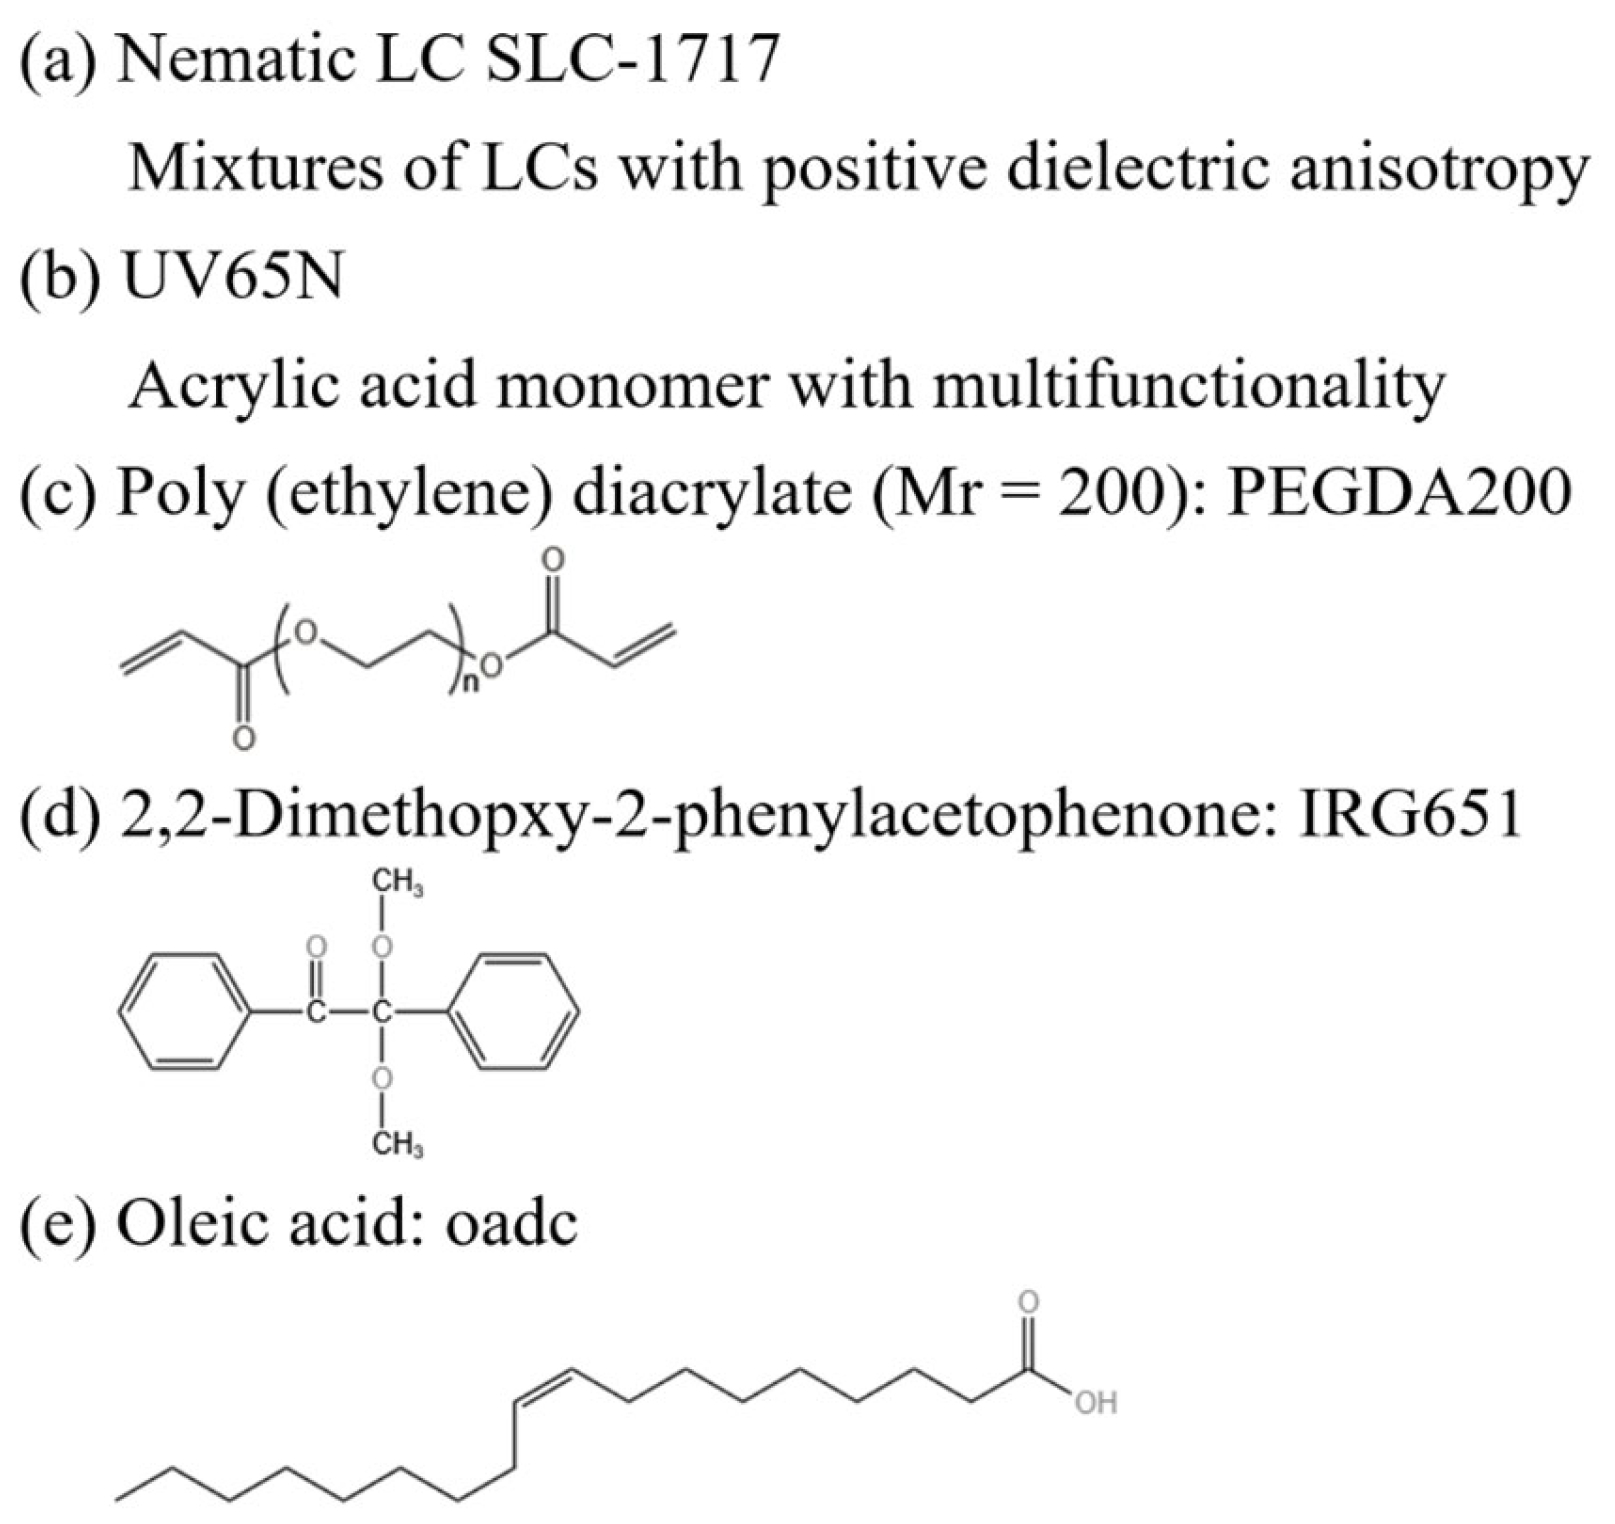
3.1. Materials
3.2. Sample Preparation
- (1)
- Preparation of precursors. The LC/monomer/initiator mixtures with different ratios were shaken for 3 min, stirred for 5 min and sonicated for 15 min to make them into homogeneous phases. Specific ratios are shown in Table 1.
- (2)
- Preparation of monolayer PDLC. The LC cells were obtained by fixing two single-sided conductive glass substrates spaced apart using an 8-micron-thick polyimide film as a spacer. By capillary action, the mixtures a1~a6 in Table 1 were infused into the LC cells, and the monolayer PDLCs were obtained after polymerization. The polymerization time, light intensity, and temperature for this group of samples were 5 min, 4.5 mW/cm2, and 35 °C, respectively.
- (3)
- Preparation of PVA film. A layer of aqueous PVA solution (0.05 wt%) was dropped on the surface-treated glass substrate using surface tension. The glass substrate with PVA film attached on the surface was obtained by standing under heating at 75 °C for 3 h.
- (4)
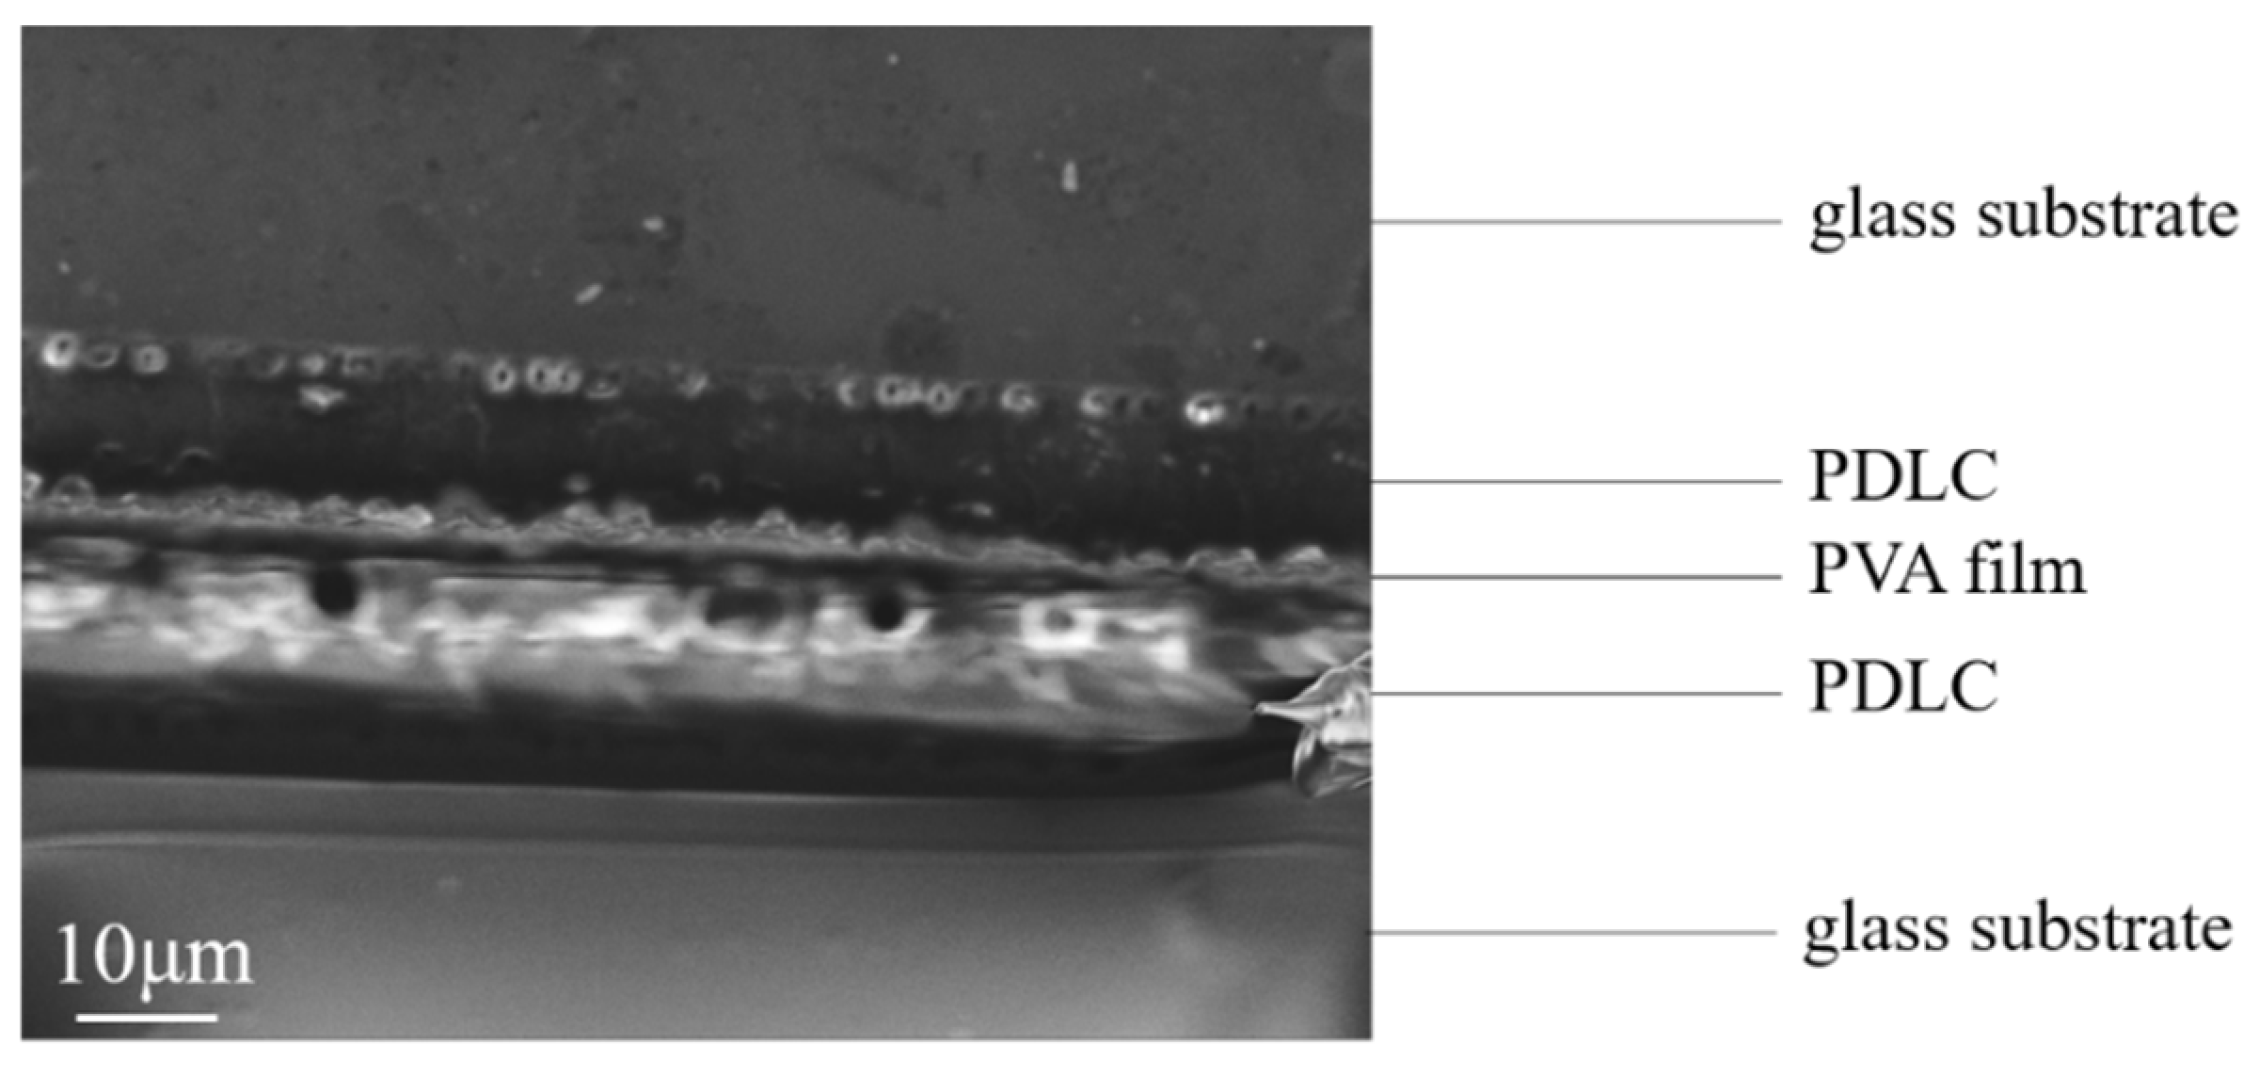
- Preparation of bilayer PDLC. Samples a2 and a4 were used as two monolayer PDLCs for the preparation of bilayer PDLC. The glass substrate with PVA film attached to the surface was spaced from the unilaterally conductive glass substrate using an 8-micron-thick polyimide film and fixed to obtain the LC cell. The precursor of a2 was infused into the LC cell using capillary action, and the PDLC-PVA composite film was obtained after curing. The surface-treated glass substrate was peeled off to obtain a glass substrate with a PDLC-PVA composite film attached to the surface. The glass substrate with PDLC-PVA composite film attached to the surface was spaced from the unilateral conductive glass substrate using an 8-micron-thick polyimide film to obtain a new LC cell. The precursor of a4 was infused into the liquid crystal box using capillary action, and a bilayer PDLC possessing a PDLC-PVA-PDLC structure was obtained after curing.
3.3. Characterization
4. Conclusions
Author Contributions
Funding
Institutional Review Board Statement
Informed Consent Statement
Data Availability Statement
Conflicts of Interest
References
- Zhang, H.M.; Miao, Z.C.; Shen, W.B. Development of polymer-dispersed liquid crystals: From mode innovation to applications. Compos. Part A Appl. Sci. Manuf. 2022, 163, 107234. [Google Scholar] [CrossRef]
- Malik, P.; Singh, A.K. Metal oxide alumina nanowire-induced polymer-dispersed liquid crystal composites for low power consumption smart windows. J. Mol. Liq. 2023, 378, 121573. [Google Scholar] [CrossRef]
- Choi, S.H.; Kim, J.A.; Heo, G.S.; Park, H.G. Electro-optical characteristics of polymer-dispersed liquid crystal containing copper (II) phthalocyanine as a function of UV irradiation time. J. Mol. Liq. 2022, 363, 119821. [Google Scholar] [CrossRef]
- Gong, S.; Cao, Y.; Fang, X.; Wang, Y.F.; Liu, Q.Z.; Gui, H.; Shen, C.F.; Cao, X.; Kim, E.S.; Zhou, C.W. Carbon nanotube macroelectronics for active matrix polymer-dispersed liquid crystal displays. ACS Nano 2016, 10, 10068–10074. [Google Scholar]
- Saeed, M.H.; Zhang, S.F.; Yu, M.N.; Zhou, L.; Huang, J.Y.; Feng, Q.F.; Lin, H.N.; Wang, X.; Hu, J.M.; Zhang, L.Y.; et al. Effects of oxygen heterocyclic acrylate monomers on the morphologies and electro-optical properties of polymer dispersed liquid crystal composite films. Optik 2021, 229, 166254. [Google Scholar] [CrossRef]
- Wang, L.; Bisoyi, H.K.; Zheng, Z.G.; Gutierrez-Cuevas, K.G.; Singh, G.; Kumar, S.; Bunning, T.J.; Li, Q. Stimuli-directed self-organized chiral superstructures for adaptive windows enabled by mesogen-functionalized graphene. Mater. Today 2017, 20, 230–237. [Google Scholar] [CrossRef]
- Hemaida, A.; Ghosh, A.; Sundaram, S.; Mallick, T.K. Simulation study for a switchable adaptive polymer dispersed liquid crystal smart window for two climate zones (Riyadh and London). Energ. Build. 2021, 251, 111381. [Google Scholar] [CrossRef]
- Kamal, W.; Li, M.M.; Lin, J.D.; Parry, E.; Jin, Y.H.; Elston, S.J.; Castrejón-Pita, A.A.; Morris, S.M. Spatially patterned polymer dispersed liquid crystals for image-integrated smart windows. Adv. Opt. Mater. 2022, 10, 2101748. [Google Scholar] [CrossRef]
- Nasir, N.; Kumar, S.; Kim, M.; Nguyen, V.H.; Suleman, M.; Park, H.M.; Lee, S.; Kang, D.; Seo, Y. Effect of the photoinitiator concentration on the electro- optical properties of thiol-acrylate-based PDLC smart windows. ACS. Appl. Energy. Mater. 2022, 5, 6986–6995. [Google Scholar] [CrossRef]
- He, Z.M.; Shen, W.B.; Yu, P.; Zhao, Y.Z.; Zeng, Z.; Liang, Z.; Chen, Z.; Zhang, H.M.; Zhang, H.Q.; Miao, Z.C.; et al. Viewing-angle-switching film based on polymer dispersed liquid crystals for smart anti-peeping liquid crystal display. Liq. Cryst. 2022, 49, 59–65. [Google Scholar] [CrossRef]
- Wang, Z.W.; Cao, M.X.; Shao, G.R.; Zhang, Z.K.; Yu, H.W.; Chen, Y.Q.; Zhang, Y.T.; Li, Y.; Xu, B.P.; Wang, Y.; et al. Coherent random lasing in colloidal quantum dot-doped polymer-dispersed liquid crystal with low threshold and high stability. J. Phys. Chem. Lett. 2020, 11, 767–774. [Google Scholar] [CrossRef] [PubMed]
- Mateen, F.; Ali, M.; Oh, H.; Hong, S.K. Nitrogen-doped carbon quantum dot based luminescent solar concentrator coupled with polymer dispersed liquid crystal device for smart management of solar spectrum. Sol. Energy 2019, 178, 48–55. [Google Scholar] [CrossRef]
- Shaik, S.; Nundy, S.; Maduru, V.R.; Ghosh, A.; Afzal, A. Polymer dispersed liquid crystal retrofitted smart switchable glazing: Energy saving, diurnal illumination, and CO2 mitigation prospective. J. Clean. Prod. 2022, 350, 131444. [Google Scholar] [CrossRef]
- Ghosh, A. Investigation of vacuum-integrated switchable polymer dispersed liquid crystal glazing for smart window application for less energy-hungry building. Energy 2023, 265, 126396. [Google Scholar] [CrossRef]
- Mathew, V.; Kurian, C.P.; Augustine, N. Climate-responsive machine learning- based control of switchable glazing towards human-centric lighting. Sol. Energy 2023, 260, 49–60. [Google Scholar] [CrossRef]
- Mesloub, A.; Ghosh, A.; Kolsi, L.; Alshenaifi, M. Polymer-dispersed liquid crystal (PDLC) smart switchable windows for less-energy hungry buildings and visual comfort in hot desert climate. J. Build. Eng. 2022, 59, 105101. [Google Scholar] [CrossRef]
- Ghosh, A. Diffuse transmission dominant smart and advanced windows for less energy-hungry building: A review. J. Build. Eng. 2022, 64, 105604. [Google Scholar] [CrossRef]
- Zhang, P.; Tong, X.R.; Gao, Y.; Qian, Z.Y.; Ren, R.R.; Bian, C.C.; Wang, J.H.; Cai, G.F. A sensing and stretchable polymer-dispersed liquid crystal device based on spiderweb-inspired silver nanowires-micromesh transparent electrode. Adv. Funct. Mater. 2023, 33, 2303270. [Google Scholar] [CrossRef]
- Zhang, C.; Wang, H.L.; Guan, S.; Guo, Z.H.; Zheng, X.X.; Fan, Y.J.; Wang, Y.; Qu, T.; Zhao, Y.B.; Chen, A.H.; et al. Self-powered optical switch based on triboelectrification-triggered liquid crystal alignment for wireless sensing. Adv. Funct. Mater. 2019, 29, 1808633. [Google Scholar] [CrossRef]
- Labeeb, A.M.; Ibrahim, S.A.; Ward, A.A.; Abd-El-Messieh, S.L. Polymer/liquid crystal nanocomposites for energy storage applications. Polym. Eng. Sci. 2020, 60, 2529–2540. [Google Scholar] [CrossRef]
- Saeed, M.H.; Zhang, S.F.; Cao, Y.P.; Zhou, L.; Hu, J.M.; Muhammad, I.; Xiao, J.M.; Zhang, L.Y.; Yang, H. Recent advances in the polymer dispersed liquid crystal composite and its applications. Molecules 2020, 25, 5510. [Google Scholar] [CrossRef] [PubMed]
- Gridyakina, A.; Kasian, N.; Chychłowski, M.S.; Kajkowska, M.; Lesiak, P. Advances in multicomponent systems: Liquid crystal/nanoparticles/polymer. Mater. Today Phys. 2023, 38, 101258. [Google Scholar] [CrossRef]
- Supreet; Singh, G. Recent advances on cadmium free quantum dots-liquid crystal nanocomposites. Appl. Mater. Today 2020, 21, 100840. [Google Scholar] [CrossRef]
- Priscilla, P.; Malik, P.; Supreet; Kumar, A.; Castagna, R.; Singh, G. Recent advances and future perspectives on nanoparticles-controlled alignment of liquid crystals for displays and other photonic devices. Crit. Rev. Solid State Mater. Sci. 2023, 48, 67–92. [Google Scholar]
- Varshney, D.; Prakash, J.; Singh, G. Indium tin oxide nanoparticles induced tunable dual alignment in nematic liquid crystal. J. Mol. Liq. 2023, 374, 121264. [Google Scholar] [CrossRef]
- Ailincai, D.; Marin, L. Eco-friendly PDLC composites based on chitosan and cholesteryl acetate. J. Mol. Liq. 2021, 321, 114466. [Google Scholar] [CrossRef]
- Sharma, V.; Kumar, P. Electro-optically oriented Kerr and orientational phase study of normal mode polymer dispersed liquid crystals-effect of dispersion of nanoparticles. J. Mol. Liq. 2022, 348, 118030. [Google Scholar] [CrossRef]
- Xu, J.J.; Yu, M.N.; Zou, C.; Zhang, Z.W.; Gao, Y.Z.; Zhu, S.Q.; Yang, H. Effect of different types of mesogenic compounds with fluorine and cyano-group on the working temperature of polymer dispersed liquid crystal films. J. Mol. Liq. 2023, 387, 122629. [Google Scholar] [CrossRef]
- Prusinska-Kurstak, E.; Kolakowska, A.; Klosowicz, S.J. Elastic polymer- dispersed liquid crystal electrooptic transducers. J. Mol. Liq. 2018, 267, 127–130. [Google Scholar] [CrossRef]
- Shivaraja, S.J.; Gupta, R.K.; Manjuladevi, V. Faster switching polymer dispersed liquid crystal devices incorporated with functionalized SWCNTs. J. Mol. Liq. 2022, 354, 118905. [Google Scholar] [CrossRef]
- Kumar, S.; Kang, D.; Nguyen, V.; Nasir, N.; Hong, H.; Kim, M.; Nguyen, D.C.; Lee, Y.J.; Lee, N.; Seo, Y. Application of titanium-carbide MXene-based transparent conducting electrodes in flexible smart windows. ACS. Appl. Mater. Interfaces 2021, 13, 40976–40985. [Google Scholar] [CrossRef] [PubMed]
- Li, Y.; Gong, C.D.; Li, C.G.; Ruan, K.P.; Liu, C.; Liu, H.; Gu, J.W. Liquid crystalline texture and hydrogen bond on the thermal conductivities of intrinsic thermal conductive polymer films. J. Mater. Sci. Technol. 2021, 82, 250–256. [Google Scholar] [CrossRef]
- Deng, Y.; Yang, Y.H.; Xiao, Y.H.; Xie, H.L.; Lan, R.C.; Zhang, L.Y.; Yang, H. Ultrafast switchable passive radiative cooling smart windows with synergistic optical modulation. Adv. Funct. Mater. 2023, 33, 2301319. [Google Scholar] [CrossRef]
- Hu, J.X.; Guan, C.H.; Li, H.X.; Xie, Y.Y.; Zhang, L.Y.; Zheng, J.Q.; Lai, Y.Q.; Zhang, Z. Boosting potassium-storage performance via confining highly dispersed molybdenum dioxide nanoparticles within N-doped porous carbon nano-octahedrons. J. Colloid Interf. Sci. 2022, 607, 1109–1119. [Google Scholar] [CrossRef] [PubMed]
- Zheng, C.; Wu, W.X.; Deng, Q.X.; Li, Y.F.; Wei, M.D. Nanocomposite of ultra-small MoO2 embedded in nitrogen-doped carbon: In situ derivation from an organic molybdenum complex and its superior Li-Ion storage performance. J. Colloid Interf. Sci. 2021, 592, 33–41. [Google Scholar] [CrossRef] [PubMed]
- Bayeh, A.W.; Ou, Y.Y.; Ou, Y.T.; Chang, Y.C.; Chen, H.Y.; Wang, K.C.; Wang, Y.M.; Huang, H.C.; Chiang, T.C.; Kabtamu, D.M.; et al. MoO2-graphene nanocomposite as an electrocatalyst for high-performance vanadium redox flow battery. J. Energy Storage 2021, 40, 102795. [Google Scholar] [CrossRef]
- Choi, C.; Lee, D.Y.; Park, J.B.; Kim, D.W. Separators modified using MoO2@ carbon nanotube nanocomposites as dual-mode Li-polysulfide anchoring materials for high-performance anti-self-discharge lithium-sulfur batteries. ACS Sustain. Chem. Eng. 2020, 8, 15134–15148. [Google Scholar] [CrossRef]
- Li, Y.Y.; Lou, C.F.; Huang, W.L.; Ma, Z.Q.; Lin, S.K.; Xie, X.L.; He, T.H.; Lu, X.K.; Chen, N.R.; Zhuang, J.D. MoO2-C@ MoS2: A unique cocatalyst with LSPR effect for enhanced quasi-full-spectrum photocatalytic hydrogen evolution of CdS. Appl. Catal. B-Environ. 2024, 343, 123543. [Google Scholar] [CrossRef]
- Feng, Y.F.; Wu, K.D.; Ke, J.; Dong, H.F.; Huang, X.P.; Bai, C.; Xiong, D.P.; He, M. Exfoliated graphite nanosheets wrapping on MoO2-SnO2 nanoparticles as a high performance anode material for lithium ion batteries. J. Power Sources 2020, 467, 228357. [Google Scholar] [CrossRef]
- Peng, S.J.; Du, X.F.; Liang, Z.S.; Ma, M.B.; Guo, Y.; Xiong, L.L. Multilayer polymer nanocomposites based on interface engineering for high-performance capacitors. J. Energy. Storage 2023, 60, 106636. [Google Scholar] [CrossRef]
- Fu, H.B.; Jiang, Y.; Lv, J.; Huang, Y.; Gai, Z.P.; Liu, Y.; Lee, P.S.; Xu, H.; Wu, D.M. Multilayer dielectric elastomer with reconfigurable electrodes for artificial muscle. Adv. Sci. 2023, 10, 2206094. [Google Scholar] [CrossRef]
- Cai, F.; Zhou, Q.; Chen, J.K.; Zhang, S.H. Effect of inserting the Zr layers on the tribo-corrosion behavior of Zr/ZrN multilayer coatings on titanium alloys. Corros. Sci. 2023, 213, 111002. [Google Scholar] [CrossRef]
- Huang, S.; Zhang, H.; Sheng, J.; Agyenim-Boateng, E.; Wang, C.; Yang, H.W.; Jiang, G.Q.; Zhou, J.Z.; Lu, J.Z.; Zhang, J.H. Digital light processing 4D printing multilayer polymers with tunable mechanical properties and shape memory behavior. Chem. Eng. J. 2023, 465, 142830. [Google Scholar] [CrossRef]
- Cohen, A.J.; Kollosche, M.; Yuen, M.C.; Lee, D.Y.; Clarke, D.R.; Wood, R.J. Batch-sprayed and stamp-transferred electrodes: A new paradigm for scalable fabrication of multilayer dielectric elastomer actuators. Adv. Funct. Mater. 2022, 32, 2205394. [Google Scholar] [CrossRef]
- Feng, G.H.; Yao, X.Y.; Yu, Y.L.; Li, H.J. Synthesis and performance characterization of Hafnium-based multilayer coating applied over carbon/carbon composites with sharp leading edge. J. Mater. Sci. Technol. 2023, 153, 254–262. [Google Scholar] [CrossRef]


| Sample | Weight Percentage (wt%) | ||
|---|---|---|---|
| SLC1717 | UV65N | PEGDA200 | |
| Group A | |||
| a1 | 50 | 50 | 0 |
| a2 | 50 | 49 | 1 |
| a3 | 50 | 48 | 2 |
| a4 | 50 | 47 | 3 |
| a5 | 50 | 46 | 4 |
| a6 | 50 | 45 | 5 |
| Sample | UV Light Intensity (mW/cm2) | MoO2 Nanoparticles Content (wt%) |
|---|---|---|
| Group B | ||
| b1 | 1.5 | 0 |
| b2 | 3.0 | 0 |
| b3 | 4.5 | 0 |
| b4 | 6.0 | 0 |
| b5 | 7.5 | 0 |
| b6 | 9.0 | 0 |
| Group C | ||
| c1 | 6.0 | 0.2 |
| c2 | 6.0 | 0.4 |
| c3 | 6.0 | 0.6 |
| c4 | 6.0 | 0.8 |
| c5 | 6.0 | 1.0 |
| c6 | 6.0 | 1.2 |
Disclaimer/Publisher’s Note: The statements, opinions and data contained in all publications are solely those of the individual author(s) and contributor(s) and not of MDPI and/or the editor(s). MDPI and/or the editor(s) disclaim responsibility for any injury to people or property resulting from any ideas, methods, instructions or products referred to in the content. |
© 2024 by the authors. Licensee MDPI, Basel, Switzerland. This article is an open access article distributed under the terms and conditions of the Creative Commons Attribution (CC BY) license (https://creativecommons.org/licenses/by/4.0/).
Share and Cite
Wu, Y.; Zhao, Y.; Wang, D. Preparation of Progressive Driving Bilayer Polymer-Dispersed Liquid Crystals Possessing a PDLC-PVA-PDLC Structure. Molecules 2024, 29, 508. https://doi.org/10.3390/molecules29020508
Wu Y, Zhao Y, Wang D. Preparation of Progressive Driving Bilayer Polymer-Dispersed Liquid Crystals Possessing a PDLC-PVA-PDLC Structure. Molecules. 2024; 29(2):508. https://doi.org/10.3390/molecules29020508
Chicago/Turabian StyleWu, Yongle, Yuzhen Zhao, and Dong Wang. 2024. "Preparation of Progressive Driving Bilayer Polymer-Dispersed Liquid Crystals Possessing a PDLC-PVA-PDLC Structure" Molecules 29, no. 2: 508. https://doi.org/10.3390/molecules29020508
APA StyleWu, Y., Zhao, Y., & Wang, D. (2024). Preparation of Progressive Driving Bilayer Polymer-Dispersed Liquid Crystals Possessing a PDLC-PVA-PDLC Structure. Molecules, 29(2), 508. https://doi.org/10.3390/molecules29020508