

Sample Preparation Techniques for Growth-Promoting Agents in Various Mammalian Specimen Preceding MS-Analytics


Abstract
1. Introduction
2. Methods
3. Beta-2 Agonists
3.1. Matrices Analytically Examined
3.2. Solid Phase Extraction
3.3. Liquid–Liquid Extraction
3.4. Alternative Sample Preparations
3.5. Detection Methods
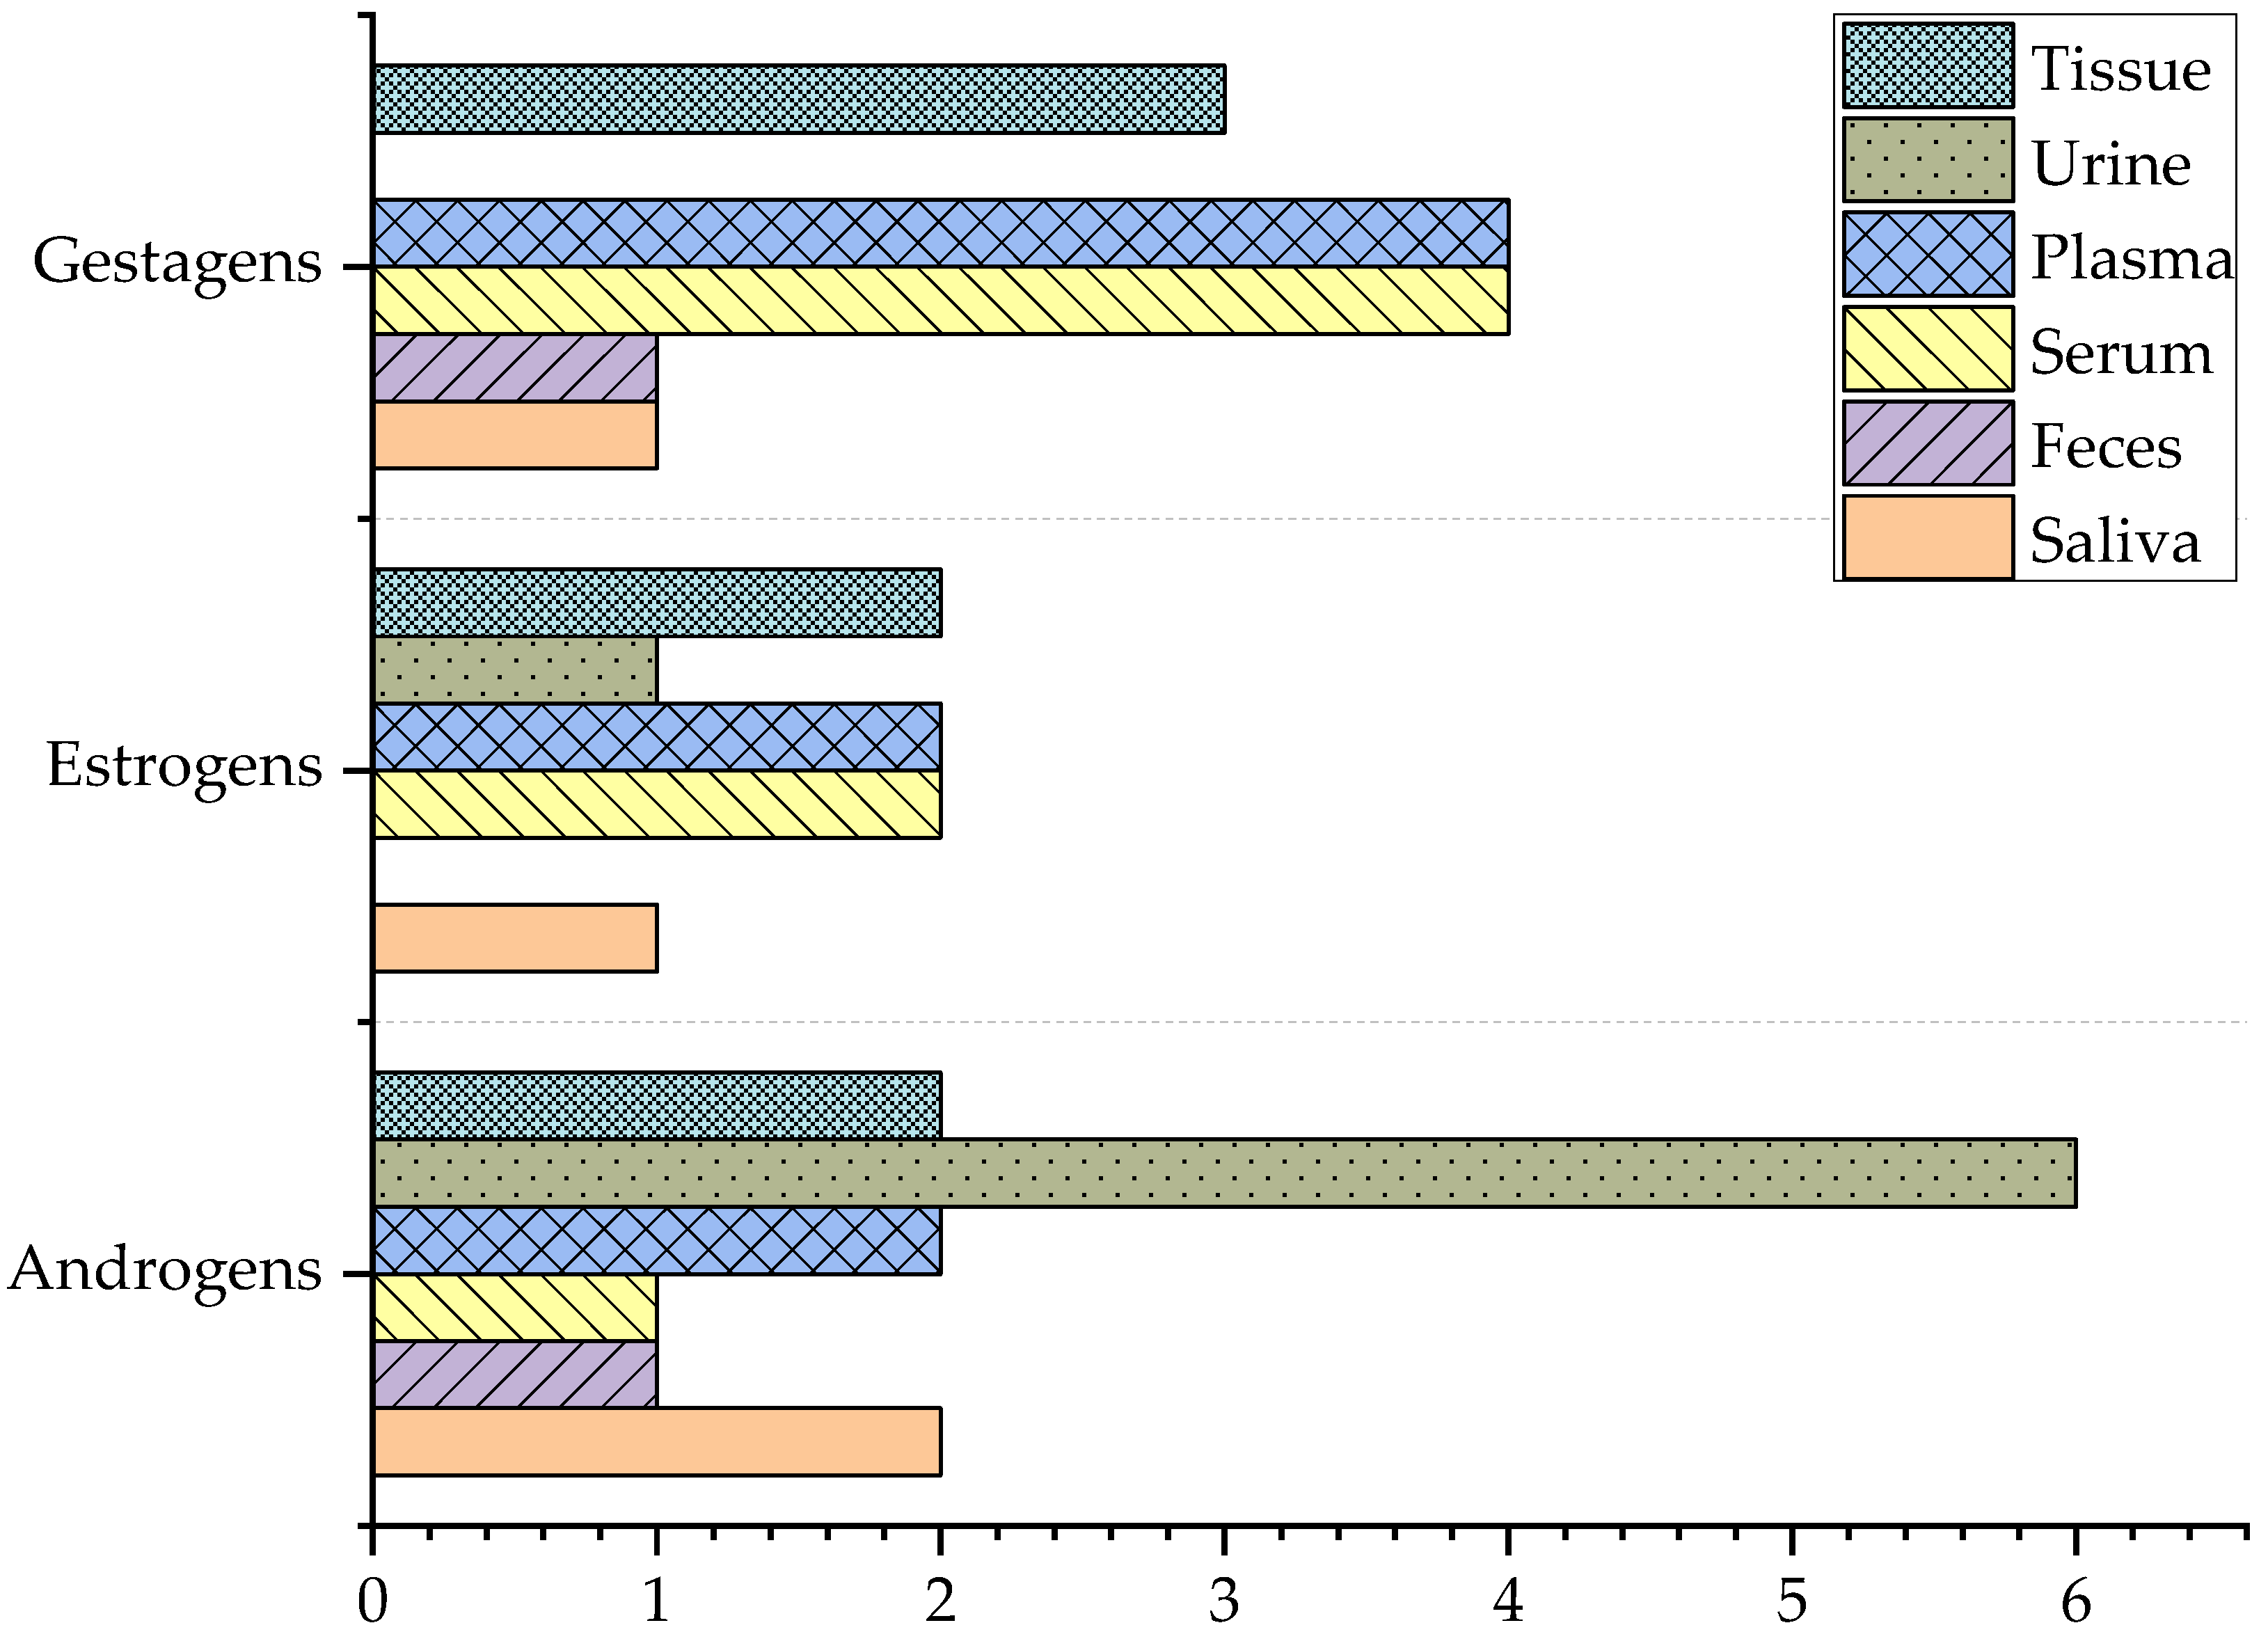
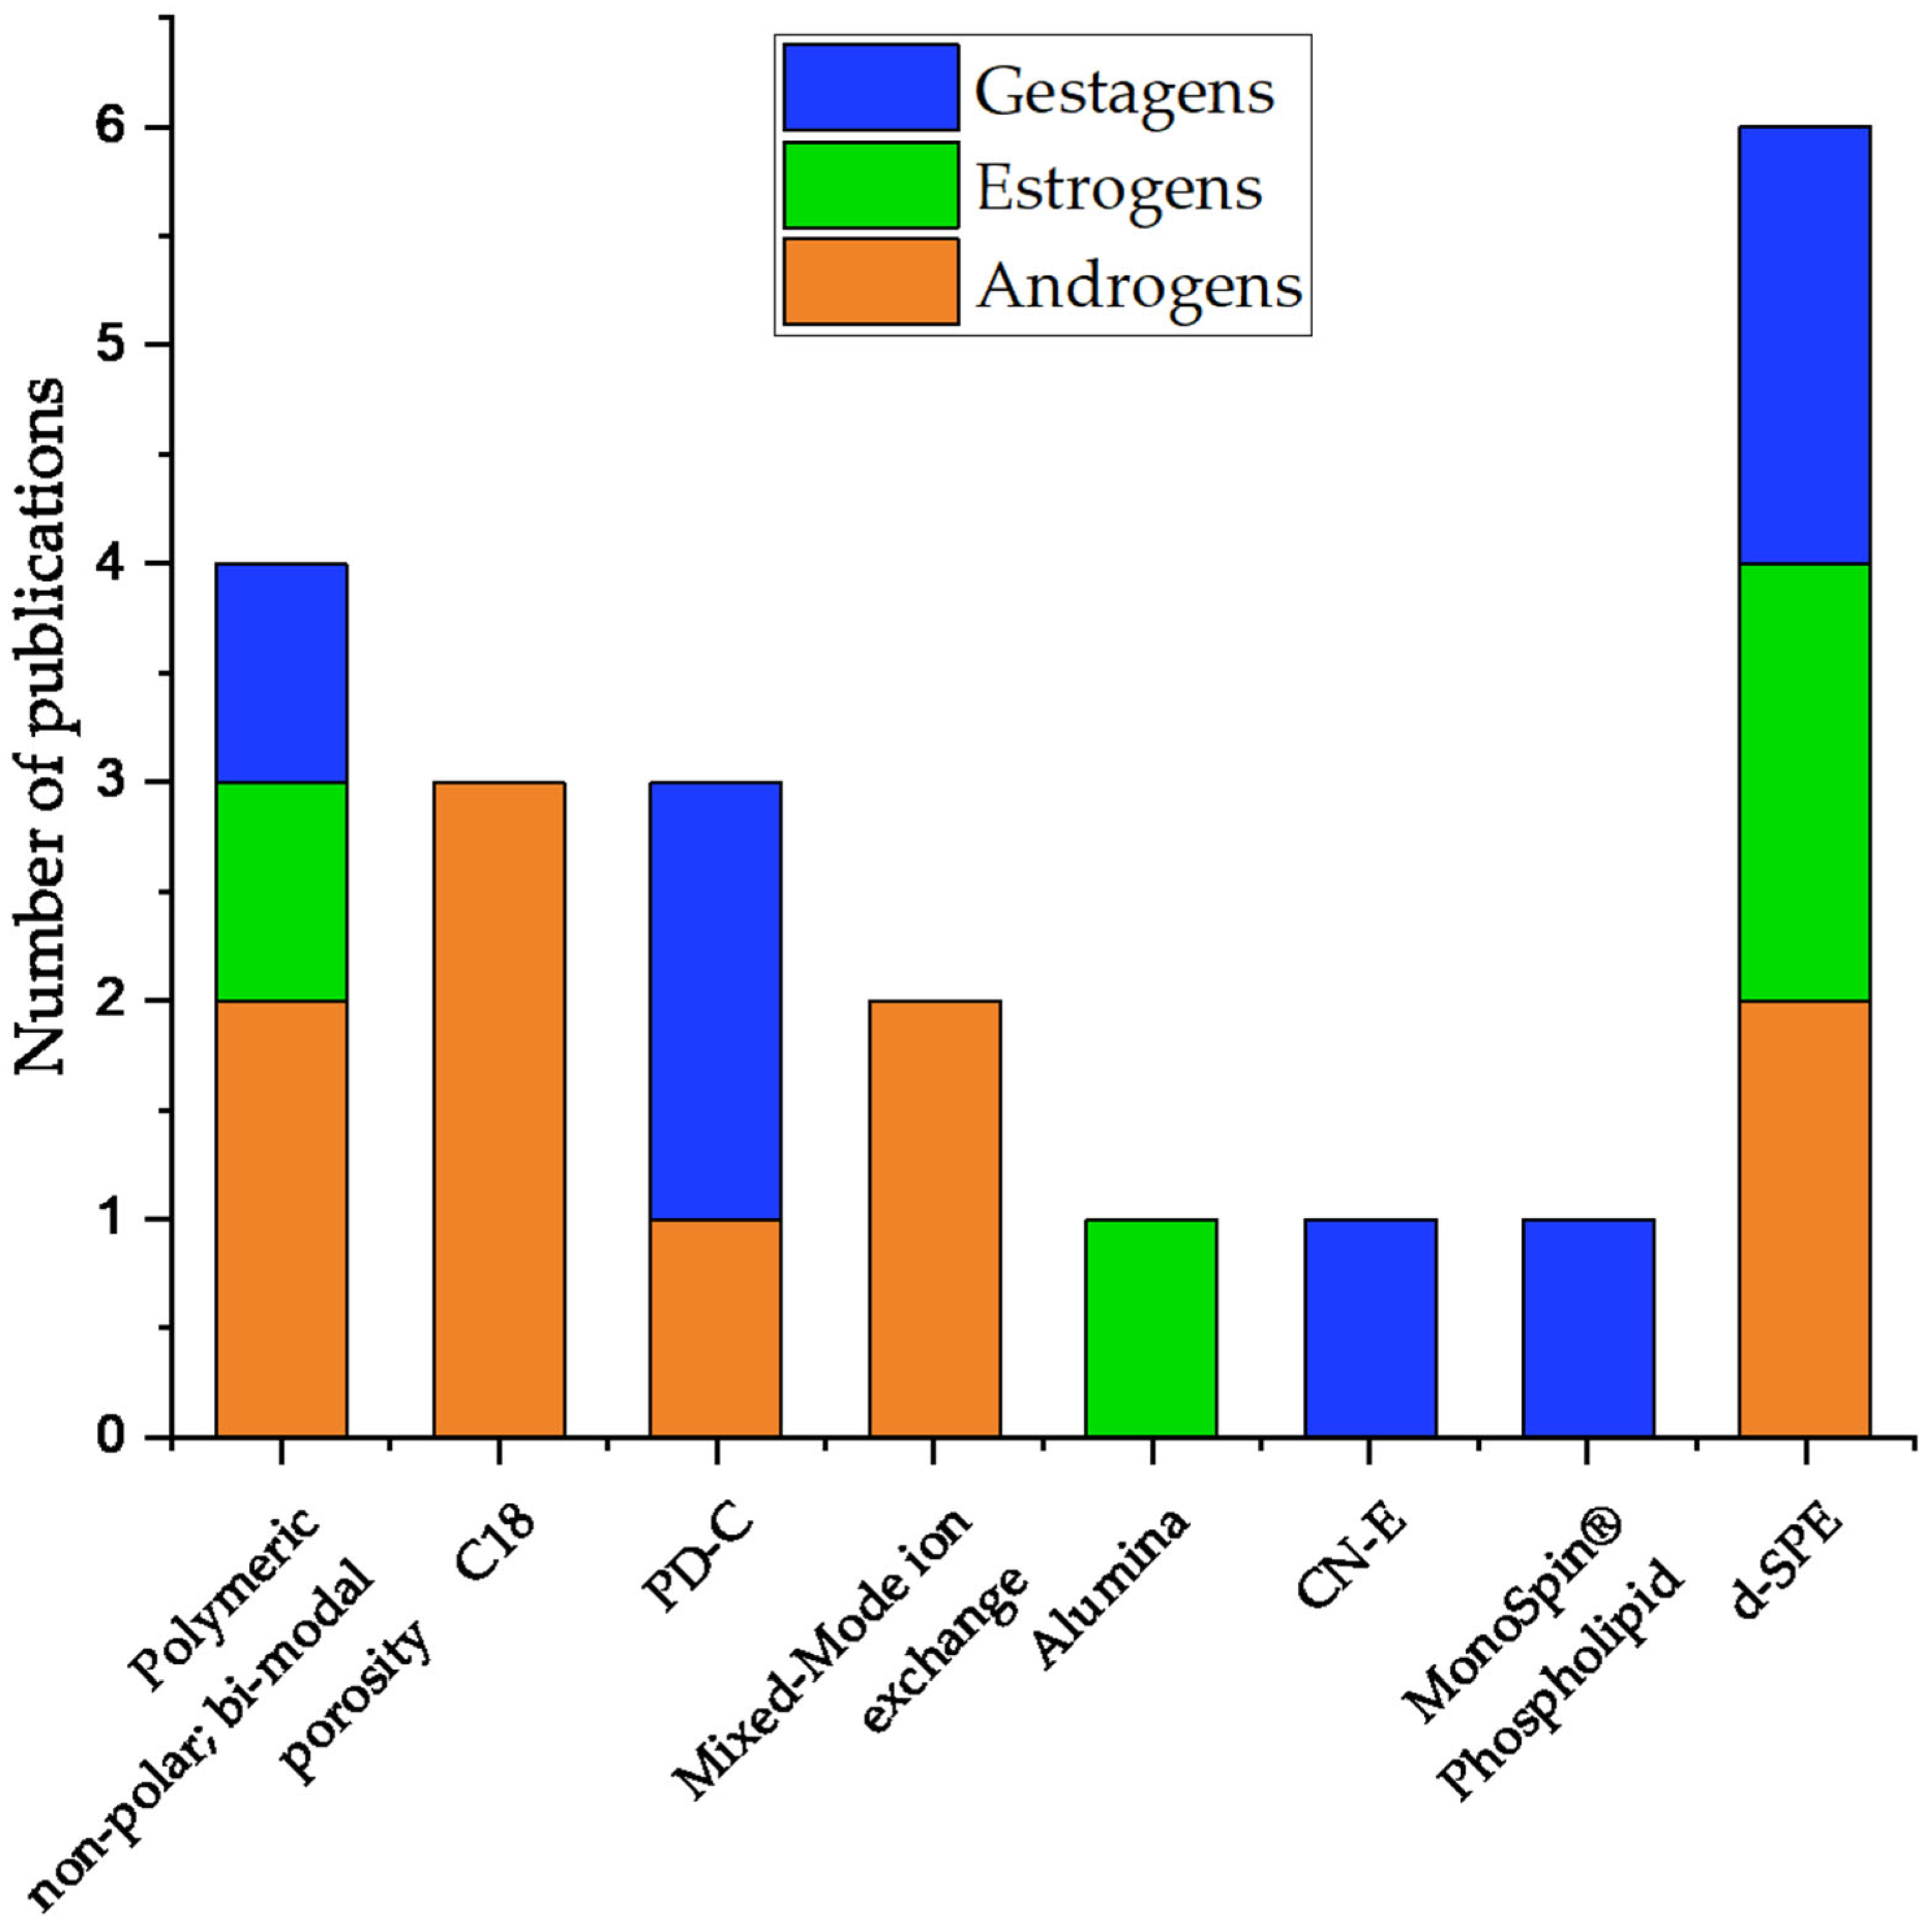
4. Steroids
4.1. Androgens
4.2. Estrogens
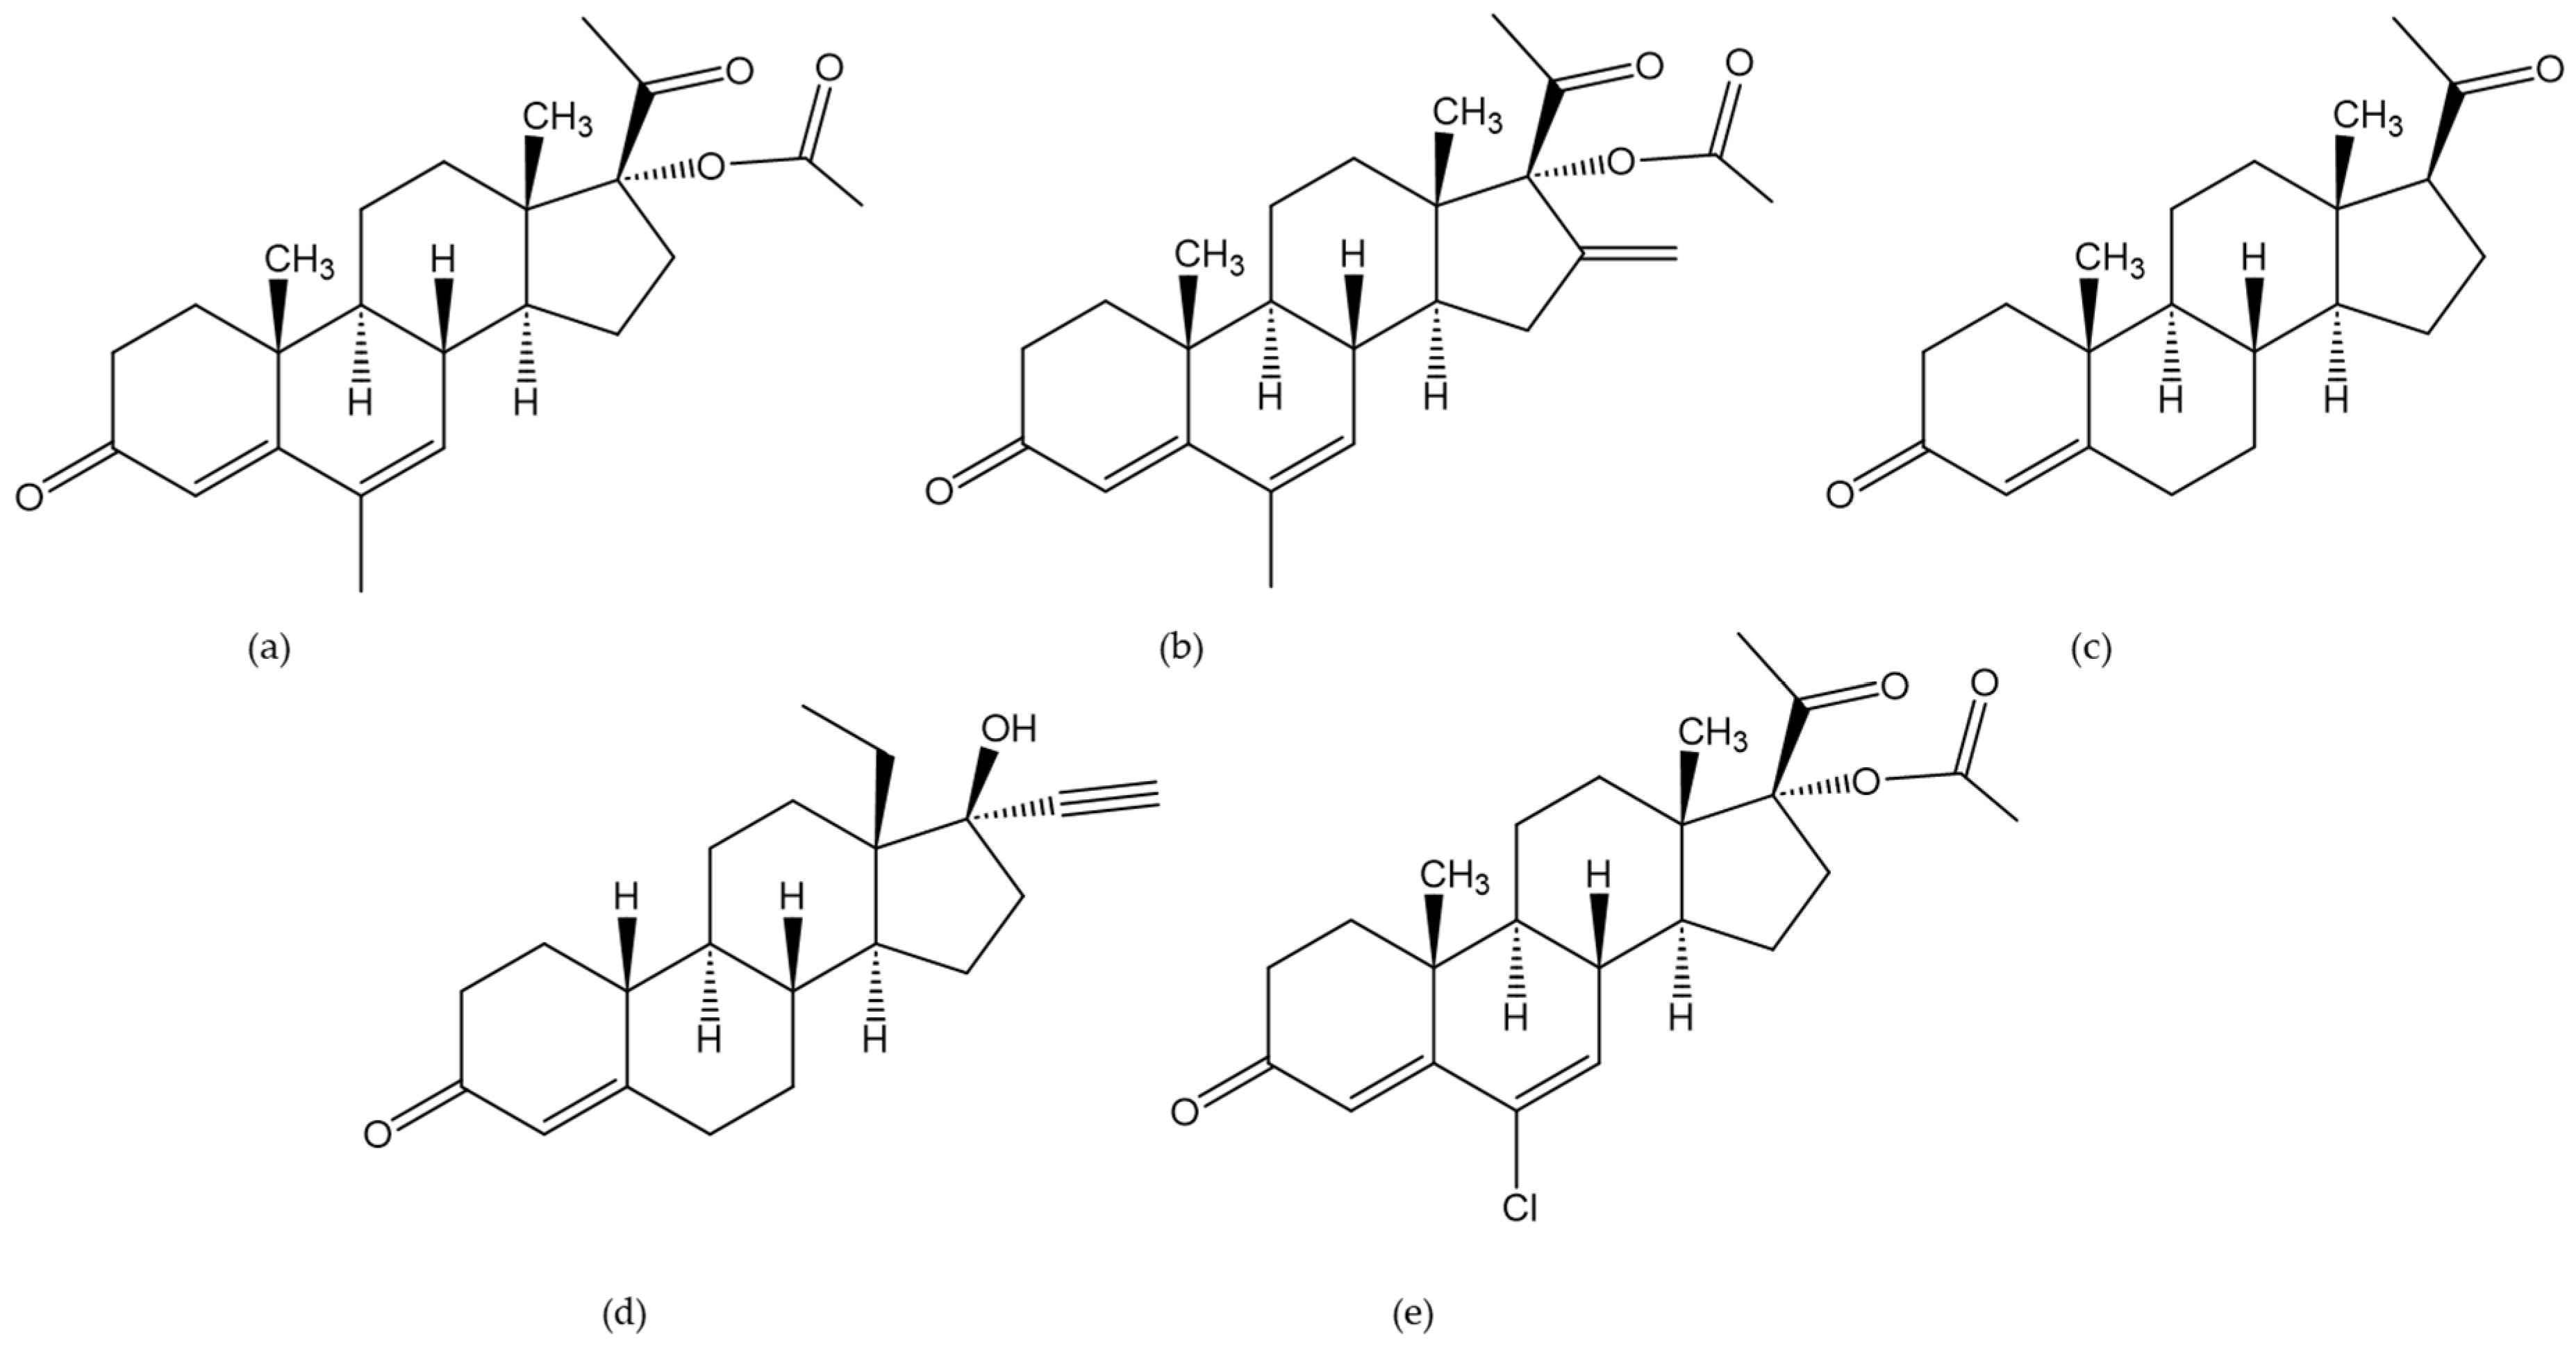
4.3. Gestagens

| Analytes | CAS Number | Homogenization | Extraction | SPE Phase | Matrix | Species | Detection Method | LOD [ng/mL] | LOQ [ng/mL] | References |
|---|---|---|---|---|---|---|---|---|---|---|
| Progesterone * | 57-83-0 | n.a. | Protein precipitation SPE | MonoSpin® Phospholipid | Serum | Dog | LC-TQ | 0.002 | 0.007 | [66] |
| 17α-OH-progesterone | 68-96-2 | 0.002 | 0.005 | |||||||
| Progesterone * | 57-83-0 | n.a. | SPE | PD-C | Plasma, serum | Deer, cattle, elephants | LC-Q Exactive hybrid Q-Orbitrap | 0.005 | 0.05 | [68] |
| Progesterone * | 57-83-0 | n.a. | SPE | PD-C | Plasma | Cattle | LC-QExactive | 0.005 | 0.02 | [67] |
| Progesterone | 57-83-0 | Cut into cubes, scintillation; polytron mixer; (2 g/5 mL ACN), horizontal shaker | SPE | CN-E | Liver, fat | Bovine | LC-TQ | n.a. | n.a. | [71] |
| Melengestrol acetate | 2919-66-6 | 0.11 | ||||||||
| Megestrol acetate | 595-33-5 | 0.048 | ||||||||
| Chlormadinone acetate | 302-22-7 | 0.17 | ||||||||
| Progesterone * (underivatized) | 57-83-0 | Omni homogenizer (1 g/10 mL 50 mM TRIS buffer pH 7.4) | SPE | Polymeric non-polar; bi-modal porosity | Testes | Horse | LC-QExactive hybrid Q Orbitrap | 1 | n.a. | [54] |
| 17α-OH-progesterone (underivatized) | 68-96-2 | |||||||||
| Progesterone (derivatized) | 0.1 | |||||||||
| 17α-OH-progesterone (derivatized) | ||||||||||
| Progesterone * | 57-83-0 | Drying followed by rough grounding through sieves | d-SPE | QuEChERs dSPE EMR-Lipid tube | Feces | Pig, cattle, chicken | LC-QToF | 1.3 | 2.5 | [50] |
| Melengestrol acetate | 2919-66-6 | 5.0 | 12.5 | |||||||
| Megestrol acetate | 595-33-5 | 2.5 | 12.5 | |||||||
| Progesterone * | 57-83-0 | Meat grinder (twice) | d-SPE | QuEChERs Kit: PSA | Liver, bile, kidney | Bovine | LC-TQ | n.a. | n.a. | [48] |
| shaking | [49] | |||||||||
| Melengestrol acetate | 2919-66-6 | Meat grinder (twice) | [48] | |||||||
| shaking | [49] | |||||||||
| Progesterone * | 57-83-0 | Centrifugation | Centrifugation | n.a. | Serum | Bison | LC-Qtrap | 0.1 | n.a. | [62] |
| Progesterone * | 57-83-0 | Centrifugation | Extraction with organic solvent | n.a. | Serum | Bison | LC-Qtrap | n.a. | 0.1 | [63] |
| C21-, C19-, and C20 steroids | 57-83-0, 566-65-4, 128-23-4, 145-14-2, 145-15-3, 68-96-2, 438-07-3, | Centrifuged, on ice | Extracted with organic solvent | n.a. | Saliva | Boar | GC-MS/MS | n.a. | n.a. | [60] |
| Progesterone | 57-83-0 | n.a. | Protein precipitation | n.a. | Plasma | Minipig | LC-QTrap | n.a. | 0.25 | [69] |
| Levonorgestrel | 797-63-7 | n.a. | Protein precipitation | n.a. | Plasma | Dog | LC-TQ | n.a. | 0.5 | [70] |
4.4. Chromatography and Detection Methods
5. Conclusions
Author Contributions
Funding
Institutional Review Board Statement
Informed Consent Statement
Conflicts of Interest
Abbreviations
| ACN | Acetonitril |
| APCI | Atmospheric pressure chemical ionization |
| APPI | Atmospheric pressure photo ionization |
| ASAP | Atmospheric solid analysis probe |
| BA | Beta-2 agonists |
| BSTFA | N,O-Bis(trimethylsilyl)trifluoroacetamide |
| CCα | Decision limit |
| CCβ | Detection capability |
| CN-E | Cyanopropyl endcapped |
| DESI | Desorption electrospray ionization |
| DHEA | Dehydroepiandrosterone |
| d-SPE | Disperse SPE |
| E1 | Estrone |
| E2 | Estradiol |
| E3 | Estratriol |
| EME | Electro membrane extraction |
| EMR-L | Enhanced matrix removal-lipid |
| ESI | Electrospray ionization |
| FA | Formic acid |
| GC | Gas chromatography |
| HESI | Heated electrospray ionization |
| HLB | Hydrophilic lipophilic balanced |
| LC | Liquid chromatography |
| LLE | Liquid–liquid extraction |
| LOD | Limit of detection |
| LOQ | Limit of quantitation |
| MALDI | Matrix-assisted laser desorption ionization |
| mixed-mode CX | Mixed-mode cation exchange |
| MO | Methoxime |
| MRM | Multiple reaction monitoring |
| MS | Mass spectrometry |
| NSAID | Non-steroidal anti-inflammatory drug |
| n.a. | Not applicable |
| PFBCl | 2,3,4,5,6-Pentafluorobenzoyl chloride |
| PRM | Parallel reaction monitoring |
| PSA | Primary secondary amine |
| TQ | Triple quadrupole |
| QToF | Quadrupole time-of-flight |
| QuEChERs | Quick, easy, cheap, rugged, effective, and safe |
| RS | Rapid screening |
| SPE | Solid phase extraction |
| SRM | Selected reaction monitoring |
| SupelTM-Select HLB | Hydrophilic modified styrene polymer |
| TBME | t-butyl-methyl ether |
| TFA | Trifluoro acetic acid |
| TMCS | Trimethylchlorosilane |
| tSIM | Targeted single ion monitoring |
| β-glc | β-glucuronidase |
Appendix A
| Chromatography | Ionization | Detection | Monitoring Mode | Column | Temperature [°C] | Flow Rate [mL/min] | Mobile Phase A | Mobile Phase B | Reference |
|---|---|---|---|---|---|---|---|---|---|
| LC | ESI+− | TQ | MRM | C18 (100 mm × 2.1 mm, 3.5 µm) | 30 | 0.3 | 5 mM ammonium acetate in water | ACN | [48] |
| LC | ESI+− | TQ | MRM | C 18 (100 mm × 2.1 mm, 3.5 µm) | 35 | 0.3 | 5 mM ammonium acetate in water | ACN | [49] |
| LC | ESI+ | TQ | SRM | HSS T3 (100 mm × 2.1 mm, 1.8 µm) | 60 | 0.4 | 0.1% FA in water | 0.1% FA in MeOH | [54]. |
| LC | ESI+ | TQ | SRM | C18 (100 mm × 2.1 mm, 1.7 µm) | 55 | 0.3 | 0.1% FA in water | 0.1% FA in ACN | [58] |
| LC | ESI+ | QToF | Scan MR | C18 (150 mm × 3.0 mm, 1.8 µm) | 40 | 0.4 | 0.2% FA, 2 mM ammonium acetate in water | 0.2% FA in MeOH | [50] |
| LC | ESI− | Q-Exactive | PRM | Raptor C18 (150 mm × 3.0 mm, 2.7 µm) | 45 | 0.6 | 0.1% FA in water | 0.1% FA in MeOH | [52] |
| LC | HESI− | Q-Exactive | PRM | Raptor C18 (150 mm × 3.0 mm, 2.7 µm) | 45 | 0.6 | 0.1% FA in water | 0.1% FA in MeOH | [55] |
| LC-HRMS | HESI+ | QExactive Focus Hybrid Quadrupole-Orbitrap | Full scan mode | T3 (100 mm × 2.1 mm, 3 µm) | 40 | n.a. | 0.1% acetic acid in water | 0.1% acetic acid ACN | [54]. |
| LC | HESI+− | Orbitrap | n.a. | C18 (100 mm × 3.0 mm, 2.7 µm) | n.a. | n.a. | 0.1% FA in water | MeOH | [56] |
| LC | HESI+− | Orbitrap | n.a. | C18 (100 mm × 3.0 mm, 2.7 µm) | n.a. | 0.6 | 0.1% FA in water | MeOH | [57] |
| LC | APCI | Q-Trap | MRM | C18 (100 mm × 2.1 mm, 1.7 µm) | 60 | 0.4 | 0.1% FA in water | 0.1% FA in MeOH | [51] |
| Chromatography | Ionization | Detection | Monitoring Mode | Column | Temperature [°C] | Flow Rate [mL/min] | Mobile Phase A | Mobile Phase B | Reference |
|---|---|---|---|---|---|---|---|---|---|
| LC | ESI− | TQ | MRM | XDB-Phenyl (50 mm × 2.1 mm, 5 µm) | 45 | 0.6 | 5 mM ammonium fluoride aq | MeOH | [61] |
| LC | ESI+− | QTrap | MRM | C18 (100 mm × 2.1 mm, 1.7 µm) | n.a. | 0.4 | 0.02% NH4OH in water | ACN | [62] |
| LC | ESI+− | QTrap | MRM | C18 (100 mm × 2.1 mm, 1.7 µm) | n.a. | 0.4 | 0.02% NH4OH aq | ACN | [63] |
| Chromatography | Ionization | Detection | Monitoring Mode | Column | Temperature [°C] | Flow Rate [mL/min] | Mobile Phase A | Mobile Phase B | Reference |
|---|---|---|---|---|---|---|---|---|---|
| LC | ESI+ | TQ | MRM | Biphenyl (100 mm × 2.1 mm, 1.7 µm) and trap column Unison UK-C1 HT (10 mm × 4.6 mm, 3 µm) | n.a. | 0.4, 0.8, 0.4 | Pump A MeOH/water | Pump B, 50% ammonium fluoride in water/50% ammonium fluoride in MeOH | [66] |
| LC | HESI+ | TQ | SRM | C18 (50 mm × 2.1 mm, 1.7 µm) | 45 | 0.4 | 0.1% FA in water | MeOH | [71] |
| LC | ESI+ | QExactive | tSIM | HSS T3 (100 mm × 2.1 mm, 1.8 µm) and HSS T3 VanGuard pre-column (5 mm × 2.1 mm, 1.8 µm) | n.a. | 0.45 | 0.1% FA in water | 0.1% FA in ACN | [67] |
| LC | ESI+ | Q Exactive hybrid quadrupole-Orbitrap | PRM, full scan, tSIM (most sensitive) | HSS T3 (100 mm × 2.1 mm, 1.8 µm) and HSS T3 Van Guard pre-column (2.1 mm × 5 mm, 1.8 µm) and guard filter (0.2 µm, 2.1 mm) | 25 | 0.45 | 0.1% FA in water | 0.1% FA inACN | [68] |
| LC | ESI+ | QTrap | MRM | Kinetex C18 (30 mm × 3 mm, 2.6 µm) | 25 | 0.8 | 0.1% FA in water | 0.1% FA in MeOH | [70] |
| LC | ESI+ | QTrap | MRM | C18 (50 mm × 3 mm, 2.6 µm) | 40 | 0.7 | 0.1% FA in water | 0.1% FA in ACN | [69] |
References
- Nationale Berichterstattung an die EU 2020, Jahresbericht 2020 zum Nationalen Rückstandskontrollplan (NRKP) und Einfuhrüberwachungsplan (EÜP). Available online: https://www.bvl.bund.de/SharedDocs/Berichte/05_Weitere_Berichte_LM_Sicherheit/Berichte_zur_Lebensmittelsicherheit_2020.pdf?__blob=publicationFile&v=3 (accessed on 3 November 2023).
- Rechsteiner, D.; Wettstein, F.E.; Warren, B.P.; Vermeirssen, E.L.M.; Simon, E.; Schneider, M.K.; Hollender, J.; Bucheli, T.D. Natural estrogens in surface waters of a catchment with intensive livestock farming in Switzerland. Environ. Sci. Process. Impacts 2020, 22, 2244–2255. [Google Scholar] [CrossRef] [PubMed]
- Herrero-Villar, M.; Taggart, M.A.; Mateo, R. Medicated livestock carcasses and landfill sites: Sources of highly toxic veterinary pharmaceuticals and caffeine for avian scavengers. J. Hazard. Mater. 2023, 459, 132195. [Google Scholar] [CrossRef] [PubMed]
- Sutaswiriya, N.; Homklin, S.; Kreetachat, T.; Vaithanomsat, P.; Kreetachat, N. Monitoring estrogen and androgen residues from livestock farms in Phayao Lake, Thailand. Environ. Monit. Assess. 2021, 193, 812. [Google Scholar] [CrossRef]
- Zheng, W.; Yoo, K.H.; Choi, J.M.; Park, D.H.; Kim, S.K.; Kang, Y.S.; Abd El-Aty, A.M.; Hacımüftüoğlu, A.; Wang, J.; Shim, J.H.; et al. Residual detection of naproxen, methyltestosterone and 17α-hydroxyprogesterone caproate in aquatic products by simple liquid-liquid extraction method coupled with liquid chromatography-tandem mass spectrometry. Biomed. Chromatogr. 2019, 33, e4396. [Google Scholar] [CrossRef] [PubMed]
- Shelver, W.L.; McGarvey, A.M. Assessment of veterinary drugs present in pork kidney from a Midwest US retail market. Food Addit. Contam. A 2019, 36, 571–581. [Google Scholar] [CrossRef] [PubMed]
- Walpurgis, K.; Thomas, A.; Geyer, H.; Mareck, U.; Thevis, M. Dietary Supplement and Food Contaminations and Their Implications for Doping Controls. Foods 2020, 9, 1012. [Google Scholar] [CrossRef]
- Parr, M.K.; Opfermann, G.; Schanzer, W. Analytical methods for the detection of clenbuterol. Bioanalysis 2009, 1, 437–450. [Google Scholar] [CrossRef]
- Van Peteghem, C.; De Sagher, R. Influence of the consumption of meat contaminated with anabolic steroids on doping tests. Anal. Chim. Acta 1993, 275, 49–56. [Google Scholar]
- He, G.; Sheng, L.; Zhang, J.; Wu, Y.; Zhao, X.; Xu, Y.; Lu, J. Enantiomeric analysis of clenbuterol in Chinese people by LC-MS/MS to distinguish doping abuse from meat contamination. Bioanalysis 2020, 12, 783–790. [Google Scholar] [CrossRef]
- Parr, M.K.; Blokland, M.H.; Liebetrau, F.; Schmidt, A.H.; Meijer, T.; Stanic, M.; Kwiatkowska, D.; Waraksa, E.; Sterk, S.S. Distinction of clenbuterol intake from drug or contaminated food of animal origin in a controlled administration trial-the potential of enantiomeric separation for doping control analysis. Food Addit. Contam. A 2017, 34, 525–535. [Google Scholar] [CrossRef]
- Dolores, H.M.; Villasenor, A.; Pina, O.S.; Mercado Marquez, C.; Bejarano, B.V.; Bonaparte, M.E.G.; Lopez-Arellano, R. Evaluation of R- (−) and S- (+) Clenbuterol enantiomers during a doping cycle or continuous ingestion of contaminated meat using chiral liquid chromatography by LC-TQ-MS. Drug Test. Anal. 2019, 11, 1238–1247. [Google Scholar] [CrossRef] [PubMed]
- Moreira, F.; Carmo, H.; Guedes De Pinho, P.; Bastos, M.D.L. Doping detection in animals: A review of analytical methodologies published from 1990 to 2019. Drug Test. Anal. 2021, 13, 474–504. [Google Scholar] [CrossRef] [PubMed]
- Racing New South Wales, Annual Report 2022. Available online: https://www.parliament.nsw.gov.au/tp/files/83487/Racing%20NSW%20Annual%20Report%202022.pdf (accessed on 20 November 2023).
- Racing New South Wales, Annual Report 2019. Available online: https://www.racingnsw.com.au/wp-content/uploads/AR-Book-24-October-FINAL.pdf (accessed on 20 November 2023).
- Racing New South Wales, Annual Report 2018. Available online: https://www.racingnsw.com.au/wp-content/uploads/RNSW-AR18-web.pdf (accessed on 20 November 2023).
- Lehotay, S.J. QuEChERS sample preparation approach for mass spectrometric analysis of pesticide residues in foods. Methods Mol. Biol. 2011, 747, 65–91. [Google Scholar] [CrossRef] [PubMed]
- Decision Commission 2002/657/EC. Available online: https://eur-lex.europa.eu/legal-content/EN/ALL/?uri=CELEX%3A32002D0657 (accessed on 17 December 2023).
- Van Loco, J.; Janosi, A.; Impens, S.; Fraselle, S.; Cornet, V.; Degroodt, J.M. Calculation of the decision limit (CCalpha) and the detection capability (CCbeta) for banned substances: The imperfect marriage between the quantitative and the qualitative criteria. Anal. Chim. Acta 2007, 586, 8–12. [Google Scholar] [CrossRef] [PubMed]
- Padrid, P. Use of inhaled medications to treat respiratory diseases in dogs and cats. J. Am. Anim. Hosp. Assoc. 2006, 42, 165–169. [Google Scholar] [CrossRef]
- Mersmann, H.J. Overview of the effects of beta-adrenergic receptor agonists on animal growth including mechanisms of action. J. Anim. Sci. 1998, 76, 160–172. [Google Scholar] [CrossRef] [PubMed]
- Prezelj, A.; Obreza, A.; Pecar, S. Abuse of clenbuterol and its detection. Curr. Med. Chem. 2003, 10, 281–290. [Google Scholar] [CrossRef] [PubMed]
- Centner, T.J.; Alvey, J.C.; Stelzleni, A.M. Beta agonists in livestock feed: Status, health concerns, and international trade. J. Anim. Sci. 2014, 92, 4234–4240. [Google Scholar] [CrossRef]
- European Comission Council Directive 96/22/EC. Available online: https://eur-lex.europa.eu/legal-content/EN/ALL/?uri=CELEX%3A31996L0022 (accessed on 9 November 2023).
- PubChem, Salbutamol. Available online: https://pubchem.ncbi.nlm.nih.gov/compound/2083#section=Chemical-and-Physical-Properties (accessed on 2 December 2023).
- PubChem, Ractopamine. Available online: https://pubchem.ncbi.nlm.nih.gov/compound/56052#section=Chemical-and-Physical-Properties (accessed on 2 December 2023).
- Yikilmaz, Y.; Kuzukiran, O.; Erdogan, E.; Sen, F.; Kirmizibayrak, O.; Filazi, A. The determination of β-agonist residues in bovine tissues using liquid chromatography–tandem mass spectrometry. Biomed. Chromatogr. 2020, 34, e4926. [Google Scholar] [CrossRef]
- Hajrulai-Musliu, Z.; Uzunov, R.; Jovanov, S.; Musliu, D.; Dimitrieska-Stojkovikj, E.; Stojanovska-Dimzoska, B.; Angeleska, A.; Stojkovski, V.; Sasanya, J.J. Multi-class/residue method for determination of veterinary drug residues, mycotoxins and pesticide in urine using LC-MS/MS technique. BMC Vet. Res. 2023, 19, 156. [Google Scholar] [CrossRef]
- Aroeira, C.N.; Feddern, V.; Gressler, V.; Molognoni, L.; Daguer, H.; Dalla Costa, O.A.; De Lima, G.J.M.M.; Contreras-Castillo, C.J. Determination of ractopamine residue in tissues and urine from pig fed meat and bone meal. Food Addit. Contam. Part. A 2019, 36, 424–433. [Google Scholar] [CrossRef] [PubMed]
- Li, F.; Zhou, J.; Wang, M.; Zhang, L.; Yang, M.; Deng, L. Production of a matrix certified reference material for measurement and risk monitoring of clenbuterol in mutton. Anal. Bioanal. Chem. 2023, 415, 1487–1496. [Google Scholar] [CrossRef] [PubMed]
- Dolores-Hernandez, M.; Morales-Hipolito, E.A.; Villasenor, A.; Lopez-Arellano, R. Determination of zilpaterol in a residue depletion study using LC-MS/MS in cattle plasma, muscle, liver and kidney. Food Chem. 2022, 382, 132287. [Google Scholar] [CrossRef] [PubMed]
- Chakrabarty, S.; Shelver, W.L.; Smith, D.J. Electrospray Ionization Inlet Tandem Mass Spectrometry: A Hyphenated Method for the Sensitive Determination of Chemicals in Animal Tissues and Body Fluids. J. Am. Soc. Mass. Spectr. 2021, 32, 14–20. [Google Scholar] [CrossRef] [PubMed]
- Jung, Y.S.; Kim, D.B.; Nam, T.G.; Seo, D.; Yoo, M. Identification and quantification of multi-class veterinary drugs and their metabolites in beef using LC-MS/MS. Food Chem. 2022, 382, 132313. [Google Scholar] [CrossRef] [PubMed]
- Chakrabarty, S.; Shelver, W.L.; Smith, D.J. Electrospray ionization rapid screening sans liquid chromatography column: A sensitive method for detection and quantification of chemicals in animal tissues and urine. Rapid Commun. Mass. Spectrom. 2020, 34, e8876. [Google Scholar] [CrossRef] [PubMed]
- Davis, H.E.; Badger, C.D.; Brophy, P.; Geornaras, I.; Burnett, T.J.; Scanga, J.; Belk, K.; Prenni, J. Quantification of ractopamine residues on and in beef digestive tract tissues. J. Anim. Sci. 2019, 97, 4193–4198. [Google Scholar] [CrossRef]
- Gao, H.; Chen, M.; Gao, H.; Gao, S.; Liu, X.; Du, R.; Wang, F.; Wang, Y.; Wan, L. Determination of ractopamine residue in animal derived foods using electromembrane extraction followed by liquid chromatography tandem mass spectrometry. J. Chromatogr. A 2022, 1675, 463179. [Google Scholar] [CrossRef]
- Chakrabarty, S.; Shelver, W.L.; Hakk, H.; Smith, D.J. Atmospheric Solid Analysis Probe and Modified Desorption Electrospray Ionization Mass Spectrometry for Rapid Screening and Semi-Quantification of Zilpaterol in Urine and Tissues of Sheep. J. Agric. Food Chem. 2018, 66, 10871–10880. [Google Scholar] [CrossRef]
- Shelver, W.L.; Chakrabarty, S.; Young, J.M.; Byrd, C.J.; Smith, D.J. Evaluation of rapid and standard tandem mass spectrometric methods to analyse veterinary drugs and their metabolites in antemortem bodily fluids from food animals. Food Addit. Contam. A 2022, 39, 462–474. [Google Scholar] [CrossRef]
- Polettini, A. Bioanalysis of beta 2-agonists by hyphenated chromatographic and mass spectrometric techniques. J. Chromatogr. B Biomed. Appl. 1996, 687, 27–42. [Google Scholar] [CrossRef] [PubMed]
- Kuiper, H.A.; Noordam, M.Y.; van Dooren-Flipsen, M.M.; Schilt, R.; Roos, A.H. Illegal use of beta-adrenergic agonists: European Community. J. Anim. Sci. 1998, 76, 195–207. [Google Scholar] [CrossRef] [PubMed]
- Stephany, R.W. Hormonal Growth Promoting Agents in Food Producing Animals. In Doping in Sports: Biochemical Principles, Effects and Analysis; Handbook of Experimental Pharmacology; Springer: Berlin/Heidelberg, Germany, 2010; pp. 355–367. [Google Scholar] [CrossRef]
- Dirikolu, L.; Lehner, A.F. A review of current chemistry, pharmacology, and regulation of endogenous anabolic steroids testosterone, boldenone, and nandrolone in horses. J. Vet. Pharmacol. Ther. 2023, 46, 201–217. [Google Scholar] [CrossRef] [PubMed]
- Waller, P.; Lomnicka, I.; Lucas, C.; Johnson, S.; Dirikolu, L. The medication violations in racehorses at Louisiana racetracks from 2016 to 2020. Vet. Med. Sci. 2022, 8, 553–560. [Google Scholar] [CrossRef] [PubMed]
- McKinney, A.R.; Cawley, A.T.; Young, E.B.; Kerwick, C.M.; Cunnington, K.; Stewart, R.T.; Ambrus, J.I.; Willis, A.C.; McLeod, M.D. The metabolism of anabolic-androgenic steroids in the greyhound. Bioanalysis 2013, 5, 769–781. [Google Scholar] [CrossRef] [PubMed]
- Waller, C.C.; McLeod, M.D. A review of designer anabolic steroids in equine sports. Drug Test. Anal. 2017, 9, 1304–1319. [Google Scholar] [CrossRef] [PubMed]
- Joseph, J.F.; Parr, M.K. Synthetic androgens as designer supplements. Curr. Neuropharmacol. 2015, 13, 89–100. [Google Scholar] [CrossRef] [PubMed]
- Parr, M.K.; Schanzer, W. Detection of the misuse of steroids in doping control. J. Steroid Biochem. 2010, 121, 528–537. [Google Scholar] [CrossRef]
- Moussa, F.; Doumiati, S.; Bernabo, N.; Barboni, B.; Jaber, F.; Mokh, S. Hormones residues in bovine animals: Sampling, analysis and health risk assessment. Steroids 2022, 181, 108994. [Google Scholar] [CrossRef]
- Moussa, F.; Mokh, S.; Doumiati, S.; Barboni, B.; Bernabo, N.; Al Iskandarani, M. LC-MS/MS method for the determination of hormones: Validation, application and health risk assessment in various bovine matrices. Food Chem. Toxicol. 2020, 138, 111204. [Google Scholar] [CrossRef]
- Wang, K.; Wang, X.; Xu, Z.; Yang, S. Simultaneous determination of multi-class antibiotics and steroid hormones drugs in livestock and poultry faeces using liquid chromatography-quadrupole time-of-flight mass spectrometry. Food Addit. Contam. A 2020, 37, 1467–1480. [Google Scholar] [CrossRef] [PubMed]
- Harding, C.; Viljanto, M.; Cutler, C.; Habershon-Butcher, J.; Biddle, S.; Scarth, J. In vitro and in vivo metabolism of the anabolic-androgenic steroid oxandrolone in the horse. Drug Test. Anal. 2022, 14, 39–55. [Google Scholar] [CrossRef] [PubMed]
- Cloteau, C.; Dervilly, G.; Loup, B.; Delcourt, V.; Kaabia, Z.; Bagilet, F.; Groseille, G.; Dauriac, K.; Fisher, S.; Popot, M.A.; et al. Performance assessment of an equine metabolomics model for screening a range of anabolic agents. Metabolomics 2023, 19, 38. [Google Scholar] [CrossRef] [PubMed]
- Waller, C.C.; Weththasinghe, S.A.; McClure, L.; Cawley, A.T.; Suann, C.; Suann, E.; Sutherland, E.; Cooper, E.; Heather, A.; McLeod, M.D. In vivo metabolism of the designer anabolic steroid hemapolin in the thoroughbred horse. Drug Test. Anal. 2020, 12, 752–762. [Google Scholar] [CrossRef]
- Viljanto, M.J.; Kicman, A.T.; Walker, C.J.; Parkin, M.C.; Wolff, K.; Pearce, C.M.; Scarth, J. Elucidation of the biosynthetic pathways of boldenone in the equine testis. Steroids 2019, 146, 79–91. [Google Scholar] [CrossRef] [PubMed]
- Cloteau, C.; Dervilly, G.; Kaabia, Z.; Bagilet, F.; Delcourt, V.; Loup, B.; Guitton, Y.; Royer, A.L.; Monteau, F.; Garcia, P.; et al. From a non-targeted metabolomics approach to a targeted biomarkers strategy to highlight testosterone abuse in equine. Illustration of a methodological transfer between platforms and laboratories. Drug Test. Anal. 2022, 14, 864–878. [Google Scholar] [CrossRef] [PubMed]
- Pranata, A.; Curtis, B.; Waller, C.C.; Caldwell, K.; Zahra, P.W.; Karamatic, S.L.; McLeod, M.D. The in vivo metabolism of Furazadrol in greyhounds. Drug Test. Anal. 2021, 13, 1749–1757. [Google Scholar] [CrossRef]
- Pranata, A.; Yamada, S.; Weththasinghe, S.; Caldwell, K.; Zahra, P.W.; Karamatic, S.L.; Gardiner, M.G.; McLeod, M.D. The in vivo metabolism of Jungle Warfare in greyhounds. Steroids 2023, 190, 109150. [Google Scholar] [CrossRef]
- Rocha, D.G.; Lana, M.A.G.; de Assis, D.C.S.; Augusti, R.; Faria, A.F. Determination of Steroids in Bovine Serum: Validation of a Reliable LC-MS/MS Method and In Vivo Studies with Boldenone Undecylenate and Testosterone Propionate. J. Agric. Food Chem. 2020, 68, 11545–11552. [Google Scholar] [CrossRef]
- Dolezal, P.; Pokorna, K.; Citek, J.; Stupka, R. Development of an analytical method for the determination of sterol compounds in boars’ saliva. Anal. Biochem. 2022, 658, 114932. [Google Scholar] [CrossRef]
- Goudet, G.; Prunier, A.; Nadal-Desbarats, L.; Grivault, D.; Ferchaud, S.; Pianos, A.; Haddad, L.; Montigny, F.; Douet, C.; Savoie, J.; et al. Steroidome and metabolome analysis in gilt saliva to identify potential biomarkers of boar effect receptivity. Animal 2021, 15, 100095. [Google Scholar] [CrossRef] [PubMed]
- Legacki, E.L.; Scholtz, E.L.; Ball, B.A.; Esteller-Vico, A.; Stanley, S.D.; Conley, A.J. Concentrations of sulphated estrone, estradiol and dehydroepiandrosterone measured by mass spectrometry in pregnant mares. Equine Vet. J. 2019, 51, 802–808. [Google Scholar] [CrossRef] [PubMed]
- Frisee, V.; Rigaux, G.; Dufour, P.; Barbato, O.; Brutinel, F.; Egyptien, S.; Bossaert, P.; Deleuze, S.; Cavalier, E.; Ponthier, J. American Bison (Bison bison) reproductive endocrinology: Serum Pregnancy Associated Glycoproteins (PAG), Progesterone, Estrone and Estrone-Sulfate in non pregnant animals and during gestation. Domest. Anim. Endocrinol. 2022, 78, 106684. [Google Scholar] [CrossRef] [PubMed]
- Dufour, P.; Courtois, J.; Seynaeve, Y.; Peeters, S.; Le Goff, C.; Cavalier, E.; Ponthier, J. Development and validation of a liquid chromatography coupled to mass spectrometer (LC-MS) method for the simultaneous quantification of estrone-3-sulfate, progesterone, estrone and estradiol in serum of mares and American bisons. Res. Vet. Sci. 2021, 136, 343–350. [Google Scholar] [CrossRef] [PubMed]
- Lišková, M.; Čačková, K.; Rejtharová, M. New approach to derivatisation for oestradiol esters detection in animal blood plasma using negative chemical ionisation GC-MS. Food Addit. Contam. Part. A Chem. Anal. Control Expo. Risk Assess. 2021, 38, 1157–1168. [Google Scholar] [CrossRef]
- Tang, Z.; Wan, Y.P.; Liu, Z.H.; Wang, H.; Dang, Z.; Liu, Y. Twelve natural estrogens in urines of swine and cattle: Concentration profiles and importance of eight less-studied. Environ. Sci. Pollut. Res. Int. 2022, 803, 150042. [Google Scholar] [CrossRef]
- Sasaki, N.; Oo, T.; Yasuda, Y.; Ichise, T.; Nagata, N.; Yokoyama, N.; Sasaoka, K.; Morishita, K.; Nakayama, S.M.; Ishizuka, M.; et al. Simultaneous steroids measurement in dogs with hyperadrenocorticism using a column-switching liquid chromatography-tandem mass spectrometry method. J. Vet. Med. Sci. 2021, 83, 1634–1642. [Google Scholar] [CrossRef]
- Hankele, A.K.; Rehm, K.; Berard, J.; Schuler, G.; Bigler, L.; Ulbrich, S.E. Progestogen profiling in plasma during the estrous cycle in cattle using an LC-MS based approach. Theriogenology 2020, 142, 376–383. [Google Scholar] [CrossRef]
- Rehm, K.; Hankele, A.K.; Ulbrich, S.E.; Bigler, L. Simultaneous quantification of progestogens in plasma and serum by UHPLC-HRMS employing multiplexed targeted single ion monitoring. Talanta 2021, 232, 122358. [Google Scholar] [CrossRef]
- Xia, L.; Yang, Z.; Ning, M. LC-MS/MS quantification of progesterone in ovariectomized miniature swine and its application for preliminary pharmacokinetic study of a novel vaginal sustained release system. Drug Dev. Ind. Pharm. 2021, 47, 51–60. [Google Scholar] [CrossRef]
- Liu, Z.; Qiu, S.; Gu, Y.; Ning, M. Quantitative determination of levonorgestrel in beagle dog plasma after vaginal administration of intravaginal ring by high-performance liquid chromatography-tandem mass spectrometry. Biomed. Chromatogr. 2018, 32, e4367. [Google Scholar] [CrossRef]
- Purves, R.W.; West, M.; Vaghela, R.; Kinar, J.; Patel, Y.; Belford, M.W.; Shurmer, B.O. Simplified Liquid Chromatography-Mass Spectrometry Methods for Gestagen Analysis in Animal Fat and Liver. J. Agric. Food Chem. 2023, 71, 9877–9885. [Google Scholar] [CrossRef] [PubMed]
- Yang, M.H.; Chen, S.C.; Chen, K.C.; You, H.P.; Wu, H.Y.; Arthur Chen, Y.M.; Huang, Y.F.; Huang, M.Y.; Yuan, C.H.; Lin, P.C.; et al. Quantitative analysis of progesterone using isotope dilution-matrix-assisted laser desorption ionization-time of flight mass spectrometry as a reference procedure for radioimmunoassay. Clin. Chim. Acta 2021, 512, 106–111. [Google Scholar] [CrossRef] [PubMed]
- Galesio, M.; Lopez-Fdez, H.; Reboiro-Jato, M.; Gomez-Meire, S.; Glez-Pena, D.; Fdez-Riverola, F.; Lodeiro, C.; Diniz, M.E.; Capelo, J.L. Speeding up the screening of steroids in urine: Development of a user-friendly library. Steroids 2013, 78, 1226–1232. [Google Scholar] [CrossRef] [PubMed]
- Yan, Y.; Ubukata, M.; Cody, R.B.; Holy, T.E.; Gross, M.L. High-Energy Collision-Induced Dissociation by MALDI TOF/TOF Causes Charge-Remote Fragmentation of Steroid Sulfates. J. Am. Soc. Mass. Spectrom. 2014, 25, 1404–1411. [Google Scholar] [CrossRef]
- Song, Z.; Gao, H.; Xie, W.; Sun, Q.; Liang, K.; Li, Y. Quantitative MALDI-MS assay of steroid hormones in plasma based on hydroxylamine derivatization. Anal. Biochem. 2021, 616, 114089. [Google Scholar] [CrossRef]
- Parr, M.K.; Wust, B.; Teubel, J.; Joseph, J.F. Splitless hyphenation of SFC with MS by APCI, APPI, and ESI exemplified by steroids as model compounds. J. Chromatogr. B Anal. Technol. Biomed. Life Sci. 2018, 1091, 67–78. [Google Scholar] [CrossRef]
- Fragkaki, A.G.; Georgakopoulos, C.; Sterk, S.; Nielen, M.W.F. Sports doping: Emerging designer and therapeutic β2-agonists. Clin. Chim. Acta 2013, 425, 242–258. [Google Scholar] [CrossRef]
- Kalogera, E.; Pistos, C.; Provatopoulou, X.; Athanaselis, S.; Spiliopoulou, C.; Gounaris, A. Androgen glucuronides analysis by liquid chromatography tandem-mass spectrometry: Could it raise new perspectives in the diagnostic field of hormone-dependent malignancies? J. Chromatogr. B Anal. Technol. Biomed. Life Sci. 2013, 940, 24–34. [Google Scholar] [CrossRef]


| Analyte | CAS Number | Homogenization | Extraction | SPE Phase | Matrix | Species | Detection Method | LOD [ng/mL] | LOQ [ng/mL] | Reference |
|---|---|---|---|---|---|---|---|---|---|---|
| Clenbuterol | 37148-27-9 | IKA T18 homogenizer. Dispersion tool after the IKA T18 homogenizer | SPE | Mixed-mode CX | Meat | Pork | LC-QTrap | n.a. | n.a. | [10] |
| Clenbuterol | 37148-27-9 | GM 200 homogenizer | SPE | Mixed-mode CX | Meat | Mutton | LC-TQ | 0.03 | 0.06 | [30] |
| Zilpaterol | 119520-05-7 | Moulinex ® food processor; muscle: 250 mg/1.65 mL solvent. Liver or kidney: 100 mg/1.8 mL solvent; at 40 °C | SPE | Mixed-mode CX | Kidney | Cattle | LC-TQ | 0.5 | 1 | [31] |
| Liver | 0.5 | 1 | ||||||||
| Muscle | 0.1 | 0.2 | ||||||||
| Plasma | 0.1 | 0.4 | ||||||||
| Zilpaterol * | 119520-05-7 | Tissuemizer: 5 g/10 mL 100 mM borate buffer pH 9 | SPE | Mixed-mode CX | Kidney | Sheep | LC-MS/MS | 0.03 | 0.1 | [32] |
| Liver | 0.06 | 0.1 | ||||||||
| Muscle | 0.02 | 0.1 | ||||||||
| Lung | 0.03 | 0.1 | ||||||||
| Brombuterol * | 41937-02-4 | n.a. | SPE, β-glc | HLB | Urine | Bovine | LC-MS/MS | 0.03 | 0.08 | [28] |
| Cimbuterol | 54239-39-3 | 0.01 | 0.05 | |||||||
| Clenbuterol | 37148-27-9 | 0.02 | 0.08 | |||||||
| Clenpenterol | 37158-47-7 | 0.03 | 0.09 | |||||||
| Isoxsuprine | 395-28-86 | 0.17 | 0.32 | |||||||
| Mabuterol | 56341-08-3 | 0.03 | 0.09 | |||||||
| Ractopamine | 97825-25-7 | 0.16 | 0.49 | |||||||
| Terbutaline | 23031-25-6 | 0.11 | 0.42 | |||||||
| Salbutamol | 18559-94-9 | 0.17 | 0.48 | |||||||
| Zilpaterol | 119520-05-7 | 0.14 | 0.40 | |||||||
| Ractopamine | 97825-25-7 | Mixed in processor | SPE, β-glc | Molecularly imprinted polymer | Urine | Porcine | LC-MS/MS | 0.05 | 0.15 | [29] |
| Protease, β-glc, QuEChERs, d-SPE | d-SPE: PSA, C18 | Kidney | n.a. | 2.5 | ||||||
| Liver | n.a. | 2.5 | ||||||||
| Muscle | n.a. | 0.5 | ||||||||
| Lung | n.a. | 2.5 | ||||||||
| Clenbuterol | 37148-27-9 | Grinding followed by processors | SPE, LLE | C18 | Kidney | Bovine | LC-TQ | 0.009 | 0.028 | [27] |
| Liver | 0.021 | 0.065 | ||||||||
| Muscle | 0.008 | 0.026 | ||||||||
| Isoxsuprine | 395-28-8 | Kidney | 0.047 | 0.143 | ||||||
| Liver | 0.053 | 0.160 | ||||||||
| Muscle | 0.048 | 0.145 | ||||||||
| Ractopamine | 97825-25-7 | Kidney | 0.136 | 0.412 | ||||||
| Liver | 0.083 | 0.251 | ||||||||
| Muscle | 0.081 | 0.246 | ||||||||
| Zilpaterol | 119520-05-7 | Kidney | 0.553 | 1.677 | ||||||
| Liver | 0.324 | 0.982 | ||||||||
| Muscle | 0.291 | 0.882 | ||||||||
| Clenbuterol * | 37148-27-9 | Meat grinder | QuEChER, d-SPE | C18 C18, PSA | Meat | Beef | LC-QTrap | 0.24 | 0.73 | [33] |
| Ractopamine | 97825-25-7 | 0.55 | 1.67 | |||||||
| Ractopamine * | 97825-25-7 | n.a. | n.a. | C18 sorbent | Kidney | Porcine | LC-Triple-ToF | 0.54 | 1.62 | [6] |
| Analyte | CAS-Number | Homogenization | Extraction | Solvent | Matrix | Species | LOD [ng/g] | LOQ [ng/g] | Reference |
|---|---|---|---|---|---|---|---|---|---|
| Clenbuterol | 37148-27-9 | Grinding followed by processors | SPE, LLE | TBME/water | Kidney | Bovine | 0.009 | 0.028 | [27] |
| Liver | 0.021 | 0.065 | |||||||
| Muscle | 0.008 | 0.026 | |||||||
| Isoxsuprine | 395-28-8 | Kidney | 0.047 | 0.143 | |||||
| Liver | 0.053 | 0.160 | |||||||
| Muscle | 0.048 | 0.145 | |||||||
| Ractopamine | 97825-25-7 | Kidney | 0.136 | 0.412 | |||||
| Liver | 0.083 | 0.251 | |||||||
| Muscle | 0.081 | 0.246 | |||||||
| Zilpaterol | 119520-05-7 | Kidney | 0.553 | 1.677 | |||||
| Liver | 0.324 | 0.982 | |||||||
| Muscle | 0.291 | 0.882 | |||||||
| Clenbuterol * | 37148-27-9 | n.a. | LLE | Ethyl acetate/10% sodium carbonate | Urine | Cow | 0.13 | 0.44 | [34] |
| Urine | Sheep | 0.14 | 0.48 | ||||||
| Kidney | Sheep | 0.48 | 1.60 | ||||||
| Liver | Sheep | 0.33 | 1.09 | ||||||
| Muscle | Sheep | 0.12 | 0.42 | ||||||
| Lung | Sheep | 0.16 | 0.54 | ||||||
| Kidney | Pig | 0.21 | 0.69 | ||||||
| Ractopamine | 97825-25-7 | Urine | Cow | 1.07 | 3.57 | ||||
| Urine | Sheep | 2.03 | 6.77 | ||||||
| Kidney | Sheep | 0.74 | 2.48 | ||||||
| Liver | Sheep | 0.88 | 2.95 | ||||||
| Muscle | Sheep | 0.86 | 2.87 | ||||||
| Lung | Sheep | 0.48 | 1.61 | ||||||
| Kidney | Pig | 0.30 | 0.90 | ||||||
| Salbutamol | 18559-94-9 | Urine | Cow | 0.92 | 3.06 | ||||
| Urine | Sheep | 1.53 | 5.11 | ||||||
| Kidney | Sheep | 1.58 | 5.27 | ||||||
| Liver | Sheep | 3.60 | 11.9 | ||||||
| Muscle | Sheep | 1.31 | 4.38 | ||||||
| Lung | Sheep | 1.20 | 3.96 | ||||||
| Kidney | Pig | 1.24 | 4.11 | ||||||
| Zilpaterol | 119520-05-7 | Urine | Cow | 0.99 | 3.32 | ||||
| Urine | Sheep | 0.48 | 1.60 | ||||||
| Kidney | Sheep | 0.32 | 1.05 | ||||||
| Liver | Sheep | 0.70 | 2.30 | ||||||
| Muscle | Sheep | 0.27 | 0.89 | ||||||
| Lung | Sheep | 0.23 | 0.78 | ||||||
| Kidney | Pig | 1.56 | 5.19 |
| Analyte | CAS Number | Homogenization | Extraction | Solvent | Matrix | Species | LOD [ng/g] | LOQ [ng/g] | Reference |
|---|---|---|---|---|---|---|---|---|---|
| Ractopamine | 97825-25-7 | Chopped in ACN (5 g/5 mL), repeated 3 times | Electro membrane extraction | n.a. | Muscle | Pork | 0.07 | 0.23 | [36] |
| Liver | Pork | 0.09 | 0.32 | ||||||
| Muscle | Bovine | 0.08 | 0.27 | ||||||
| Muscle | Lamb | 0.11 | 0.36 | ||||||
| Ractopamine | 97825-25-7 | Flash frozen, then mixed in a Robot coupe blixer V4 | Extraction with organic solvent | MeOH | Muscle | Heifer | 0.03 | 0.11 | [35] |
| Abomasum | 0.09 | 0.32 | |||||||
| Liver | 0.02 | 0.06 | |||||||
| Omasum | 0.01 | 0.05 | |||||||
| Small intestine | 0.03 | 0.09 | |||||||
| Reticulum | 0.01 | 0.03 | |||||||
| Rinsate | 0.02 | 0.06 | |||||||
| Zilpaterol | 119520-05-7 | n.a. | No sample preparation | n.a. | Urine (ASAP) | Sheep | 1.1 | 3.7 | [37] |
| Urine (MDESI) | 1.3 | 3.7 | |||||||
| Ground in ACN (100 mg/0.2 mL) | Extraction with organic solvent | ACN | Liver (ASAP) | 0.3 | 1.1 | ||||
| Kidney (ASAP) | 0.1 | 0.4 | |||||||
| Muscle (ASAP) | 0.2 | 0.6 | |||||||
| Lung (ASAP) | 0.4 | 1.2 | |||||||
| Liver (MDESI) | 0.3 | 0.9 | |||||||
| Kidney (MESDI) | 0.5 | 1.6 | |||||||
| Muscle (MDESI) | 0.2 | 0.5 | |||||||
| Lung (MDESI) | 0.6 | 2.1 | |||||||
| Clenbuterol * | 37148-27-9 | Centrifugation for oral fluid, none for urine | Extraction with organic solvent | ACN, MgSO4, and NaCl | Urine (LC) | Bovine | 0.57 | 1.89 | [38] |
| Fluid (LC) | Pig | 4.87 | 16.2 | ||||||
| Urine (RS) | Bovine | 1.02 | 3.40 | ||||||
| Fluid (RS) | Pig | 0.19 | 0.65 | ||||||
| Ractopamine | 97825-25-7 | Urine (LC) | Bovine | 0.42 | 1.41 | ||||
| Fluid (LC) | Pig | 0.91 | 3.04 | ||||||
| Urine (RS) | Bovine | 1.51 | 5.02 | ||||||
| Fluid (RS) | Pig | 0.69 | 2.30 | ||||||
| Ractopamine–glucuronide | 166022-10-2 | Urine (LC) | Bovine | 33.9 | 113 | ||||
| Fluid (LC) | Pig | 46.1 | 154 | ||||||
| Urine (RS) | Bovine | 108 | 362 | ||||||
| Fluid (RS) | Pig | 64.4 | 215 | ||||||
| Salbutamol | 18559-94-9 | Urine (LC) | Bovine | 1.38 | 4.61 | ||||
| Fluid (LC) | Pig | 2.06 | 6.88 | ||||||
| Urine (RS) | Bovine | 0.85 | 2.84 | ||||||
| Fluid (RS) | Pig | 1.03 | 3.45 | ||||||
| Zilpaterol | 119520-05-7 | Urine (LC) | Bovine | 37.8 | 126 | ||||
| Fluid (LC) | Pig | 25.7 | 85.1 | ||||||
| Urine (RS) | Bovine | 5.45 | 18.2 | ||||||
| Fluid (RS) | Pig | 1.98 | 6.23 |
| Chromatography | Detection | Monitoring Mode | Flow Rate [mL/min] | Temperature [°C] | Mobile Phase A | Mobile Phase B | Reference |
|---|---|---|---|---|---|---|---|
| LC | TQ | SRM | 0.05 | n.a. | 5% MeOH + 0.2%FA in water and 0.2% FA in MeOH (1/1, v/v) | n.a. | [34] |
| LC | TQ | MRM | 0.35 | 40 | 0.1% FA water/MeOH (60/40, v/v) | n.a. | [36] |
| LC | TQ | n.a. | 0.5 | 40 | 5% MeOH in 0.2% FA in water | 0.2% FA in MeOH | [37] |
| LC | TQ | MRM | 0.65 | 40 | 0.1% FA in water | 0.1% FA in MeOH | [27] |
| LC | TQ | SRM | 0.05 | n.a. | 0.2% FA in MeOH/ water (5/95, v/v) | 0.2% FA in ACN/water (10/90, v/v) | [32] |
| LC | TQ | SRM | 0.35 | 40 | 0.2% FA in water | MeOH | [31] |
| LC | TQ | n.a. | 0.3 | n.a. | 0.1% FA in water | MeOH | [30] |
| LC | TQ | MRM | 1.0 | 30 | 0.1% FA in water | 0.1% FA in MeOH | [29] |
| LC | TQ | MRM | 0.2 | 40 | 5 mM ammonium acetate, 0.01% FA, 0.01% trichloroacetic acid in water | 0.1% FA in MeOH | [28] |
| LC | TQ | MRM | 0.3 | 45 | 0.1% FA in water | 0.1% in ACN | [38] |
| LC | QToF | n.a. | 0.4 | 50 | 2 mM ammonium formate in water | 0.1% FA in ACN | [35] |
| LC | QTrap | MRM | 0.3 | 40 | 0.1% FA in water | MeOH | [33] |
| LC | QTrap | SRM | 0.4 | 30 | 10 mM ammonium formate in MeOH | n.a. | [10] |
| LC | Triple-ToF | n.a. | 0.5 | 40 | 0.1% FA in ACN/ water (5/95, v/v) | 0.1% FA in ACN | [6,38] |
| RS | Triple-ToF | n.a. | 0.2 | n.a. | 0.1% FA in ACN/ water (1/1, v/v) | n.a. | [34] |
| RS | MS | n.a. | 0.2 | n.a. | 0.1% FA in ACN/water (1/1, v/v) | n.a. | [38] |
| Analyte | CAS-Number | Homogenization | Extraction | SPE Phase | Matrix | Species | Detection Method | LOD [ng/mL] | LOQ [ng/mL] | Reference |
|---|---|---|---|---|---|---|---|---|---|---|
| Testosterone * | 58-22-0 | Shaking | d-SPE | PSA | Liver, bile, kidney | Bovine | LC-TQ | n.a. | n.a. | [48] |
| Epitestosterone | 481-30-1 | |||||||||
| Trenbolone acetate | 10161-34-9 | |||||||||
| 17α-methyl testosterone | 58-18-4 | |||||||||
| Testosterone * | 58-22-0 | Meat grinding (twice) | [49] | |||||||
| Epitestosterone | 481-30-1 | |||||||||
| 17α-methyl testosterone | 58-18-4 | |||||||||
| Testosterone * | 58-22-0 | Drying, followed by rough grounding | d-SPE | EMR-Lipid tube | Feces | Pig, cattle, chicken | LC-QToF | 2.5 | 12.5 | [50] |
| Epitestosterone | 481-30-1 | 0.8 | 12.5 | |||||||
| Nortestosterone | 434-22-0 | 5.0 | 12.5 |
| Analyte | CAS-Number | Homogenization Tools | Extraction | SPE-Phase | Matrix | Species | Detection Method | LOD [ng/mL] | LOQ [ng/mL] | Reference |
|---|---|---|---|---|---|---|---|---|---|---|
| Androgens (underivatized) * | 27833-18-7, 53-43-0, 846-48-0, 58-22-0, 481-30-1, 58-18-4, 734-32-7, 63-05-8 | Omni homogenizer (1 g/1 L 50 mM TRIS buffer pH 7.4) | SPE | Polymeric non-polar; bi-modal porosity | Testes | Horse | LC-QExactive hybrid Q Orbitrap | 1–100 | n.a. | [54] |
| Androgens (derivatized) | n.a. | 0.001–0.01 | ||||||||
| Hemapolin and metabolites | 4267-80-5, 3275-64-7, 58-18-4 | n.a. | SPE | Polymeric non-polar; bi-modal porosity | Urine | Horse | GC-MS/MS | 1–5 | n.a. | [53] |
| Anabolic androgenes | 651-45-6 | n.a. | SPE | C18 | Urine | Horse | LC-QExactive | n.a. | n.a. | [52] |
| Testosterone esters | 57-85-2, 1255-49-8, 125262-86-9, 57-91-5 | n.a. | SPE | C18 | Urine | Horse | LC-HRMS/MS | n.a. | n.a. | [55] |
| Furazadrol | 49-75-12-6 | n.a. | SPE, β-glc, protease | Mixed-mode ion exchange | Urine | Dog | LC-Orbitrap | 0.21 | n.a. | [56] |
| Isofurazadrol | 884483-38-9 | 0.18 | ||||||||
| 4α-Hydroxyfurazadrol | n.a. | 0.22 | ||||||||
| 16α-Hydroxy furazadrol | n.a. | 0.23 | ||||||||
| Δ6-Methyltestosterone | 5585-85-3 | n.a. | SPE, β-glc, protease | Mixed-mode ion exchange | Urine | Dog | LC-Orbitrap | 0.5 | n.a. | [57] |
| Epi-Δ6-methyltestosterone | n.a. | 0.5 | ||||||||
| 16α-Δ6-Methyltestosterone | n.a. | 1 | ||||||||
| Oxandrolone | 53-39-4 | n.a. | SPE, β-glc, sulfuric acid | C18 | Urine | Horse | QTrap | 0.2–1 | n.a. | [51] |
| Plasma | 0.02 | |||||||||
| Androsterone | 53-41-8 | n.a. | SPE | PD-C | Saliva | Boar | GC-MS | 0.8 | 1 | [59] |
| Androsten-3α-ol | 1476-64-8 | 0.7 | 2 | |||||||
| Androsten-3β-ol | 1476-64-8 | 0.9 | 1 | |||||||
| C21-, C19-, and C20 steroids | 53-43-0, 651-48-9, 521-17-5, 63-05-8, 846-46-8, 1229-12-5, 481-29-8, 53-42-9, 58-22-0, 521-18-6, 571-22-2 | n.a. | Extraction with organic solvent | MeOH | Saliva | Boar | GC-MS/MS | n.a. | n.a. | [60] |
| Testosterone sulfate * | 651-45-6 | n.a. | Extraction with organic solvent | ACN and acetic acid | Plasma | Horse | LC-TQ | 0.25 | 1 | [61] |
| Androgens | 1057-07-4, 846-48-0, 106505-90-2, 481-30-1, 434-03-7, 50-50-0, 58-19-5, 62-90-8 10161-34-9, 13103-34-9, 2607-14-9, 58-18-4, 360-70-3, 52-78-8, 1045-69-8, 2088-71-3, 58-20-8, 5721-91-5, 15262-86-9, 57-85-2, 315-37-7, 72-63-9, 153-00-4, 1474-55-1 | n.a. | LLE and protein precipitation | n.a. | Serum | Steer | LC-TQ | 0.005–0.44 | 0.025–1.750 | [58] |
| Analyte | CAS-Number | Homogenization | Extraction | SPE Phase | Matrix | Species | Detection Method | LOD [ng/mL] | LOQ [ng/mL] | References |
|---|---|---|---|---|---|---|---|---|---|---|
| Estrone * | 53-16-7 | Centrifugated at room temperature | SPE, β-glc, arylsulfatase | n.a. | Urine | Cattle, sow, boar | GC-Q | 0.4 | 1.5 | [65] |
| Estradiol | 50-28-2 | 0.7 | 2.3 | |||||||
| Estratriol | 50-27-1 | 2.5 | 8.3 | |||||||
| α-Estradiol-sulfate | 481-96-9 | 0.7 | 2.3 | |||||||
| Estrone, underivatized * | 53-16-7 | Omni homogenizer (1 g/1 L 50 mM TRIS buffer pH 7.4) | SPE | Polymeric non-polar; bi-modal porosity | Testes | Horse | LC-QExactive hybrid Q Orbitrap | 5 | n.a. | [54] |
| DHEA, underivatized | 53-43-0 | 100 | ||||||||
| Estrone derivatized | 3342-64-1 | 5 | ||||||||
| DHEA derivatized | 53-43-0 | 1 | ||||||||
| Estradiol-acetate, | 4245-41-4 | Vortexed with 0.1% FA in ACN (2 mL blood/3 mL solvent) | d-SPE | modified silica gel with zirconium oxide | Plasma, | bovine, pork | GC-MS/MS | n.a. | n.a. | [64] |
| Estradiol-benzoate | 50-50-0 | |||||||||
| Estradiol-cyprionate | 313-06-4 | SPE | Alumina | |||||||
| Estradiol-ethanthate | 4956-37-0 | Extraction with organic solvent | TBME | |||||||
| Estradiol-valerate | 979-32-8 | |||||||||
| 17β-Estradiol * Estriol | 50-27-1 | Meat grinding (twice) | d-SPE | QuECHERS Kit: PSA | Liver, bile, kidney | Bovine | LC-TQ | n.a. | n.a. | [49] |
| Shaking | [48] | |||||||||
| 17α-Ethinylestradiol | 57-63-6 | Meat grinding (twice) | [49] | |||||||
| Shaking | [48] | |||||||||
| 17β-Estradiol 3 benzoate | 50-50-0 | Meat grinding (twice) | [49] | |||||||
| Shaking | [48] | |||||||||
| Estrone-sulfate * | 481-97-0 | n.a. | Extraction with organic solvent | ACN and acetic acid | Plasma | Horse | LC-TQ | 45 | 50 | [61] |
| Estradiol-sulfate | 481-96-9 | 0.5 | 1 | |||||||
| DHEA-sulfate | 651-48-9 | 0.5 | 1 | |||||||
| Estrone * | 53-16-7 | Centrifuged at room temperature | Extraction with organic solvent | n.a. | Serum | Bison | LC-Qtrap | n.a. | 0.002 | [63] |
| Estradiol | 50-28-2 | 0.002 | ||||||||
| Estrone-3-Sulfate | 481-97-0 | 0.5 | ||||||||
| C21-, C19-, and C20 steroids | 53-16-7, 50-28-2, 50-27-1, 362-07-2 | Centrifuged on ice | Extraction with organic solvent | Extracted with MeOH | Saliva | Boar | GC-MS/MS | n.a. | [60] | |
| Estrone * | 53-28-2 | Centrifuged | Centrifugation | n.a. | Serum | Bison | LC-QTrap | n.a. | 0.002 | [62] |
| Estrone-sulfate | 481-97-0 | 0.5 |
Disclaimer/Publisher’s Note: The statements, opinions and data contained in all publications are solely those of the individual author(s) and contributor(s) and not of MDPI and/or the editor(s). MDPI and/or the editor(s) disclaim responsibility for any injury to people or property resulting from any ideas, methods, instructions or products referred to in the content. |
© 2024 by the authors. Licensee MDPI, Basel, Switzerland. This article is an open access article distributed under the terms and conditions of the Creative Commons Attribution (CC BY) license (https://creativecommons.org/licenses/by/4.0/).
Share and Cite
Klöppner, L.; Harps, L.C.; Parr, M.K. Sample Preparation Techniques for Growth-Promoting Agents in Various Mammalian Specimen Preceding MS-Analytics. Molecules 2024, 29, 330. https://doi.org/10.3390/molecules29020330
Klöppner L, Harps LC, Parr MK. Sample Preparation Techniques for Growth-Promoting Agents in Various Mammalian Specimen Preceding MS-Analytics. Molecules. 2024; 29(2):330. https://doi.org/10.3390/molecules29020330
Chicago/Turabian StyleKlöppner, Laura, Lukas Corbinian Harps, and Maria Kristina Parr. 2024. "Sample Preparation Techniques for Growth-Promoting Agents in Various Mammalian Specimen Preceding MS-Analytics" Molecules 29, no. 2: 330. https://doi.org/10.3390/molecules29020330
APA StyleKlöppner, L., Harps, L. C., & Parr, M. K. (2024). Sample Preparation Techniques for Growth-Promoting Agents in Various Mammalian Specimen Preceding MS-Analytics. Molecules, 29(2), 330. https://doi.org/10.3390/molecules29020330