Article

The Influence of the Comonomer Ratio and Reaction Temperature on the Mechanical, Thermal, and Morphological Properties of Lignin Oil–Sulfur Composites

by
Katelyn A. Tisdale
,
Nawoda L. Kapuge Dona
and
Rhett C. Smith
*
Department of Chemistry and Center for Optical Materials Science and Engineering Technology, Clemson University, Clemson, SC 29634, USA
*
Author to whom correspondence should be addressed.
Molecules 2024, 29(17), 4209; https://doi.org/10.3390/molecules29174209
Submission received: 3 July 2024 / Revised: 30 August 2024 / Accepted: 31 August 2024 / Published: 5 September 2024
(This article belongs to the Special Issue Organosulfur and Organoselenium Chemistry)

Abstract

:
Although lignin is a plentiful biomass resource, it continually exists as an underutilized component of biomass material. Elemental sulfur is another abundant yet underutilized commodity produced as a by-product resulting from the refining of fossil fuels. The current study presents a strategy for preparing five durable composites via a simple one-pot synthesis involving the reaction of lignin oil and elemental sulfur. These lignin oil–sulfur composites LOSx@T (where x = wt. % sulfur, ranging from 80 to 90, and T represents the reaction temperature in °C) were prepared via the reaction of elemental sulfur and lignin oil (LO) with elemental sulfur. The resulting composites could be remelted and reshaped several times without the loss of mechanical strength. Mechanical, thermal, and morphological studies showed that LOSx@T possesses properties competitive with some mechanical properties of commercial building materials, exhibiting favorable compressive strengths (22.1–35.9 MPa) and flexural strengths (5.7–6.5 MPa) exceeding the values required for many construction applications of ordinary Portland cement (OPC) and brick formulations. While varying the amount of organic material did not result in a notable difference in mechanical strength, increasing the reaction temperature from 230 to 300 °C resulted in a significant increase in compressive strength. The results reported herein reveal potential applications of both lignin and waste sulfur during the ongoing effort toward developing recyclable and sustainable building materials.

1. Introduction

Lignin holds about 30% of the Earth’s carbon [1,2,3,4] and is a widely available potential feedstock for the chemical industry. Biomass processing produces over 5 billion mt of waste lignin annually, and paper production contributes a supplementary 600,000 tons/year of lignin waste [5]. Despite the high abundance of lignin, its complex structure (Figure 1a) [6,7,8,9,10] introduces many challenges when developing methods for its valorization [11,12,13,14,15,16]. Lignin is composed of mixtures of coniferyl alcohol, 4-p-coumaryl alcohol, and sinapyl alcohol units linked together, forming the subunits p-hydroxyphenyl, guaiacyl, and syringyl, correspondingly, in lignin (Figure 1b) [17,18,19,20,21,22,23,24,25,26,27,28]. The magnitude of the contribution of each component varies with both the plant species and the part of the plant from which the lignin is derived [1,29,30].
Both “upstream” and “downstream” processes contribute to efficient lignin valorization. Upstream processes involve separating and isolating lignin, lignin bioengineering, and catalytic conversion, whereas downstream methods involve the depolymerization and upgrading of lignin [31,32,33]. Depolymerization yields bio-oils or lignin oils comprising mixtures of small molecular fragments of lignin and is among the most promising routes to lignin employment. Green methods of lignin depolymerization are therefore being hotly pursued. A few “green” solvents employed in extraction processes involve supercritical fluids, liquified gases, and bio-based solvents. Supercritical fluid extraction (SFE) requires an extraction solvent that can be removed easily, a shorter extraction time, and enhanced selectivity and efficiency [34]. Bio-based solvents are derivative of a broad range of biomass sources, including the extraction of vegetable oils, the fermentation of carbohydrates, and the steam distillation of wood [35,36,37]. Liquified gases are another green solvent. They require low temperature for easy evaporation, allowing for room-temperature liquid gas extractions to be performed at room temperature, consuming minimal energy and extracts containing an insignificant amount residual solvents [38,39]. A recent report [40] discussing lignin’s mild thermolytic solvolysis of yielding a solubilized form of lignin (termed lignin oil) garnered particular interest for the present study due to the process being performed at temperatures ranging from 100 to 350 °C by means of various alcohols as solvents [41]. By heating in an ethanol solvent at a low temperature of 100 °C, this procedure accessibly accomplished the conversion of lignin (64 wt. %) to the desired product, lignin oil (LO). Ethanol is a preferred green solvent and is advantageous because of its low cost and availability [42,43,44,45]. Lignin oil produced by this reported procedure was used in the studies described herein.
Another, existing abundant, and underutilized by-product is elemental sulfur. Over 80 Mt/y of elemental sulfur is produced from fossil fuel refining [46,47,48,49,50,51,52,53,54,55,56,57,58,59,60,61,62]. Multiple efforts have been previously reported for preparing composites from lignin or lignin derivatives and elemental sulfur [63,64,65,66,67].
Early examples of high-sulfur-content materials (HSMs) were made using the inverse vulcanization [57,68,69,70,71,72,73,74,75,76,77,78,79,80,81,82] of olefins [64,83,84,85,86,87,88,89,90,91,92]. The preparation of lignin–sulfur composites thus required the modification of lignin with olefin-bearing substituents before the reaction with sulfur could take place [63,65]. The previously reported LSx (where x = wt. % sulfur, varying between 80 and 99), for example, was prepared using allyl-derivatized lignin (10 wt. %) [63], while ELSx@T (where x = wt. % sulfur, varying between 80 and 90, and T represents reaction temperature in °C) was prepared by reactions of oleic-esterified lignin with sulfur [65]. Two reaction temperatures were used for the preparation of ELSx@T due to the fact that the reaction at 180 °C strictly produces S–C bonds at olefinic sites, while reacting at a higher temperature of 230 °C can produce S–C bonds at both olefinic sites and aryl sites [65]. Although LSx and ELSx@T proved to be durable lignin–sulfur composites, the multistep synthesis required the use of solvents and separation methods that detracted from the desired greenness, affordability, and process atom economy related to these materials.
The preparation of CLS90 (90 wt. % S, 10 wt. % chlorolignin, a paper/pulping waste product) [93] via the reaction of sulfur (90 wt. %) with chlorolignin (10 wt. %) through radical-induced aryl halide–sulfur polymerization (RASP) [94] presented a more proficient one-pot synthesis to produce a durable composite [95]. However, this process yields 0.5 equivalents of toxic S2Cl2 for each C–S bond formed, making it less environmentally friendly and less atom-economical compared to composites prepared via inverse vulcanization. A wide range of composites incorporating lignin have also been reported that do not require sulfur [96,97,98,99,100,101,102,103,104,105].
The search for a more sustainable S–C bond forming reaction to allow the direct utilization of lignin without the need for olefination has simplified the synthetic process toward lignin–sulfur composites and has improved the atom economy of the processes used for their preparation. Recently reported C–S bond-forming mechanisms during the reaction of sulfur with anisole derivatives (Scheme 1) such as O,O′-dimethylbisphenol A [106], guaiacol [64], and others [107] suggest that the direct reaction of lignin oil mixtures with sulfur was possible, as was validated in a recent proof-of-principle study detailing the crosslinking that takes place between sulfur and small lignin derivatives present in lignin oil [108].
Herein, five composites were prepared by heating lignin oil (LO) with elemental sulfur for 2 h. The composites, including LOSx@T (where x = wt. % sulfur, varying from 80 to 90, and T represents the reaction temperature in °C), were of interest to exploit the features of previously reported ELS90@180 and ELS90@230 due to S–C bond-forming at both olefinic and aryl sites after an increase in temperature. Previously studied model compounds with functional groups found within thermal degradation products or lignin subunits were reacted with elemental sulfur, implementing matching conditions [107] as reported to enhance the understanding of S–C bond-forming reactions within the lignin–sulfur composites prepared herein (Scheme 1a). The thermal, morphological, and mechanical properties were analyzed using powder X-ray diffraction (XRD), scanning electron microscopy accompanied by elemental mapping via energy-dispersive X-ray analysis (SEM-EDX), thermogravimetric analysis (TGA), flexural strength analysis, mechanical test stand analysis, and differential scanning calorimetry (DSC).

2. Results and Discussion

2.1. Synthesis and Chemical Characterization of Composites

The lignin oil utilized herein was prepared and characterized as previously reported [108].
Composites LOSx@T (where x = wt. % sulfur, varying from 80 to 90, and T represents the reaction temperature in °C) were prepared by heating lignin oil (10, 15, or 20 wt. %) and sulfur (90, 85, or 80 wt. %) to the requisite temperature in a sealed vessel for 2 h. The composites LOS80@230 and LOS85@230, and LOS90@230 [108] were prepared in thick-walled glass pressure vessels slowly heated to 230 °C and then held at 230 °C for 2 h. Composites LOS90@250 and LOS90@300 were prepared in a stainless steel autoclave reactor The composites were mechanically stirred and slowly heated to either 250 °C or 300 °C, respectively, and held at that temperature for 2 h. After cooling to room temperature, all the materials solidified into a dark brown, remeltable solid. After melting, the composite material was transferred into molds for shaping and cooled to room temperature (Figure 2 and Figure 3).
The sulfur present in high sulfur-content materials (HSMs) exists as both –Sx– chains that are linked covalently to the organic comonomers and entrapped sulfur species such as cyclo-S8, known as “dark sulfur”, which is not linked covalently to the organic comonomers [109,110,111]. Dark sulfur’s relative quantity within an HSM can influence both its thermal and its mechanical properties. In this study, dark sulfur was extracted from each HSM using ethyl acetate. The wt. % of each sample that was soluble (dark sulfur) and the insoluble fraction (organic crosslinked network) are provided in Table 1. The majority of sulfur in the reported lignin–sulfur composites was stabilized as covalently attached crosslinking catenates, with all of the composites showing a similar contribution of dark sulfur over a narrow range of 22–31 wt. %. Elemental analysis confirmed that very little organic material was extractable, with soluble portions consisting of 94–99% sulfur. It is important to note that the extraction experiment was only conducted to assess the relative contributions of the dark sulfur and of the crosslinked network to the overall structure. All subsequent thermal, morphological, and mechanical testing was conducted on the complete composites, comprising the network with the entrapped dark sulfur.
Powder X-ray diffraction (PXRD) (Figure 4, Figure 5, Figure 6 and Figures S1–S5, Supplementary Materials) was used for the initial qualitative assessment of crystallinity and species contributing to the crystalline domains of LOSx@T composites. As the amount of organic material increased, the PXRD data reveal the anticipated corresponding reduction in crystallinity: LOS90@230 is a crystalline polymer, LOS85@230 is a partially amorphous polymer, and LOS80@230 is primarily amorphous. This trend reflects the diminished capacity for the crystalline packing of poly/oligosulfur crosslinking chains as they become progressively shorter in response to the availability of more organic crosslinkable sites. The sharp peaks are the crystalline sulfur, while broad baselines between 20 and 30 2θ, most noticeable for the amorphous LOS80@230 (Figure 6), are characteristic of the polymer. LOS90@230 is almost entirely crystalline sulfur within the polymer composite, as seen by the very tall, sharp peaks (Figure 4). While PXRD provides qualitative confirmation of a decreasing percentage of crystallinity with increasing organic comonomer, it only provides a semiquantitative estimate of the percentage of crystallinity. Due to the nature of the composite having numerous diffractions of crystalline sulfur, it is difficult to identify lignin’s contribution within the pattern. Therefore, differential scanning calorimetry (DSC) data were used to calculate a more accurate percentage crystallinity for the composites (Table 2). We find that the percentage crystallinity values correlate quantitatively well with the PXRD patterns, which show increasing intensity of broad features about 20–30 2θ.
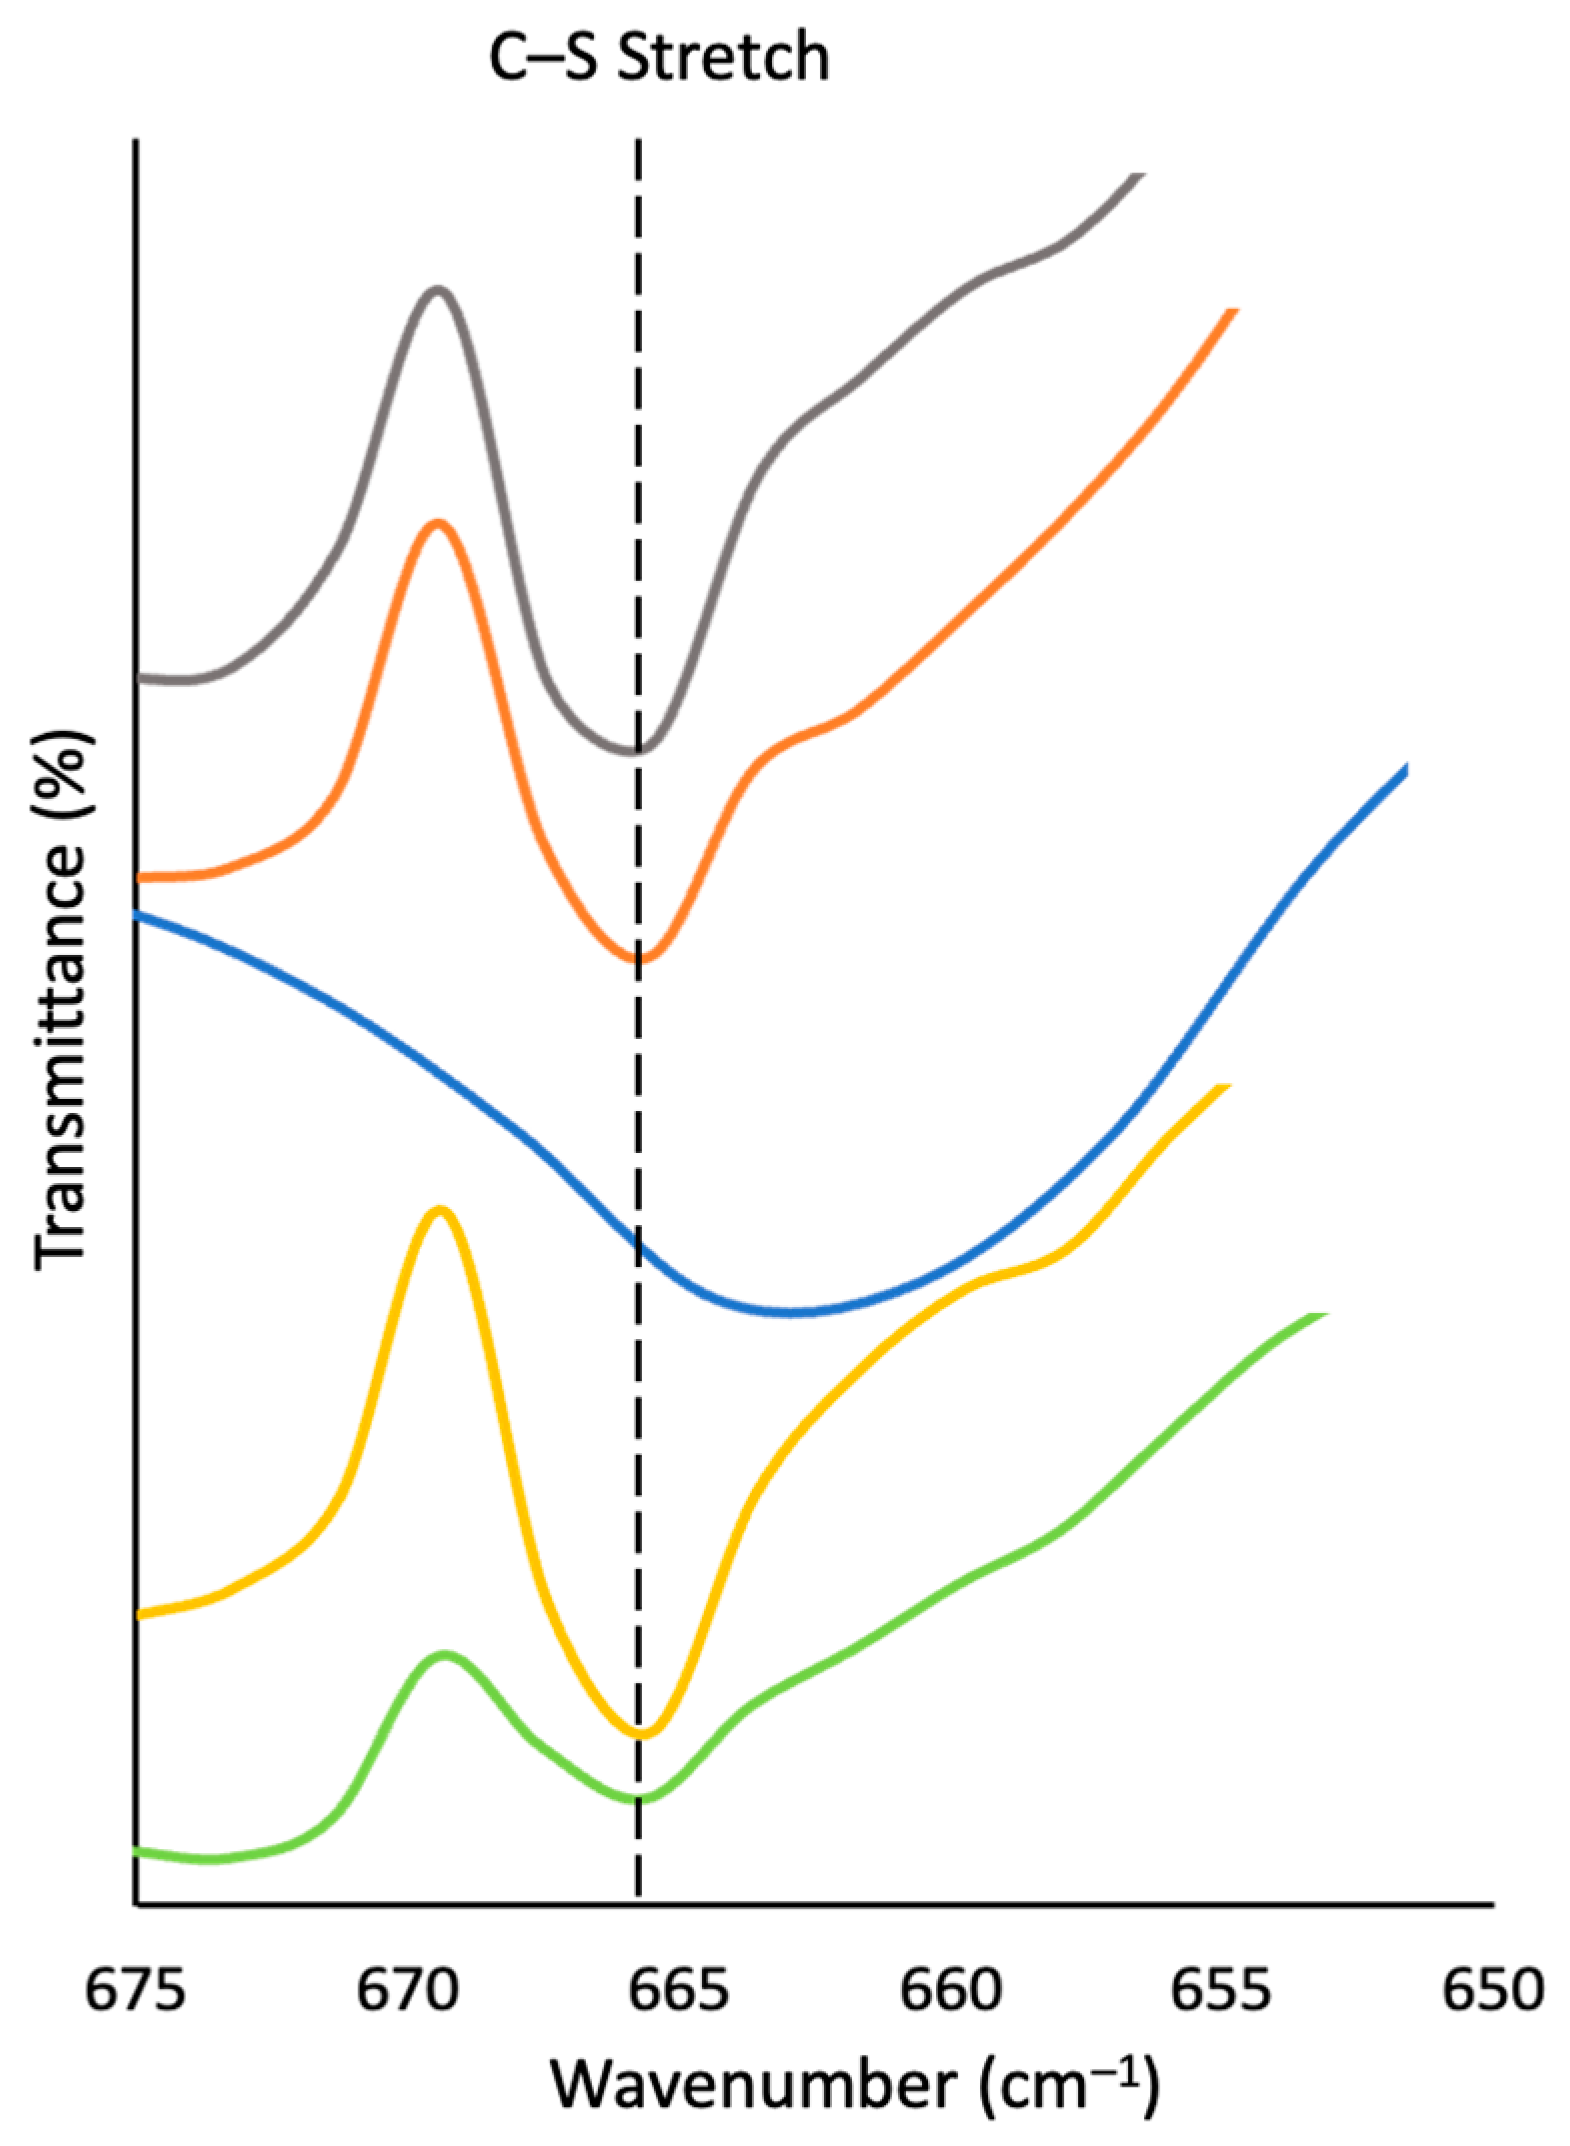
FT-IR spectra revealed further evidence of the formation of C–S bonds between the polymeric sulfur and lignin oil components (Figure 7). At 660 cm−1, a visible peak indicates a C–S stretch [112,113]. The IR spectra (Figures S6 and S7, Supplementary Materials) also revealed that LOSx@T composites preserved peaks characteristic of LO such as O–H stretches (3200–3500 cm−1), C–H stretches (2930 cm−1), and C–O stretches (1030–1200 cm−1) [114,115]. Other important peaks to note are those characteristic of lignin bands such as the C=O aromatic skeletal vibration observed from 1600 to 1620 cm−1 and the unconjugated carbonyl groups observed from 1700 to 1720 cm−1. As previously reported, the C–S stretch for LOS90@230 is predictably broadened because it has the lowest organic content and reaction temperature of the composites and therefore the longest average polysulfur chains between organic sites, leading to the greatest polydispersity of the possible bond stretch energies. The displacement of the bands observed can also be attributed to the reaction temperatures of the different composites. For example, slightly sharper peaks were observed in LOS80@230, LOS85@230, and LOS90@230 from 600 to 1200 cm−1 (Figure S8, Supplementary Materials) when compared to LOS90@250 and LOS90@300, which were reacted at higher temperatures.
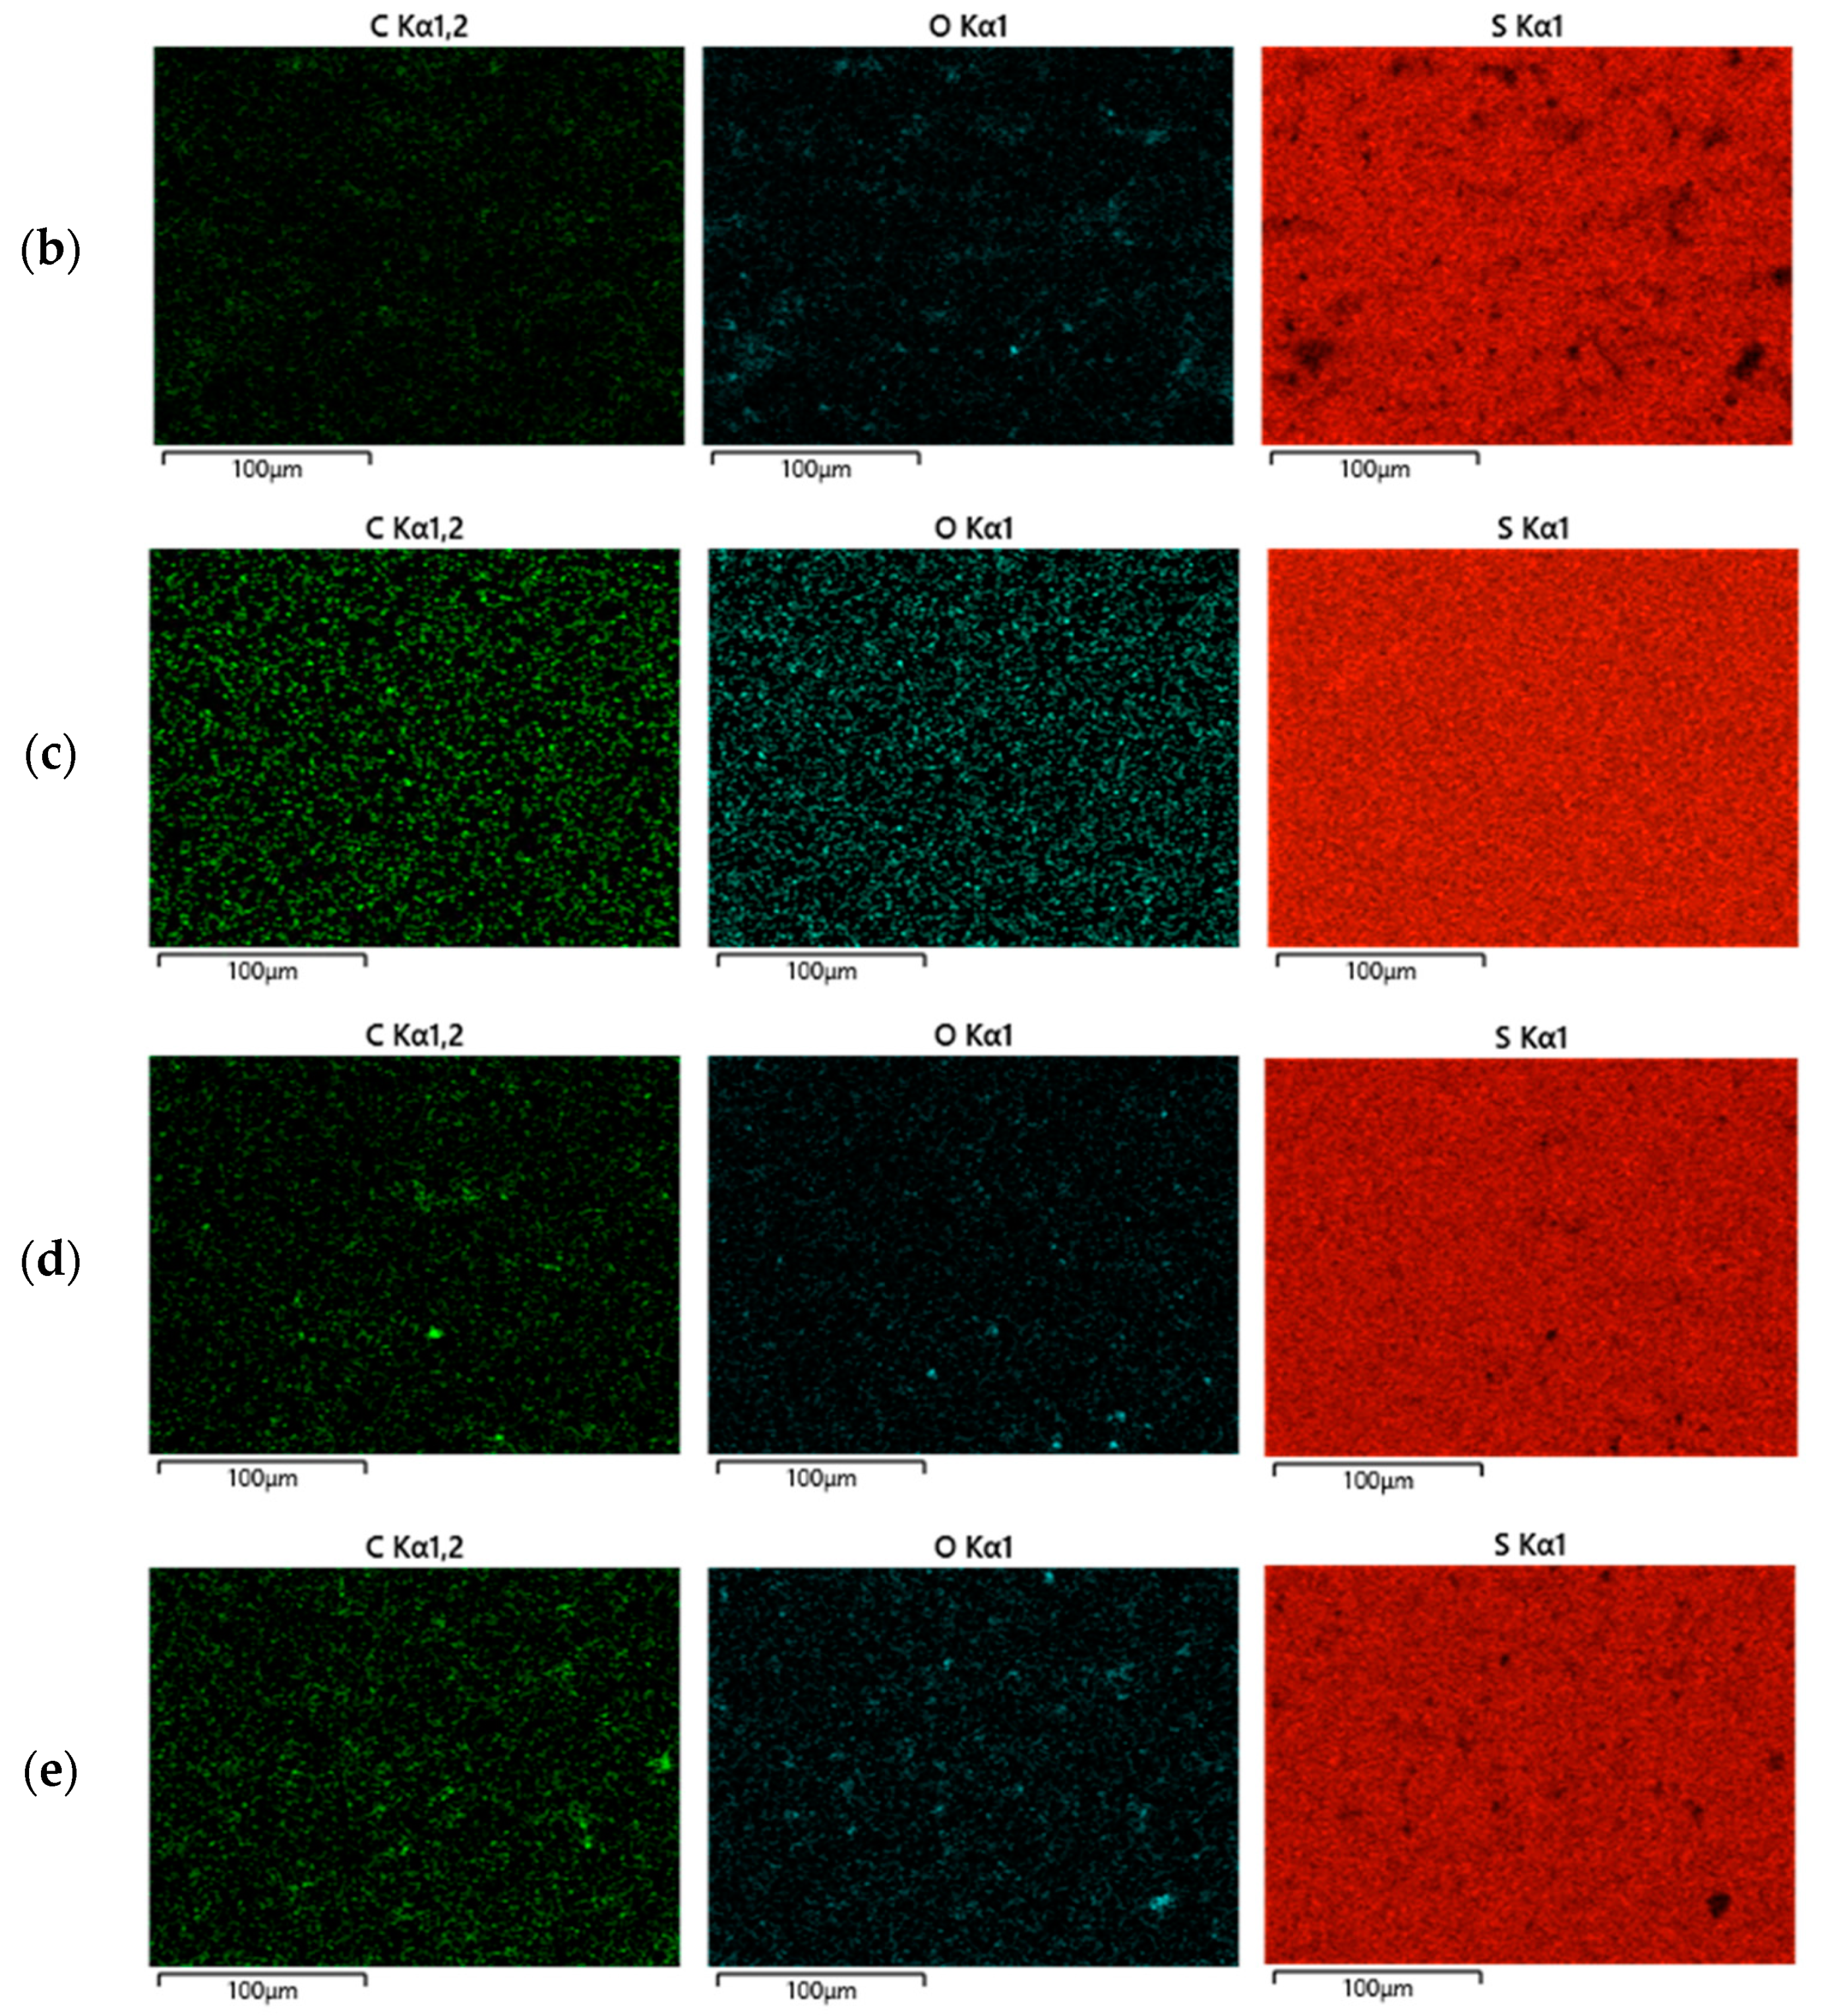
Scanning electron microscopy (SEM, Figures S8–S12) imaging accompanied by element mapping by energy-dispersive X-ray analysis (EDX) was utilized to evaluate the dispersal of elements in the LOSx@T composites (Figure 8). SEM/EDX data revealed a homogeneous distribution of sulfur, carbon, and oxygen.

2.2. Thermal and Morphological Properties of LOSx@T

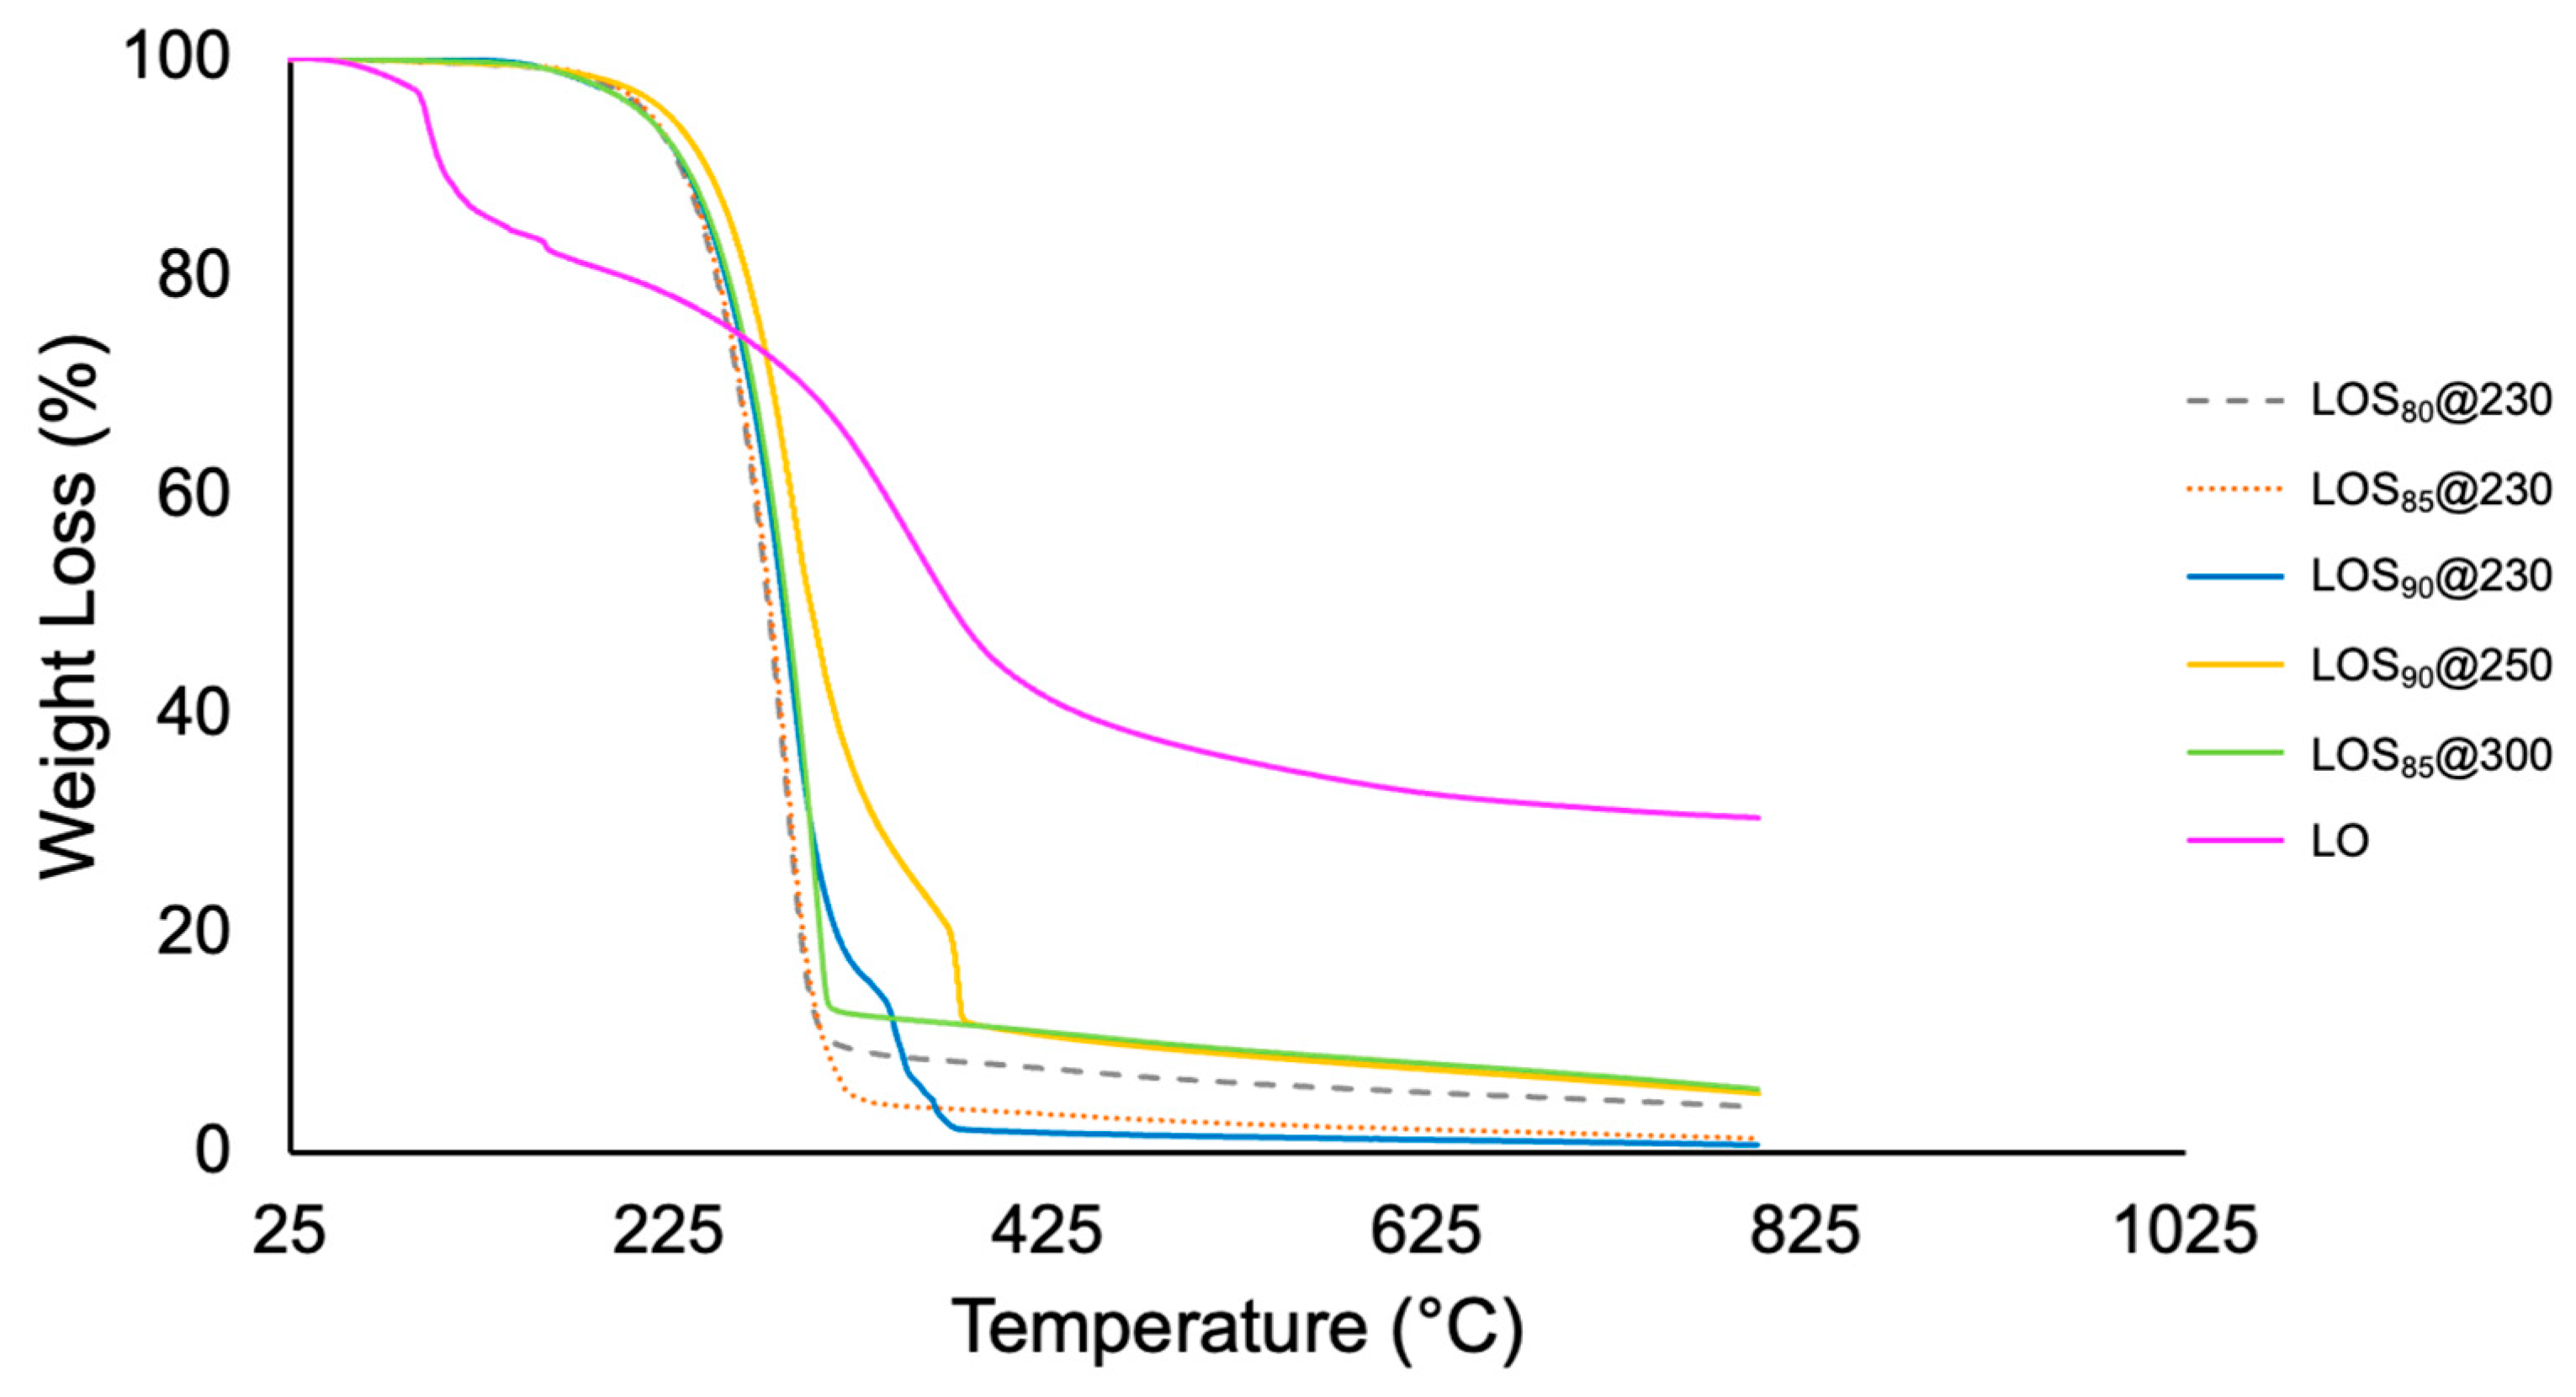
The thermal stability of the reported LOSx@T composites was assessed using thermogravimetric analysis (Figure 9). The TGA data for lignin oil (LO) prior to its reaction with elemental sulfur are also provided in Figure 9, and the origin of the decomposition events in LO have been previously delineated [116]. The TGA trace for each of the composites showed a single decomposition temperature (Td) ranging from 229 to 231 °C. These temperatures are characteristic of such HSMs due to the fact that elemental sulfur has a Td of 229 °C, which is attributable to the sublimation of sulfur in the LOSx@T composites. The smaller decomposition event at >300 °C in LOS90@230 and LOS90@250 is likely attributable to similar mechanisms leading to the corresponding decomposition events observed in lignin oil. The Td values for LOSx@T and other previously reported lignin-containing HSMs are summarized in Table 2.
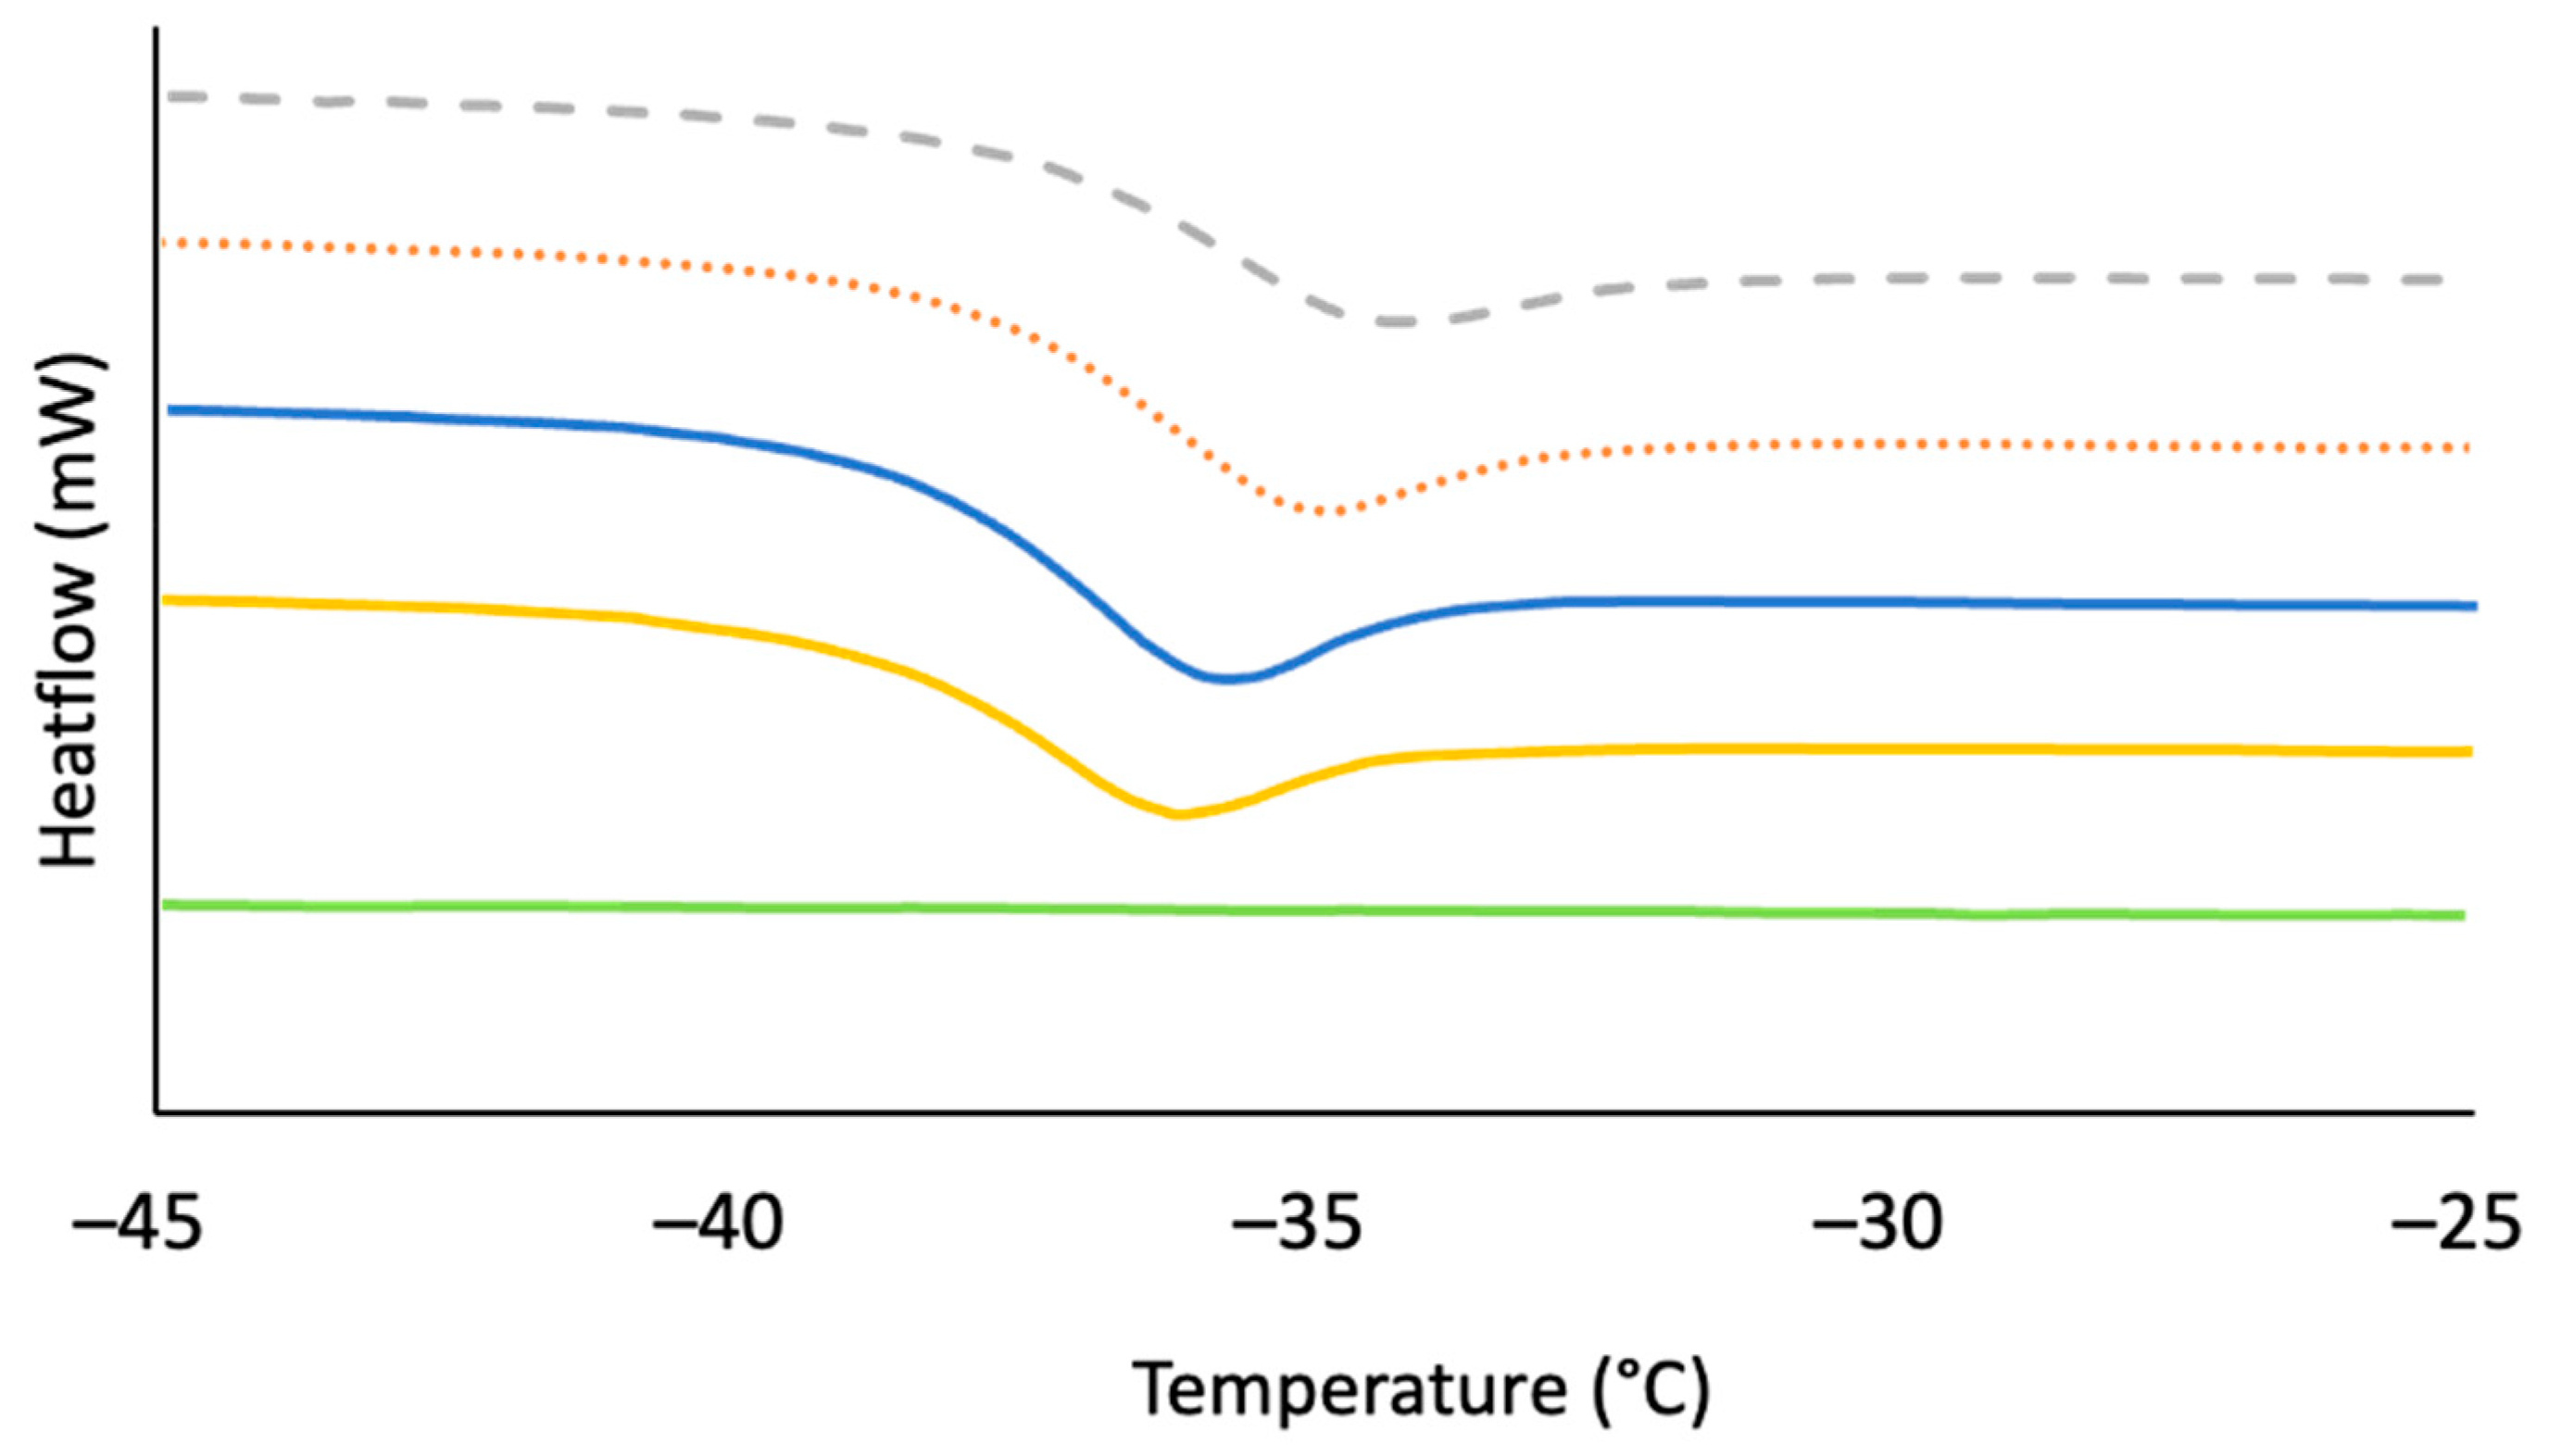
The analysis of LOSx@T composites by differential scanning calorimetry (DSC) (Figures S13–S27, Supplementary Materials) showed thermal transitions that were concomitant with the presence of polymeric sulfur and cyclo-S8. LOS90@230, LOS90@250, and LOS90@300 exhibited the melting peaks (114 °C, 117 °C, and 119 °C) expected for cyclo-S8. However, LOS85@230 and LOS80@230 exhibited lower melting peaks at 106 °C and 105 °C, indicating an α-to-β transition of sulfur. A glass transition temperature (Tg) was also witnessed (Figure 10) at −35 °C or −36 °C for all composites other than LOS90@300, diagnostic for polymeric sulfur [117,118,119]. Similar to the previously studied LS90–99 composites, LOS90@300 did not exhibit a glass transition temperature. This is likely due to the higher temperature allowing for more crosslinking, leading to shorter sulfur chains.
Melting and cold crystallization enthalpies determined from DSC data were employed for the calculation of the percentage crystallinity of the composites, further indicating the presence of cyclo-S8, using Equation (1).
Δ χ c = 1 Δ H m Δ H c c   Δ H m S Δ H c c S × 100 %  
where ΔXc signifies the change in the percentage crystallinity with respect to sulfur, ΔHm signifies the melting enthalpy of the composite, ΔHcc represents the cold crystallization enthalpy of the composite, ΔHm(S) is sulfur’s melting enthalpy, and ΔHcc(S) is sulfur’s cold crystallization enthalpy.
The percentage crystallinity of LOS90@230 is 57% relative to the crystallinity of pure elemental sulfur. Lower percentage crystallinity results in the reduced brittleness of HSMs. Compared to LSx composites (Table 1), LOS90@230 possesses a lower percentage crystallinity than any of the composites made from allylated lignin, for example, LS90–99 (percentage crystallinity of 67–91%). However, LOS90@230 possesses a higher percentage crystallinity than that of composites LS80 (8%) and LS85 (40%), reflecting the trend more qualitatively revealed by PXRD data (vide supra). These trends are summarized in Figure 11. LOS85@230 also has a lower percentage crystallinity (19%) than that of LOS90@230 (57%) and LS85–99 (40–91%). However, LOS85@230 possesses a higher percentage crystallinity than that of composite LS80 (8%). The reaction temperature does not seem to have a significant effect on the percentage crystallinity of lignin–sulfur materials.

2.3. Mechanical Properties and Environmental Impact Considerations

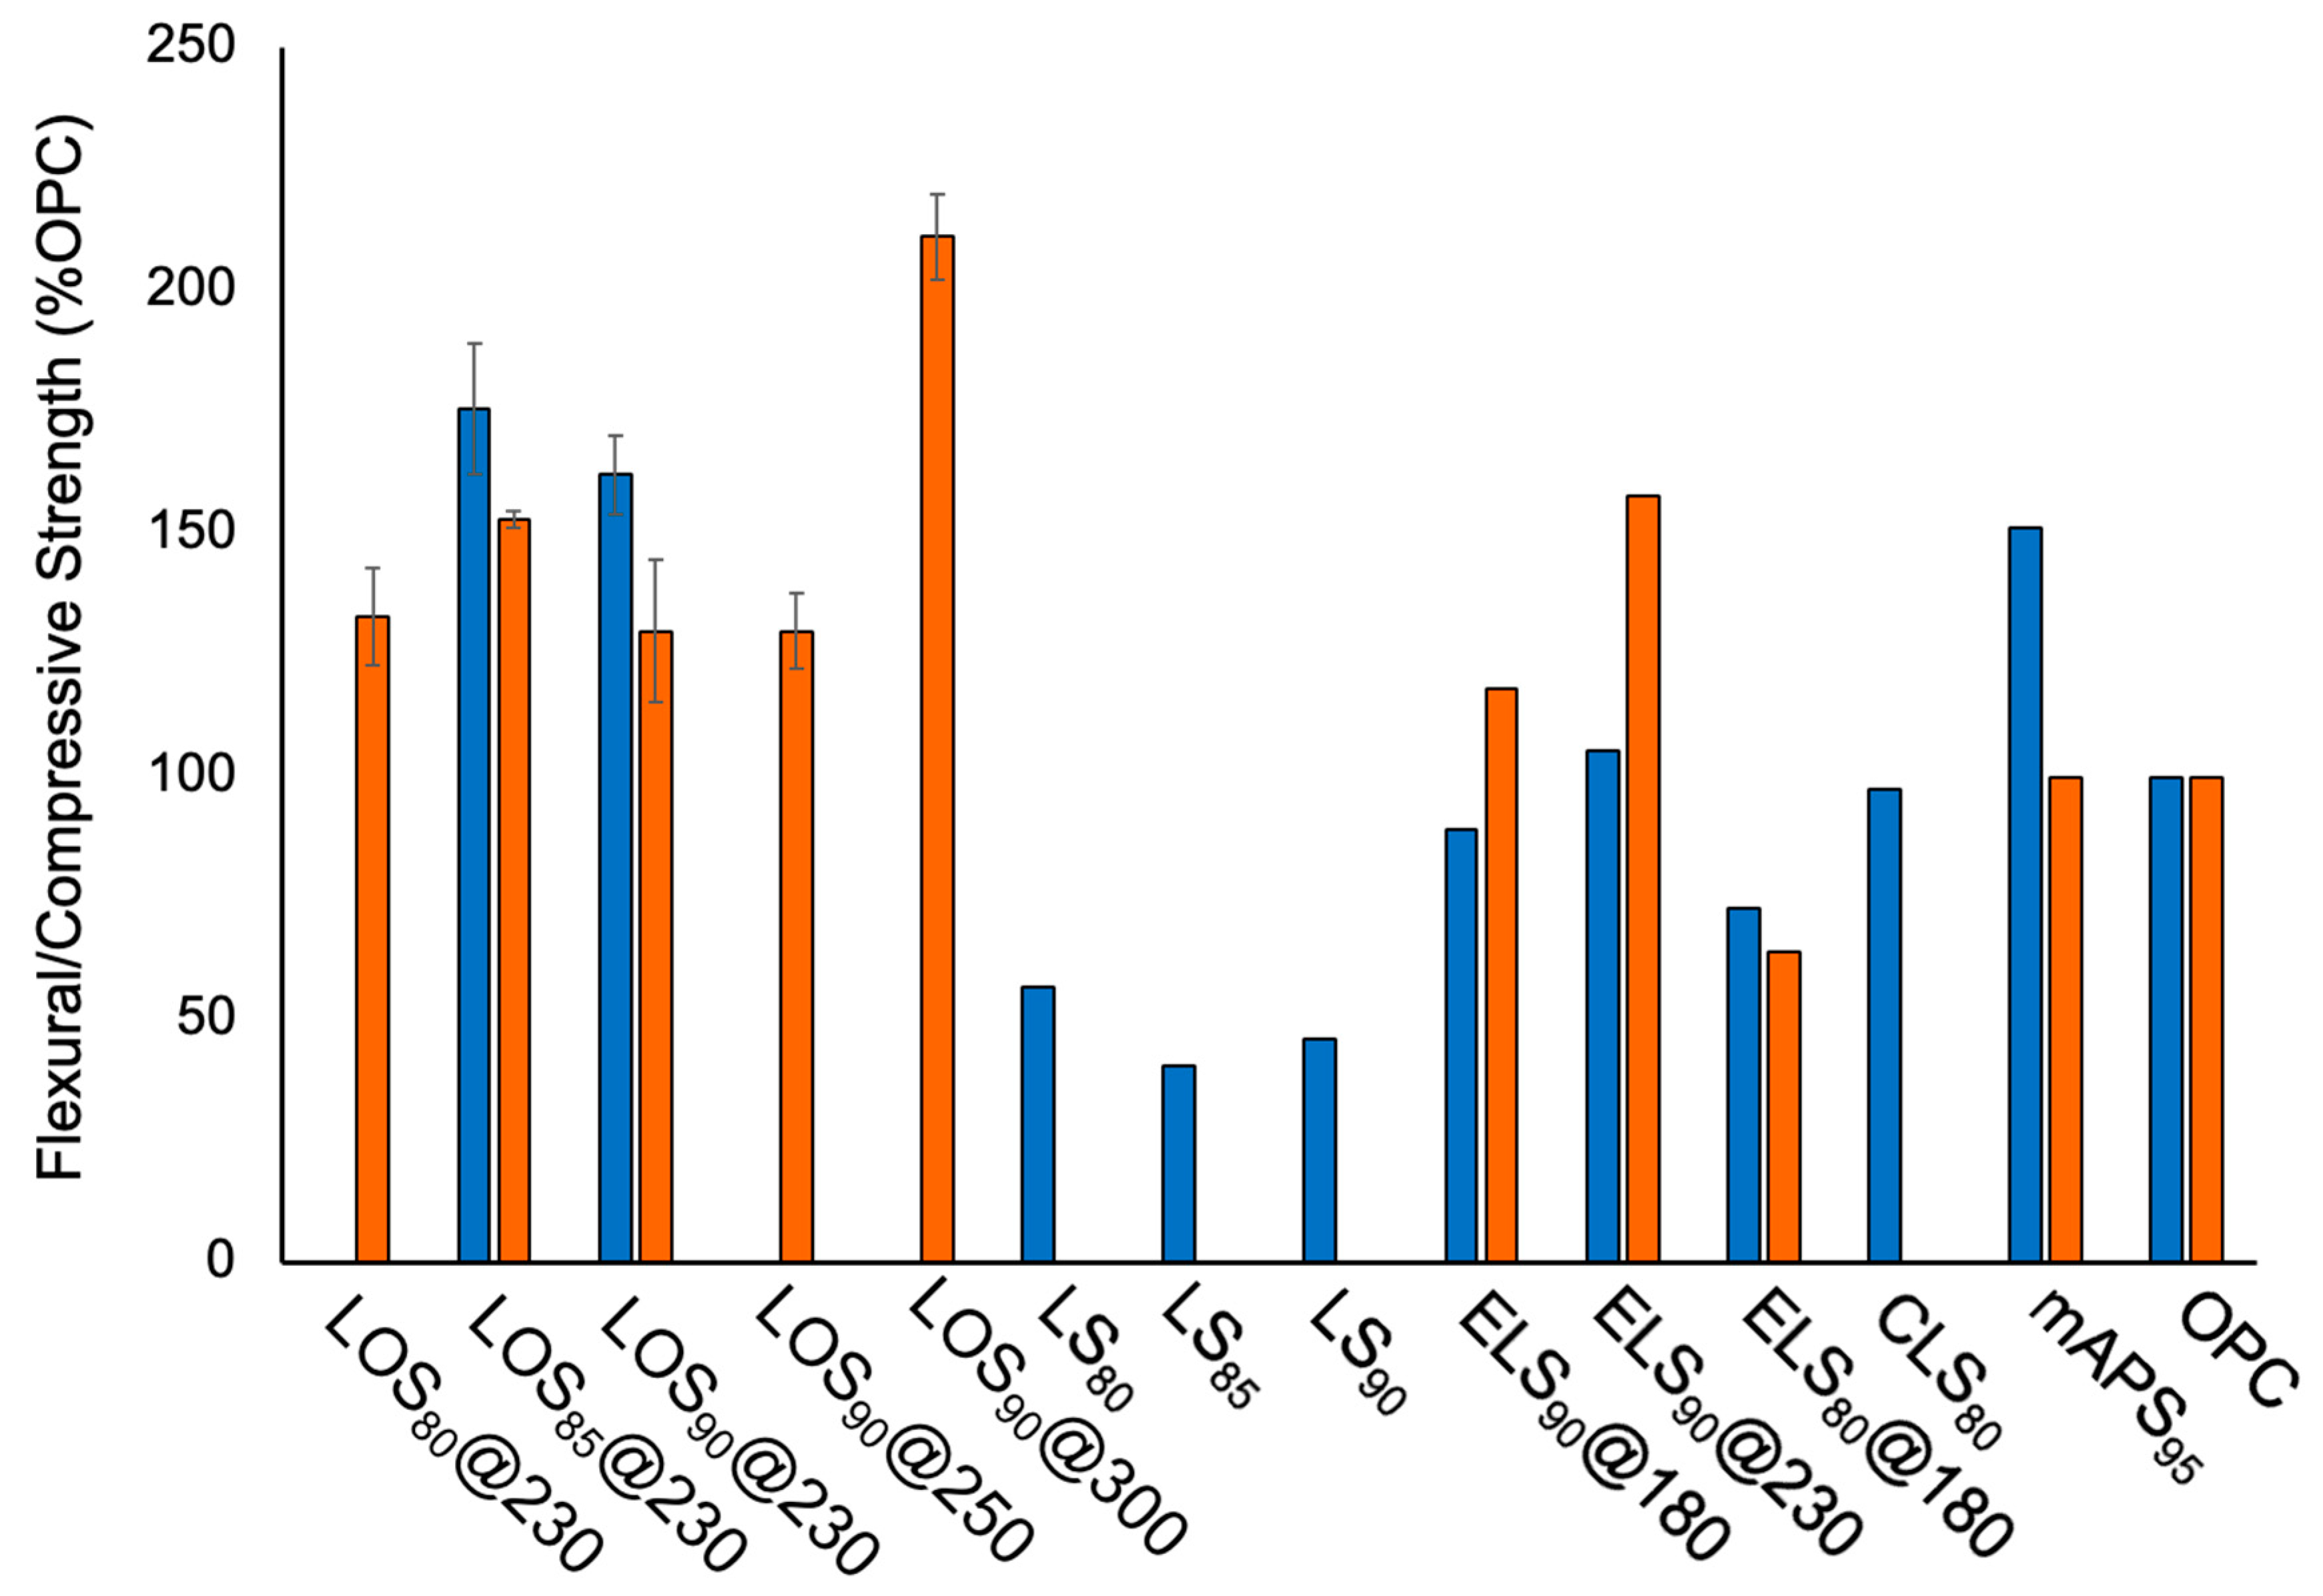
The LOSx@T composites studied herein must meet the specified mechanical strength requirements to be considered as potential replacements for less sustainable materials. For example, OPC requires a compressive strength greater than 17 MPa and a flexural strength greater than 3 MPa. The compressive strength of the LOSx@T composites reported exceeded that required of OPC with strengths ranging from 22.1 to 35.9 MPa. Other lignin-containing HSMs have been reported and compared to the LOSx@T composites. The composites ELSx@T (where x = wt. % sulfur in the reaction mixture and T represents the reaction temperature in °C), for example, were prepared by reacting sulfur with oleic-esterified lignin. ELS80@180 has a notably lower compressive strength (10.9 MPa) than LOSx@T composites. ELS80@180 comprises twice the amount of organic component as LOS90, LOS90@250, and LOS90@300. ELS80@180 was also reacted at a much lower temperature in comparison to LOSx@T composites, whose reaction temperatures ranged from 230 to 300 °C. A larger amount of organic material and lower reaction temperature possibly contributes to a lower sulfur rank, resulting in a lower compressive strength. The ELS90@180 and ELS90@230 composites exhibited similar compressive strengths as the LOS90@230, LOS85@230, LOS80@230, and LOS90@250 composites. The LOS90@300 exhibited a much higher compressive strength (35.9 MPa) than all other composites reported in Table 3 and compared graphically in Figure 12 (stress–strain plots are presented in Figures S28–S32, Supplementary Materials). This can possibly be attributed to the higher reaction temperature of 300 °C, which can lead to a higher sulfur rank and a higher compressive strength [65]. While there was not a clear trend displaying how an increase in organic material affects the compressive strength, an increase in compressive strength is observed as the reaction temperature is increased (Figure 13). The preparation of the oleic-esterified lignin (the precursor for ELSx@T) is a much more time- and energy-intensive process compared to the process for preparing the lignin oil required for preparing LOSx@T composites. Therefore, preparing lignin-oil-containing HSMs is a more realistic concept for acquiring comparable compressive strength features.
The flexural strengths/moduli of LOS90@230 and LOS85@230 composites were tested and assessed to reveal high flexural strengths (5.7 MPa and 6.5 MPa) and moduli (186 and 236 MPa) at room temperature (Table 3, stress–strain curves are provided in Figures S33 and S34, Supplementary Materials). These flexural strengths and moduli are much higher than the flexural strengths of previously reported LSx (where x = wt. % sulfur, prepared by the inverse vulcanization of allylated lignin) composites with flexural strengths ranging from 1.5 to 2.1 MPa and moduli ranging from 57 to 87 MPa. LOS90@230 and LOS85@230 also exhibited higher flexural strengths than ELSx@T composites (2.7–3.3 MPa), as well as CLS80 (3.6 MPa), a chlorolignin–sulfur composite comprising 80 wt. % sulfur. However, LOS90@230 exhibited a similar flexural strength to that of mAPS95 (5.6 MPa), a composite prepared by the inverse vulcanization of allyl lignin (2 wt. %), allyl cellulose (3 wt. %), and 95 wt. % sulfur. The flexural strengths/moduli were previously reported for additional HSM polymers containing organic crosslinkers. For example, dicyclopentadiene (DCPD), an industrial, inexpensive by-product, forms S-DCPD (50 wt. % dicyclopentadiene and 50 wt. % sulfur) after reaction with elemental sulfur. LOS85@230 (6.5 MPa) and LOS90@230 (5.7 MPa) compare moderately to S-DCPD (6.0 MPa). However, S-DCPD experiences a decrease in flexural strength when organic crosslinkers are incorporated. Linseed oil reacts with DCPD and sulfur to yield S-DCPD–linseed (50 wt. % sulfur, 25 wt. % dicyclopentadiene, and 25 wt. % linseed oil) and exhibits a faintly lower flexural strength (4.7 MPa). However, when a cheap biomass material known as limonene reacts with DCPD and sulfur to yield S-DCPD–limonene (25 wt. % dicyclopentadiene, 25 wt. % limonene, and 50 wt. % sulfur), a considerably lower flexural strength is revealed (1.9 MPa). Conversely, the flexural moduli of S-DCPD–linseed (1250 MPa), S-DCPD (3700 MPa), and S-DCPD–limonene (1750 MPa) [120] considerably surpass those of LOS85@230 (236 MPa) and LOS90@230 (186 MPa). Another important observation to note is that the flexural strengths of both the LOS90@230 and LOS85@230 composites exceed OPC’s flexural strength (3.7 MPa), therefore giving competition for commercial building materials. The mechanical strength characteristics of the LOSx@T and previously reported lignin-containing HSMs are summarized in Table 3 and compared graphically in Figure 12.

3. Materials and Methods

3.1. Materials

Sulfur powder (99.5%) was bought from Alfa Aesar (Haverhill, MA, USA). The chemicals employed did not undergo any further purification. The lignin oil used herein was produced via a reported method implementing the thermal solvolysis of kraft lignin (Sigma Aldrich, St. Louis, MO, USA) in the solvent ethanol following the reported procedure [40]. A detailed description of the preparation and characterization of lignin oil was previously reported for the synthesis and analysis of LOS90@230 [108]. The same lignin oil was used to prepare the remaining LOSx@T composites reported herein.

3.2. General Considerations and Instrumentation

Fourier transform infrared spectra were acquired using an IR instrument (Shimadzu IRAffinity-1S, Shimadzu Corporation, Columbia, MD, USA) equipped with an ATR attachment. Scans were collected over the range of 400–4000 cm−1 at ambient temperature with a resolution of 8 cm−1.
SEM was attained using a Schottky Field Emission Scanning Electron Microscope SU5000 (Hitachi High-Tech, Tokyo, Japan) operating in variable pressure mode while using an accelerating voltage of 15 kV.
Compressional strength measurements were commenced with cylinders by means of a Mark-10 ES30 (Mark-10 Corporation, Copiague, NY, USA) Manual Test Stand equipped with a Mark 10 M3-200 Force Gauge (USA). The composites studied herein were melted and formed in molds (Smooth-On Oomoo® 25 tin-cure, Oomoo Corp., Richmond, BC, Canada) and then allowed to cool to room temperature. The cylinders stood at room temperature for 4 d before compressive strength was tested. Tests for each composite were performed in triplicates, and the strength reported is the average of the three runs. The long-term stability of the reported materials is unknown.
Flexural strength analyses were performed using a Mettler Toledo DMA 1 STARe System (Mettler Toledo, Columbus, OH, USA) in single-cantilever mode. The samples were formed in silicon resin molds (Smooth-On Oomoo® 25 tin-cure). The sample dimensions were 1.5 × 10.7 × 5.0 mm. The temperature was 25 °C with a clamping force of 1 cN m. Samples were assessed in triplicates, and the observed flexural strengths/moduli are an average of the three trials.
TGA data were recorded (Mettler Toledo TGA 2 STARe System, TA Instruments, New Castle, DE, USA) across the temperature range of 20–800 °C at a heating rate of 10 °C·min−1 under a flow of N2 (100 mL·min−1).
DSC data were obtained by means of a Mettler Toledo DSC 3 STARe System (Mettler Toledo, Columbus, OH, USA) across a temperature range of −60 °C to 140 °C while implementing a heating rate of 10 °C·min−1 under a flow of N2 (200 mL·min−1). DSC measurements were conducted over three cooling and heating cycles. Data from the third heating cycle are reported herein, with the first cycle removing solvent impurities. During the third cycle, the glass-transition temperature was observed. DSC data were utilized to calculate the percentage crystallinity using Equation (1).
UV-vis data were collected on Agilent Technologies Cary 60 UV-vis (Agilent Technologies, Inc., Santa Clara, CA, USA) using Simple Reads software (Cary WinUV Scan Application Version 5.1.0.1016) over the range of 400–600 nm. Dark sulfur was quantified by using the extinction coefficient of sulfur at 275 nm along with the absorbance of ethyl acetate soluble fraction of each composite.

3.3. Synthesis of LOSx@T Composites

LOS80@230 and LOS85@230 were prepared by adding elemental sulfur (8.005 g, 8.500 g) and lignin oil (2.001 g, 1.503 g) to a heavy-walled pressure flask sealed by a Viton O-ring and a PTFE stopper along with a PTFE stir bar and then placed in an oil bath at 180 °C under continuous magnetic stirring. Next, the temperature was increased to 230 °C. The mixture was heated under rapid continuous stirring for a duration of 2 h. During the reaction time, the reaction mixture appeared homogeneous and turned dark brown in color. Stirring was stopped, and the reaction was removed from the heat. The material was cooled to room temperature, forming a solid dark brown substance. Forming the compressive strength cylinders (Figure 2) and flexural strength rectangular prisms (Figure 3) required remelting the product at 180 °C and then pouring the product into molds, followed by cooling to room temperature. This method resulted in a 99.7% yield for LOS80@230 and a 99.8% yield for LOS85@230. For LOS80@230 elemental analysis, the theoretical values were C 12.86, H 1.22, and S 80; the actual values found were C 10.94, H 0.46, and S 84.85. For LOS85@230 elemental analysis, the theoretical were C 9.64, H 0.91, and S 85; the actual values found were C 3.76, H 0.05, and S 94.49. LOS90@230 was prepared as previously reported [108].
LOS90@250 and LOS90@300 were prepared by adding elemental sulfur (13.500 g, 13.505 g) and lignin oil (1.501 g, 1.500 g) to a stainless steel autoclave reactor and heated to 250 °C under rapid mechanical stirring. After 2 h, the heat and stirring was stopped, and the autoclave vessel cooled to room temperature. After cooling, the homogeneous, dark brown solid was removed from the reaction vessel. Forming the compressive strength cylinders (Figure 2) required remelting the product at 180 °C and then pouring the product into molds, followed by cooling to room temperature. For LOS90@250 elemental analysis, the theoretical values were C 6.43, H 0.61, and S 90; the actual values found were C 7.33, H 0.14, and S 91.24. For LOS90@300 elemental analysis, the theoretical values were C 6.43, H 0.61, and S 90; the actual values found were C 5.43, H 0.05, and S 93.06.

3.4. General Method for Dark Sulfur Quantification

The method used herein to determine the quantity of dark sulfur is based on a method previously reported by Hasell’s group [109,110]. This method uses absorbance to quantify dark sulfur in HSMs. A small fraction of the composite (6–7 mg) was weighed to +/−0.0001 g precision using a microbalance and placed in a 250 mL volumetric flask with ethyl acetate and stirred for 30 min. This duration of agitation was chosen due to the solubility of elemental sulfur. Ethyl acetate has a lower solubility for sulfur and not oligomeric fractions; therefore, it will extracts dark sulfur within the composite [110]. The solution was then measured using a Carry-UV. A scan was taken over the range of 400–600 nm, and the absorbance at 275 nm was used in the calibration curve that was used to determine the concentration.

3.5. General Method for Ethyl Acetate Extractions for Dark Sulfur Quantification

A small amount of each composite (~50 mg) was placed in a vial along with 10 mL of ethyl acetate. This was then stirred for a duration of 1 h at room temperature. After stirring was finished, the vial was left standing still to allow the material to settle, and the ethyl acetate was then pipetted into a different vial. The ethyl acetate was then allowed to evaporate, with the soluble portion remaining in the vial.

4. Conclusions

Herein, we have demonstrated that lignin oil containing a mixture of oligomers can readily react with sulfur diradicals at varying amounts (80–90 wt. % S) and relatively low temperatures (230–300 °C). The resulting material formed durable, remeltable composites exhibiting compressive strengths (22.1–35.9 MPa) and flexural strengths (5.7–6.5 MPa) exceeding that of OPC (17 MPa). Increasing the amount of organic material did not result in a drastic change in properties; however, it was shown that increasing the reaction temperature improved the mechanical strength of the composites and decreased the crystallinity, resulting in a less brittle substance. These results show the great potential lignin oil has in the efforts to valorize the abundant yet underutilized lignin biomass.

Supplementary Materials

The following supporting information can be downloaded at https://www.mdpi.com/article/10.3390/molecules29174209/s1. Figure S1. Powder XRD trace of LOS80@230 (top) compared to that of alpha sulfur (bottom); Figure S2. Powder XRD trace of LOS85@230 (top) compared to that of alpha sulfur (bottom); Figure S3. Powder XRD trace of LOS90@230 (top) compared to that of alpha sulfur (bottom); Figure S4. Powder XRD trace of LOS90@250 (top) compared to that of alpha sulfur (bottom); Figure S5. Powder XRD trace of LOS90@300 (top) compared to that of alpha sulfur (bottom); Figure S6. Portion of the FT-IR spectrum of LOS80@230 (grey trace), LOS85@230 (orange trace), LOS90@230 (blue trace), LOS90@250 (yellow trace), and LOS90@300 (green trace); Figure S7. Portion of the FT-IR spectrum of LOS80@230 (grey trace), LOS85@230 (orange trace), LOS90@230 (blue trace), LOS90@250 (yellow trace), and LOS90@300 (green trace); Figure S8. Scanning electron microscopy (SEM) image of LOS80@230; Figure S9. Scanning electron microscopy (SEM) image of LOS85@230; Figure S10. Scanning electron microscopy (SEM) image of LOS90@230; Figure S11. Scanning electron microscopy (SEM) image of LOS90@250; Figure S12. Scanning electron microscopy (SEM) image of LOS90@300; Figure S13. Differential scanning calorimetry (DSC) traces (endothermic down) of the first heating (blue line) and first cooling (orange line) cycle for LOS80@230; Figure S14. Differential scanning calorimetry (DSC) traces (endothermic down) of the second heating (blue line) and second cooling (orange line) cycle for LOS80@230; Figure S15. Differential Scanning calorimetry (DSC) traces (endothermic down) of the third heating (blue line) and third cooling (orange line) cycle for LOS80@230; Figure S16. Differential scanning calorimetry (DSC) traces (endothermic down) of the first heating (blue line) and first cooling (orange line) cycle for LOS85@230; Figure S17. Differential scanning calorimetry (DSC) traces (endothermic down) of the second heating (blue line) and second cooling (orange line) cycle for LOS85@230; Figure S18. Differential scanning calorimetry (DSC) traces (endothermic down) of the third heating (blue line) and third cooling (orange line) cycle for LOS85@230; Figure S19. Differential scanning calorimetry (DSC) traces (endothermic down) of the first heating (blue line) and first cooling (orange line) cycle for LOS90@230; Figure S20. Differential scanning calorimetry (DSC) traces (endothermic down) of the second heating (blue line) and second cooling (orange line) cycle for LOS90@230; Figure S21. Differential scanning calorimetry (DSC) traces (endothermic down) of the third heating (blue line) and third cooling (orange line) cycle for LOS90@230; Figure S22. Differential scanning calorimetry (DSC) traces (endothermic down) of the first heating (blue line) and first cooling (orange line) cycle for LOS90@250; Figure S23. Differential scanning calorimetry (DSC) traces (endothermic down) of the second heating (blue line) and second cooling (orange line) cycle for LOS90@250; Figure S24. Differential scanning calorimetry (DSC) traces (endothermic down) of the third heating (blue line) and third cooling (orange line) cycle for LOS90@250; Figure S25. Differential scanning calorimetry (DSC) traces (endothermic down) of the first heating (blue line) and first cooling (orange line) cycle for LOS90@300; Figure S26. Differential scanning calorimetry (DSC) traces (endothermic down) of the second heating (blue line) and second cooling (orange line) cycle for LOS90@300; Figure S27. Differential scanning calorimetry (DSC) traces (endothermic down) of the third heating (blue line) and third cooling (orange line) cycle for LOS90@300; Figure S28. Representative stress–strain plot for the compressive-strength measurements of LOS80@230; Figure S29. Representative stress–strain plot for the compressive-strength measurements of LOS85@230; Figure S30. Representative stress–strain plot for the compressive-strength measurements of LOS90@230; Figure S31. Representative stress–strain plot for the compressive-strength measurements of LOS90@250; Figure S32. Representative stress–strain plot for the compressive-strength measurements of LOS90@300; Figure S33. Stress–strain curves of LOS85@230 determined during flexural strength testing. The orange line represents the propagations of the linear region of the stress–strain curve; Figure S34. P Stress–strain curves of LOS90@230 determined during flexural strength testing. The orange line represents the propagations of the linear region of the stress–strain curve.

Author Contributions

K.A.T. and N.L.K.D.: data curation, formal analysis, investigation, validation. K.A.T. and R.C.S.: writing—original draft. R.C.S.: conceptualization, funding acquisition, methodology, resources, supervision. N.L.K.D.: writing—review and editing. All authors have read and agreed to the published version of the manuscript.

Funding

This research is funded by the National Science Foundation grant number CHE-2203669 awarded to RCS.

Institutional Review Board Statement

Not applicable.

Informed Consent Statement

Not applicable.

Data Availability Statement

Data are contained within the article and Supplementary Materials.

Conflicts of Interest

The authors declare no conflicts of interest.

References

  1. Wang, C.; Kelley, S.S.; Venditti, R.A. Lignin-Based Thermoplastic Materials. ChemSusChem 2016, 9, 770–783. [Google Scholar] [CrossRef]
  2. Boerjan, W.; Ralph, J.; Baucher, M. Lignin Biosynthesis. Annu. Rev. Plant Biol. 2003, 54, 519–546. [Google Scholar] [CrossRef] [PubMed]
  3. Argyropoulos, D.S.; Jurasek, L.; Krištofová, L.; Xia, Z.; Sun, Y.; Paluš, E. Abundance and Reactivity of Dibenzodioxocins in Softwood Lignin. J. Agric. Food Chem. 2002, 50, 658–666. [Google Scholar] [CrossRef] [PubMed]
  4. Xie, S.; Ragauskas, A.J.; Yuan, J.S. Lignin Conversion: Opportunities and Challenges for the Integrated Biorefinery. Ind. Biotechnol. 2016, 12, 161–167. [Google Scholar] [CrossRef]
  5. Zoia, L.; Salanti, A.; Frigerio, P.; Orlandi, M. Exploring allylation and Claisen rearrangement as a novel chemical modification of lignin. BioResources 2014, 9, 6540–6561. [Google Scholar] [CrossRef]
  6. Ralph, J.; Lapierre, C.; Boerjan, W. Lignin structure and its engineering. Curr. Opin. Biotechnol. 2019, 56, 240–249. [Google Scholar] [CrossRef]
  7. Katahira, R.; Elder, T.J.; Beckham, G.T. A Brief Introduction to Lignin Structure. In Lignin Valorization: Emerging Approaches; Beckham, G.T., Ed.; The Royal Society of Chemistry: Piccadilly, London, 2018; pp. 1–20. [Google Scholar]
  8. Hatakeyama, H.; Hatakeyama, T. Lignin Structure, Properties, and Applications. In Biopolymers: Lignin, Proteins, Bioactive Nanocomposites; Abe, A., Dusek, K., Kobayashi, S., Eds.; Springer: Berlin/Heidelberg, Germany, 2010; pp. 1–63. [Google Scholar]
  9. Collins, M.N.; Nechifor, M.; Tanasă, F.; Zănoagă, M.; McLoughlin, A.; Stróżyk, M.A.; Culebras, M.; Teacă, C.-A. Valorization of lignin in polymer and composite systems for advanced engineering applications—A review. Int. J. Biol. Macromol. 2019, 131, 828–849. [Google Scholar] [CrossRef]
  10. Petridis, L.; Schulz, R.; Smith, J.C. Simulation Analysis of the Temperature Dependence of Lignin Structure and Dynamics. J. Am. Chem. Soc. 2011, 133, 20277–20287. [Google Scholar] [CrossRef]
  11. Ragauskas, A.J.; Beckham, G.T.; Biddy, M.J.; Chandra, R.; Chen, F.; Davis, M.F.; Davison, B.H.; Dixon, R.A.; Gilna, P.; Keller, M.; et al. Lignin Valorization: Improving Lignin Processing in the Biorefinery. Science 2014, 344, 1246843. [Google Scholar] [CrossRef]
  12. Zakzeski, J.; Bruijnincx, P.C.A.; Jongerius, A.L.; Weckhuysen, B.M. The Catalytic Valorization of Lignin for the Production of Renewable Chemicals. Chem. Rev. 2010, 110, 3552–3599. [Google Scholar] [CrossRef]
  13. Sethupathy, S.; Murillo Morales, G.; Gao, L.; Wang, H.; Yang, B.; Jiang, J.; Sun, J.; Zhu, D. Lignin valorization: Status, challenges and opportunities. Bioresour. Technol. 2022, 347, 126696. [Google Scholar] [CrossRef] [PubMed]
  14. Sun, R.-C. Lignin Source and Structural Characterization. ChemSusChem 2020, 13, 4385–4393. [Google Scholar] [CrossRef] [PubMed]
  15. Reshmy, R.; Athiyaman Balakumaran, P.; Divakar, K.; Philip, E.; Madhavan, A.; Pugazhendhi, A.; Sirohi, R.; Binod, P.; Kumar Awasthi, M.; Sindhu, R. Microbial valorization of lignin: Prospects and challenges. Bioresour. Technol. 2022, 344, 126240. [Google Scholar] [CrossRef] [PubMed]
  16. Singhvi, M.; Kim, B.S. Lignin valorization using biological approach. Biotechnol. Appl. Biochem. 2021, 68, 459–468. [Google Scholar] [CrossRef]
  17. Crestini, C.; Lange, H.; Sette, M.; Argyropoulos, D.S. On the structure of softwood kraft lignin. Green Chem. 2017, 19, 4104–4121. [Google Scholar] [CrossRef]
  18. Suota, M.J.; da Silva, T.A.; Zawadzki, S.F.; Sassaki, G.L.; Hansel, F.A.; Paleologou, M.; Ramos, L.P. Chemical and structural characterization of hardwood and softwood LignoForce™ lignins. Ind. Crops Prod. 2021, 173, 114138. [Google Scholar] [CrossRef]
  19. Figueiredo, P.; Lintinen, K.; Hirvonen, J.T.; Kostiainen, M.A.; Santos, H.A. Properties and chemical modifications of lignin: Towards lignin-based nanomaterials for biomedical applications. Prog. Mater. Sci. 2018, 93, 233–269. [Google Scholar] [CrossRef]
  20. Rohella, R.S.; Sahoo, N.; Chakravortty, V. Lignin macromolecule. Resonance 1997, 2, 60–66. [Google Scholar] [CrossRef]
  21. Vanholme, R.; Demedts, B.; Morreel, K.; Ralph, J.; Boerjan, W. Lignin Biosynthesis and Structure. Plant Physiol. 2010, 153, 895–905. [Google Scholar] [CrossRef]
  22. Adler, E. Structural elements of lignin. Ind. Eng. Chem. 1957, 49, 1377–1383. [Google Scholar] [CrossRef]
  23. Xia, M.; Valverde-Barrantes, O.J.; Suseela, V.; Blackwood, C.B.; Tharayil, N. Characterizing natural variability of lignin abundance and composition in fine roots across temperate trees: A comparison of analytical methods. New Phytol. 2022, 236, 2358–2373. [Google Scholar] [CrossRef] [PubMed]
  24. Ponnusamy, V.K.; Nguyen, D.D.; Dharmaraja, J.; Shobana, S.; Banu, J.R.; Saratale, R.G.; Chang, S.W.; Kumar, G. A review on lignin structure, pretreatments, fermentation reactions and biorefinery potential. Bioresour. Technol. 2019, 271, 462–472. [Google Scholar] [CrossRef]
  25. Sette, M.; Wechselberger, R.; Crestini, C. Elucidation of Lignin Structure by Quantitative 2D NMR. Chem.—A Eur. J. 2011, 17, 9529–9535. [Google Scholar] [CrossRef]
  26. Vanholme, R.; Morreel, K.; Ralph, J.; Boerjan, W. Lignin engineering. Curr. Opin. Plant Biol. 2008, 11, 278–285. [Google Scholar] [CrossRef] [PubMed]
  27. Martínez, Á.T.; Rencoret, J.; Marques, G.; Gutiérrez, A.; Ibarra, D.; Jiménez-Barbero, J.; del Río, J.C. Monolignol acylation and lignin structure in some nonwoody plants: A 2D NMR study. Phytochemistry 2008, 69, 2831–2843. [Google Scholar] [CrossRef] [PubMed]
  28. Li, M.; Pu, Y.; Ragauskas, A.J. Current Understanding of the Correlation of Lignin Structure with Biomass Recalcitrance. Front. Chem. 2016, 4, 45. [Google Scholar] [CrossRef]
  29. Bonawitz, N.D.; Chapple, C. The Genetics of Lignin Biosynthesis: Connecting Genotype to Phenotype. Annu. Rev. Genet. 2010, 44, 337–363. [Google Scholar] [CrossRef]
  30. Novaes, E.; Kirst, M.; Chiang, V.; Winter-Sederoff, H.; Sederoff, R. Lignin and Biomass: A Negative Correlation for Wood Formation and Lignin Content in Trees. Plant Physiol. 2010, 154, 555–561. [Google Scholar] [CrossRef]
  31. Rinaldi, R.; Jastrzebski, R.; Clough, M.T.; Ralph, J.; Kennema, M.; Bruijnincx, P.C.; Weckhuysen, B.M. Paving the Way for Lignin Valorisation: Recent Advances in Bioengineering, Biorefining and Catalysis. Angew. Chem. (Int. Ed.) 2016, 55, 8164–8215. [Google Scholar] [CrossRef]
  32. Wong, S.S.; Shu, R.; Zhang, J.; Liu, H.; Yan, N. Downstream processing of lignin derived feedstock into end products. Chem. Soc. Rev. 2020, 49, 5510–5560. [Google Scholar] [CrossRef]
  33. Sun, Z.; Cheng, J.; Wang, D.; Yuan, T.-Q.; Song, G.; Barta, K. Downstream Processing Strategies for Lignin-First Biorefinery. ChemSusChem 2020, 13, 5199–5212. [Google Scholar] [CrossRef] [PubMed]
  34. Yao, Y.; Farac, N.F.; Azimi, G. Supercritical Fluid Extraction of Rare Earth Elements from Nickel Metal Hydride Battery. ACS Sustain. Chem. Eng. 2018, 6, 1417–1426. [Google Scholar] [CrossRef]
  35. Janicka, P.; Płotka-Wasylka, J.; Jatkowska, N.; Chabowska, A.; Fares, M.Y.; Andruch, V.; Kaykhaii, M.; Gębicki, J. Trends in the new generation of green solvents in extraction processes. Curr. Opin. Green Sustain. Chem. 2022, 37, 100670. [Google Scholar] [CrossRef]
  36. Cañadas, R.; González-Miquel, M.; González, E.J.; Núñez de Prado, A.; Díaz, I.; Rodríguez, M. Sustainable Recovery of High Added-Value Vanilla Compounds from Wastewater Using Green Solvents. ACS Sustain. Chem. Eng. 2021, 9, 4850–4862. [Google Scholar] [CrossRef]
  37. Cañadas, R.; González-Miquel, M.; González, E.J.; Díaz, I.; Rodríguez, M. Evaluation of bio-based solvents for phenolic acids extraction from aqueous matrices. J. Mol. Liq. 2021, 338, 116930. [Google Scholar] [CrossRef]
  38. Rapinel, V.; Rombaut, N.; Rakotomanomana, N.; Vallageas, A.; Cravotto, G.; Chemat, F. An original approach for lipophilic natural products extraction: Use of liquefied n-butane as alternative solvent to n-hexane. LWT-Food Sci. Technol. 2017, 85, 524–533. [Google Scholar] [CrossRef]
  39. Rapinel, V.; Breil, C.; Makerri, C.; Jacotet-Navarro, M.; Rakotomanomana, N.; Vallageas, A.; Chemat, F. Feasibility of using liquefied gas HFO-1234ze (trans-1,3,3,3-tetrafluoroprop-1-ene) as an alternative to conventional solvents for solid–liquid extraction of food ingredients and natural products. LWT-Food Sci. Technol. 2017, 83, 225–234. [Google Scholar] [CrossRef]
  40. Kouris, P.D.; van Osch, D.J.G.P.; Cremers, G.J.W.; Boot, M.D.; Hensen, E.J.M. Mild thermolytic solvolysis of technical lignins in polar organic solvents to a crude lignin oil. Sustain. Energy Fuels 2020, 4, 6212–6226. [Google Scholar] [CrossRef]
  41. Jessop, P.G. Searching for green solvents. Green Chem. 2011, 13, 1391–1398. [Google Scholar] [CrossRef]
  42. Tekin, K.; Hao, N.; Karagoz, S.; Ragauskas, A.J. Ethanol: A Promising Green Solvent for the Deconstruction of Lignocellulose. ChemSusChem 2018, 11, 3559–3575. [Google Scholar] [CrossRef]
  43. Schutyser, W.; Renders, T.; Van den Bosch, S.; Koelewijn, S.F.; Beckham, G.T.; Sels, B.F. Chemicals from lignin: An interplay of lignocellulose fractionation, depolymerisation, and upgrading. Chem. Soc. Rev. 2018, 47, 852–908. [Google Scholar] [CrossRef]
  44. Mabee, W.E.; McFarlane, P.N.; Saddler, J.N. Biomass availability for lignocellulosic ethanol production. Biomass Bioenergy 2011, 35, 4519–4529. [Google Scholar] [CrossRef]
  45. Capello, C.; Fischer, U.; Hungerbühler, K. What is a green solvent? A comprehensive framework for the environmental assessment of solvents. Green Chem. 2007, 9, 927–934. [Google Scholar] [CrossRef]
  46. Zhang, X.; Tang, Y.; Qu, S.; Da, J.; Hao, Z. H2S-Selective Catalytic Oxidation: Catalysts and Processes. ACS Catal. 2015, 5, 1053–1067. [Google Scholar] [CrossRef]
  47. Lim, J.; Pyun, J.; Char, K. Recent approaches for the direct use of elemental sulfur in the synthesis and processing of advanced materials. Angew. Chem. Int. Ed. 2015, 54, 3249–3258. [Google Scholar] [CrossRef]
  48. Crockett, M.P.; Evans, A.M.; Worthington, M.J.; Albuquerque, I.S.; Slattery, A.D.; Gibson, C.T.; Campbell, J.A.; Lewis, D.A.; Bernardes, G.J.; Chalker, J.M. Sulfur-Limonene Polysulfide: A Material Synthesized Entirely from Industrial By-Products and Its Use in Removing Toxic Metals from Water and Soil. Angew. Chem. Int. Ed. 2016, 55, 1714–1718. [Google Scholar] [CrossRef] [PubMed]
  49. Worthington, M.J.H.; Kucera, R.L.; Chalker, J.M. Green chemistry and polymers made from sulfur. Green Chem. 2017, 19, 2748–2761. [Google Scholar] [CrossRef]
  50. Yan, P.; Zhao, W.; Tonkin, S.J.; Chalker, J.M.; Schiller, T.L.; Hasell, T. Stretchable and Durable Inverse Vulcanized Polymers with Chemical and Thermal Recycling. Chem. Mater. 2022, 34, 1167–1178. [Google Scholar] [CrossRef]
  51. Davis, A.E.; Sayer, K.B.; Jenkins, C.L. A comparison of adhesive polysulfides initiated by garlic essential oil and elemental sulfur to create recyclable adhesives. Polym. Chem. 2022, 13, 4634–4640. [Google Scholar] [CrossRef]
  52. Eder, M.L.; Call, C.B.; Jenkins, C.L. Utilizing Reclaimed Petroleum Waste to Synthesize Water-Soluble Polysulfides for Selective Heavy Metal Binding and Detection. ACS Appl. Polym. Mater. 2022, 4, 1110–1116. [Google Scholar] [CrossRef]
  53. Herrera, C.; Ysinga, K.J.; Jenkins, C.L. Polysulfides Synthesized from Renewable Garlic Components and Repurposed Sulfur Form Environmentally Friendly Adhesives. ACS Appl. Mater. Interfaces 2019, 11, 35312–35318. [Google Scholar] [CrossRef]
  54. Orme, K.; Fistrovich, A.H.; Jenkins, C.L. Tailoring Polysulfide Properties through Variations of Inverse Vulcanization. Macromolecules 2020, 53, 9353–9361. [Google Scholar] [CrossRef]
  55. Westerman, C.R.; Jenkins, C.L. Dynamic Sulfur Bonds Initiate Polymerization of Vinyl and Allyl Ethers at Mild Temperatures. Macromolecules 2018, 51, 7233–7238. [Google Scholar] [CrossRef]
  56. Grimm, A.P.; Scheiger, J.M.; Roesky, P.W.; Théato, P. Inverse vulcanization of trimethoxyvinylsilane particles. Polym. Chem. 2022, 13, 5852–5860. [Google Scholar] [CrossRef]
  57. Gomez, I.; Leonet, O.; Blazquez, J.A.; Mecerreyes, D. Inverse Vulcanization of Sulfur using Natural Dienes as Sustainable Materials for Lithium-Sulfur Batteries. ChemSusChem 2016, 9, 3419–3425. [Google Scholar] [CrossRef]
  58. Wagenfeld, J.-G.; Al-Ali, K.; Almheiri, S.; Slavens, A.F.; Calvet, N. Sustainable applications utilizing sulfur, a by-product from oil and gas industry: A state-of-the-art review. Waste Manag. 2019, 95, 78–89. [Google Scholar] [CrossRef]
  59. Wujcik, K.H.; Wang, D.R.; Raghunathan, A.; Drake, M.; Pascal, T.A.; Prendergast, D.; Balsara, N.P. Lithium Polysulfide Radical Anions in Ether-Based Solvents. J. Phys. Chem. C 2016, 120, 18403–18410. [Google Scholar] [CrossRef]
  60. Diez, S.; Hoefling, A.; Theato, P.; Pauer, W. Mechanical and Electrical Properties of Sulfur-Containing Polymeric Materials Prepared via Inverse Vulcanization. Polymers 2017, 9, 59. [Google Scholar] [CrossRef]
  61. Hoefling, A.; Lee, Y.J.; Theato, P. Sulfur-Based Polymer Composites from Vegetable Oils and Elemental Sulfur: A Sustainable Active Material for Li–S Batteries. Macromol. Chem. Phys. 2017, 218, 1600303. [Google Scholar] [CrossRef]
  62. Westerman, C.R.; Walker, P.M.; Jenkins, C.L.; Westerman, C.R.; Walker, P.M. Synthesis of Terpolymers at Mild Temperatures Using Dynamic Sulfur Bonds in Poly(S-Divinylbenzene). J. Vis. Exp. 2019, 147, e59620. [Google Scholar] [CrossRef]
  63. Karunarathna, M.S.; Lauer, M.K.; Thiounn, T.; Smith, R.C.; Tennyson, A.G. Valorization of waste to yield recyclable composites of elemental sulfur and lignin. J. Mater. Chem. A 2019, 7, 15683–15690. [Google Scholar] [CrossRef]
  64. Karunarathna, M.S.; Lauer, M.K.; Smith, R.C. Facile route to an organosulfur composite from biomass-derived guaiacol and waste sulfur. J. Mater. Chem. A 2020, 8, 20318–20322. [Google Scholar] [CrossRef]
  65. Karunarathna, M.S.; Maladeniya, C.P.; Lauer, M.K.; Tennyson, A.G.; Smith, R.C. Durable composites by vulcanization of oleyl-esterified lignin. RSC Adv. 2023, 13, 3234–3240. [Google Scholar] [CrossRef] [PubMed]
  66. Mohamed, A.-M.O.; El Gamal, M. Sulfur based hazardous waste solidification. Environ. Geol. 2007, 53, 159–175. [Google Scholar] [CrossRef]
  67. Rauchfuss, T. Under sulfur’s spell. Nat. Chem. 2011, 3, 648. [Google Scholar] [CrossRef]
  68. Chung, W.J.; Griebel, J.J.; Kim, E.T.; Yoon, H.; Simmonds, A.G.; Ji, H.J.; Dirlam, P.T.; Glass, R.S.; Wie, J.J.; Nguyen, N.A.; et al. The use of elemental sulfur as an alternative feedstock for polymeric materials. Nat. Chem. 2013, 5, 518–524. [Google Scholar] [CrossRef]
  69. Griebel, J.J.; Nguyen, N.A.; Namnabat, S.; Anderson, L.E.; Glass, R.S.; Norwood, R.A.; Mackay, M.E.; Char, K.; Pyun, J. Dynamic Covalent Polymers via Inverse Vulcanization of Elemental Sulfur for Healable Infrared Optical Materials. ACS Macro Lett. 2015, 4, 862–866. [Google Scholar] [CrossRef]
  70. Zhang, Y.; Konopka, K.M.; Glass, R.S.; Char, K.; Pyun, J. Chalcogenide hybrid inorganic/organic polymers (CHIPs) via inverse vulcanization and dynamic covalent polymerizations. Polym. Chem. 2017, 8, 5167–5173. [Google Scholar] [CrossRef]
  71. Tonkin, S.J.; Gibson, C.T.; Campbell, J.A.; Lewis, D.A.; Karton, A.; Hasell, T.; Chalker, J.M. Chemically induced repair, adhesion, and recycling of polymers made by inverse vulcanization. Chem. Sci. 2020, 11, 5537–5546. [Google Scholar] [CrossRef]
  72. Smith, J.A.; Wu, X.; Berry, N.G.; Hasell, T. High sulfur content polymers: The effect of crosslinker structure on inverse vulcanization. J. Polym. Sci. Part A Polym. Chem. 2018, 56, 1777–1781. [Google Scholar] [CrossRef]
  73. Yan, P.; Zhao, W.; Zhang, B.; Jiang, L.; Petcher, S.; Smith, J.A.; Parker, D.J.; Cooper, A.I.; Lei, J.; Hasell, T. Inverse Vulcanized Polymers with Shape Memory, Enhanced Mechanical Properties, and Vitrimer Behavior. Angew. Chem. Int. Ed. 2020, 59, 13371–13378. [Google Scholar] [CrossRef]
  74. Parker, D.J.; Chong, S.T.; Hasell, T. Sustainable inverse-vulcanised sulfur polymers. RSC Adv. 2018, 8, 27892–27899. [Google Scholar] [CrossRef] [PubMed]
  75. Yan, P.; Wang, H.; Dodd, L.J.; Hasell, T. Processable crosslinked terpolymers made from elemental sulfur with wide range of thermal and mechanical properties. Commun. Mater. 2023, 4, 89. [Google Scholar] [CrossRef]
  76. Zhang, Y.; Pavlopoulos, N.G.; Kleine, T.S.; Karayilan, M.; Glass, R.S.; Char, K.; Pyun, J. Nucleophilic Activation of Elemental Sulfur for Inverse Vulcanization and Dynamic Covalent Polymerizations. J. Polym. Sci. Part A Polym. Chem. 2019, 57, 7–12. [Google Scholar] [CrossRef]
  77. Wu, X.; Smith, J.A.; Petcher, S.; Zhang, B.; Parker, D.J.; Griffin, J.M.; Hasell, T. Catalytic inverse vulcanization. Nat. Commun. 2019, 10, 647. [Google Scholar] [CrossRef] [PubMed]
  78. Lundquist, N.A.; Tikoalu, A.D.; Worthington, M.J.H.; Shapter, R.; Tonkin, S.J.; Stojcevski, F.; Mann, M.; Gibson, C.T.; Gascooke, J.R.; Karton, A.; et al. Reactive Compression Molding Post-Inverse Vulcanization: A Method to Assemble, Recycle, and Repurpose Sulfur Polymers and Composites. Chem.—A Eur. J. 2020, 26, 10035–10044. [Google Scholar] [CrossRef] [PubMed]
  79. Zhang, B.; Gao, H.; Yan, P.; Petcher, S.; Hasell, T. Inverse vulcanization below the melting point of sulfur. Mater. Chem. Front. 2020, 4, 669–675. [Google Scholar] [CrossRef]
  80. Yan, P.; Zhao, W.; McBride, F.; Cai, D.; Dale, J.; Hanna, V.; Hasell, T. Mechanochemical synthesis of inverse vulcanized polymers. Nat. Commun. 2022, 13, 4824. [Google Scholar] [CrossRef]
  81. Jia, J.; Liu, J.; Wang, Z.-Q.; Liu, T.; Yan, P.; Gong, X.-Q.; Zhao, C.; Chen, L.; Miao, C.; Zhao, W.; et al. Photoinduced inverse vulcanization. Nat. Chem. 2022, 14, 1249–1257. [Google Scholar] [CrossRef]
  82. Alex, A.; Singha, N.K.; Choudhury, S. Exploring inverse vulcanization in lithium–sulfur batteries. Curr. Opin. Electrochem. 2023, 39, 101271. [Google Scholar] [CrossRef]
  83. Karunarathna, M.S.; Lauer, M.K.; Tennyson, A.G.; Smith, R.C. Copolymerization of an aryl halide and elemental sulfur as a route to high sulfur content materials. Polym. Chem. 2020, 11, 1621–1628. [Google Scholar] [CrossRef]
  84. Lopez, C.V.; Maladeniya, C.P.; Smith, R.C. Lithium-Sulfur Batteries: Advances and Trends. Electrochem 2020, 1, 226–259. [Google Scholar] [CrossRef]
  85. Lauer, M.K.; Tennyson, A.G.; Smith, R.C. Green Synthesis of Thermoplastic Composites from a Terpenoid-Cellulose Ester. ACS Appl. Polym. Mater. 2020, 2, 3761–3765. [Google Scholar] [CrossRef]
  86. Lauer, M.K.; Karunarathna, M.S.; Tennyson, A.G.; Smith, R.C. Recyclable, sustainable, and stronger than portland cement: A composite from unseparated biomass and fossil fuel waste. Mater. Adv. 2020, 1, 590–594. [Google Scholar] [CrossRef]
  87. Lauer, M.K.; Karunarathna, M.S.; Tennyson, A.G.; Smith, R.C. Robust, remeltable and remarkably simple to prepare biomass–sulfur composites. Mater. Adv. 2020, 1, 2271–2278. [Google Scholar] [CrossRef]
  88. Maladeniya, C.P.; Karunarathna, M.S.; Lauer, M.K.; Lopez, C.V.; Thiounn, T.; Smith, R.C. A role for terpenoid cyclization in the atom economical polymerization of terpenoids with sulfur to yield durable composites. Mater. Adv. 2020, 1, 1665–1674. [Google Scholar] [CrossRef]
  89. Smith, A.D.; Tennyson, A.G.; Smith, R.C. Sulfur-Containing Polymers Prepared from Fatty Acid-Derived Monomers: Application of Atom-Economical Thiol-ene/Thiol-yne Click Reactions and Inverse Vulcanization Strategies. Sustain. Chem. 2020, 1, 209–237. [Google Scholar] [CrossRef]
  90. Lauer, M.K.; Tennyson, A.G.; Smith, R.C. Inverse vulcanization of octenyl succinate-modified corn starch as a route to biopolymer–sulfur composites. Mater. Adv. 2021, 2, 2391–2397. [Google Scholar] [CrossRef]
  91. Lopez, C.V.; Smith, A.D.; Smith, R.C. High strength composites from low-value animal coproducts and industrial waste sulfur. RSC Adv. 2022, 12, 1535–1542. [Google Scholar] [CrossRef]
  92. Thiounn, T.; Karunarathna, M.S.; Slann, L.M.; Lauer, M.K.; Smith, R.C. Sequential crosslinking for mechanical property development in high sulfur content composites. J. Polym. Sci. 2020, 58, 2943–2950. [Google Scholar] [CrossRef]
  93. Lindholm-Lehto, P.C.; Knuutinen, J.S.; Ahkola, H.S.J.; Herve, S.H. Refractory organic pollutants and toxicity in pulp and paper mill wastewaters. Environ. Sci. Pollut. Res. 2015, 22, 6473–6499. [Google Scholar] [CrossRef] [PubMed]
  94. Lee, J.M.; Noh, G.Y.; Kim, B.G.; Yoo, Y.; Choi, W.J.; Kim, D.-G.; Yoon, H.G.; Kim, Y.S. Synthesis of Poly(phenylene polysulfide) Networks from Elemental Sulfur and p-Diiodobenzene for Stretchable, Healable, and Reprocessable Infrared Optical Applications. ACS Macro Lett. 2019, 8, 912–916. [Google Scholar] [CrossRef] [PubMed]
  95. Karunarathna, M.S.; Tennyson, A.G.; Smith, R.C. Facile new approach to high sulfur-content materials and preparation of sulfur-lignin copolymers. J. Mater. Chem. A 2020, 8, 548–553. [Google Scholar] [CrossRef]
  96. Melro, E.; Duarte, H.; Eivazi, A.; Costa, C.; Faleiro, M.L.; da Costa, A.M.R.; Antunes, F.E.; Valente, A.J.M.; Romano, A.; Norgren, M.; et al. Poly(butylene succinate)-Based Composites with Technical and Extracted Lignins from Wood Residues. ACS Appl. Polym. Mater. 2024, 6, 1169–1181. [Google Scholar] [CrossRef]
  97. Li, X.; Li, J.; Shen, X.; Cao, M.; Wang, Y.; Zhang, W.; Xu, Y.; Ling, Z.; Chen, S.; Xu, F. Transparent Cellulose/Lignin Composite Films with Adjustable Haze and UV-Blocking Performance for Light Management. ACS Sust. Chem. Eng. 2024, 12, 5427–5435. [Google Scholar] [CrossRef]
  98. Liu, S.; Li, C.; Sun, Y.; Qiu, X.; Li, X.; Sun, C.; Liu, Y.; Yu, Q.; Yu, B.; Cai, M.; et al. BTA-P4444-Lig-Functionalized MXene to Prepare Anticorrosion and Wear-Resistant Integrated Waterborne Epoxy Composite Coating. ACS Sust. Chem. Eng. 2024, 12, 8247–8260. [Google Scholar] [CrossRef]
  99. Singh, K.; Yuvrajsinh, G.M.; Mehra, S.; Mishra, A.; Kumar, A. Bioionic Liquid-Assisted Transparent Sodium Alginate-κ-Carrageenan-Lignin Composite Films with Excellent Ultraviolet Shielding, Antioxidant, and Antibacterial Properties. ACS Sustain. Chem. Eng. 2024, 12, 4314–4327. [Google Scholar] [CrossRef]
  100. Wang, L.; Wang, Y.; Zhang, J.; Wang, F.; Liu, Z.; Jiang, J. Investigation on self-healing polyurethane coating doped with lignin composites for protecting cementitious materials. Constr. Build. Mater. 2024, 411, 134368. [Google Scholar] [CrossRef]
  101. Fazeli, M.; Mukherjee, S.; Baniasadi, H.; Abidnejad, R.; Mujtaba, M.; Lipponen, J.; Seppala, J.; Rojas, O.J. Lignin beyond the status quo: Recent and emerging composite applications. Green Chem. 2024, 26, 593–630. [Google Scholar] [CrossRef]
  102. Yang, W.; Wang, D.; Feng, S.; He, S.; Xiao, H.; Dai, H.; Han, J. Heteroatom-doped hierarchically porous thick bulk carbon derived from a Pleurotus eryngii/lignin composite: A free-standing and high mass loading electrode for high-energy-density storage. Green Chem. 2024, 26, 4633–4644. [Google Scholar] [CrossRef]
  103. Chen, Y.; Ma, Q.; Wang, K.; Cho, M.; Jiang, L. Thermoplastic starch nanocomposites derived directly from cornmeal. J. Compos. Mater. 2024, 58, 1077–1088. [Google Scholar] [CrossRef]
  104. Campos, G.N.; da Rocha, E.B.D.; Furtado, C.R.G.; de Figueiredo, M.A.G.; de Sousa, A.M.F. Using carboxyl groups to improve the compatibility of XNBR/lignin composites. Polym. Compos. 2024, 45, 4124–4137. [Google Scholar] [CrossRef]
  105. Montazeri, M.; Norouzbeigi, R. Investigation of synergistic effects incorporating esterified lignin and guar gum composite aerogel for sustained oil spill cleanup. Sci. Rep. 2024, 14, 13892. [Google Scholar] [CrossRef]
  106. Thiounn, T.; Karunarathna, M.S.; Lauer, M.K.; Tennyson, A.G.; Smith, R.C. Detoxification of bisphenol A via sulfur-mediated carbon–carbon σ-bond scission. RSC Sustain. 2023, 1, 535–542. [Google Scholar] [CrossRef]
  107. Kapuge Dona, N.L.; Maladeniya, C.P.; Smith, R.C. Reactivity of Biomass-Derived Olefins with Elemental Sulfur: Mechanistic Insight. Eur. J. Org. Chem. 2024, 27, e202301269. [Google Scholar] [CrossRef]
  108. Tisdale, K.A.; Dona, N.L.K.; Maladeniya, C.P.; Smith, R.C. Green and Atom Economical Route to High Compressive Strength Lignin Oil-Sulfur Composites. J. Polym. Environ. 2024, 1–13. [Google Scholar] [CrossRef]
  109. Dale, J.J.; Petcher, S.; Hasell, T. Dark Sulfur: Quantifying Unpolymerized Sulfur in Inverse Vulcanized Polymers. ACS Appl. Polym. Mater. 2022, 4, 3169–3173. [Google Scholar] [CrossRef]
  110. Dale, J.J.; Stanley, J.; Dop, R.A.; Chronowska-Bojczuk, G.; Fielding, A.J.; Neill, D.R.; Hasell, T. Exploring Inverse Vulcanisation Mechanisms from the Perspective of Dark Sulfur. Eur. Polym. J. 2023, 195, 112198. [Google Scholar] [CrossRef]
  111. Shankarayya Wadi, V.K.; Jena, K.K.; Khawaja, S.Z.; Yannakopoulou, K.; Fardis, M.; Mitrikas, G.; Karagianni, M.; Papavassiliou, G.; Alhassan, S.M. NMR and EPR Structural Analysis and Stability Study of Inverse Vulcanized Sulfur Copolymers. ACS Omega 2018, 3, 3330–3339. [Google Scholar] [CrossRef]
  112. Rao, C.N.R.; Venkataraghavan, R.; Kasturi, T.R. Contribution to the Infrared Spectra of Organosulphur Compounds. Can. J. Chem. 1964, 42, 36–42. [Google Scholar] [CrossRef]
  113. Bastian, E.J., Jr.; Martin, R.B. Disulfide vibrational spectra in the sulfur-sulfur and carbon-sulfur stretching region. J. Phys. Chem. 1973, 77, 1129–1133. [Google Scholar] [CrossRef]
  114. Stark, N.M.; Yelle, D.J.; Agarwal, U.P. Techniques for characterizing lignin. Lignin Polym. Compos. 2016, 2016, 49–66. [Google Scholar]
  115. Collier, W.E.; Schultz, T.P.; Kalasinsky, V.F. Infrared Study of Lignin: Reexamination of Aryl-Alkyl Ether C—O Stretching Peak Assignments. Holzforschung 1992, 46, 523–528. [Google Scholar] [CrossRef]
  116. Brebu, M.; Vasile, C. Thermal degradation of lignin—A review. Cellul. Chem. Technol. 2010, 44, 353–363. [Google Scholar]
  117. Griebel, J.J.; Glass, R.S.; Char, K.; Pyun, J. Polymerizations with elemental sulfur: A novel route to high sulfur content polymers for sustainability, energy and defense. Prog. Polym. Sci. 2016, 58, 90–125. [Google Scholar] [CrossRef]
  118. Tobolsky, A.V.; MacKnight, W.; Beevers, R.B.; Gupta, V.D. The glass transition temperature of polymeric sulphur. Polymer 1963, 4, 423–427. [Google Scholar] [CrossRef]
  119. Bandzierz, K.; Reuvekamp, L.; Dryzek, J.; Dierkes, W.; Blume, A.; Bielinski, D. Influence of Network Structure on Glass Transition Temperature of Elastomers. Materials 2016, 9, 607. [Google Scholar] [CrossRef]
  120. Smith, J.A.; Green, S.J.; Petcher, S.; Parker, D.J.; Zhang, B.; Worthington, M.J.H.; Wu, X.; Kelly, C.A.; Baker, T.; Gibson, C.T.; et al. Crosslinker Copolymerization for Property Control in Inverse Vulcanization. Chem.—A Eur. J. 2019, 25, 10433–10440. [Google Scholar] [CrossRef]
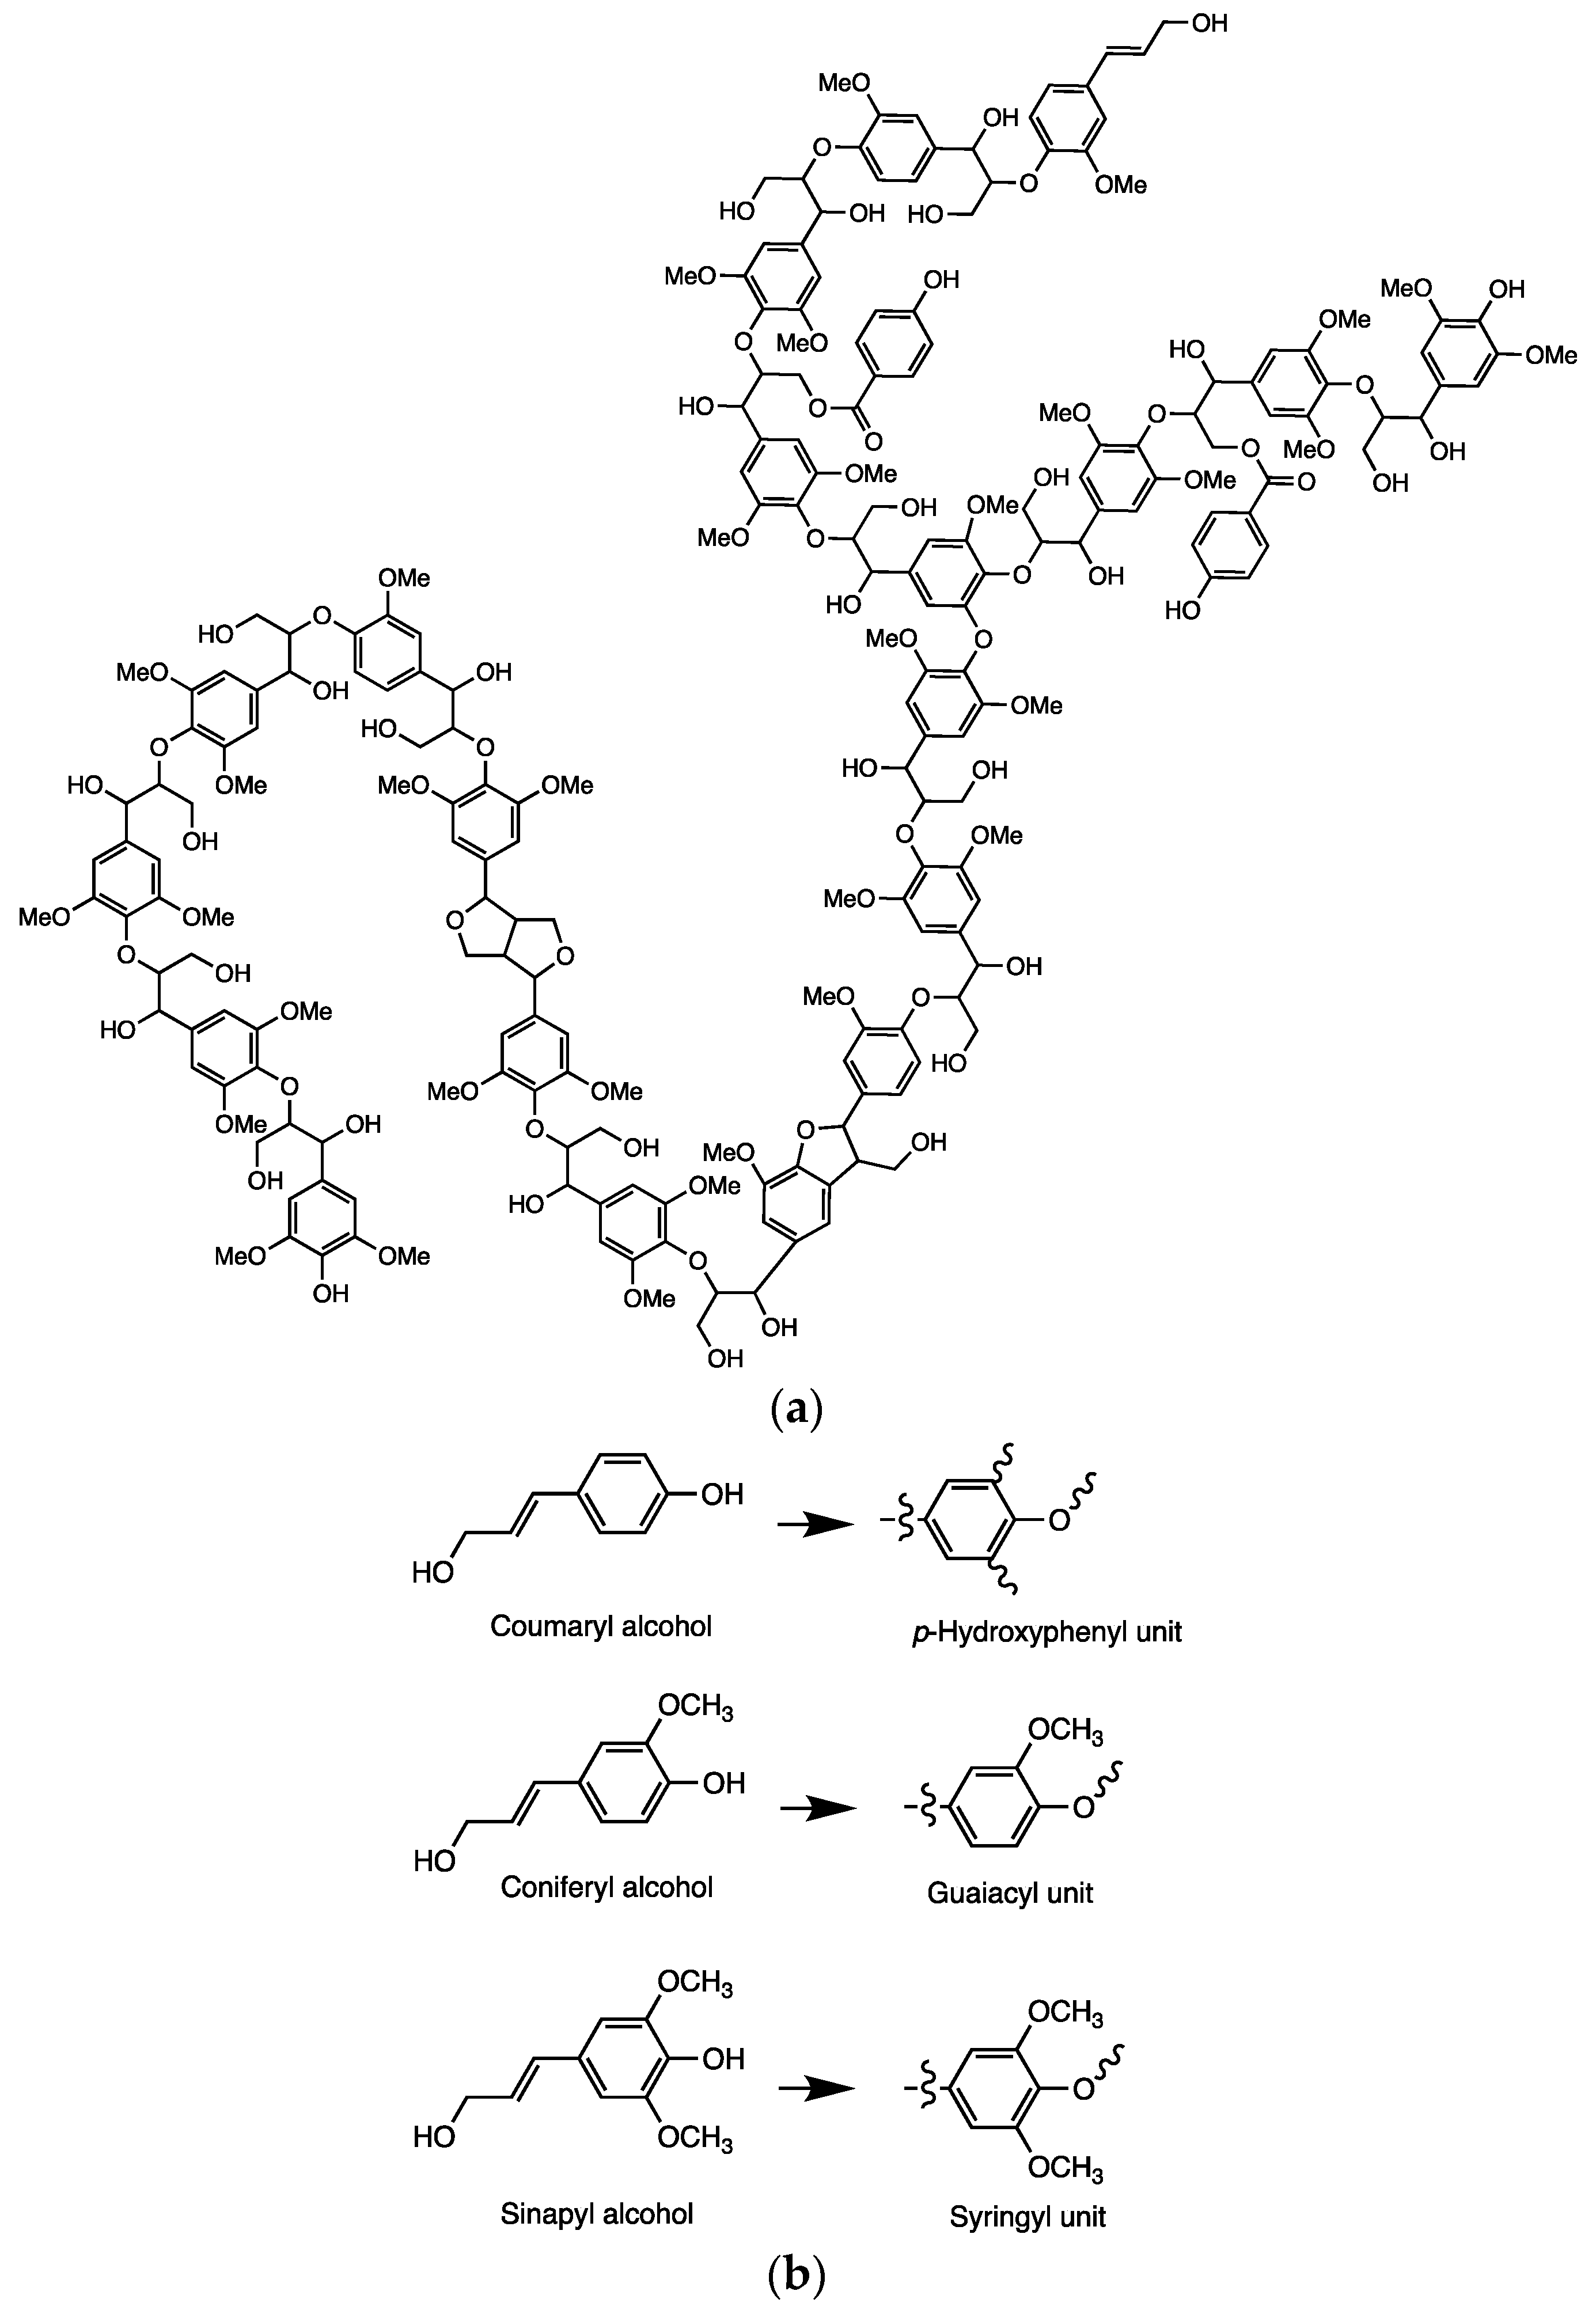
Figure 1. Structure displaying a lignin polymer (a) and lignin biosynthetic precursors (b).
Molecules 29 04209 g001
Scheme 1. (a) S–C bond-forming reactions for lignin-derived small molecules bearing some combination of −CH3, −OH, and −OCH3 substituents [107] and (b) the major S–C bond forming reaction of composite GS80 from sulfur and guaiacol. Polymeric sulfur is represented by –Sx– with subscript letters w, x, y, and z signifying some amount of sulfur in the polymer chain.
Molecules 29 04209 sch001
Figure 2. Representative photos of compressional cylinders of (from left to right) LOS80@230, LOS85@230, LOS90@230, LOS90@250, and LOS90@300.
Molecules 29 04209 g002
Figure 3. Representative photos of rectangular prisms for flexural strength tests of LOS90@230 (left) and LOS85@230 (right).
Molecules 29 04209 g003
Figure 4. Powder XRD data for LOS90@230.
Molecules 29 04209 g004
Figure 5. Powder XRD data for LOS85@230.
Molecules 29 04209 g005
Figure 6. Powder XRD trace for LOS80@230.
Molecules 29 04209 g006
Figure 7. Portion of the FT-IR spectrum revealing the S–C stretch for LOS80@230 (grey trace), LOS85@230 (orange trace), LOS90@230 (blue trace), LOS90@250 (yellow trace), and LOS90@300 (green trace). The entire set of IR spectra are presented in the Supplementary Materials file.
Molecules 29 04209 g007
Figure 8. Elemental mapping of the elements carbon (green, left), oxygen (blue, middle), and sulfur (red, right) in (a) LOS80@230, (b) LOS85@230, (c) LOS90@230, (d) LOS90@250, and (e) LOS90@300 by energy-dispersive X-ray analysis (EDX).
Molecules 29 04209 g008aMolecules 29 04209 g008b
Figure 9. Thermogravimetric analysis (TGA) traces for LOS80@230 (grey dashed line), LOS85@230 (orange dotted line), LOS90@230(blue solid line), LOS90@250 (yellow solid line), LOS90@300 (green solid line), and lignin oil (LO) (pink solid line).
Molecules 29 04209 g009
Figure 10. Inset of differential scanning calorimetry (DSC) thermograms emphasizing the glass transition temperature (Tg) of LOS90@230 (blue solid line), LOS85@230 (orange dotted line), LOS80@230 (grey dashed line), LOS90@250 (yellow solid line), and LOS90@300 (green solid line). Full DSC thermographs from −60 to 140 C° are provided in the Supplementary Information file.
Molecules 29 04209 g010
Figure 11. A graphical representation of the general trend of the effect increasing the percentage of organic material has on the percentage crystallinity of LSx (blue triangles) and LOSx@T (orange circles).
Molecules 29 04209 g011
Figure 12. Graphical representation comparing the flexural strength (blue bars) and compressive strength (orange bars) of LOSx@T composites with lignin–sulfur composites (LSx), lignin/cellulose-containing sulfur composites (ELSx@T, CLS80, mAPS95), and ordinary Portland cement (OPC). Bars not displayed signify that the attendant value was not previously reported for the listed material or could not be obtained for the current research.
Molecules 29 04209 g012
Figure 13. A graphical representation of the general trend of the effect increasing reaction temperature has on the compressive strength of ELSx@T (green squares) and LOSx@T (orange circles).
Molecules 29 04209 g013
Table 1. Soluble (dark sulfur) and insoluble (crosslinked material) wt. % fractions of lignin–sulfur composites.
MaterialsDark Sulfur [a]
(wt. %)
Crosslinked Material [a]
(wt. %)
LOS80@2302282
LOS85@2303177
LOS90@2302182
LOS90@2502478
LOS90@3002281
[a] Sum of soluble and insoluble fractions is greater than 100% due to rounding and errors associated with the measurements.
Table 2. Thermal and morphological properties of lignin oil–sulfur composites, elemental sulfur, and other composites.
Materials T d [ a ] /°C T m [ b ] /°C T g , D S C [ c ] /°CHm
J/g
Hcc
J/g
Percentage Crystallinity [d]
LOS90@230 [e]229114−3626ND [j]57
LOS85@230 [e]230106−35352619
LOS80@230 [e]230105−3532321
LOS90@250 [e]231117−36301630
LOS90@300 [e]230119ND [j]ND [j]ND [j]ND [j]
LS80 [f]236118−3430258
LS85 [f]235118−35341340
LS90 [f]237117ND [j]34ND [j]67
LS95 [f]235107ND [j]37ND [j]63
LS99 [f]233113ND [j]47ND [j]91
GS80 [g]264ND [j]−30ND [j]ND [j]ND [j]
ELS90@180 [h]230117−37ND [j]ND [j]ND [j]
ELS90@230 [h]234117−37ND [j]ND [j]ND [j]
ELS80@180 [h]231117−37ND [j]ND [j]ND [j]
S8 [i]228/229119ND [j]45ND [j]100
[a] The temperature at which a mass loss of 5% is observed. [b] The peak temperature at the peak maximum of the endothermic melting. [c] Glass transition temperature. [d] Percentage crystallinity reduction for each composite sample calculated with respect to sulfur (normalized to 100%). [e] Lignin oil and elemental sulfur (where x = wt. % sulfur, varying from 80 and 90, and T represents the reaction temperature in °C). [f] LSx composites comprising 10 wt. % allyl-derivatized lignin and elemental sulfur, where x = wt. % sulfur in monomer feed, ranging from 80 to 99. [g] Composites consisting of guaiacol (20 wt. %) and elemental sulfur (80 wt. %). [h] ELSx@T composites comprising esterified lignin and elemental sulfur (where x = wt. % sulfur in the reaction mixture, varying from 80 to 90, and T represents the reaction temperature in °C). [i] Elemental sulfur. [j] Not determined.
Table 3. Mechanical properties of the lignin–sulfur composites LOSx@T with other previously reported lignin-containing HSMs composites for comparison.
MaterialsCompressive Strength (MPa)Flexural Strength/Modulus (MPa)Compressive Strength (% of OPC)
LOS90@230 [a]22.1 ± 2.55.7/186130
LOS85@230 [a]26.0 ± 0.36.5/236153
LOS80@230 [a]22.6 ± 1.7ND [k]133
LOS90@250 [a]22.1 ± 1.3ND [k]130
LOS90@300 [a]35.9 ± 1.5ND [k]211
LS80 [b] ND [k]2.1/87ND [k]
LS85 [b] ND [k]1.5/76ND
LS90 [b]ND [k]1.7/57ND
LS95 [b] ND [k]ND [k]ND
LS99 [b] ND [k]ND [k]ND
GS80 [c] ND [k]ND [k]ND
ELS90@180 [d] 20.1 ± 2.33.3/ND [k]118
ELS90@230 [d]26.8 ± 0.53.9/ND [k]158
ELS80@180 [d]10.9 ± 0.852.7/ND [k]64
CLS80 [e] ND [k]3.6/ND [k]ND [k]
mAPS95 [f] 17.05.6/ND [k]100
OPC [g]17.03.7/580100
S-DCPD (1:1) [h]ND6.0/3700ND
S-DCPD–linseed oil (2:1:1) [i]ND4.7/1250ND
S-DCPD–limonene (2:1:1) [j]ND1.9/1750ND
[a] LOSx@T composites made from lignin oil and elemental sulfur (where x = wt. % sulfur, varying from 80 to 90, and T represents the reaction temperature in °C). [b] LSx composites comprising 10 wt. % allyl-derivatized lignin and elemental sulfur, where x = wt. % sulfur in monomer feed, varying from 80 to 99. [c] Composites comprising guaiacol (20 wt. %) and elemental sulfur (80 wt. %). [d] ELSx@T composites comprising esterified lignin and elemental sulfur (where x = wt. % sulfur in the reaction mixture, varying from 80 to 90 and T represents the reaction temperature in °C). [e] Composites comprising chlorolignin (20 wt. %) and elemental sulfur (80 wt. %). [f] Composites comprising allyl lignin (2 wt. %), allyl cellulose (3 wt. %) and elemental sulfur (95 wt. %). [g] Ordinary Portland cement. [h] Composites comprising elemental sulfur (50 wt. %) and dicyclopentadiene (DCPD) (50 wt. %). [i] Composites comprising elemental sulfur (50 wt. %), DCPD (25 wt. %), and linseed oil (25 wt. %). [j] Composites comprising elemental sulfur (50 wt. %), DCPD (25 wt. %), and limonene (25 wt. %). [k] Not determined.
Disclaimer/Publisher’s Note: The statements, opinions and data contained in all publications are solely those of the individual author(s) and contributor(s) and not of MDPI and/or the editor(s). MDPI and/or the editor(s) disclaim responsibility for any injury to people or property resulting from any ideas, methods, instructions or products referred to in the content.