2.3. OH Groups on ZnO
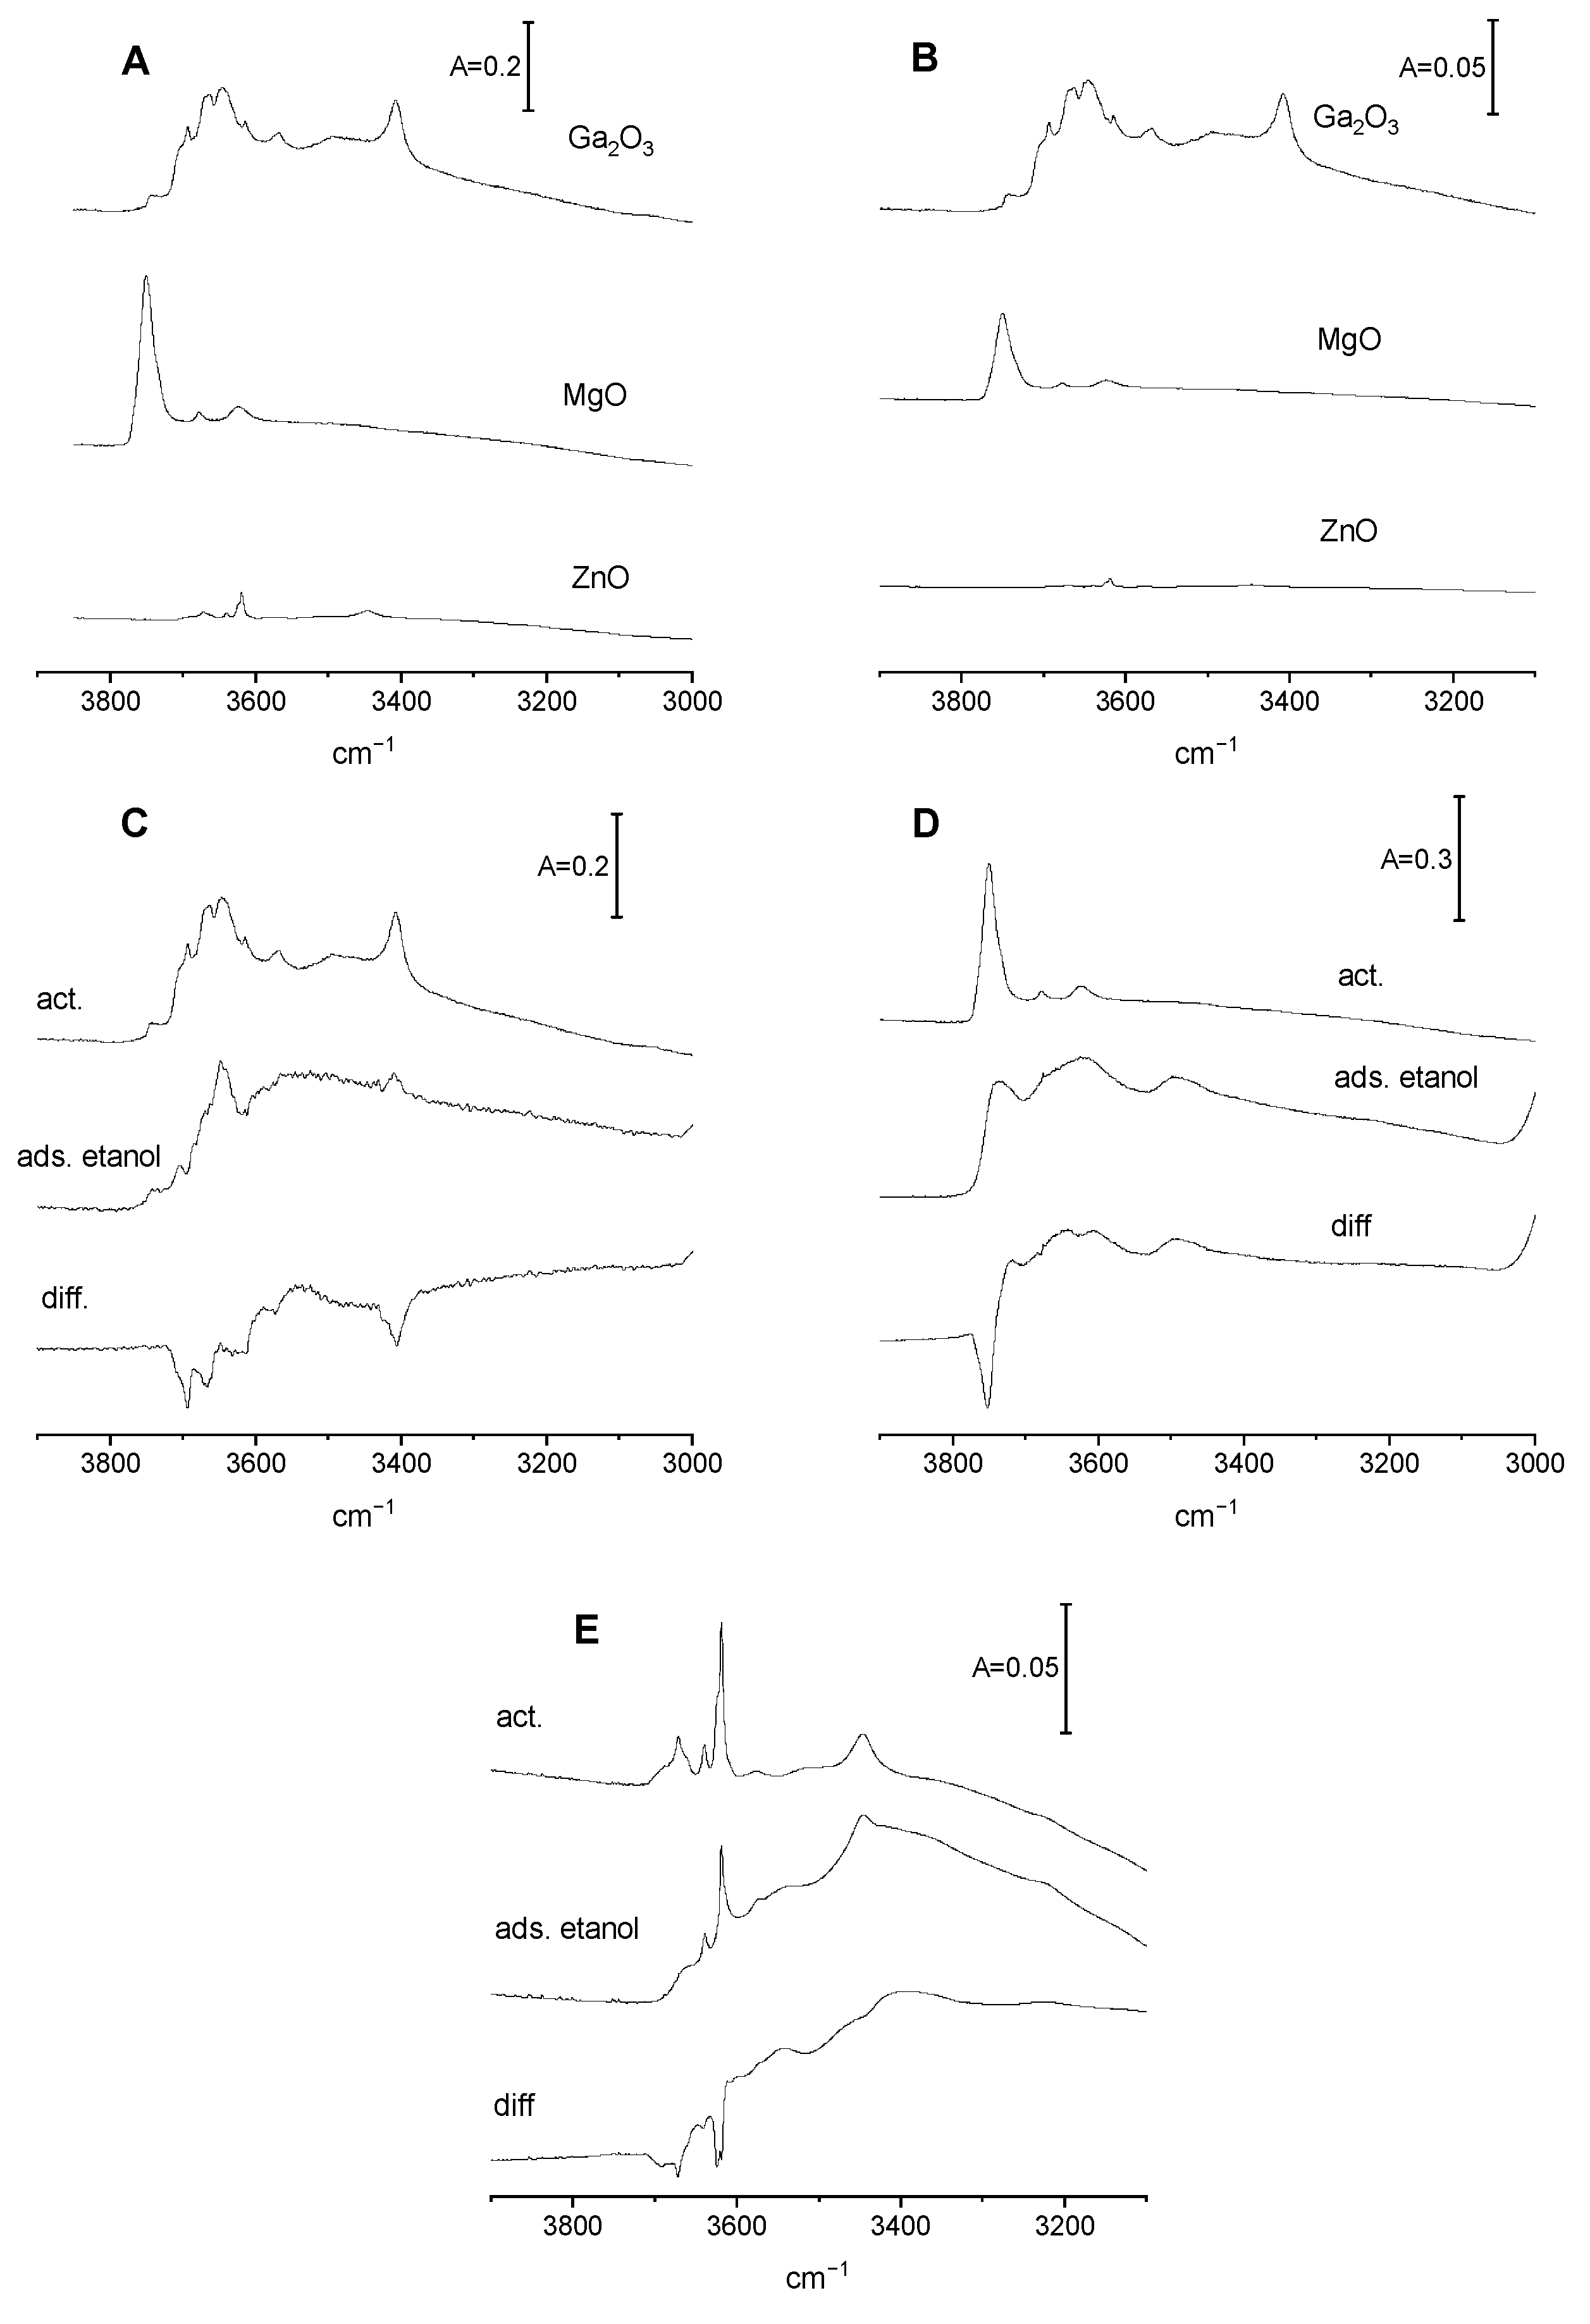
The spectra of OH groups on the ZnO surface are presented in
Figure 1A,B. The intensity of OH bands is very low compared with those of Ga
2O
3 and MgO. This is best seen by comparing OH intensities normalized to the same surface area (
Figure 1B). The interpretation of the spectra of OH groups was based on earlier results from Noei et al. [
28], who studied the single-crystal surfaces of ZnO nanoparticles. A weak band at 3620 cm
−1 was attributed to OH groups on the ZnO (0001) surface formed by the dissociation of water on oxygen vacancy sites. Another very weak band at 3640 cm
−1 was attributed to OH on a mixed-terminated ZnO (1010) surface.
Reaction of ethanol with OH groups on Ga2O3, MgO, and ZnO
The reaction with ethanol consumed some Ga-OH groups and produced ethoxy groups. The data presented in
Figure 1C evidence that only the hydroxyls with the highest stretching frequencies i.e., these that have a net negative charge or are neutral, react with ethanol. The reaction of methanol with surface sites on oxides was studied by Bianchi et al. [
29]. These authors considered various mechanisms by which these reactions might produce methoxy groups. One of these mechanisms involved the condensation of alcohol with surface hydroxyls, forming alkoxy groups and water according to the following scheme:
According to this mechanism, the formation of ethoxy groups was accompanied by the production of water. In order to check whether water is indeed produced by the reaction of ethanol with surface hydroxyl groups, we adsorbed the dose of ethanol (0.5 µmol/100 mg of Ga
2O
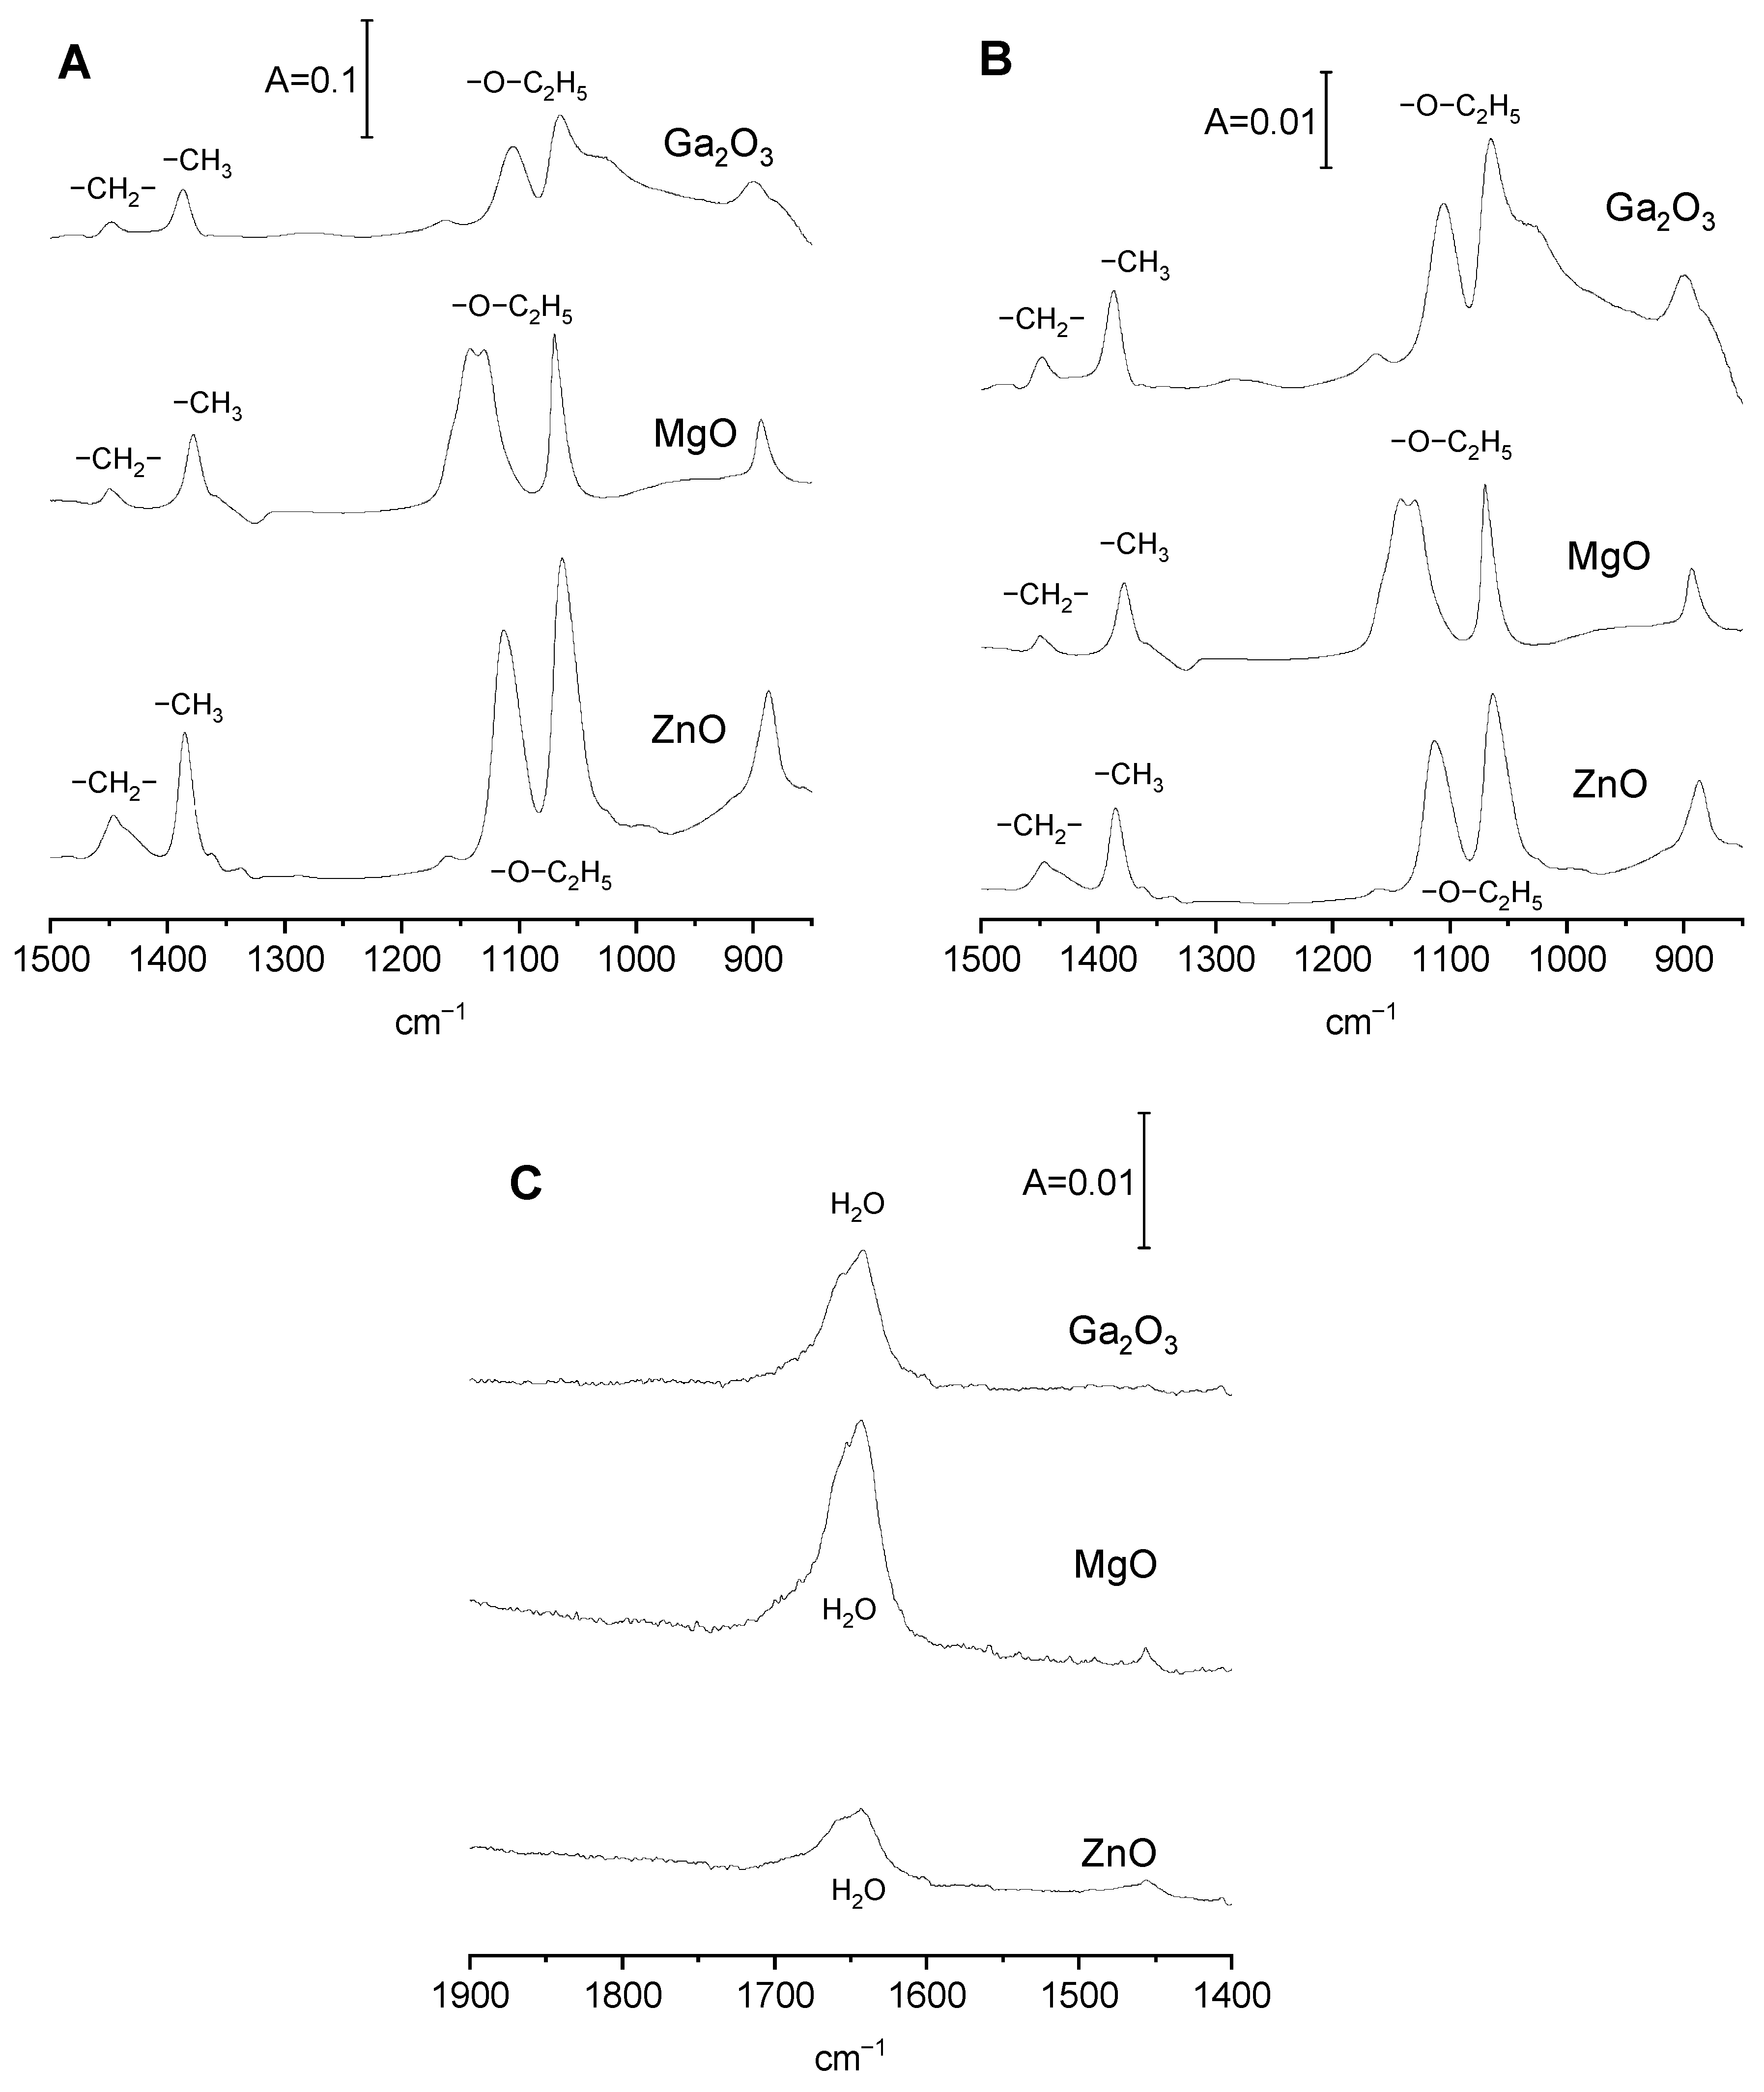
3) on the wafer of gallia at room temperature. Subsequently, the gallia wafer with ethanol was heated to 370 K and the product of the reaction was desorbed into a cold trap. The molecules stored in the cold trap were next adsorbed at room temperature on a wafer of zeolite NaY (activated at vacuum at 670 K). The spectrum of molecules that were the product of the reaction of ethanol on gallia adsorbed on zeolite NaY is presented in
Figure 2C (top spectrum). This spectrum shows a band at 1640 cm
−1, which represents the deformation vibrations of a water molecule, evidencing that water is indeed formed in the reaction of ethanol with surface hydroxyls on gallia according to the mechanism presented above.
The spectrum of ethoxy groups formed in gallia is presented in
Figure 2B (top spectrum). The spectrum shows the bands at 1385 cm
−1 that represent CH
3 deformation, as well as three bands typical of ethoxy groups: bands at 895 and 1063 cm
−1 representing symmetric and asymmetric C-C-O entity and a 1100 cm
−1 band that is interpreted [
30] as a combination of two vibrations: deformation (δ) of Ga-O-C and rocking (r) of CH
3 group. The band at 1063 cm
−1 is complex—it comprises two submaxima. The profound analysis of two other bands of ethoxy groups on gallia described in our previous study [
19] showed that both 895 and 1100 cm
−1 bands composed of two submaxima too. Therefore, all the three bands of ethoxy groups on gallia comprise two components, showing that two kinds of ethoxy groups were formed. They may be monodentate and bidentate ethoxyls interacting with one and two gallium atoms, respectively. It is possible that monodentate and bidentate ethoxyls are formed by the interaction of ethanol with OH groups interacting with one and two Ga, respectively.
Reaction of ethanol with MgO consumes primarily all the Mg-OH groups (
Figure 1D) and produces ethoxyls. The experiment in which the product of the reaction of ethanol on MgO was trapped in cold trap and subsequently adsorbed on zeolite NaY (according to the procedure described above) showed, that water was also the product of this reaction according to scheme (1). The spectrum of water being the product of reaction adsorbed on zeolite NaY is presented in
Figure 2A.
The spectrum of ethoxy groups formed in MgO is presented in
Figure 2B. The spectrum shows the bands at 1379 and 1450 cm
−1 of CH
3 and CH
2 deformation, as well as three bands typical of ethoxy groups: bands at 894 and 1070 cm
−1 typical of symmetric and asymmetric vibrations of a C-C-O entity and the doublet at 1129 and 1162 cm
−1, which is interpreted [
30] as combination of two vibrations: deformation (δ) of Ga-O-C and rocking (r) of a CH
3 group.
The results concerning the reaction of ethanol with surface sites on ZnO will now be discussed. The result for ZnO was found to be different from that observed for both Ga
2O
3 and MgO, because ZnO, unlike Ga
2O
3 and MgO, contains a very low concentration of surface hydroxyls. This is seen in
Figure 1B. Therefore, it was expected that ethoxy groups would be not formed by the reaction of ethanol on ZnO. However, a significant amount of ethoxyls was formed on ZnO. This is best seen in
Figure 2B, in which the spectra of ethoxy groups are normalized to the surface area of oxides. The intensities of the bands of ethoxy groups on ZnO are comparable to those found for Ga
2O
3 and MgO, even though ZnO does not contain a significant number of surface hydroxyl groups (it was assumed that the extinction coefficients of the bands are comparable). This evidences that the mechanism of the formation of ethoxyl groups is different as a result of the mechanism (1) according to which the surface hydroxyls are engaged. As mentioned, Bianchi et al. [
29] considered several mechanisms for the reaction of alcohols with oxides. One of these mechanisms assumes the reaction of alcohol with Me-O-Me entities, as follows:
This mechanism postulates the formation of new hydroxyl groups. It should be mentioned that according to our earlier results [
31], the reaction of ethanol with ceria produced such new hydroxyls. In the present study (
Figure 1E), no new hydroxyls were formed upon the reaction of ethanol on ZnO; therefore, the scheme (2) does not describe this reaction. Moreover, water was formed in this reaction, as shown by the presence of a 1640 cm
−1 band in the spectrum of reaction products trapped in the cold trap and readsorbed on zeolite NaY (
Figure 2C).
Bianchi et al. [
29] proposed also another mechanism of reaction of alcohols with surface sites on oxides:
According to this mechanism, the reaction of alcohols neither consumes nor creates new surface hydroxyls. Ethoxy groups and water are formed. However, the amount of water formed (one water molecule per two alkoxy group) is only a half of the amount of water that would be formed if reaction occurred according to mechanism (1) (one water molecule per one ethoxy group). According to the data presented in
Figure 2C, the intensity of the band of water produced on ZnO is ca 35–65% of the intensity of the water band produced on Ga
2O
3 and MgO (the amount of adsorbed ethanol was the same in all these three cases). This fact, together with the fact that no new hydroxyls are formed by the reaction of ethanol on ZnO, suggests that this reaction occurs according to mechanism (3). It should be remembered that the reaction of ethanol with surface sites on Ga
2O
3 and MgO occurs according to mechanism (1).
In summary, it can be said that the reaction of ethanol with surface sites on Ga2O3 and MgO consumes basic hydroxyl groups, replacing then with ethoxyls. On the other hand, the reaction of ethanol with ZnO (not containing surface hydroxyls) replaces some surface oxygens with ethoxy groups. In this study, we will examine how these modifications influence the basic properties of oxides.
Interaction of ammonia with Ga2O3, MgO, and ZnO
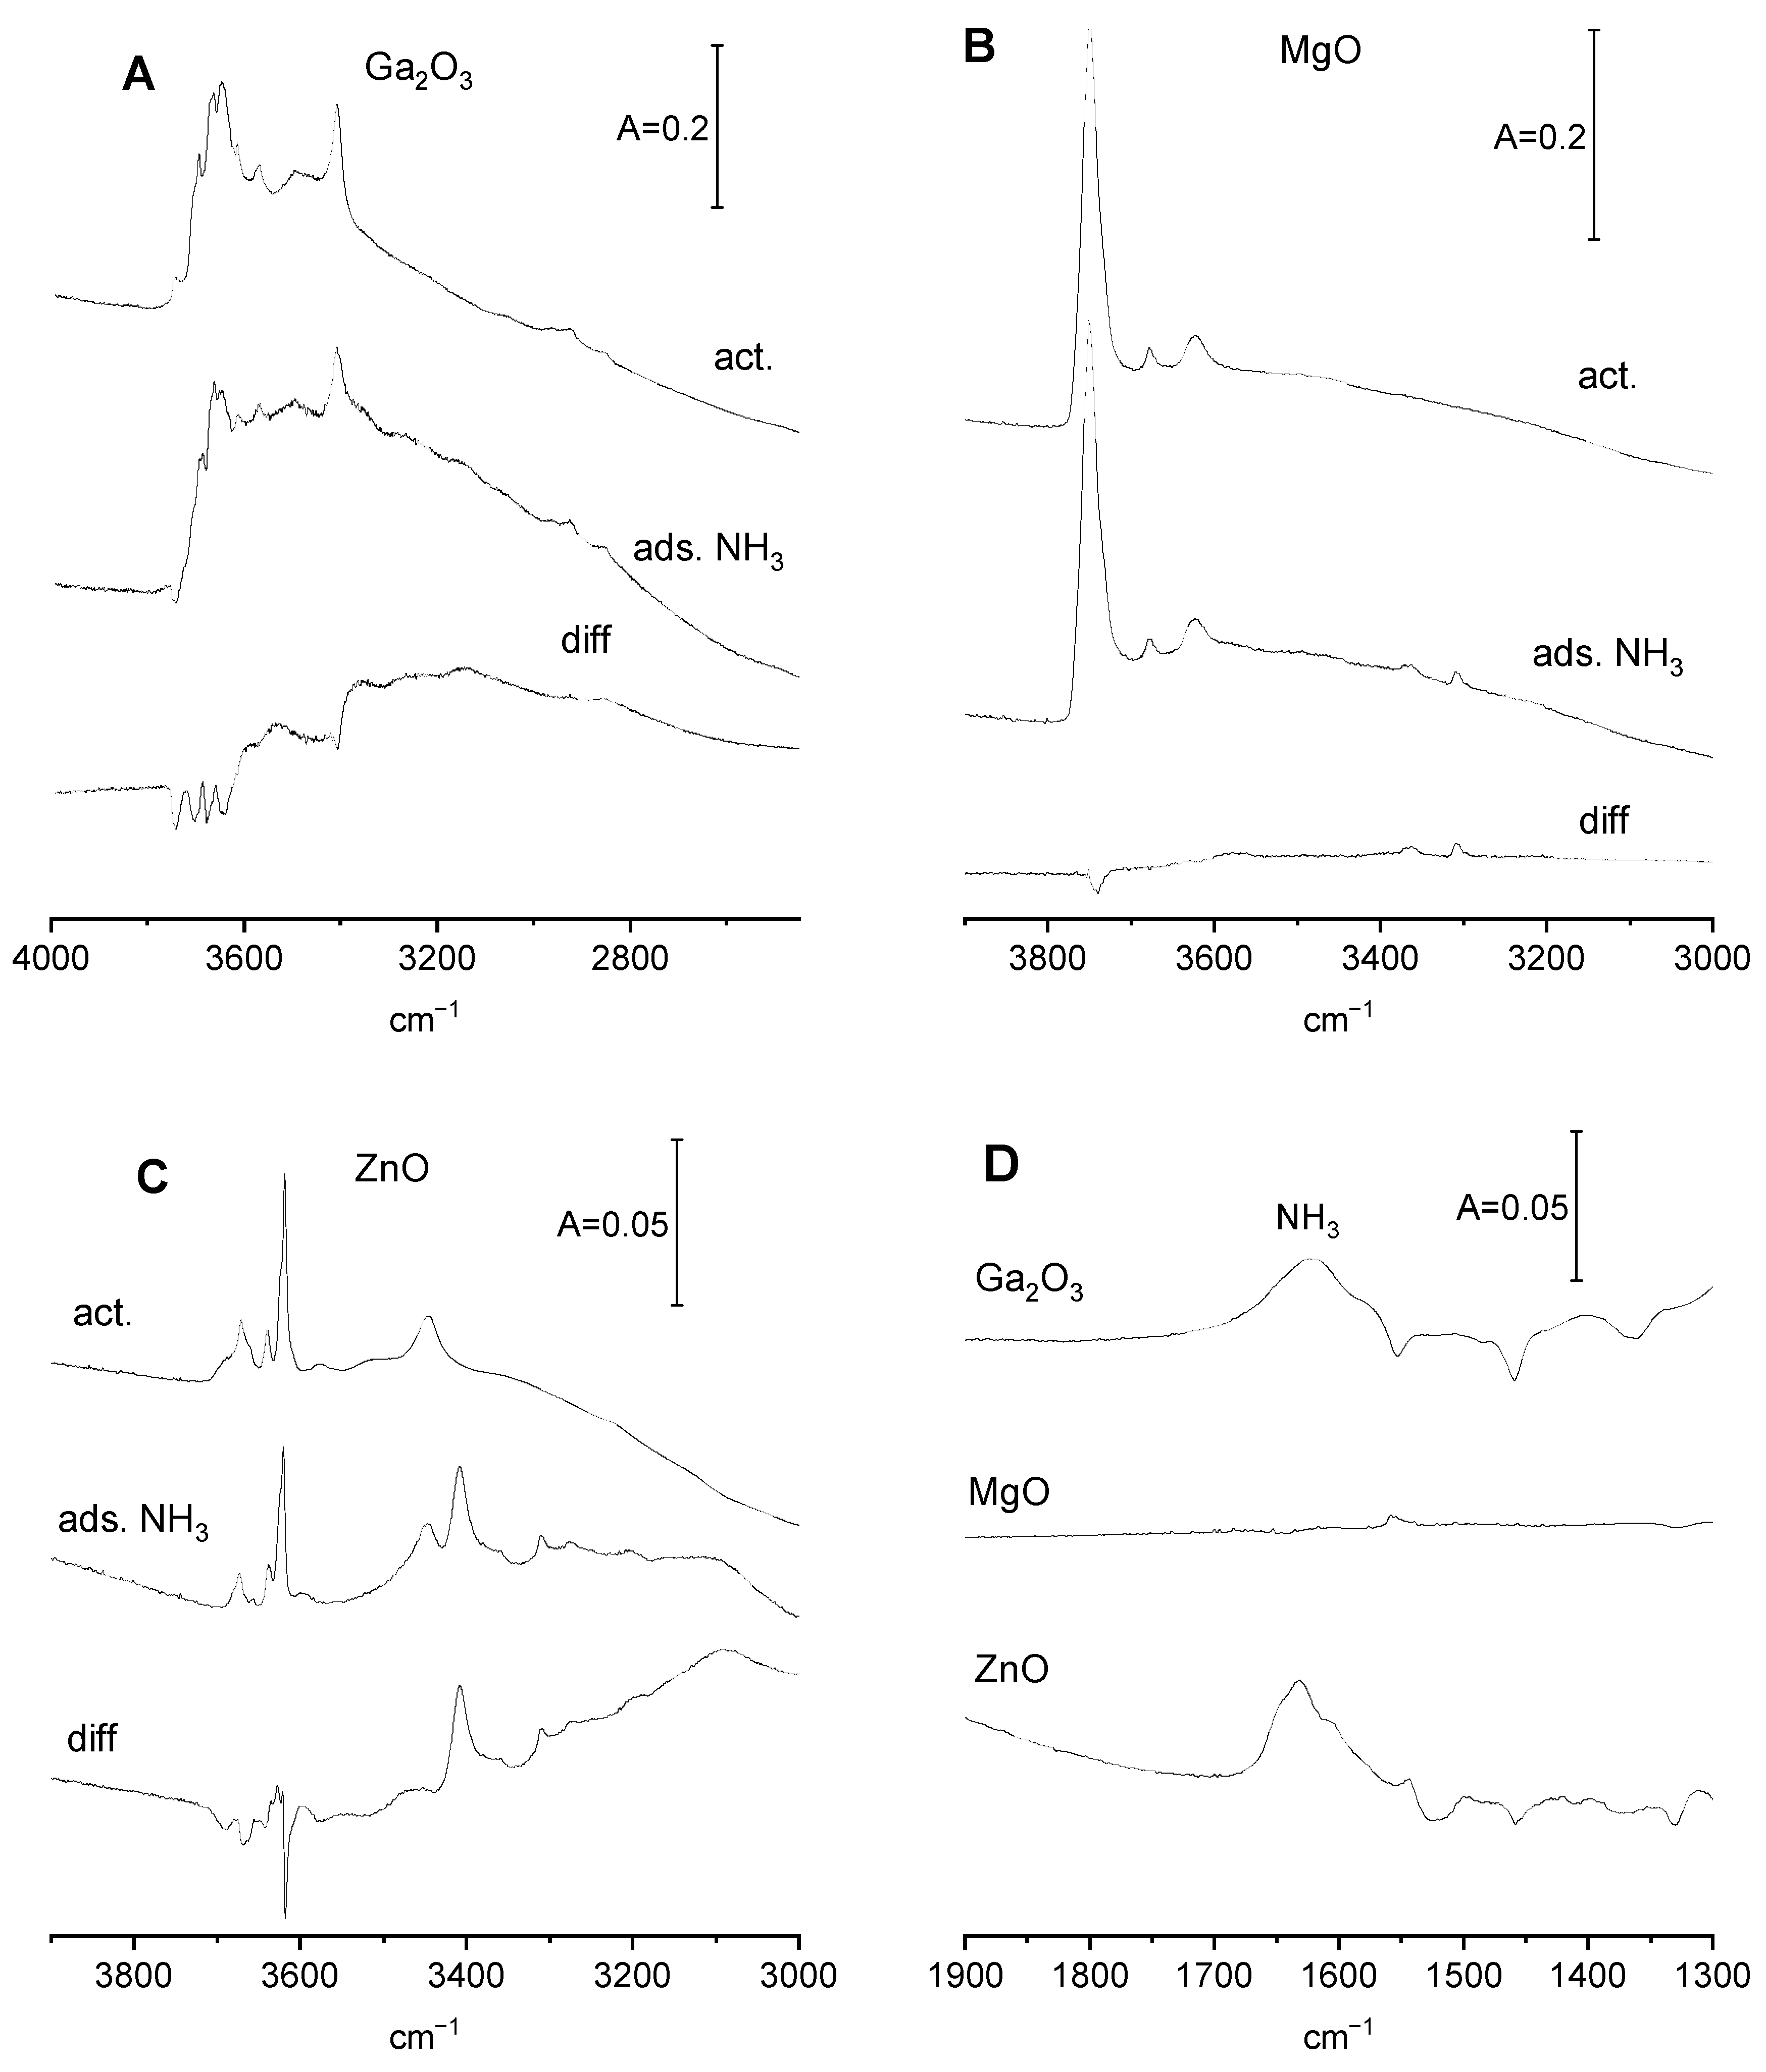
The spectra of OH groups on Ga
2O
3, MgO, and ZnO that interact with ammonia are presented in
Figure 3A–C, and the spectra of ammonia that interact with the oxides are presented in
Figure 3D. The adsorption of ammonia causes a decrease in the intensity of the OH bands of all the oxides, but ammonium ions are not produced (the band typical of ammonium ions at ca. 1450 cm
−1 is absent—
Figure 3D). It is possible that the decrease in bands of free OH may be due to the formation of hydrogen bonds.
The spectra of ammonia adsorbed on Ga
2O
3 and ZnO (
Figure 3D) show the band of ammonia interacting with electroacceptor sites (1620 cm
−1 for Ga
2O
3 and 1630 cm
−1 for ZnO). This band is absent for MgO. It may be supposed that these electroacceptor sites on Ga
2O
3 are surface tricoordinated gallium atoms, which (as for Al
2O
3) play the role of Lewis acid sites. For ZnO electroacceptor sites, the bonding ammonia may interact with Zn
2+, which is an element known for forming numerous coordination compounds (engaging empty p and d orbitals) with a coordination number of four. An ammonia molecule is one of the most important ligands in zinc complexes, acting as electron donor to Zn
2+.
The effect of adsorption of ammonia on the basic properties of Ga2O3, MgO, and ZnO will be studied via the adsorption of CO2.
CO2 adsorption on Ga2O3, MgO, and ZnO without preadsorbed ethanol and ammonia
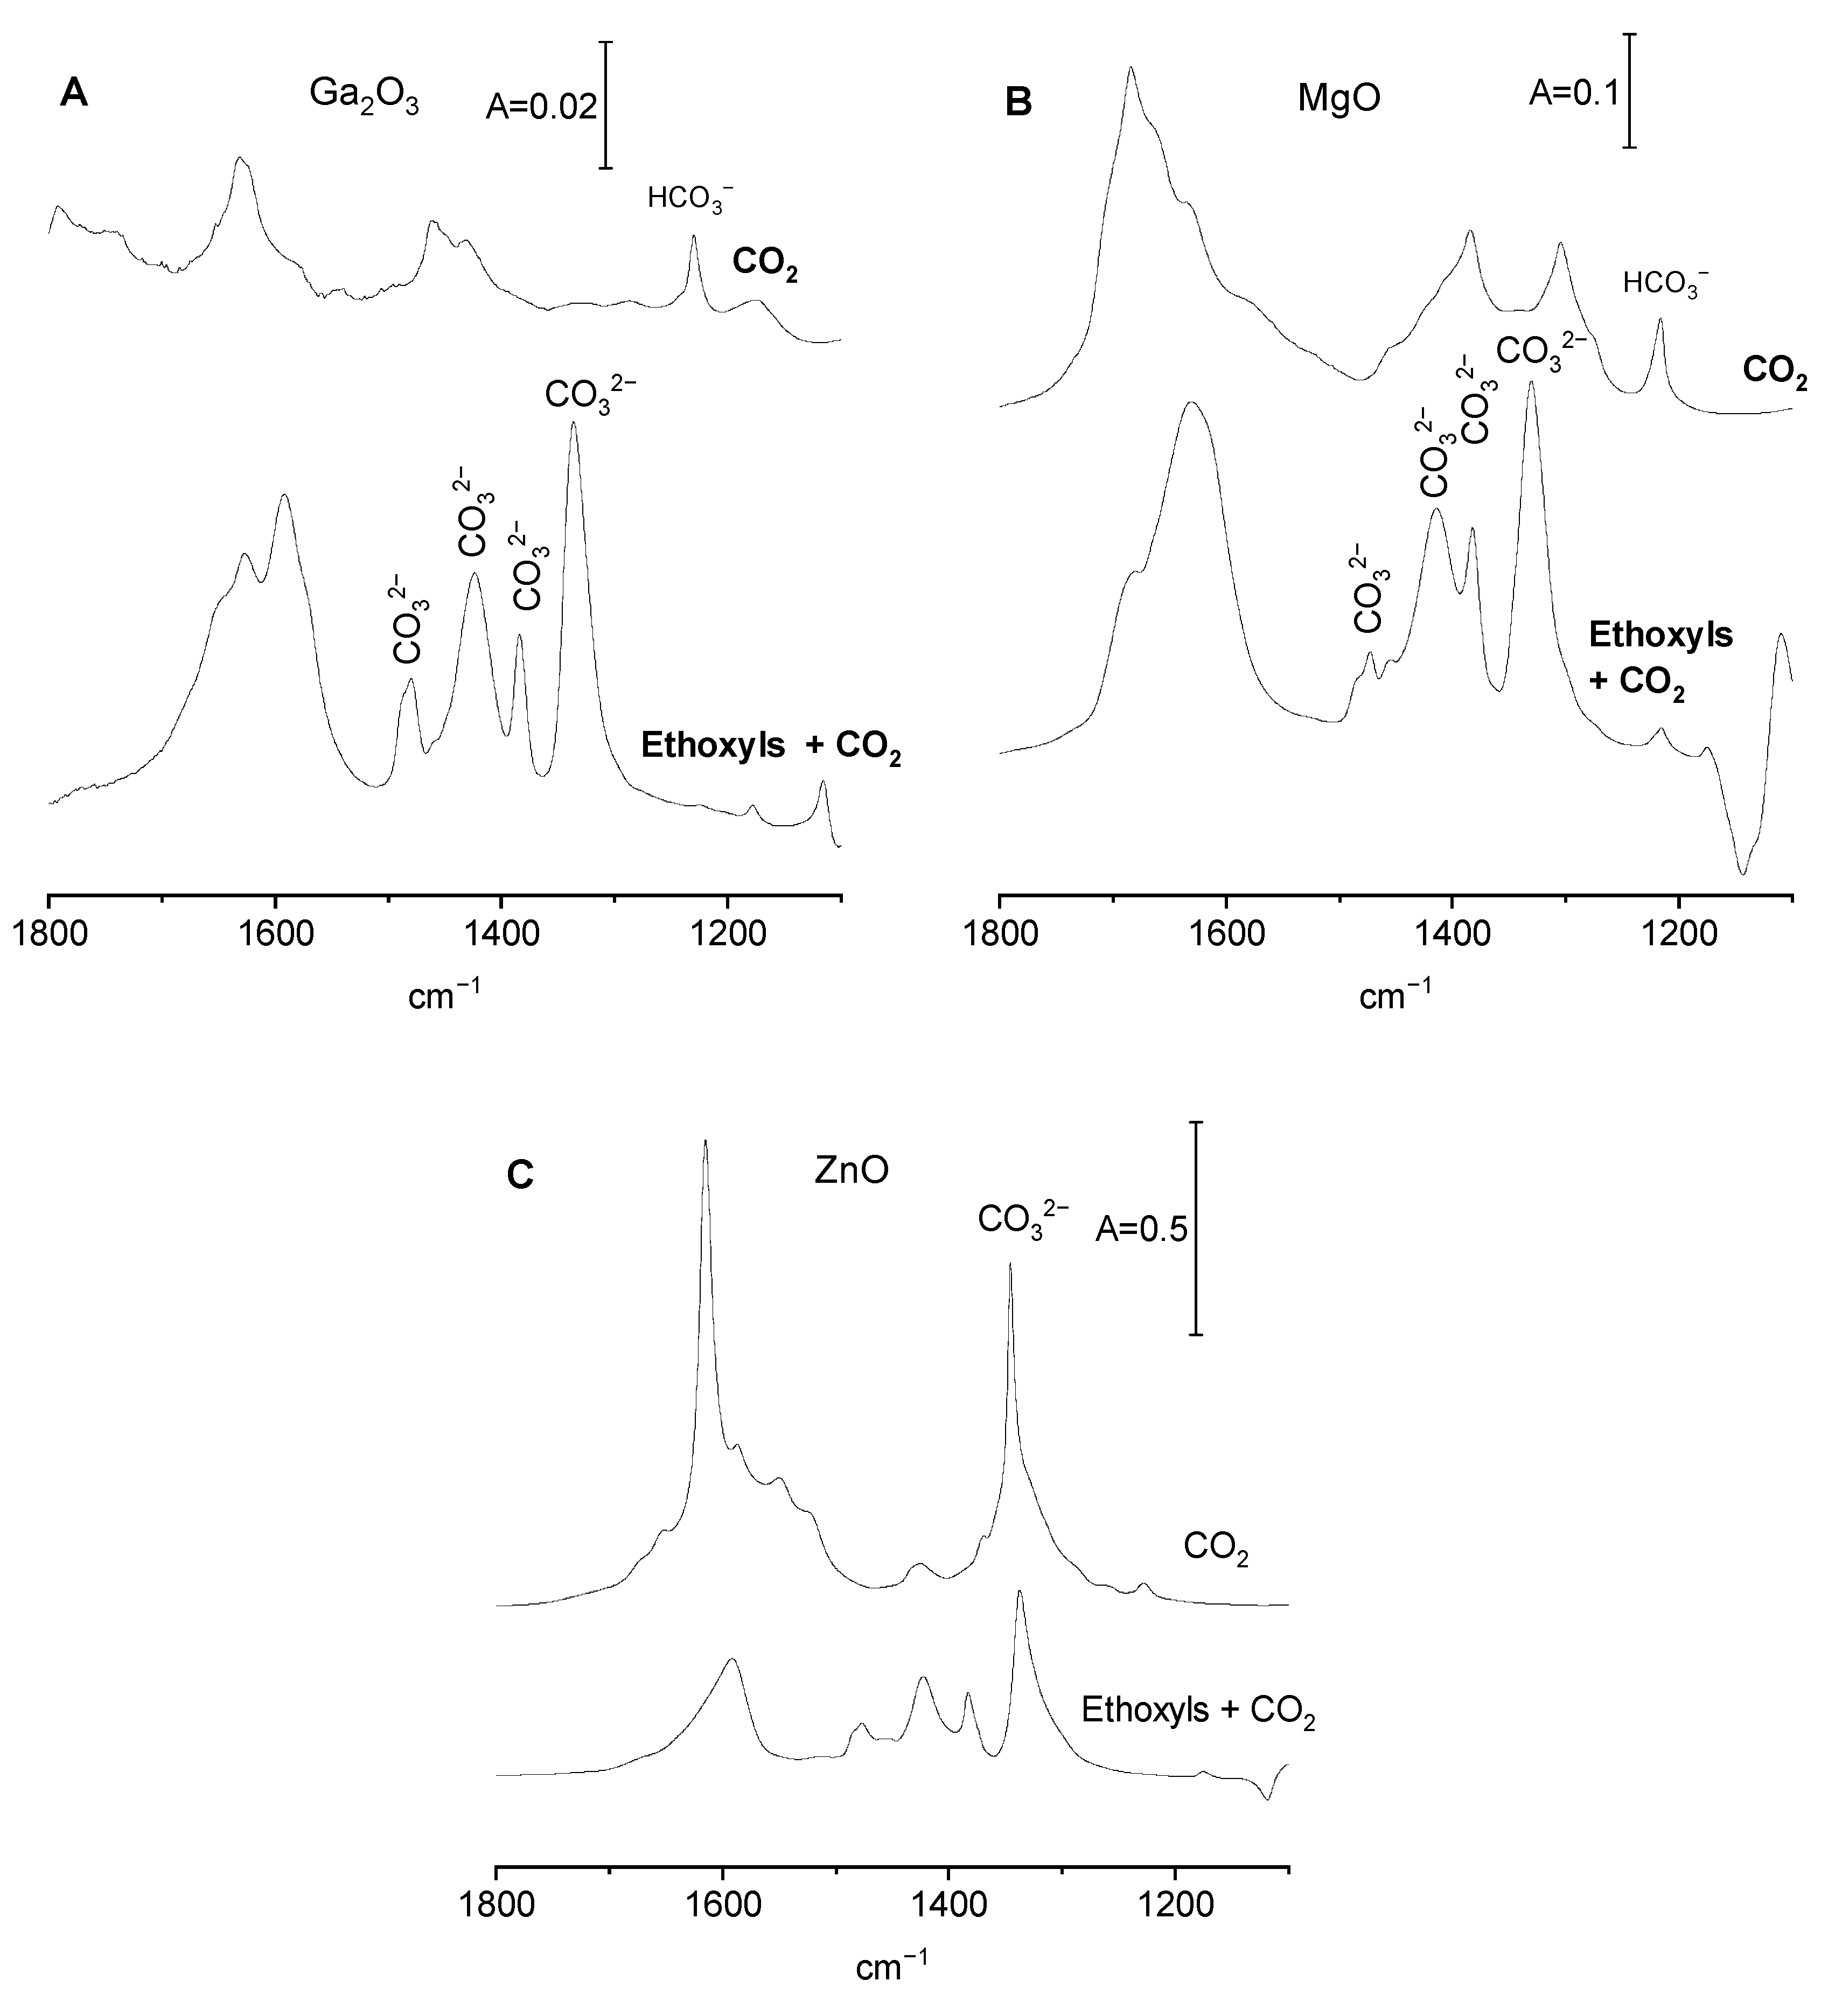
The spectra of CO
2 adsorbed on Ga
2O
3, MgO, and ZnO without preadsorbed ethanol and ammonia are presented in
Figure 4A–C (top spectra). The adsorption of CO
2 on these oxides has already been studied, and the results were described in our previous paper [
19]. The most important conclusions will be revisited below.
CO
2 adsorbed on Ga
2O
3 forms only bicarbonate species, indicating that OH
− sites are the only basic sites able to react with CO
2. Both monodentate and bidentate bicarbonates were formed. Carbonate ions were not produced. Similar results were obtained in our previous study concerning alumina [
20], as well as in a study by other authors [
16] The analysis of the spectra in OH region showed that only ca. 10% of hydroxyls were sufficiently basic to react with CO
2. The OH groups reacting with CO
2 were the hydroxyls with the highest stretching frequencies, i.e., hydroxyls that were also reacting with ethanol.
The adsorption of CO
2 on MgO produces both bicarbonate and carbonate species, evidencing that the basic sites can be either OH
− and O
2−. Both monodentate and bidentate bicarbonates were formed. Similar results were also obtained by other authors [
32,
33] The reaction with CO
2 consumed ca. 10–20% of all the hydroxyls. The analysis of the OH spectra proved that the high-frequency Mg-OH terminal groups (type A) were more basic than Mg-OH-Mg (type B).
ZnO contained primarily O
2− sites, and predominantly carbonate ions were formed by the adsorption of CO
2, with the concentration of bicarbonates being very low. This is consistent with the fact that the intensity of OH bands is also very low (
Figure 1B).
Quantitative studies of the concentration of basic sites O
2− and OH
− ware also carried out. The extinction coefficients of diagnostic bands at ca. 1220 cm
−1 1440 cm
−1 for HCO
3− and 1340 cm
−1 for CO
3− were determined by the adsorption of measured doses of CO
2 on ZrO
2 and CeO
2 [
18], and subsequently, the concentrations of basic sites (separately, O
2− and OH
−) were determined for ZrO
2, CeO
2, CuO, Al
2O
3, ZnO, Ga
2O
3, and MgO [
19]. Moreover, the total concentration of all the basic sites (O
2− plus OH
−) was determined in CO
2-desorption experiments in which the amount of desorbed CO
2 was monitored by IR spectroscopy. For all the mentioned oxides, the basicity measured by two independent methods (from the intensities of bicarbonate and carbonate bands and from desorption experiments) were primarily the same.
The total concentration of basic sites on Ga
2O
3, MgO, and ZnO, both with and without CO₂ desorption as monitored by IR studies, is presented in
Table 1.
CO2 adsorption on Ga2O3, MgO, and ZnO with preadsorbed ethanol
The spectrum of bicarbonate and carbonate species formed by the reaction of CO
2 with basic sites on gallia with preadsorbed ethanol (i.e., containing surface ethoxy groups) is presented in
Figure 4A (bottom spectrum) and may be compared with the spectrum of bicarbonates formed on gallia without ethoxy groups (top spectrum).
The band of bending of OH (δ
OH at 1233 cm
−1) of bicarbonate species that is present in the spectrum of CO
2 adsorbed on Ga
2O
3 without ethoxyls is nearly absent in the presence of ethoxyls. This may be explained by the fact that most basic Ga-OH were consumed by the reaction with ethanol and substituted by ethoxy groups. Bicarbonates were therefore not formed. The spectra of carbonate species formed on gallia with preadsorbed ethanol (
Figure 4A) show some new bands that were absent when no ethanol was introduced. It may be supposed that the new bands at 1337 and 1592 cm
−1 may be attributed to ν
sym CO3 and ν
asym CO3 in bidendate carbonates, respectively. The band at 1384 cm
−1 may be assigned to monodentate carbonates, and the bands at 1425 and 1492 cm
−1 may be assigned to polydentate carbonates. The presence of relatively strong bands of carbonate species formed in the presence of ethoxyl groups evidences that some surface oxygens that were not basic enough to react with CO
2 became basic if Ga-OH were substituted by Ga-O-C
2H
5. Similar results (decrease in the contribution of basic OH
−, increase in the basicity of oxygens) were obtained in our earlier studies of alumina with preadsorbed ethanol [
20].
The spectra of CO
2 adsorbed on MgO with and without preadsorbed ethanol are presented in
Figure 4B. In the presence of ethoxy groups, the intensity of the 1216 cm
−1 band of bicarbonates is lower than its intensity without ethoxyls. This result may be explained by the substitution of some Mg-OH by Mg-O-C
2H
5, decreasing the amount of hydroxyls able to react with CO
2, forming bicarbonates. The data presented in
Figure 4B contain new intense bands of carbonates, which were absent when no ethoxyls were present. The intense bands at 1331 and 1630 cm
−1 may be assigned to bidentate carbonyls. The band at 1382 cm
−1 may be due to monodentate carbonyls, and the bands at 1415 and 1473 cm
−1 may be attributed to polydentate carbonyls.
The behaviour of ZnO is different from that described above for Ga
2O
3 and MgO. ZnO (unlike Ga
2O
3 and MgO) primarily does not contain surface OH groups. While on Ga
2O
3 and MgO, ethoxy groups were formed by substitution of OH by O-C
2H
5 and ethoxyls on ZnO were formed on surface oxygens. The spectra of CO
2 adsorbed on ZnO with and without ethoxy groups are presented in
Figure 4C. Without ethoxy groups, bidentate carbonates (the bands at 1345 and 1615 cm
−1) were nearly the only groups formed, whereas the contribution of bicarbonates was very weak. The spectrum in
Figure 4C suggests that two kinds of bidentate carbonates are present. One kind (denoted as type A) is characterized by bands at 1345 and 1615 cm
−1), while the second kind (type B) is characterized by shoulders at 1330 cm
−1 and 1590 cm
−1.
In the presence of ethoxy groups, the concentration of carbonates on ZnO is lower than without ethoxyls (contrary to Ga
2O
3 and MgO). This may be explained by the fact that on ZnO, ethoxy groups are formed on oxygen atoms; therefore, the amount of basic oxygens able to react with CO
2 and form carbonates is lower. The analysis of the spectra presented in
Figure 4C suggests that in the presence of ethoxy groups, the basic oxygen atoms responsible for the formation of bidentate carbonates of type A are blocked by ethoxyls. The basic oxygens responsible for the formation of carbonates type B remain. The band at 1383 cm
−1 may be assigned to monodentate, and those at 1420 and 1480 cm
−1 may be assigned to polydentate carbonates.
The information on the concentration of all the basic sites (O
2− plus OH
−) on the surfaces of all the three oxides with and without the ethoxy groups was obtained in the studies of desorption of CO
2 monitored by IR according to the procedure described in our previous paper [
19]. These concentrations are presented in
Table 1. For Ga
2O
3 and MgO, the formation of ethoxy groups increased the basicity of oxides. This result agrees with the conclusions obtained from the analysis of the data presented in
Figure 4A,B (increase in the intensity of carbonate bands). On the other hand, for ZnO, the formation of ethoxy groups decreased the basicity, a result that also agrees with the data presented in
Figure 4C (decrease of carbonate bands).
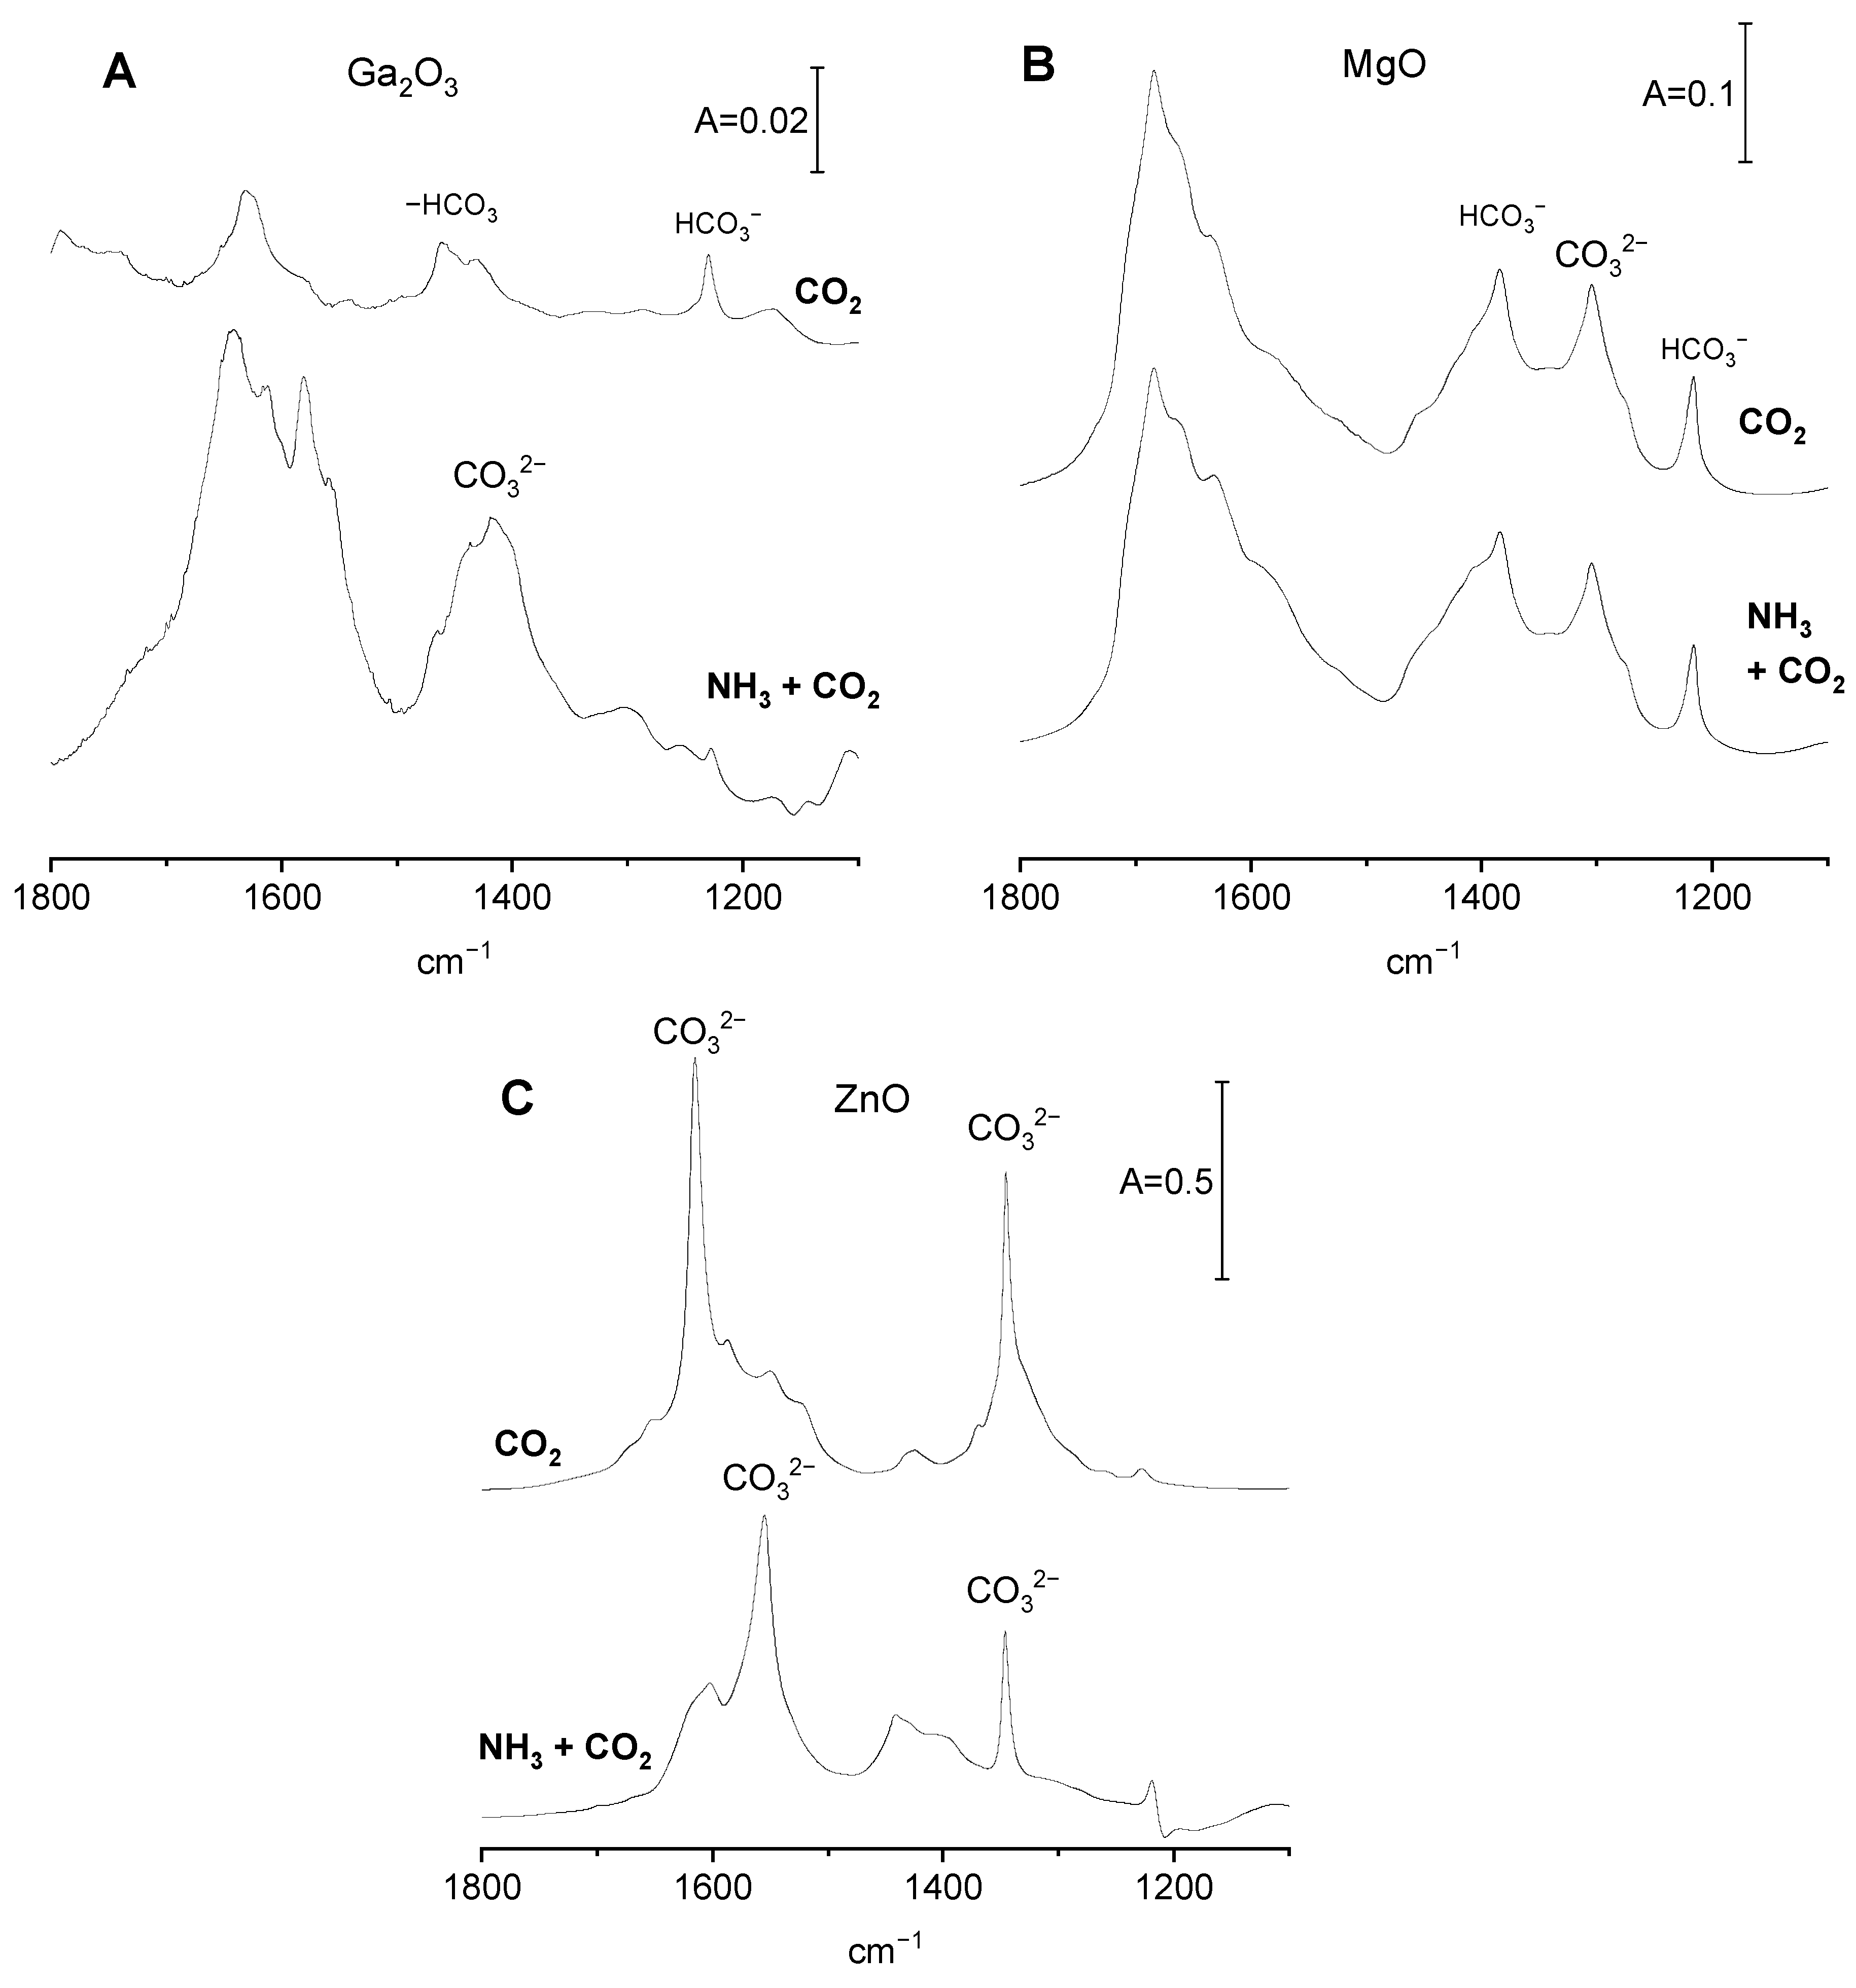
CO2 adsorption on Ga2O3, MgO, and ZnO with preadsorbed ammonia.
The spectra of CO
2 adsorbed on Ga
2O
3 with and without preadsorbed ammonia are presented in
Figure 5A. Ga
2O
3 contains only basic OH
−; therefore, the bicarbonates are the only species formed upon CO
2 adsorption. The amount of OH
− decreased when CO
2 was adsorbed on gallia with preadsorbed ammonia. This is proven by the decrease in the intensity of band 1231 cm
−1 of bicarbonate species. It may be explained by the engagement of surface hydroxyls in hydrogen bonding with ammonia (
Figure 3A); therefore, the number of Ga-OH able to react with CO
2 is smaller. In the presence of preadsorbed ammonia, the adsorption of CO
2 produces significant amounts of polydentate carbonate ions (bands at 1416 and 1580 cm
−1).
According to the data presented in
Figure 3B, ammonia is not adsorbed on MgO; therefore, the spectrum of CO
2 adsorbed on MgO that made contact with ammonia is the same as the spectrum of CO
2 adsorbed on MgO without ammonia (
Figure 5B), evidencing that ammonia does not change the basic properties of MgO.
The spectra of CO
2 adsorbed on ZnO with and without preadsorbed ammonia are presented in
Figure 5C. In the presence of preadsorbed ammonia, the bands of carbonates are present at somewhat different positions than without ammonia, suggesting that the presence of ammonia interacting with Zn
2+ changes the manner of bonding of carbonate species to adsorption sites. The band of ν
sym CO3 of bidendate is lower, and new bands at 1400 and 1440 cm
−1 appear. These new bands may be assigned to monodentate and polydentate carbonates. The shift of the band of ν
asym CO3 band from 1615 to 1555 cm
−1 is also observed.
Total concentration of all the basic sites
The information on the total concentration of all the basic sites (O
2− plus OH
−) was obtained in the experiments on the desorption of CO
2 monitored by IR spectroscopy according to the procedure described in our previous publication [
19]. The concentration values for oxides with and without preadsorbed ethanol and ammonia are presented in
Table 1.
The concentrations were determined according to the procedure described in the Materials and Methods section.
The formation of ethoxy groups on Ga
2O
3 and MgO increases the total basicity, as observed before for alumina [
20]. This may be explained by the substitution of surface hydroxyls by ethoxyls, which increases the negative charge on neighbouring oxygen atoms. The data presented in
Figure 4A,B evidence the significant increase in the intensity of bands of carbonate species and the decrease in the intensity of bicarbonate bands, indicating a significant increase in the concentration of O
2− and decrease in the concentration of OH
−. An opposite effect was observed for ZnO. The total concentration of all the basic sites decreases for ZnO with preadsorbed ethanol. A similar conclusion can be drawn from the analysis of the data presented in
Figure 4C, in which the decrease in the intensity of carbonate bands is seen. This may be explained by a different mechanism of ethoxy-group formation on ZnO than on Ga
2O
3 and MgO. On ZnO, which does not contain surface hydroxyls, ethoxyl groups are formed on surface oxygens; therefore, the smaller number of oxygens may react with CO
2, forming carbonate species.
The adsorption of NH
3 on Ga
2O
3 increases the concentration of basic sites (
Table 1), a result that agrees with the conclusion drawn by comparing the spectra presented in
Figure 5A (increase of intensity of carbonate bands). Similar effects were obtained for alumina [
20]. This may be explained by transmission of electrons from ammonia molecule to adsorption sites (surface Ga atoms) and to neighbouring surface oxygens, which become sufficiently basic to react with CO
2. Unlike Ga
2O
3, MgO does not adsorb ammonia (no ammonia bands are seen in
Figure 3D). There is no increase in the concentration of basic sites in the sample of MgO in contact with NH
3 (
Table 1) and no increase in the intensity of carbonate bands (
Figure 5B). According to the data presented in
Table 1, the adsorption of ammonia on ZnO does not change the number of basic sites. However, it changes how the carbonate species are bonded to surface sites (
Figure 5C).
