

Metabolomics Insights into the Differential Response of Breast Cancer Cells to the Phenolic Compounds Hydroxytyrosol and Luteolin


Abstract
1. Introduction
2. Results
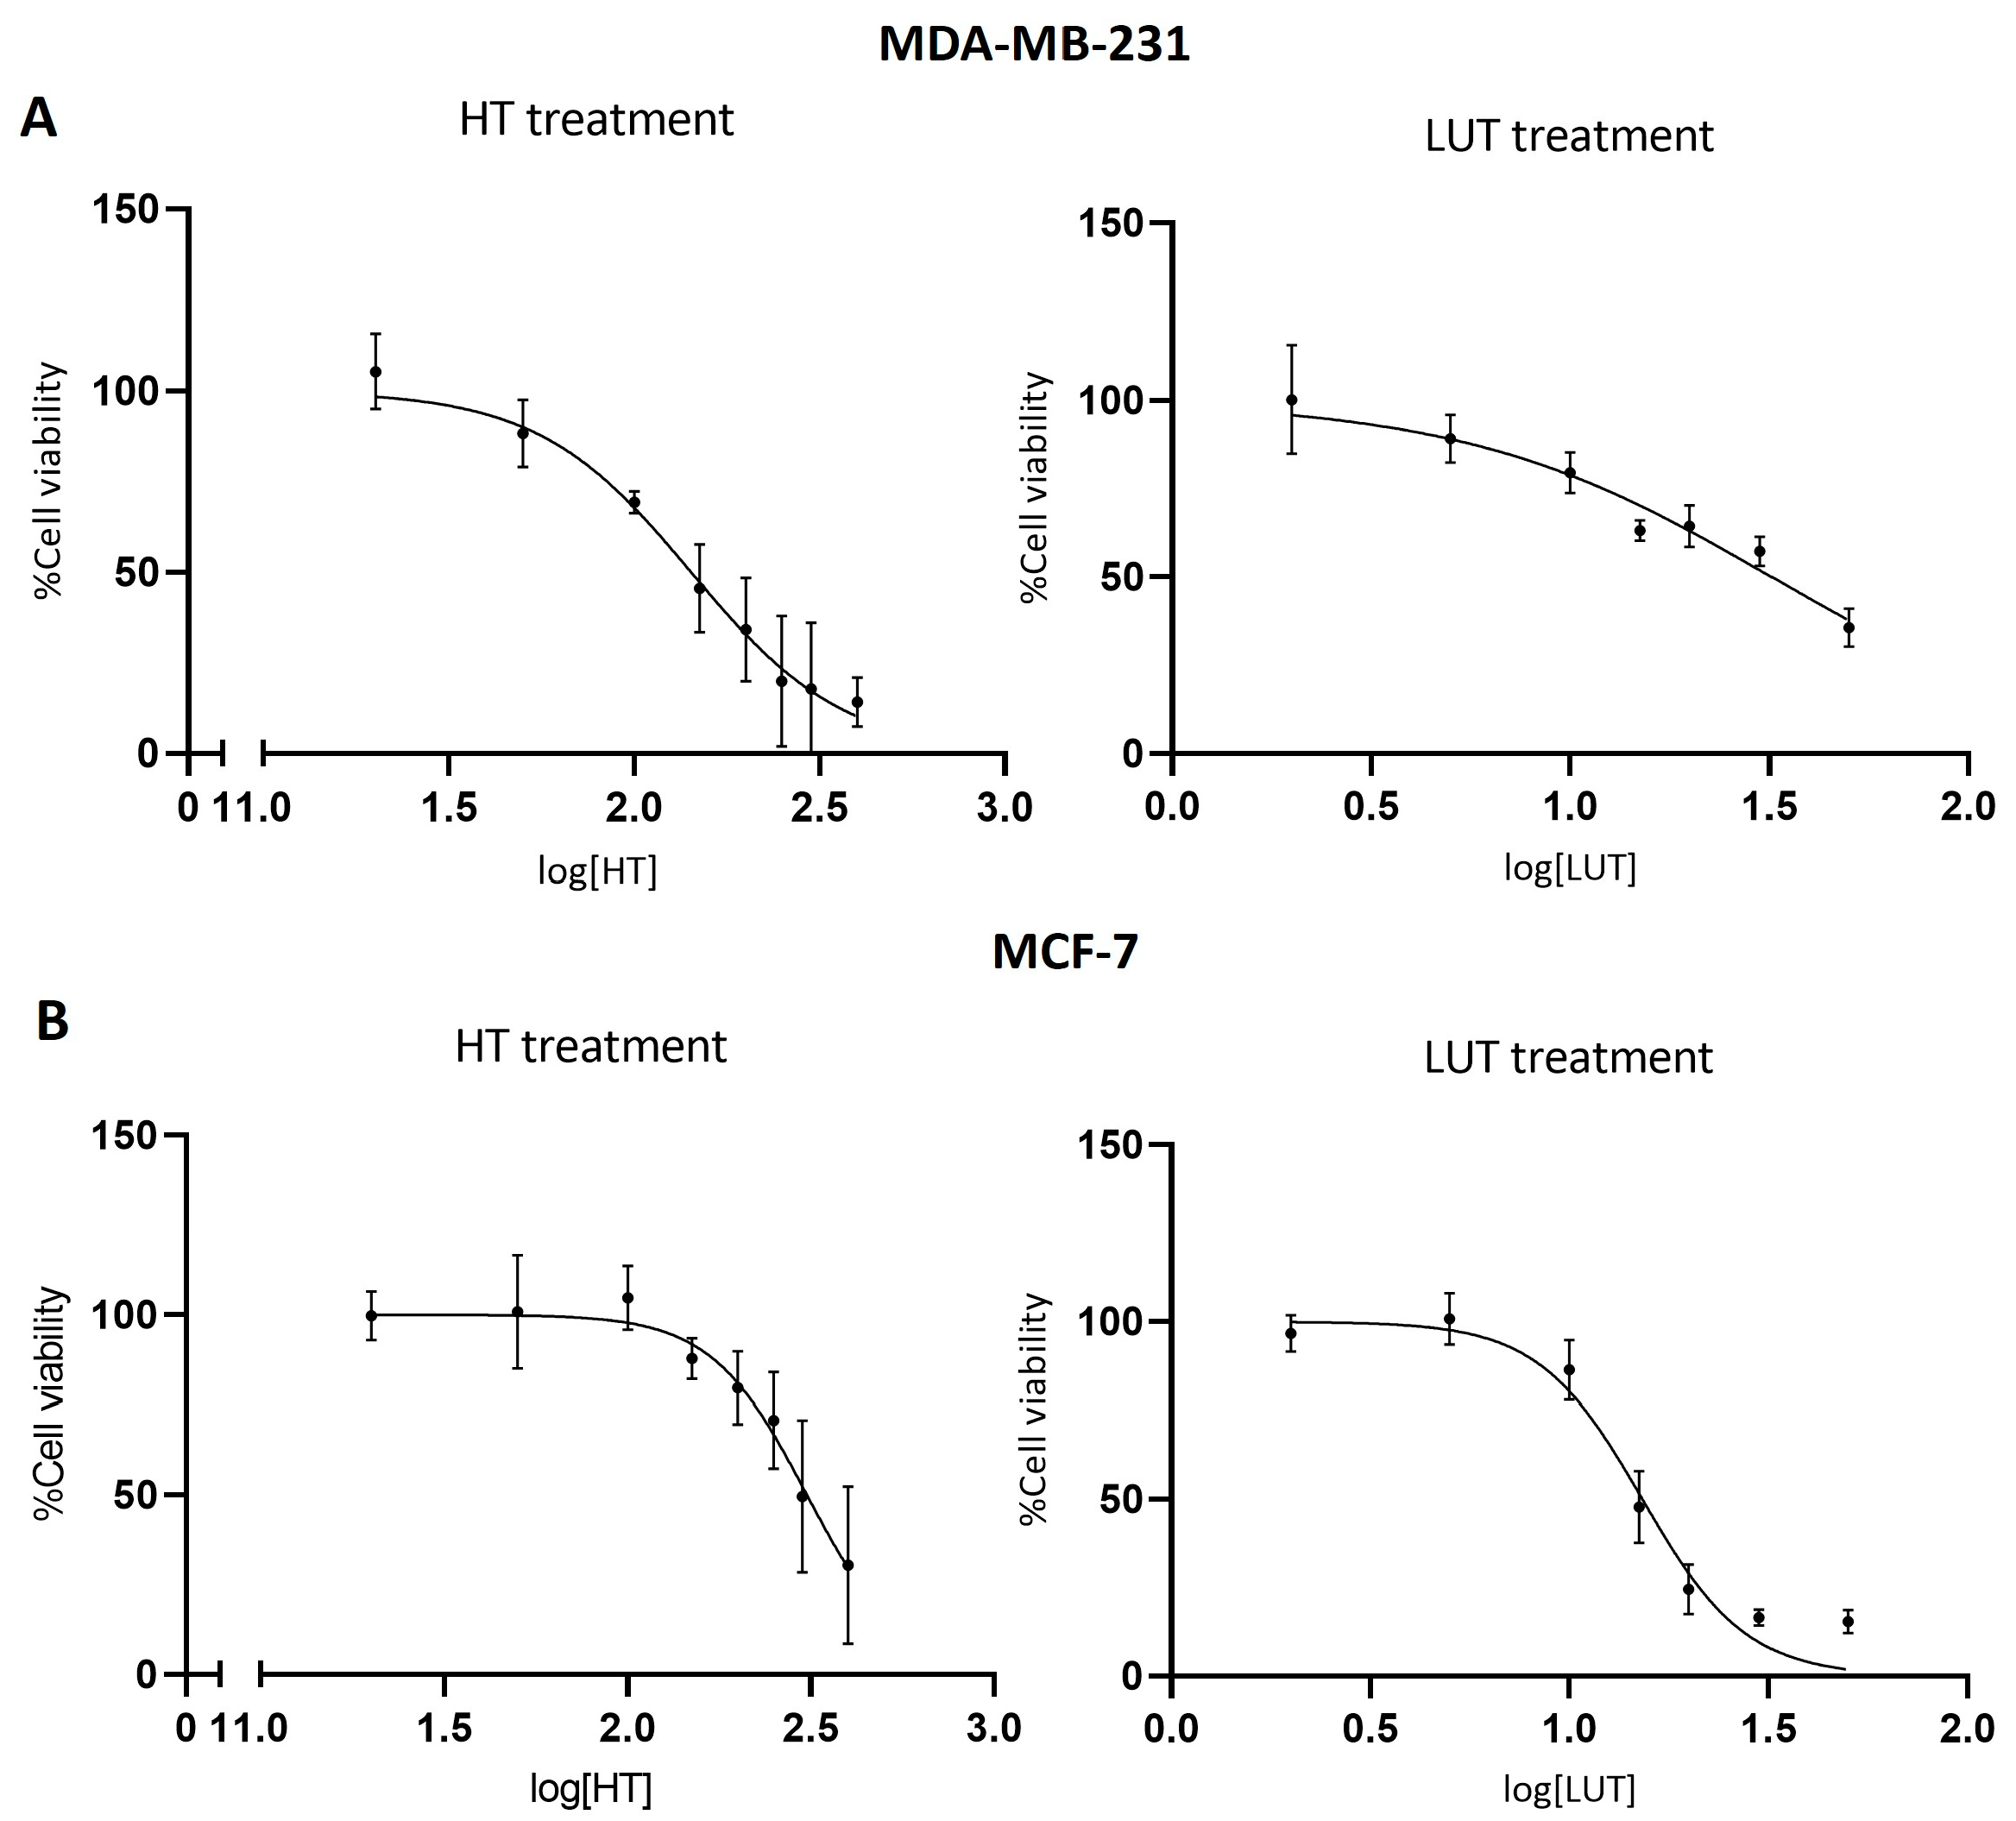
2.1. Cell Viability
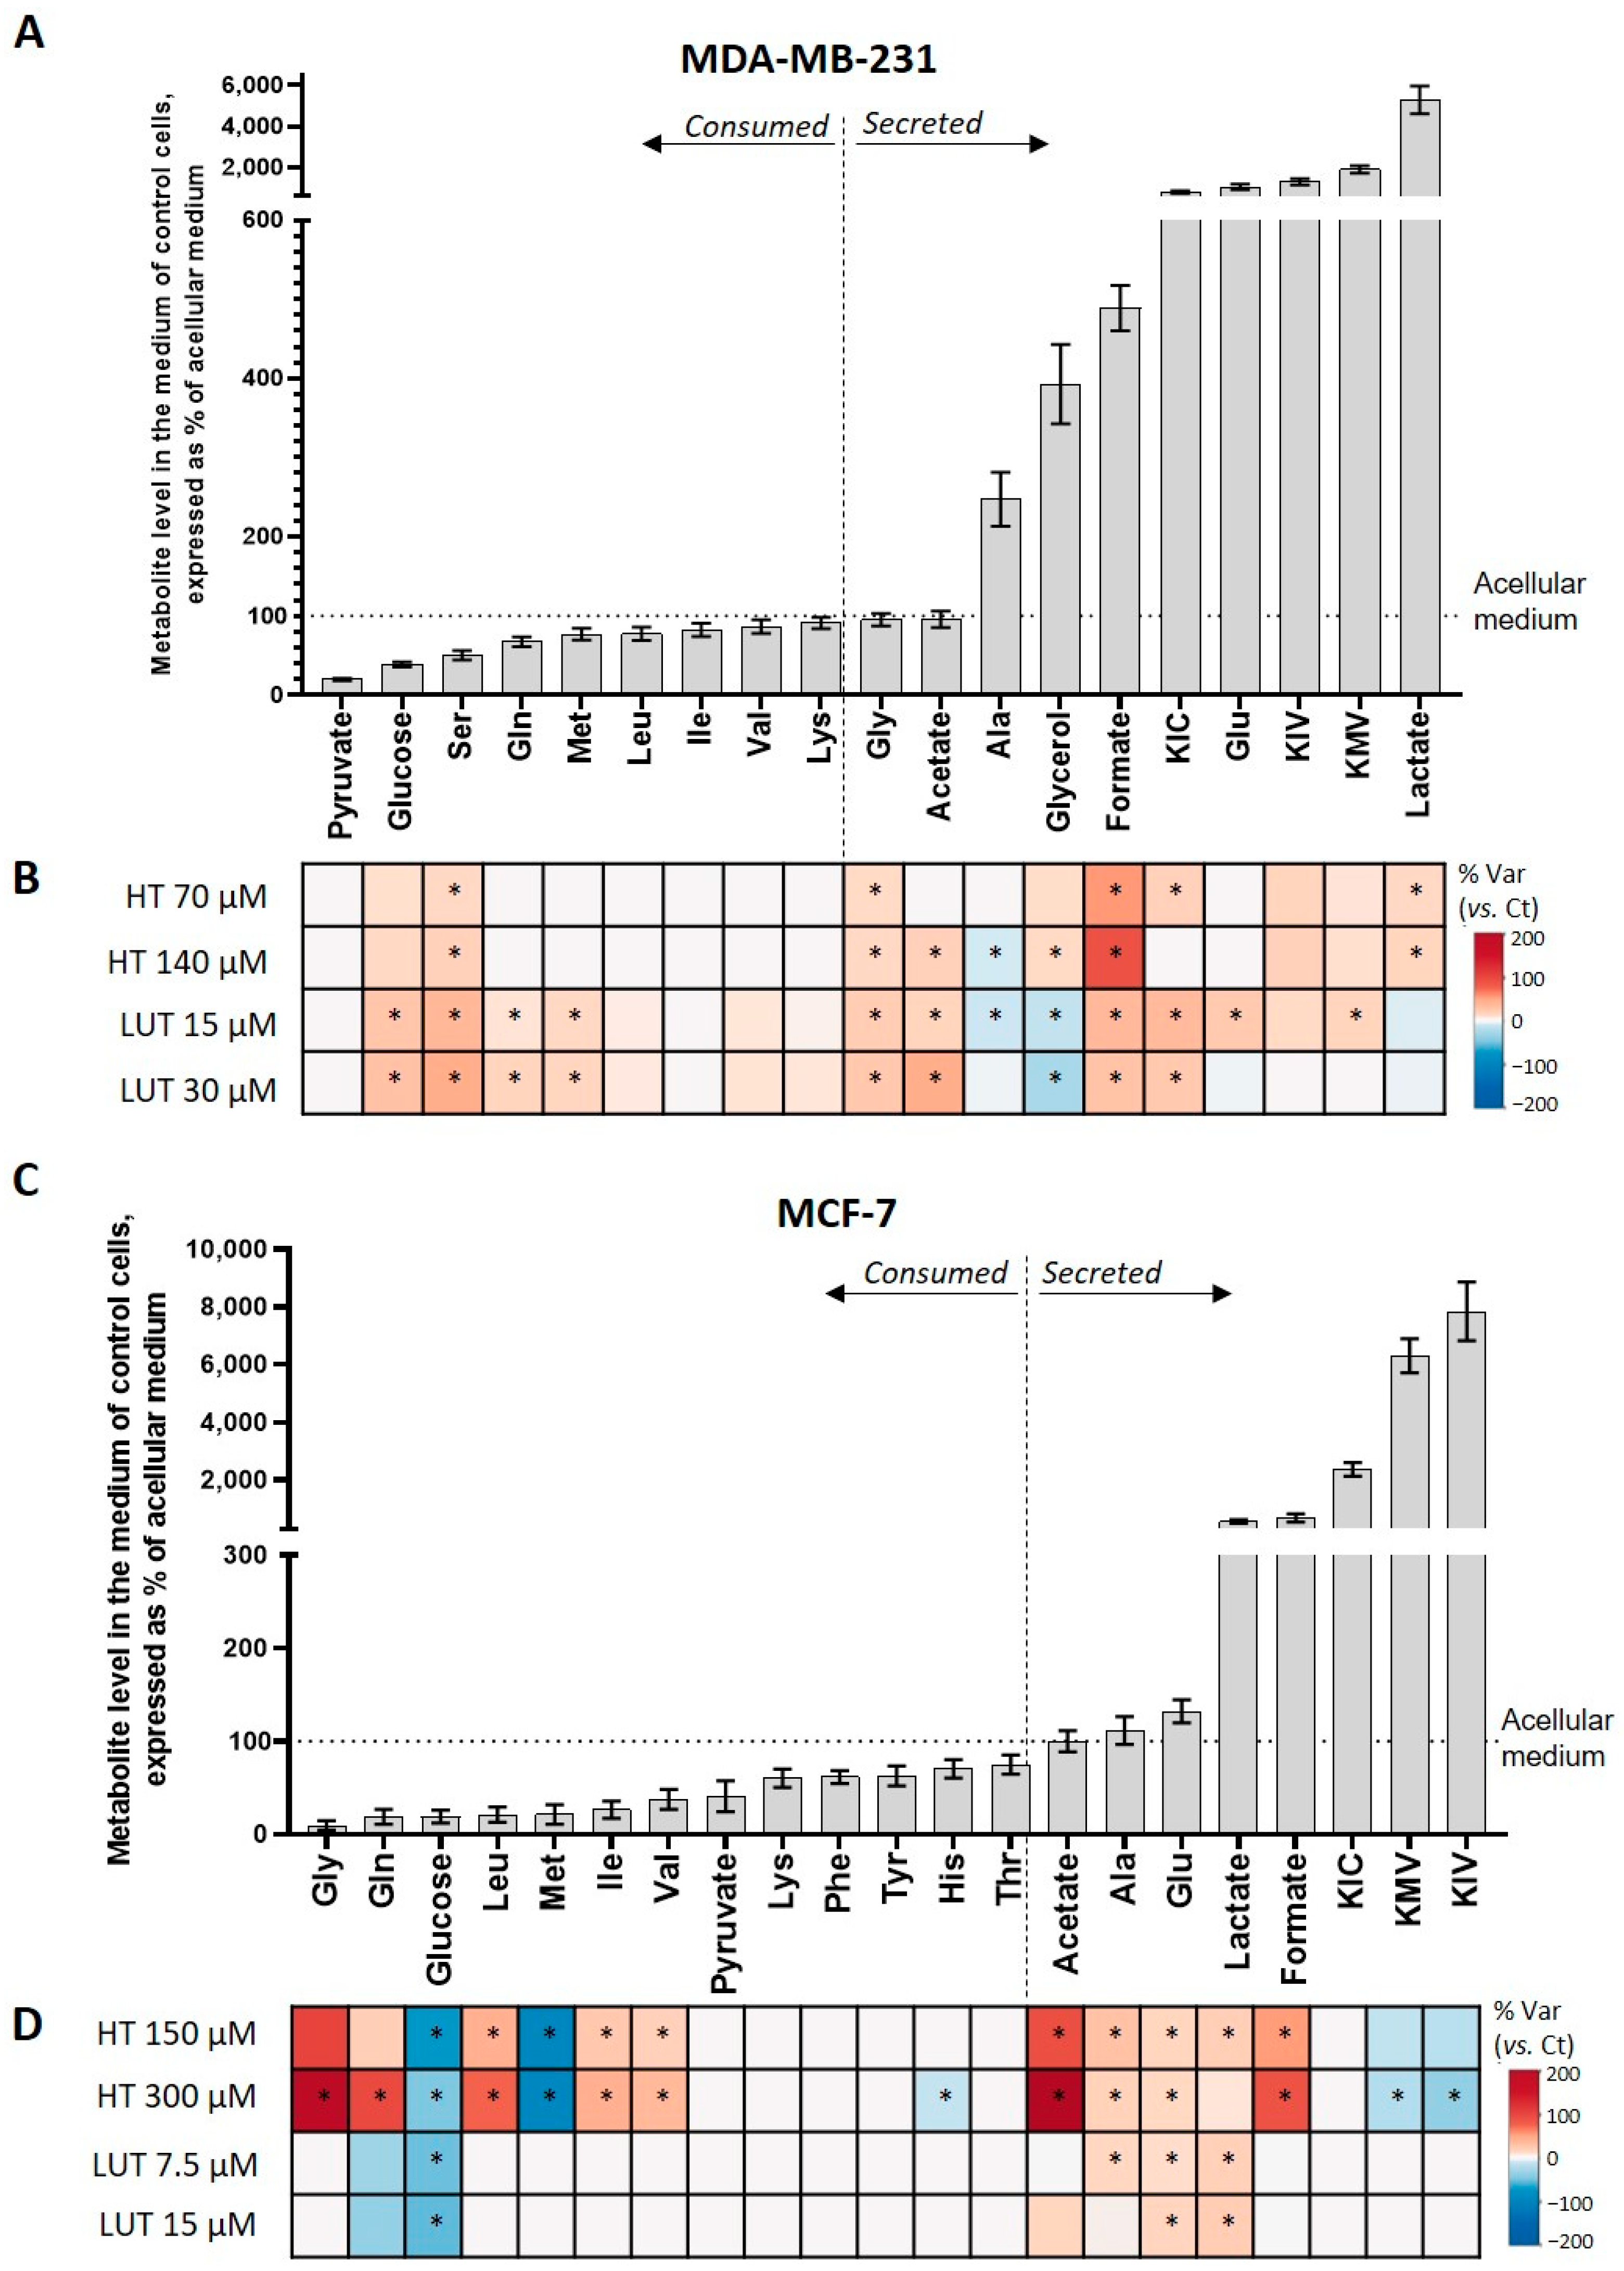
2.2. Extracellular Metabolic Profiling
2.3. Intracellular Metabolic Profiling
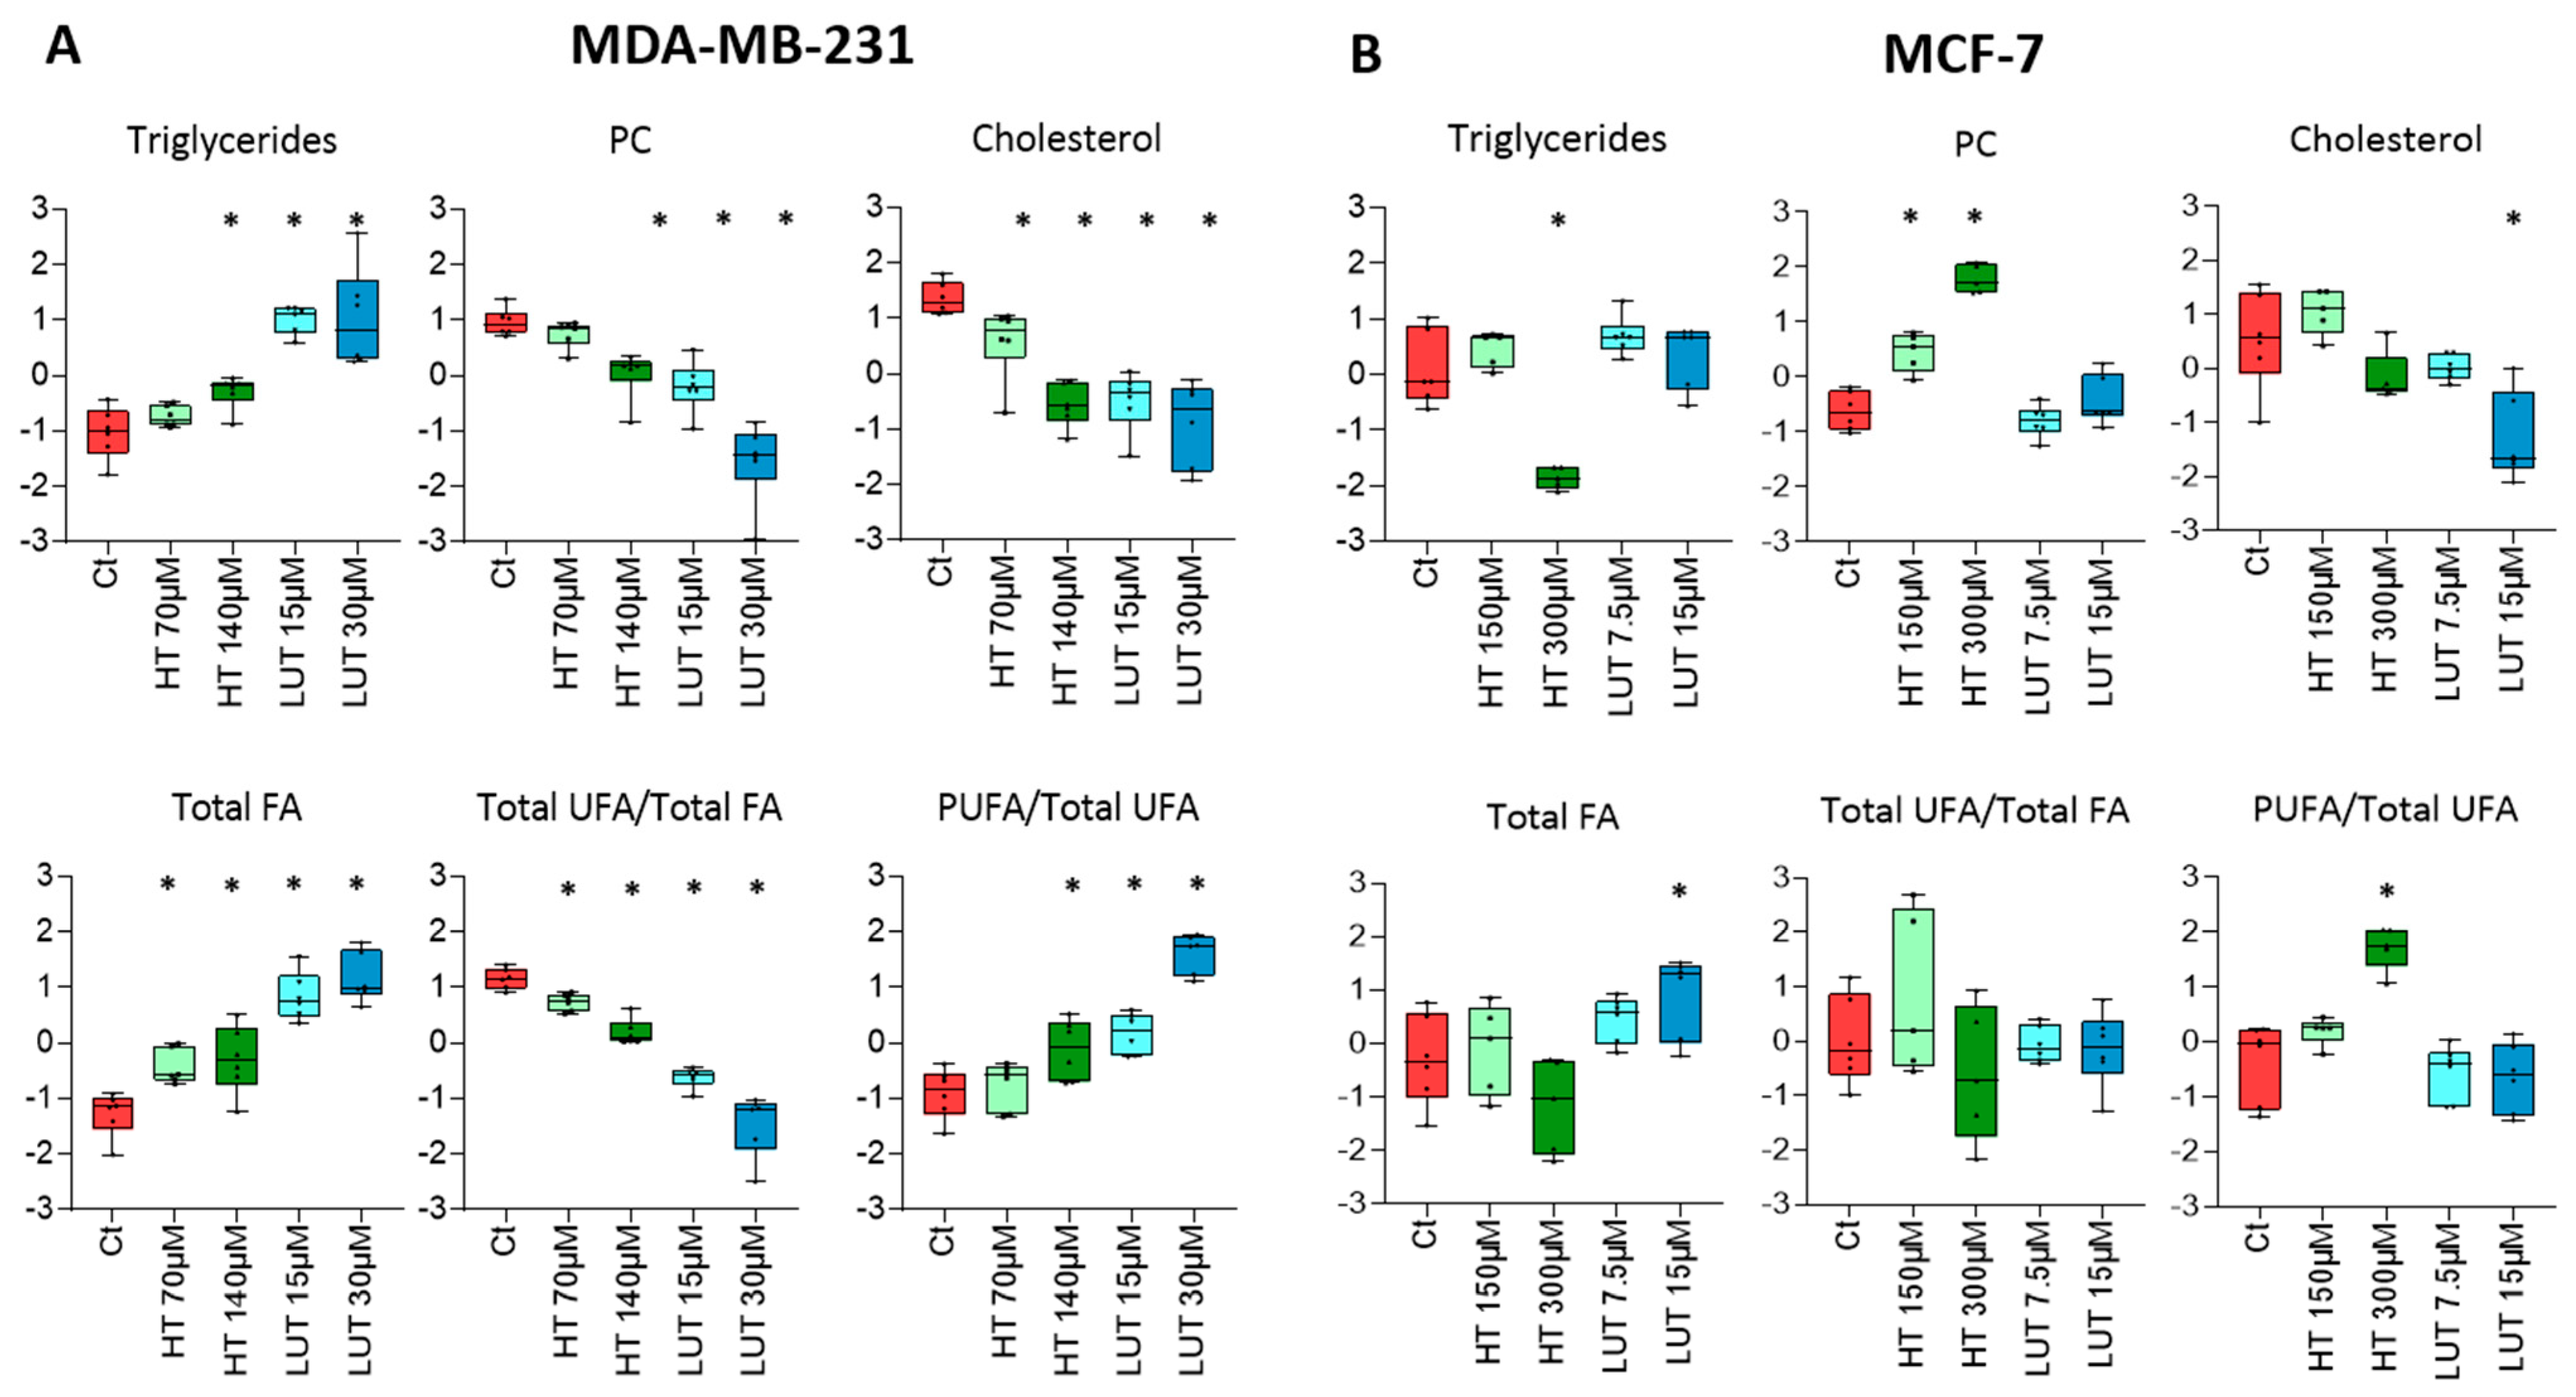
2.4. Lipid Composition
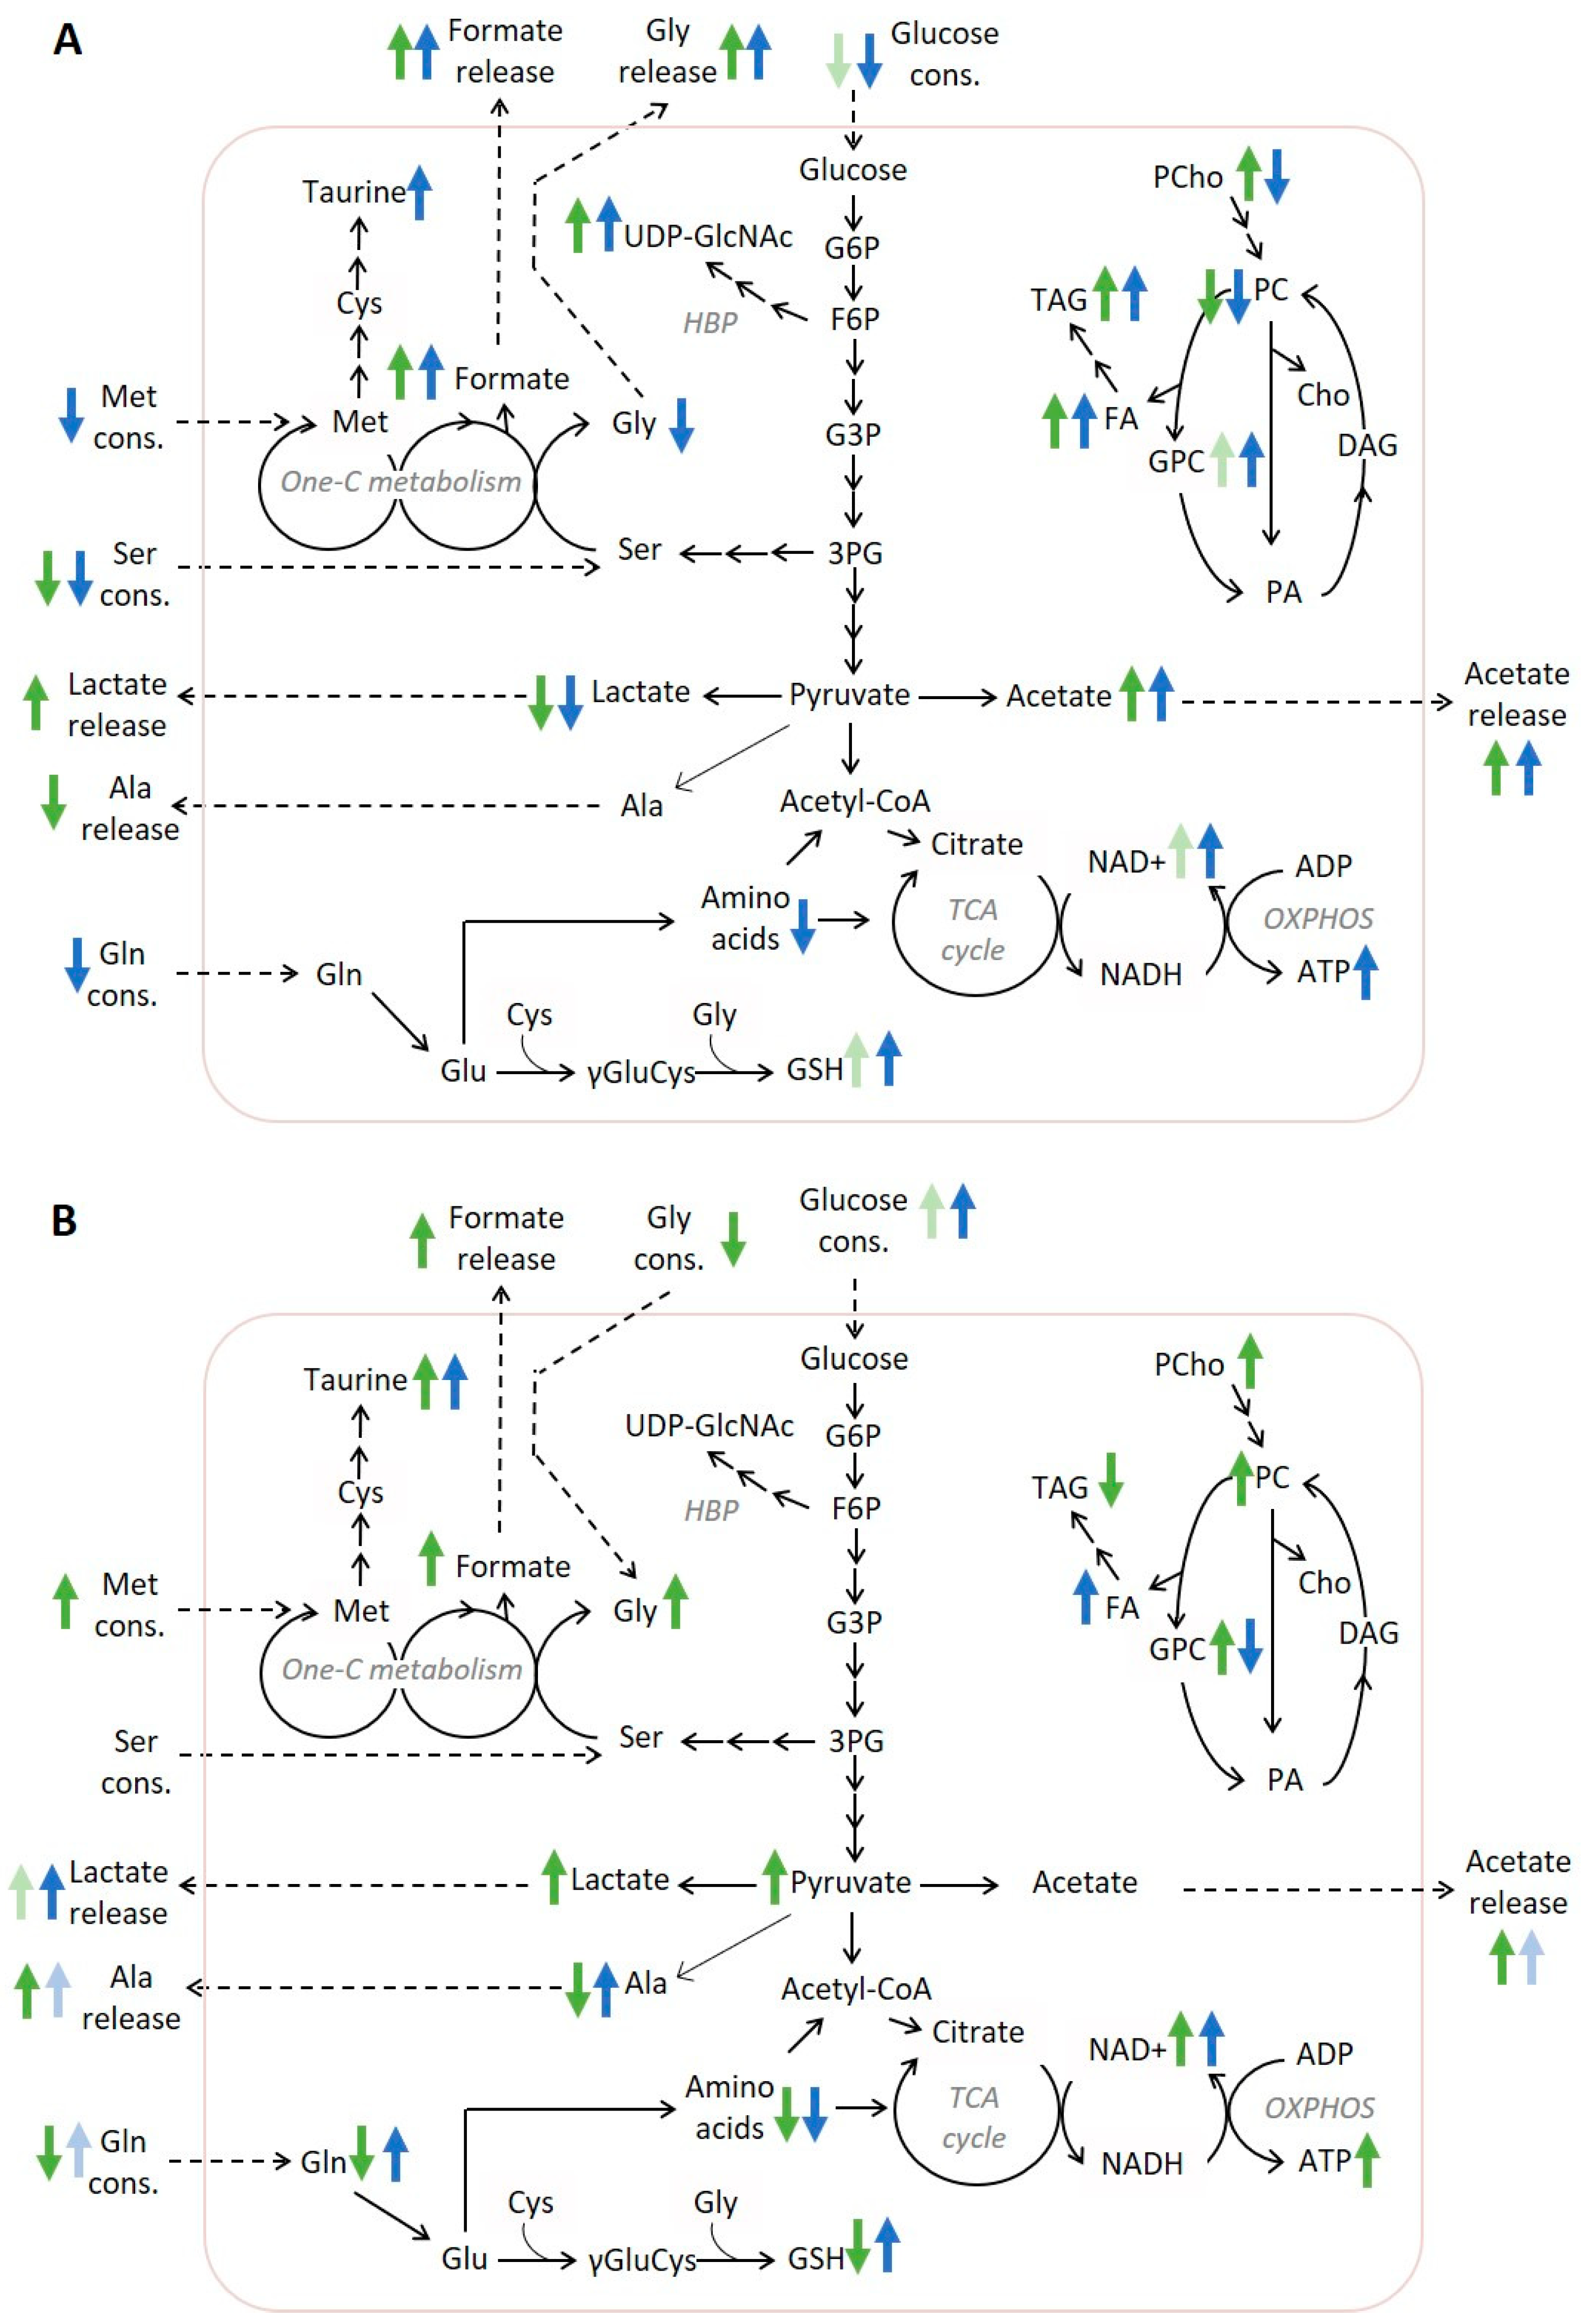
3. Discussion
4. Materials and Methods
4.1. Chemicals
4.2. Instrumentation
4.3. Cell Culture
4.4. Viability Assay
4.5. Cell Treatment for NMR Analysis
4.6. Sample Collection and Preparation for NMR Analysis
4.7. NMR Data Acquisition
4.8. Multivariate Analysis and Spectral Integration of NMR Spectra
5. Study Limitations
6. Conclusions
Supplementary Materials
Author Contributions
Funding
Institutional Review Board Statement
Informed Consent Statement
Data Availability Statement
Conflicts of Interest
Sample Availability
References
- Ferlay, J.; Colombet, M.; Soerjomataram, I.; Parkin, D.M.; Piñeros, M.; Znaor, A.; Bray, F. Cancer statistics for the year 2020: An overview. Int. J. Cancer 2021, 149, 778–789. [Google Scholar] [CrossRef] [PubMed]
- Kotepui, M. Diet and risk of breast cancer. Wspolczesna Onkol. 2016, 20, 13–19. [Google Scholar] [CrossRef] [PubMed]
- Guasch-Ferré, M.; Willett, W.C. The Mediterranean diet and health: A comprehensive overview. J. Intern. Med. 2021, 290, 549–566. [Google Scholar] [CrossRef] [PubMed]
- Jimenez-Lopez, C.; Carpena, M.; Lourenço-Lopes, C.; Gallardo-Gomez, M.; Lorenzo, J.M.; Barba, F.J.; Prieto, M.A.; Simal-Gandara, J. Bioactive compounds and quality of extra virgin olive oil. Foods 2020, 9, 1014. [Google Scholar] [CrossRef] [PubMed]
- Moral, R.; Escrich, E. Influence of Olive Oil and Its Components on Breast Cancer: Molecular Mechanisms. Molecules 2022, 27, 477. [Google Scholar] [CrossRef] [PubMed]
- Bouallagui, Z.; Han, J.; Isoda, H.; Sayadi, S. Hydroxytyrosol rich extract from olive leaves modulates cell cycle progression in MCF-7 human breast cancer cells. Food Chem. Toxicol. 2011, 49, 179–184. [Google Scholar] [CrossRef] [PubMed]
- Han, J.; Talorete, T.P.N.; Yamada, P.; Isoda, H. Anti-proliferative and apoptotic effects of oleuropein and hydroxytyrosol on human breast cancer MCF-7 cells. Cytotechnology 2009, 59, 45–53. [Google Scholar] [CrossRef]
- Sirianni, R.; Chimento, A.; De Luca, A.; Casaburi, I.; Rizza, P.; Onofrio, A.; Iacopetta, D.; Puoci, F.; Ando, S.; Maggiolini, M.; et al. Oleuropein and hydroxytyrosol inhibit MCF-7 breast cancer cell proliferation interfering with ERK1/2 activation. Mol. Nutr. Food Res. 2010, 54, 833–840. [Google Scholar] [CrossRef]
- Granados-Principal, S.; Quiles, J.L.; Ramirez-Tortosa, C.; Camacho-Corencia, P.; Sanchez-Rovira, P.; Vera-Ramirez, L.; Ramirez-Tortosa, M. Hydroxytyrosol inhibits growth and cell proliferation and promotes high expression of sfrp4 in rat mammary tumours. Mol. Nutr. Food Res. 2011, 55 (Suppl. 1), 117–126. [Google Scholar] [CrossRef]
- Sui, J.Q.; Xie, K.P.; Xie, M.J. Inhibitory effect of luteolin on the proliferation of human breast cancer cell lines induced by epidermal growth factor. Acta Physiol. Sin. 2016, 68, 27–34. [Google Scholar]
- Kim, M.J.; Woo, J.S.; Kwon, C.H.; Kim, J.H.; Kim, Y.K.; Kim, K.H. Luteolin induces apoptotic cell death through AIF nuclear translocation mediated by activation of ERK and p38 in human breast cancer cell lines. Cell Biol. Int. 2012, 36, 339–344. [Google Scholar] [CrossRef]
- Lee, E.J.; Oh, S.Y.; Sung, M.K. Luteolin exerts anti-tumor activity through the suppression of epidermal growth factor receptor-mediated pathway in MDA-MB-231 ER-negative breast cancer cells. Food Chem. Toxicol. 2012, 50, 4136–4143. [Google Scholar] [CrossRef] [PubMed]
- Sun, D.W.; Zhang, H.D.; Mao, L.; Mao, C.F.; Chen, W.; Cui, M.; Ma, R.; Cao, H.X.; Jing, C.W.; Wang, Z.; et al. Luteolin Inhibits Breast Cancer Development and Progression in Vitro and in Vivo by Suppressing Notch Signaling and Regulating MiRNAs. Cell. Physiol. Biochem. 2015, 37, 1693–1711. [Google Scholar] [CrossRef] [PubMed]
- Cook, M.T.; Mafuvadze, B.; Besch-Williford, C.; Ellersieck, M.R.; Goyette, S.; Hyder, S.M. Luteolin suppresses development of medroxyprogesterone acetate-accelerated 7,12-dimethylbenz(a)anthracene-induced mammary tumors in Sprague-Dawley rats. Oncol. Rep. 2016, 35, 825–832. [Google Scholar] [CrossRef] [PubMed]
- Escrich, E.; Solanas, M.; Moral, R.; Escrich, R. Modulatory Effects and Molecular Mechanisms of Olive Oil and Other Dietary Lipids in Breast Cancer. Curr. Pharm. Des. 2011, 17, 813–830. [Google Scholar] [CrossRef]
- Escrich, R.; Costa, I.; Moreno, M.; Cubedo, M.; Vela, E.; Escrich, E.; Moral, R. A high-corn-oil diet strongly stimulates mammary carcinogenesis, while a high-extra-virgin-olive-oil diet has a weak effect, through changes in metabolism, immune system function and proliferation/apoptosis pathways. J. Nutr. Biochem. 2019, 64, 218–227. [Google Scholar] [CrossRef]
- Escrich, E.; Solanas, M.; Moral, R. Olive oil, and other dietary lipids, in cancer: Experimental approaches. Cancer Treat. Res. 2014, 159, 341–351. [Google Scholar]
- Garcia-Guasch, M.; Medrano, M.; Costa, I.; Vela, E.; Grau, M.; Escrich, E.; Moral, R. Extra-Virgin Olive Oil and Its Minor Compounds Influence Apoptosis in Experimental Mammary Tumors and Human Breast Cancer Cell Lines. Cancers 2022, 14, 905. [Google Scholar] [CrossRef]
- Garcia-Guasch, M.; Navarro, L.; Rivero, V.; Costa, I.; Escrich, E.; Moral, R. A high extra-virgin olive oil diet induces changes in metabolic pathways of experimental mammary tumors. J. Nutr. Biochem. 2022, 99, 108833. [Google Scholar] [CrossRef]
- Pavlova, N.N.; Zhu, J.; Thompson, C.B. The hallmarks of cancer metabolism: Still emerging. Cell Metab. 2022, 34, 355–377. [Google Scholar] [CrossRef]
- Liberti, M.V.; Locasale, J.W. The Warburg Effect: How Does it Benefit Cancer Cells? Trends Biochem. Sci. 2016, 41, 287. [Google Scholar] [CrossRef] [PubMed]
- Martínez-Reyes, I.; Chandel, N.S. Cancer metabolism: Looking forward. Nat. Rev. Cancer. 2021, 21, 669–680. [Google Scholar] [CrossRef] [PubMed]
- Schiliro, C.; Firestein, B.L. Mechanisms of metabolic reprogramming in cancer cells supporting enhanced growth and proliferation. Cells 2021, 10, 1056. [Google Scholar] [CrossRef]
- Wishart, D.S. Metabolomics for investigating physiological and pathophysiological processes. Physiol. Rev. 2019, 99, 1819–1875. [Google Scholar] [CrossRef]
- Bayet-Robert, M.; Morvan, D. Metabolomics Reveals Metabolic Targets and Biphasic Responses in Breast Cancer Cells Treated by Curcumin Alone and in Association with Docetaxel. PLoS ONE 2013, 8, e57971. [Google Scholar] [CrossRef]
- Uifalean, A.; Schneider, S.; Gierok, P.; Ionescu, C.; Iuga, C.A.; Lalk, M. The Impact of Soy Isoflavones on MCF-7 and MDA-MB-231 Breast Cancer Cells Using a Global Metabolomic Approach. Int. J. Mol. Sci. 2016, 17, 1443. [Google Scholar] [CrossRef]
- Rushing, B.R.; Wiggs, A.; Molina, S.; Schroder, M.; Sumner, S. Metabolomics Analysis Reveals Novel Targets of Chemosensitizing Polyphenols and Omega-3 Polyunsaturated Fatty Acids in Triple Negative Breast Cancer Cells. Int. J. Mol. Sci. 2023, 24, 4406. [Google Scholar] [CrossRef] [PubMed]
- Rosignoli, P.; Sepporta, M.V.; Fabiani, R. Function In vitro chemo-preventive activities of hydroxytyrosol: The main phenolic compound present in extra-virgin olive oil. Food Funct. 2016, 7, 301–307. [Google Scholar] [CrossRef]
- Guerra, A.R.; Duarte, M.F.; Duarte, I.F. Targeting Tumor Metabolism with Plant-Derived Natural Products: Emerging Trends in Cancer Therapy. J. Agric. Food Chem. 2018, 66, 10663–10685. [Google Scholar] [CrossRef]
- Keating, E.; Martel, F. Antimetabolic Effects of Polyphenols in Breast Cancer Cells: Focus on Glucose Uptake and Metabolism. Front. Nutr. 2018, 5, 25. [Google Scholar] [CrossRef]
- Sun, Y.; Duan, X.; Wang, F.; Tan, H.; Hu, J.; Bai, W.; Wang, X.; Wang, B.; Hu, J. Inhibitory effects of flavonoids on glucose transporter 1 (GLUT1): From library screening to biological evaluation to structure-activity relationship. Toxicology 2023, 488, 153475. [Google Scholar] [CrossRef] [PubMed]
- Du, G.J.; Song, Z.H.; Lin, H.H.; Han, X.F.; Zhang, S.; Yang, Y.-M. Luteolin as a glycolysis inhibitor offers superior efficacy and lesser toxicity of doxorubicin in breast cancer cells. Biochem. Biophys. Res. Commun. 2008, 372, 497–502. [Google Scholar] [CrossRef] [PubMed]
- Chiaradonna, F.; Ricciardiello, F.; Palorini, R. The nutrient-sensing hexosamine biosynthetic pathway as the hub of cancer metabolic rewiring. Cells 2018, 7, 53. [Google Scholar] [CrossRef] [PubMed]
- Lunetti, P.; Di Giacomo, M.; Vergara, D.; De Domenico, S.; Maffia, M.; Zara, V.; Capobianco, L.; Ferramosca, A. Metabolic reprogramming in breast cancer results in distinct mitochondrial bioenergetics between luminal and basal subtypes. FEBS J. 2019, 286, 688–709. [Google Scholar] [CrossRef]
- Zare, M.E. The rate of aerobic glycolysis is a pivotal regulator of tumor progression. J. Diabetes Metab. Disord. 2021, 1, 523–531. [Google Scholar] [CrossRef]
- Dias, A.S.; Almeida, C.R.; Helguero, L.A. Metabolic Reprogramming of Breast Tumor-Educated Macrophages Revealed by NMR Metabolomics. Cancers 2023, 15, 1211. [Google Scholar] [CrossRef]
- Jaroszewski, J.; Kaplan, O.; Cohen, J. Action of gossypol and rhodamine 123 on wild type and multidrug- resistant MCF-7 human breast cancer cells: 31P nuclear magnetic resonance and toxicity studies. Cancer Res. 1990, 50, 170. [Google Scholar]
- Azevedo, C.; Correia-Branco, A.; Araújo, J.R.; Guimaraes, J.T.; Keating, E.; Martel, F. The Chemopreventive Effect of the Dietary Compound Kaempferol on the MCF-7 Human Breast Cancer Cell Line Is Dependent on Inhibition of Glucose Cellular Uptake The Chemopreventive Effect of the Dietary Compound Kaempferol on the MCF-7 Human Breast Cancer C. Nutr. Cancer 2015, 67, 37–41. [Google Scholar] [CrossRef]
- Liemburg-Apers, D.C.; Willems, P.H.G.M.; Koopman, W.J.H.; Grefte, S. Interactions between mitochondrial reactive oxygen species and cellular glucose metabolism. Arch. Toxicol. 2015, 89, 1209–1226. [Google Scholar] [CrossRef]
- Stevens, J.F.; Revel, J.S. Mitochondria-Centric Review of Polyphenol. Antioxid. Redox Signal. 2018, 29, 1589–1611. [Google Scholar] [CrossRef]
- Saunier, E.; Antonio, S.; Regazzetti, A.; Auzeil, N.; Laprévote, O.; Shay, J.W.; Coumoul, X.; Barouki, R.; Benelli, C.; Huc, L.; et al. Resveratrol reverses the Warburg effect by targeting the pyruvate dehydrogenase complex in colon cancer cells. Sci. Rep. 2017, 7, 6945. [Google Scholar] [CrossRef] [PubMed]
- Blanquer-rosselló, M.M.; Hernández-lópez, R.; Roca, P.; Oliver, J.; Valle, A. Biochimica et Biophysica Acta Resveratrol induces mitochondrial respiration and apoptosis in SW620 colon cancer cells. Biochim. Biophys. Acta 2017, 1861, 431–440. [Google Scholar] [CrossRef] [PubMed]
- Guerra, Â.R.; Soares, B.I.G.; Freire, C.S.R.; Silvestre, A.J.D.; Duarte, M.F.; Duarte, I.F. Metabolic Effects of a Eucalyptus Bark Lipophilic Extract on Triple Negative Breast Cancer and Nontumor Breast Epithelial Cells. J. Proteome Res. 2021, 20, 565–575. [Google Scholar] [CrossRef] [PubMed]
- Leo, M.; Muccillo, L.; Pranzini, E.; Barisciano, G.; Parri, M.; Lopatriello, G.; Carlomagno, M.; Santi, A.; Taddei, M.L.; Sabatino, L. Transcriptomic Analysis of Colorectal Cancer Cells Treated with Oil Production Waste Products (OPWPs) Reveals Enrichment of Pathways of Mitochondrial Functionality. Cells 2022, 24, 3992. [Google Scholar] [CrossRef]
- Liu, X.; Cooper, D.E.; Cluntun, A.A.; Warmoes, M.O.; Zhao, S.; Reid, M.A.; Liu, J.; Lund, P.J.; Lopes, M.; Garcia, B.A.; et al. Acetate Production from Glucose and Coupling to Mitochondrial Metabolism in Mammals Article Acetate Production from Glucose and Coupling to Mitochondrial Metabolism in Mammals. Cell 2018, 175, 502–513. [Google Scholar] [CrossRef]
- Meiser, J.; Tumanov, S.; Maddocks, O.; Labuschagne, C.F.; Athineos, D.; Van Den Broek, N.; Mackay, G.M.; Gottlieb, E.; Blyth, K.; Vousden, K. Serine one-carbon catabolism with formate overflow. Health Med. 2016, 2, e1601273. [Google Scholar] [CrossRef] [PubMed]
- Sanderson, S.M.; Gao, X.; Dai, Z.; Locasale, J.W. Methionine metabolism in health and cancer: A nexus of diet and precision medicine. Nat. Rev. Cancer 2020, 19, 625–637. [Google Scholar] [CrossRef]
- Beatty, A.; Fink, L.S.; Singh, T.; Strigun, A.; Peter, E.; Ferrer, C.M.; Nicolas, E.; Cai, K.Q.; Moran, T.P.; Reginato, M.J.; et al. Metabolite profiling reveals the glutathione biosynthetic pathway as a therapeutic target in triple negative breast cancer. Mol. Cancer Ther. 2018, 17, 264–275. [Google Scholar] [CrossRef]
- Zou, X.; Feng, Z.; Li, Y.; Wang, Y.; Wertz, K.; Weber, P.; Fu, Y.; Liu, J. Stimulation of GSH synthesis to prevent oxidative stress-induced apoptosis by hydroxytyrosol in human retinal pigment epithelial cells: Activation of Nrf2 and JNK-p62/SQSTM1 pathways. J. Nutr. Biochem. 2012, 23, 994–1006. [Google Scholar] [CrossRef]
- Kouka, P.; Priftis, A.; Stagos, D.; Angelis, A.; Stathopoulos, P.; Xinos, N.; Skaltsounis, A.L.; Mamoulakis, C.; Tsatsakis, A.M.; Spandidos, D.A.; et al. Assessment of the antioxidant activity of an olive oil total polyphenolic fraction and hydroxytyrosol from a Greek Olea europea variety in endothelial cells and myoblasts. Int. J. Mol. Med. 2017, 40, 703–712. [Google Scholar] [CrossRef]
- Kang, K.A.; Piao, M.J.; Ryu, Y.S.; Hyun, Y.J.; Park, J.E.; Shilnikova, K.; Zhen, A.X.; Kang, H.K.; Koh, Y.S.; Jeong, Y.J.; et al. Luteolin induces apoptotic cell death via antioxidant activity in human colon cancer cells. Int. J. Oncol. 2017, 51, 1169–1178. [Google Scholar] [CrossRef] [PubMed]
- Slika, H.; Mansour, H.; Wehbe, N.; Nasser, S.A.; Iratni, R.; Nasrallah, G.; Shaito, A.; Ghaddar, T.; Kobeissy, F.; Eid, A.H. Therapeutic potential of flavonoids in cancer: ROS-mediated mechanisms. Biomed. Pharmacother. 2022, 146, 112442. [Google Scholar] [CrossRef]
- Jarc, E.; Petan, T. Lipid Droplets and the Management of Cellular Stress. Yale J. Biol. Med. 2019, 92, 435–452. [Google Scholar] [PubMed]
- Twentyman, P.; Luscombe, M. A study of some variables in a tetrazolium dye (MTT) based assay for cell growth and chemosensitivity. Br. J. Cancer 1987, 56, 279–285. [Google Scholar] [CrossRef] [PubMed]
- Wishart, D.S.; Feunang, Y.D.; Marcu, A.; Guo, A.C.; Liang, K.; Vázquez-Fresno, R.; Sajed, T.; Johnson, D.; Li, C.; Karu, N.; et al. HMDB 4.0: The human metabolome database for 2018. Nucleic Acids Res. 2018, 46, D608–D617. [Google Scholar] [CrossRef]


Disclaimer/Publisher’s Note: The statements, opinions and data contained in all publications are solely those of the individual author(s) and contributor(s) and not of MDPI and/or the editor(s). MDPI and/or the editor(s) disclaim responsibility for any injury to people or property resulting from any ideas, methods, instructions or products referred to in the content. |
© 2023 by the authors. Licensee MDPI, Basel, Switzerland. This article is an open access article distributed under the terms and conditions of the Creative Commons Attribution (CC BY) license (https://creativecommons.org/licenses/by/4.0/).
Share and Cite
Garcia-Guasch, M.; Escrich, E.; Moral, R.; Duarte, I.F. Metabolomics Insights into the Differential Response of Breast Cancer Cells to the Phenolic Compounds Hydroxytyrosol and Luteolin. Molecules 2023, 28, 3886. https://doi.org/10.3390/molecules28093886
Garcia-Guasch M, Escrich E, Moral R, Duarte IF. Metabolomics Insights into the Differential Response of Breast Cancer Cells to the Phenolic Compounds Hydroxytyrosol and Luteolin. Molecules. 2023; 28(9):3886. https://doi.org/10.3390/molecules28093886
Chicago/Turabian StyleGarcia-Guasch, Maite, Eduard Escrich, Raquel Moral, and Iola F. Duarte. 2023. "Metabolomics Insights into the Differential Response of Breast Cancer Cells to the Phenolic Compounds Hydroxytyrosol and Luteolin" Molecules 28, no. 9: 3886. https://doi.org/10.3390/molecules28093886
APA StyleGarcia-Guasch, M., Escrich, E., Moral, R., & Duarte, I. F. (2023). Metabolomics Insights into the Differential Response of Breast Cancer Cells to the Phenolic Compounds Hydroxytyrosol and Luteolin. Molecules, 28(9), 3886. https://doi.org/10.3390/molecules28093886