Abstract
Four different nanoshapes of cerium dioxide have been prepared (polycrystals, rods, cubes, and octahedra) and have been decorated with different metals (Ru, Pd, Au, Pt, Cu, and Ni) by incipient wetness impregnation (IWI) and ball milling (BM) methods. After an initial analysis based on oxygen consumption from CO2 pulse chemisorption, Ni-like metal, and two forms of CeO2 cubes and rods were selected for further research. Catalysts were characterized using the Brunauer-Emmett-Teller formula (BET), X-ray spectroscopy (XRD), Raman spectroscopy, scanning electron microscopy (SEM), UV–visible spectrophotometry (UV-Vis), X-ray photoelectron spectroscopy (XPS), temperature programmed reduction (H2-TPR) and CO2 pulse chemisorption, and used to reduce of CO2 into CO (CO2 splitting). Adding metals to cerium dioxide enhanced the ability of CeO2 to release oxygen and concomitant reactivity toward the reduction of CO2. The effect of the metal precursor and concentration were evaluated. The highest CO2 splitting value was achieved for 2% Ni/CeO2-rods prepared by ball milling using Ni nitrate (412 µmol/gcat) and the H2 consumption (453.2 µmol/gcat) confirms the good redox ability of this catalyst.
1. Introduction
Currently, one idea for reducing the concentration of CO2 in the atmosphere is its conversion into products with a high positive value, i.e., chemicals or fuels [1,2]. There is a possibility of thermochemical conversion of CO2 using solar energy [3]. Research on thermochemical cycles dates to the 1960s and focused primarily on developing materials for nuclear reactors. The importance of thermochemical cycles in producing synthetic fuels has significantly increased with the approved worldwide climate protocols [4]. One of the most effective thermochemical cycles is the two-step redox oxide pair system, which has shown great potential for synthetic solar fuel generation [5]. The principle of operation is based on the transition between the higher valence oxidized and lower valence reduced form of the oxide of a metal having multiple oxidation states [6]. In the first stage, there is a thermal reduction of the metal oxide through the release of oxygen due to an endothermic reaction. The reduced metal oxide is oxidized in the second stage by taking oxygen from water and/or CO2. As a result, there is a return to the original oxidation state. This causes the production of H2 and CO in reactions called water splitting (WS) and carbon dioxide splitting (CDS), respectively [7]. Cerium oxide is considered an excellent candidate for use in thermochemical cycles due to its well-known redox properties [8,9] as well as the ability to form superficial oxygen vacancies during reduction, which are easily reoxidized [10]. This ability is described by Equations (1) and (2):
High temperature reduction:
low temperature oxidation with H2O:
low temperature oxidation with CO2:
Equation (1) describes the endothermic reduction step, which is intended to perform using solar energy. Equation (2) describes the exothermic oxidation where CeO2-Xred is re-oxidized by H2O to generate H2 (Equation (2a)) or by CO2 to generate CO (Equation (2b)).
Cerium oxide has the ability to store and release oxygen easily, which is directly related to the ability of cerium to change the oxidation state between Ce4+ and Ce3+ and the concomitant formation of oxygen vacancies. There are ideally three characteristic main crystallographic planes for cerium dioxide: {100} (cubes), {110} (rods), and {111} (octahedra). Figure 1 shows a scheme of the different planes of ceria. The fact is that the stability of these planes is of the order octahedra {111} > rods {110} > cubes {100} [11].
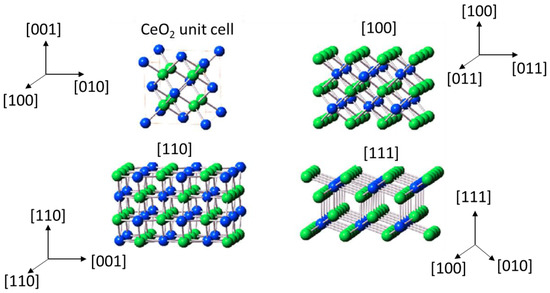
Figure 1.
Crystal models of cerium dioxide shapes [12].
In recent years, the study of various shapes of cerium oxide has gained importance. As previously mentioned, the structure of nanoctahedrons is the most stable of all. Then there is a cubic structure and finally the rods [13]. The shape plays an important role in lowering the reduction temperature. Thus, it is important to control the shape of the cerium oxide as well as to add metal nanoparticles for the sake of a combination of properties that can have the effect of lowering the reduction temperature to improve catalytic activity. Li et al. studied the improvement of catalytic efficiency using hydrothermal synthesis for CeO2 rods [14]. In turn, Yan et al. obtained nanomaterials based on cerium oxide, in which its group was able to demonstrate that by using the principle of coordination chemistry, it is possible to influence the morphology of metal oxides, as well as cerium oxide nanocrystals and to control parameters such as particle size, morphology, surface, texture [15,16]. This proves that a series of active cerium oxide-based catalysts with the desired properties and controlled oxygen vacancies can be obtained.
In 2006, Abanades and Flamanta [17] studied cerium dioxide for the thermochemical splitting of water. In 2010, Chueh et al. [18] used cerium dioxide as a material for solar thermochemical CO2 splitting. From that moment on, studies of cerium oxide for thermochemical cycles boosted [19].
The cycle for splitting CO2 by cerium dioxide has two stages. The first step is the solar thermal reduction of CeO2 in an inert atmosphere and low oxygen vapor pressure to obtain an oxygen-deficient non-stoichiometric cerium oxide. Then, a second step involves the non-solar oxidation of CeO2-x back to CeO2, which will take O2 directly from H2O/CO2. The process is visualized in Figure 2. Catalyst performance is determined by the temperature and the partial pressure of oxygen and also depends on the degree of non-stoichiometry. Cerium oxide, while maintaining its fluorite structure, is able to contain large amounts of non-stoichiometric oxygen [20].
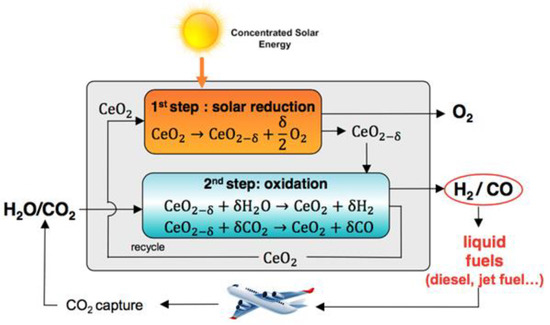
Figure 2.
The two-step thermochemical redox process for the splitting of CO2 using ceria [21].
Intense research efforts are required to reduce atmospheric CO2 levels entailing its conversion in high added value products, such as fuels or chemicals using novel catalysts [22]. CeO2-based catalysts doped with metals such as Fe, Pt, Au, Cr, Mo, and Ni were used in CO2 splitting. Nickel has been revealed as a good choice due to its low price, relative stability, and good properties for reactions involving CO2 [23,24]. However, one of the main drawbacks when using nickel is related to its sintering and formation of undesirable carbon deposits when working under harsh conditions [25]. Both sintering and coke resistance can be improved if nickel is combined with a lanthanoid oxide such as ceria [26]. Therefore, in this work, we focused on the study of the CO2 splitting process on nanoshaped CeO2 decorated with Pt, Au, Ni, Ru, Cu, and Pd. The influence of the catalyst preparation method (ball milling vs. incipient wetness impregnation) has also been studied.
2. Results and Discussion
2.1. Nanoshaped Ceria
Figure S1a shows the N2 adsorption isotherms of the cerium dioxide shapes prepared. The polycrystalline ceria presented an IV-type isotherm, characteristic of mesoporous materials, and an H3 hysteresis loop associated with materials with a regular porous structure and a narrow pore size distribution. The other shapes also showed a type IV isotherm and an H4 hysteresis loop. The type H3 loop is observed with aggregates of plate-like particles giving rise to slit-shaped pores. On the other side, a type H4 loop can be correlated to narrow slit-like pores. Solsona et al. [26] reported similar results. The respective pore size distribution of the samples is presented in Figure S1b and indicates that samples are mesoporous with pore diameter higher than 4 nm.
Table 1 summarizes the textural properties of all cerium oxide samples. Surface area (SBET) values are in the range of 6.6–63.7 m2 g−1 and total pore volume (Vtot) values of 0.06–0.28 cm3 g−1. The micropore volume of narrow pores (Vmco2) (0.3–1.4 nm) ranged from 0.001 to 0.013 cm3/g and micropore volume (VmN2) values were estimated based on N2 adsorption ranged from 0.02 to 0.15 cm3 g−1.

Table 1.
Textural properties of cerium oxide shapes.
UV-visible absorption spectra of CeO2 shapes are shown in Figure 3. All samples have a strong absorption below 400–450 nm. The broad absorption bands located at 250 and 340 nm originate from the charge transfer transition from O2−(2p) to Ce4+(4f) orbitals in CeO2 [27]. The intensity and position of the absorption bands are characteristic of the different shapes of CeO2. The band gap values obtained are 2.44, 3.04, 2.60, and 2.69 eV, respectively, for samples CeO2 polycrystalline, CeO2 rods, CeO2 cubes, and CeO2 octahedra (Table 2). Similar conclusions have been reported by Patsalas et al. [28] and Filtschew et al. [29].
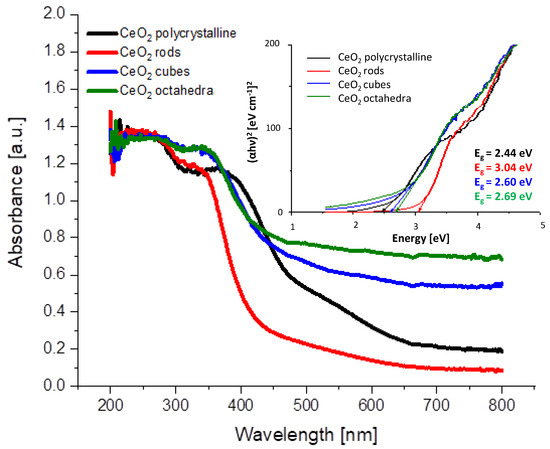
Figure 3.
UV-Vis absorption spectra of the prepared cerium dioxide shapes and optical band gap determination from Tauc plots.
Table 2.
Calculated values of particle size and band gap of cerium dioxide shapes.
Figure 4 shows the Raman spectra of the different shapes of cerium oxide. These spectra show an intense peak centered at approximately 465 cm−1. This peak is associated with the F2g Raman vibrational mode of the crystalline fluorite structure of ceria, which originated from the tensional vibrations of the oxygen atoms that surround the cerium atoms [30,31]. All cerium dioxide shapes spectra showed characteristic peaks of bulk ceria at 370, 465, 550, 595, 660, and 1170 cm−1 [27,32]. According to Filtschew et al. [28] the peaks in the range 370–660 cm−1 can be ascribed to second-order Raman peaks. In fact, the former results from a combination of A1g, Eg, and F2g scattering tensors, whereas the latter arises from mixing A1g and Eg scattering tensors [32]. The peak around 600 cm−1 corresponds to O2− vacancies and the replacement of cerium (IV) atoms by cerium (III) atoms [28,33]. Another small band around 800 cm−1 can be attributed to adsorbed peroxide species (O22−). The band located around 1170 cm−1 was observed in all the spectra of ceria oxide and can be correlated with the Raman mode characteristic of surface superoxide species (O22−). A small carbonate peak was observed at about 1060 cm−1. The particle size of the CeO2 samples was calculated from the Raman line broadening using Equation (3):
where (cm−1) is the full width at half maximum of the Raman active mode peak at 465 cm−1 and D is the particle size of the CeO2.
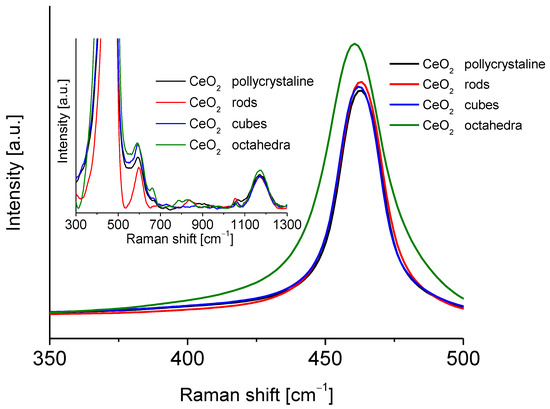
Figure 4.
Raman spectra of the cerium dioxide shapes.
The size of the different ceria nanoshapes particles is presented in Table 2.
Figure 5 shows the XRD patterns of the different shapes of cerium dioxide. These XRD patterns were indexed with the JCPDS card no. 81-0792. Eight diffraction peaks were observed at 2θ values, 28.42, 33.13, 47.37, 56.23, 59.04, 69.33, 76.60, and 79.02 corresponding to reflections from the (111), (200), (220), (311), (222), (400), (331), and (420) planes of the cubic crystalline phase of CeO2. A good crystallization of all shapes of the cerium dioxide was confirmed with sharp and strong peaks. No additional peaks were observed, indicating the high purity of the synthesized samples. Table 2 presents the average crystallite size for different shapes of cerium dioxide estimated by applying the Scherrer formula.
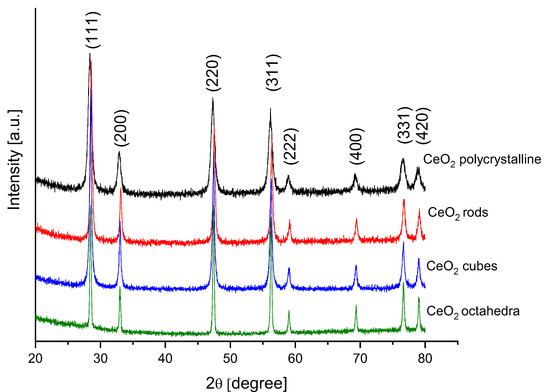
Figure 5.
XRD profiles of different cerium dioxide shapes.
Figure 6 shows representative SEM images of the different morphologies of cerium dioxide prepared. On measuring the nanoparticles using the Image J software (Version 1.53t), the average size of the particles obtained for each shape was presented in Table 2. The TEM study of all samples was investigated in previous work [33].
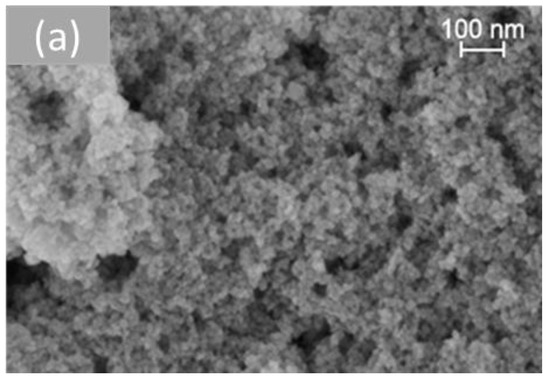
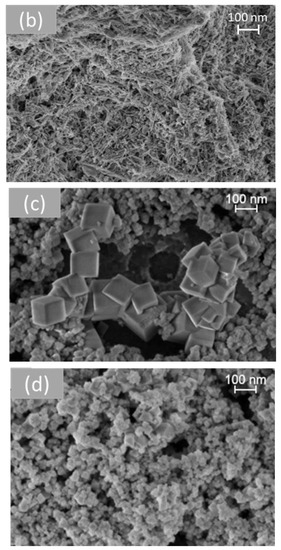
Figure 6.
SEM analysis of cerium dioxide shapes: (a) CeO2 polycrystalline, (b) CeO2 rods, (c) CeO2 cubes, and (d) CeO2 octahedra.
H2-TPR analysis was performed to understand the reducibility of the various shapes of cerium dioxide (Figure 7). The H2-TPR profiles of all samples exhibit a bimodal shape with a wide low temperature peak at 463–555 °C, which is attributed to the characteristic reduction of surface ceria, and a wide high temperature peak at 724−780 °C, which corresponds to the bulk ceria reduction [34,35]. The hydrogen consumption was calculated for each cerium dioxide shape and is presented in Table 3. After H2-TPR analysis, the samples were subjected to pulse CO2 oxidation to study the oxygen transfer from CO2 to reduced ceria through the replenishment of oxygen vacancies created during the reduction treatment with H2. Pulse CO2 sorption was applied until the cerium oxide was fully saturated. The results for the individual shapes of cerium dioxide are included in Table 3. In all cases, an excellent oxygen exchange was measured, with H2 consumption and CO2 consumption values virtually identical. The highest reduction/oxidation value was achieved for CeO2-rods, and it was about 170 µmol/gcat. The lowest value was achieved for CeO2-octahedra, with only 20 µmol/gcat.
Figure 7.
H2-TPR profiles of cerium dioxide nanoshapes.
Table 3.
The overall amount of hydrogen consumed in H2-TPR and oxygen consumed in CO2 pulse chemisorption.
2.2. Metal-Decorated Ceria
Generally, polycrystalline ceria nanoparticles usually consist of octahedra or truncated octahedron shapes, which mainly expose the most stable [1 1 1] facets in order to minimize surface energy, whereas nanorods are terminated by [1 1 0] and [1 0 0] planes and nanocubes expose [1 0 0] surfaces. The energy required to form oxygen vacancies on the [1 1 1] surface of CeO2 is higher than those on [1 1 0] and [1 0 0] surfaces, so there are more oxygen vacancies on [1 1 0] and [1 0 0] planes [36] After analyzing the reduction/oxidation ability of various ceria nanoshapes, CeO2-cubes, and CeO2-rods were selected for further studies due to the highest values of oxygen storage-release. Then, they were decorated with 2% wt. of a series of metals: Ru, Pd, Au, Pt, Cu, and Ni. The metal addition positively affects the catalytic performance of bare ceria [37]. As explained in the experimental section, two different methods were used to prepare the ceria samples decorated with metals, incipient wetness impregnation (IWI) and dry ball milling (BM). The redox properties of the obtained catalysts were checked by CO2 pulse chemisorption. The samples (50 mg) were first heated at 450 °C in H2 (50 mL min−1, 10° min−1), kept at 450 °C for 30 min, and cooled under Ar flow; then, at room temperature, CO2 pulses were injected. Figure 8 shows all of the results.
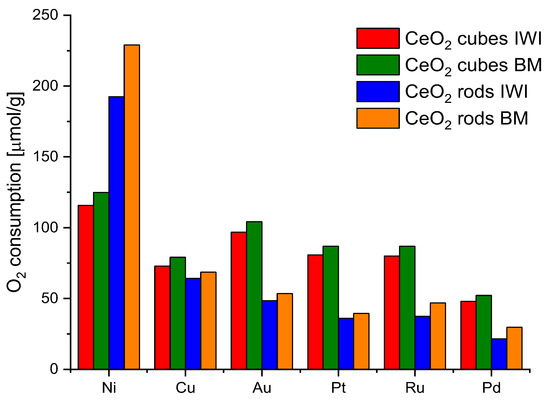
Figure 8.
Oxygen consumption from CO2 pulse chemisorption of CeO2 cubes and CeO2 rods decorated with different metals and prepared by different methods.
Nickel turned out to be the most efficient metal for both CeO2 cubes and CeO2 rods. In addition, the ball milling method for the preparation of the catalysts showed better results in all cases. Therefore, nickel was chosen as a metal and ball milling method to prepare the catalysts for further research. In parallel, an attempt to evaluate the effect of the nickel salt precursor on the redox properties of the catalysts was also investigated (Figure 9). The highest values were obtained for CeO2 rods using nickel nitrate. Based on these observations, it was decided to investigate the effect of the amount of metal on the redox capacity of the Ni/CeO2-rods catalysts (0.5–10 wt.% Ni).
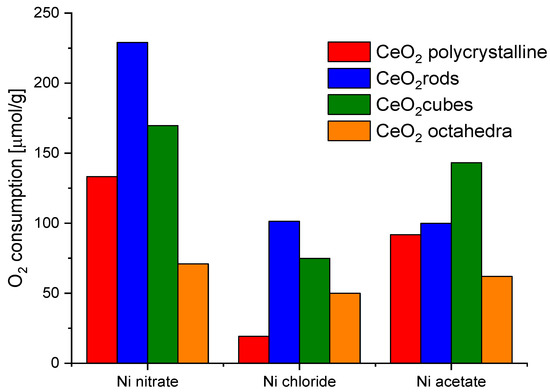
Figure 9.
Oxygen consumption from CO2 pulse chemisorption of catalysts based on different shapes of CeO2 and different nickel salt.
Figure S2 shows the results of the structural and textural characterization of the Ni-CeO2 rods samples performed by N2 adsorption-desorption isotherms. All isotherms of adsorption-desorption of N2 presented in Figure S2a showed a type IV isotherm with an H3-shaped hysteresis loop according to the IUPAC classification. This type is typical for powders containing mesopores [38]. Figure S2b presents the pore size distribution for all samples. Catalysts exhibited an average pore size of 5–32 nm. An increase of %Ni resulted in a narrowing of the range of pore distribution. The textural parameters of specific surface area (SBET), total pore volume (Vtot), micropore volume (VmN2), and pore diameter (Dp) for the Ni/CeO2-rods catalysts are listed in Table 4. The specific surface area and pore volume decreased as the nickel loading increased with respect to pure cerium dioxide. It is likely that pore blocking was caused by nickel accumulation. Conversely, the diameter of the pores was not affected notably by the nickel increase. Peymani et al. [39] and Damyanova et al. [40] reported similar trends. The metal dispersion is calculated using the following equations:
where VH2 is the volume of the adsorbed H2 (mL), SF is the stoichiometry factor, MW is the atomic weight of the Ni (g mol−1), and WNi is the weight of supported Ni on the sample (g). According to XRF analysis, the Ni loadings reached values close to the nominal ones (Table 4).
Table 4.
Textural characteristics of Ni-CeO2 rods samples and XRF analysis.
The XRD patterns of the catalysts are presented in Figure 10. In addition to the characteristic peaks of the fluorite structure of CeO2, peaks at 37°, 44.1°, and 62.6° correspond to NiO (111, 200, and 220 planes, respectively) according to JCPDS file no. 78-0643 [41].
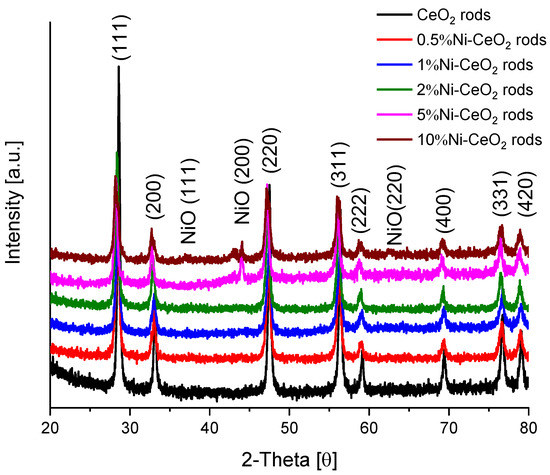
Figure 10.
XRD patterns for Ni-CeO2-rods catalysts.
To obtain additional structural information on prepared catalysts, Raman spectroscopy was used, and the corresponding spectra are presented in Figure 11. All the spectra present the main band at 454–463 cm−1. This band corresponds to the F2g mode of the fluorite structure of cerium dioxide. The position of the peak shifts from 463 cm−1 to 454 cm−1 for the catalysts modified with nickel. The reason for this shift can depend on various factors such as oxygen vacancies, phonon confinement, or crystal defects [42,43]. In any case, the peak shift can be related to a strong interaction between the CeO2 surface and Ni [42,44]. The peaks observed at 604 and 1177 cm−1 correspond to the defect-induced mode (D) and second-order longitudinal optical mode (2LO) bands of ceria, respectively, which become more intense as the amount of Ni increases, pointing out to a strong interaction between CeO2 and Ni.
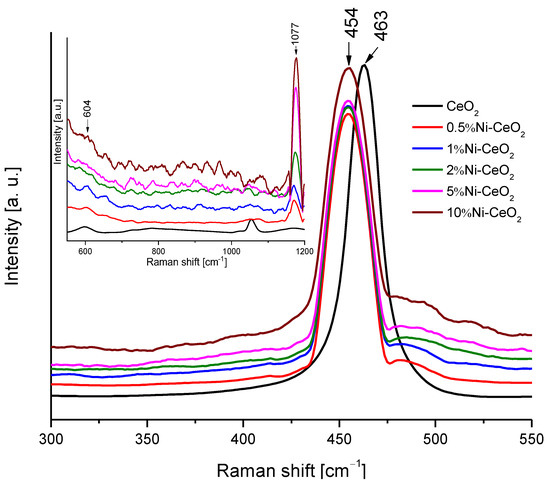
Figure 11.
Raman spectra of the Ni-CeO2 rods catalysts.
Figure S3 shows SEM images showing the morphologies of the prepared catalysts. It can be seen that the structure has not changed with the ball milling method. Rods shape of cerium oxide has been retained for all prepared catalysts.
Figure 12 shows XPS spectra of 2%Ni-CeO2-rods. From the spectra, the atomic concentration on the surface is Ce 91.9% and Ni 8.1%, in accordance with the good dispersion of Ni nanoparticles on ceria (Table 4).
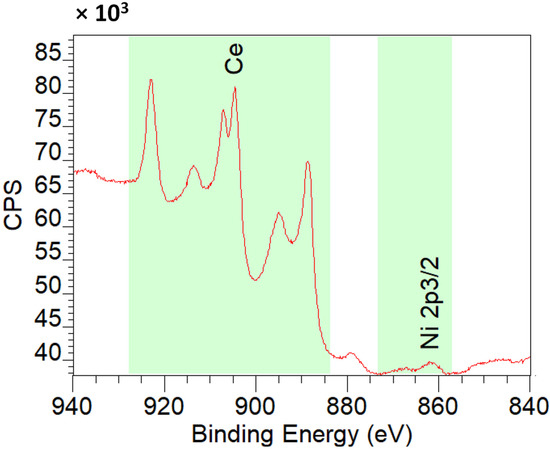
Figure 12.
XPS spectra of 2%Ni-CeO2-rods.
Figure 13 shows the H2-TPR profiles of the catalysts. It can be seen that the reduction of all catalysts took place in the temperature range of 150–700 °C. As can be seen, three types of reduction peaks (assigned by the symbols α, β, and γ) are observed. The α peak at 150–220 °C was assigned to the surface oxygen located in the defects of the CeO2 surface. The peak (β) at 250–280 °C can be attributed mainly to the reduction of NiO weakly interacting with CeO2 as a support in the catalysts. The γ peak at 310–350 °C is ascribed to the reduction of NiO strongly interacting with CeO2 support [45]. The strong interaction of NiO with CeO2 leads to a progressive shift of the γ peak to a higher reduction temperature. Moreover, the area of the reduction peaks in the TPR profile of the catalysts with a higher percentage of nickel was higher than the area detected for the catalysts with a lower nickel content, which was due to the higher amount of hydrogen needed to reduce the catalyst with a higher Ni content, as expected [46].
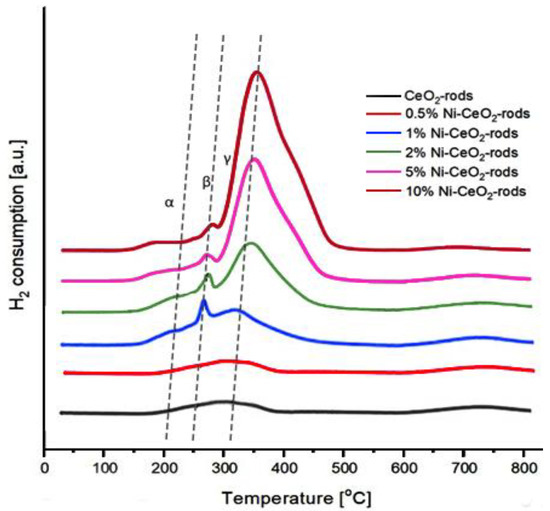
Figure 13.
H2-TPR profiles of Ni-CeO2 rods catalysts.
The quantification of the hydrogen consumption for the Ni-CeO2 rod samples is compiled in Table 5, along with the CO2 consumption recorded after the H2-TPR experiments. In all cases, a good correlation between the oxygen transfer and H2 consumption was measured for catalysts with Ni content up to 2%. The best reduction ability was measured for 10%Ni-CeO2 rods and it was about 811.6 µmol/gcat. The highest reoxidation value was achieved for 2%Ni-CeO2-rods, and it was about 412 µmol/gcat. As the metal content increases, the reduction capability of the catalyst increases. On the other hand, the ability of reoxidation with the participation of CO2 decreases at high Ni loadings, which is a direct consequence of the increasing size of the Ni nanoparticles as the amount of nickel increases. In other words, the oxygen vacancies created at the contact points between Ni and the ceria support is a balance between the loading of Ni and the perimeter available, which is directly related to the size of the Ni particles. How Sarli et al. [37] confirm the strong interaction between metal and CeO2 leads to a strong modification of redox properties of ceria, resulting in very active metal-promoted catalysts even at low loads. Table 6 shows the oxygen storage capacity (OSC) for the different catalysts compared with those obtained in this work.
Table 5.
The overall amount of hydrogen consumed in H2-TPR and oxygen consumed in CO2 pulse chemisorption.
Table 6.
Oxygen storage capacity (OSC) in μmol CO2/g sample for the different catalysts.
3. Preparation and Methods
3.1. Preparation of Catalysts
To prepare polycrystalline cerium dioxide (no preferred crystal planes exposed), a solution of 2.0 g of NaOH dissolved in 245 mL of distilled water was prepared using a magnetic stirrer at 300 rpm. A beaker was prepared separately in which 6.07 g of Ce(NO3)3·6H2O were dissolved in 35 mL of distilled water with a magnetic stirrer. Using an ultrasonic atomizer, the cerium salt was added to the aqueous solution of NaOH. The final molarity of the solution was 0.2 M. The resulting solution was then aged for 30 min and introduced in a hydrothermal reactor at 150 °C for 24 h to produce polycrystalline cerium oxide. After cooling, the next step was centrifuging the solution, treating it with ultrasound, and purifying it with distilled water (three times) and ethanol (twice) until the excess NaOH was eliminated from the material. Each centrifugation step was performed at 25 °C, 6000 rpm, and 20 min to achieve complete separation. Then the material was dried at a temperature of approx. 60 °C and crushed in an agate mortar to obtain a fine powder. The last step was calcination at 450 °C for 4 h with a 2° min−1 ramp rate.
The cerium dioxide rods and cubes were prepared using the same method but at different concentrations of NaOH in the precursor solution and the temperature of the hydrothermal method. The method of preparing the rods assumes an OH− concentration of 7.875 M. A solution of 6.08 g Ce(NO3)3·6H2O in 35 mL of distilled water was sprayed into a solution of 88.133 g of NaOH in 245 mL of distilled water. Crystallization of the precursor solution in the hydrothermal reactor was carried out at 100 °C for 24 to produce rods. The cubes were prepared with an OH− concentration of the precursor solution of 6 M. A solution of 6.08 g Ce(NO3)3·6H2O in 35 mL distilled water was sprayed into a solution of 67.23 g NaOH in 245 mL distilled water. The precursor solution was treated in a hydrothermal reactor at 180 °C for 24 h.
To obtain cerium dioxide in octahedra shape, 3.26 g of Ce (NO3)3·6H2O were dissolved in 50 mL distilled water using a magnetic stirrer. Then, this solution was spread using an atomizer to the solution of 4.95 mg Na3PO4·H2O with 250 mL distilled water and mixed with a magnetic stirrer for one hour. The next step was to put the solution in the autoclave and heat it at 180 °C for 10 h. After cooling, treatment was the same as for the other shapes.
The catalysts doped with metals were prepared in two different ways, the first of which was the traditionally and commonly used method of incipient wetness impregnation (IWI), which consisted of weighing the appropriate amount of the metal precursor and dissolving it in ethanol, sonicating, and then using an automatic pipette to apply the solution on cerium oxide by spotting. The second method used was ball milling, where a powder mixture placed in the ball mill is subjected to high-energy collision from the balls (BM). For the ball-milled samples, the metal precursor was mixed directly with cerium dioxide in a zirconium oxide vessel (0.5 g of sample and 1 zirconium oxide ball of 15 mm diameter) using a Fritsch Pulverisette 23 (Idar-Oberstein, Germany) mini-mill apparatus. Therefore, after the characterization of different cerium dioxide shapes, the influence of Ru, Pd, Au, Pt, Cu, and Ni (Ru using RuCl2, Pd using PdCl2, Au using Au(O2CCH3)3, Pt using PtCl2, Cu using CuCl2, and Ni using NiCl2) on the ceria properties was investigated. Catalysts with 2% wt. of metal were prepared by the IWI and BM method. Then, catalysts were based on various shapes of CeO2 and various nickel precursors: nickel nitrate (Ni(NO3)2), nickel chloride (NiCl2), and nickel acetate (Ni(CH3CO2)·4H2O) were prepared. After analysis, nickel nitrate was selected for further studies, and catalysts with different wt.% of Ni were prepared using the BM method (15 Hz for 3 min) using CeO2 rods at various metal weight concentrations of 0.5, 1, 2, 5, and 10%, respectively. Finally, all prepared samples were calcined at 350 °C with a ramp of 2 °C min−1 in the air for 4 h. The prepared Ni/CeO2 catalysts were named: 0.5%Ni-CeO2 rods, 1%Ni-CeO2 rods, 2%Ni-CeO2 rods, 5%Ni-CeO2 rods, and 10%Ni-CeO2 rods according to the nominal wt.% concentration of Ni.
3.2. Materials Characterizations
The textural properties of the obtained catalysts were characterized by nitrogen adsorption at −196 °C and CO2 adsorption at 0 °C. Pore size distribution (PSD) was obtained from the nitrogen isotherm using nonlinear density functional theory (NLDFT) -assuming slit pores. The micropore volume (VmCO2), up to 1.47 nm, was analyzed via CO2 sorption and was also determined by the DFT method. A Quadrasorb Evo instrument (Anton Paar, St. Albans, UK) was used to determine surface area and pore size. The entire study was automated and the results were collected using the QuadraWin program (Versions: 7.1). Prior to the measurements, the catalyst samples were heated at 200 °C for 16 h, with a temperature increment of 1 °C min−1, under reduced pressure to remove impurities. Using N2 adsorption isotherms, the parameters characterizing the texture of the obtained materials were determined: specific surface area, total pore volume, and micropore volume in the range of 1.4–2 nm. SBET -specific surface area was determined using the Brunauer, Emmett, and Teller equation in the range of partial pressure p/p0 = 0.05–0.2. All catalysts were characterized by Raman spectroscopy using a commercial Renishaw inVia Qontor confocal Raman microscope (Gloucestershire, UK). The Raman setup consists of a laser at λexc = 532 nm with a nominal 100 mW output power. The power of the laser of 1 mW cm−2 with 36 accumulations was kept for all samples. To analyze the phase composition of the catalysts, a Bruker D8 Advance diffractometer (Munich, Germany) equipped with a Cu X-ray tube using CuKα radiation (λ = 1.5418 Å, 40 mA, 40 kV) was used. The diffractograms were collected in 2θ range of 20–80° (scan speed = 1 s, step 0.02°). The X Pert HighScore software (version 5.1) was used for the analysis and the Scherrer equation was used for the crystallite size calculation. The ultraviolet-visible (UV–vis) spectroscopy was carried out on a Shimadzu UV3600 UV-vis/NIR apparatus (Oberchoken, Germany). BaSO4 was used as a reference standard. The spectra were recorded at room temperature in the air within the range of 300–800 nm. The acquired diffuse reflectance spectra were converted to absorbance through the standard Kubelka-Munk function. The band gap energies (Eg) of the prepared samples were estimated from the UV-vis spectra by the Tauc method [56,57]. Scanning electron microscopy (Oberchoken, Germany) is used primarily to study the morphology and dimensions of the catalyst particles [58]. All the prepared catalysts were analyzed with a Neon40 Crossbeam™ instrument from Carl Zeiss (Hamburg, Germany). X-ray fluorescence energy dispersion spectrophotometry (EDXRF) was performed on an Epsilon 3 PANalytical B.V. instrument (Almelo, the Netherlands) to determine the content of other elements in the catalysts. To study the reducibility of the catalysts, temperature-programmed reduction (TPR) was used. The TPR method yields quantitative information on the reducibility of the sample and information about the nature of the reducible sites. The TPR experiments were carried out with a Chemstar-TPX instrument equipped (Berlin, Germany) with a thermal conductivity detector (TCD). The samples (50 ± 0.01mg) were first heated from room temperature to 450 °C (10° min−1) in a flow of Ar (50 mL min−1) and kept at 450 °C for 10 min, then cooled to 50 °C under the same Ar flow rate. The TPR has been carried out from 35 °C to 800 °C (10° min−1) under a flow rate of 10 vol. % H2 in Ar (with a total flow rate of 50 mL min−1) and then the temperature was maintained at 800 °C for 30 min. After H2-TPR analysis, the samples were subjected to pulse CO2 oxidation to study the oxygen transfer from CO2 to reduced ceria through the replenishment of oxygen vacancies created during the reduction treatment with H2. Pulse CO2 sorption under a flow rate of 10 vol. % CO2 in Ar at 25 °C was applied until the cerium oxide was fully saturated with oxygen.
4. Conclusions
In this work, four distinct shapes of cerium dioxide (polycrystalline, rods, cubes, and octahedra) were successfully prepared and characterized by N2 and CO2 adsorption/desorption, UV-VIS, SEM microscopy, Raman spectroscopy, XRD spectroscopy, H2- TPR and pulse CO2 adsorption. It was concluded that ceria rods exhibit the best CO2 splitting capacity. We investigated the effect of IWI and BM method preparation to decorate the ceria nanoshapes with Ru, Pd, Au, Pt, Cu, and Ni. It was found that the samples prepared by BM yielded better CO2 splitting results. BM synthesis offers a simple, scalable, and often more sustainable way to synthesize catalytic materials. The key advantages achieved in comparison with wet impregnation are obtaining preparations without the need for additives (e.g., solvents, matrices, or surfactants) and in many cases post-synthetic treatment. This avoids the generation of solvent and/or gaseous wastes and simplifies the entire synthesis protocol, ultimately, simplifying scale-up and, importantly, significantly shortening the catalyst preparation time. In addition, this synthesis strategy provides the materials with extraordinary properties, often impossible to obtain using classical methods. The best results were obtained for a nickel. Furthermore, the type of nickel salt used affected the properties of the resulting catalyst. In our case, the best results were achieved with nickel nitrate. Catalysts with different contents of Ni synthesized using the BM method were analyzed. It was found that the redox properties of surface oxygen vacancy concentration and CO2 splitting capacity varied with Ni concentration. 2% Ni-CeO2 rods catalyst exhibited the best CO2 splitting properties. Our results offer the possibility of using cheap materials prepared by a simple and easily scalable method for CO2 splitting. However, long-term and recyclability studies are necessary to have a precise evaluation of their application in practical applications.
Supplementary Materials
The following supporting information can be downloaded at: https://www.mdpi.com/article/10.3390/molecules28072926/s1, Figure S1. Adsorption-desorption isotherms of nitrogen for cerium dioxide shapes (a), and pore size distribution for cerium dioxide shapes (b); Figure S2. N2 adsorption-desorption isotherms (a) and pore size distribution (b); Figure S3. SEM pictures of the Ni-CeO2 rods catalysts: (a) 0.5%-Ni-CeO2 rods; (b) 1%-Ni-CeO2 rods; (c) 2%-Ni-CeO2 rods; (d) 5%-Ni-CeO2 rods; (e) 10%-Ni-CeO2 rods.
Author Contributions
J.S.: Conceptualization, Methodology, Validation, Formal analysis, Investigation, Resources, Writing—Original Draft, Writing—Review & Editing, Visualization, Project administration. J.L.: Writing—Review & Editing, Supervision. All authors have read and agreed to the published version of the manuscript.
Funding
This research received no external funding.
Institutional Review Board Statement
Not applicable.
Informed Consent Statement
Not applicable.
Data Availability Statement
All data related to this study are presented in this publication.
Acknowledgments
Jordi Llorca is a Serra Húnter Fellow and is grateful to ICREA Academia program and projects MICINN/FEDER PID2021-124572OB-C31 and GC 2017 SGR 128.
Conflicts of Interest
The authors declare no conflict of interest.
References
- Perathoner, S.; Centi, G. CO2 Recycling: A key strategy to introduce green energy in the chemical production chain. ChemSusChem 2014, 7, 1274–1282. [Google Scholar] [CrossRef] [PubMed]
- Barroso-Bogeat, A.; Blanco, G.; Pérez-Sagasti, J.J.; Escudero, C.; Pellegrin, E.; Herrera, F.C.; Pintado, J.M. Thermocatalytic CO2 Conversion over a Nickel-Loaded Ceria Nanostructured Catalyst: ANAP-XPS Study. Materials 2021, 14, 711. [Google Scholar] [CrossRef] [PubMed]
- Aresta, M.; Dibenedetto, A.A. Angelini, The changing paradigm in CO2utilization. J. CO2 Util. 2013, 3–4, 65–73. [Google Scholar] [CrossRef]
- Yadav, D.; Banerjee, R. A review of solar thermochemical processes. Renew. Sustain. Energy Rev. 2016, 54, 497–532. [Google Scholar] [CrossRef]
- Farooqui, A.; Bose, A.; Ferrero, D.; Llorca, J.; Santarelli, M. Simulation of two-step redox recycling of non-stoichiometric ceria with thermochemical dissociation of CO2/H2O in moving bed reactors -Part II: Techno-economic analysis and integration with 100 MW oxyfuel power plant with carbon capture. Chem. Eng. Sci. 2019, 226, 114873. [Google Scholar] [CrossRef]
- Agrafiotis, C.; Roeb, M.; Sattler, C. A review on solar thermal syngas production via redox pair-based water/carbon dioxide splitting thermochemical cycles. Renew. Sustain. Energy Rev. 2015, 42, 254–285. [Google Scholar] [CrossRef]
- Roeb, M.; Neises, M.; Monnerie, N.; Call, F.; Simon, H.; Sattler, C.; Schmcker, M.; Pitz-Paal, R. Materials-related aspects of thermochemical water and carbon dioxide splitting: A review. Materials 2012, 5, 2015–2054. [Google Scholar] [CrossRef]
- Pappacena, A.; Boaro, M.; Armelao, L.; Llorca, J.; Trovarelli, A. Water splitting reaction on Ce0.15Zr0.85O2 driven by surface heterogeneity. Catal. Sci. Technol. 2016, 6, 399–403. [Google Scholar] [CrossRef]
- Farooqui, A.E.; Pica, A.M.; Marocco, P.; Ferrero, D.; Lanzini, A.; Fiorilli, S.; Llorca, J.; Santarelli, M. Assessment of kinetic model for ceria oxidation for chemical-looping CO2 dissociation. Chem. Eng. J. 2018, 346, 171–181. [Google Scholar] [CrossRef]
- Gunawan, C.; Lord, M.S.; Lovell, E.; Wong, R.J.; Jung, M.S.; Oscar, D.; Mann, R.; Amal, R. Oxygen-Vacancy Engineering of Cerium-Oxide Nanoparticles for Antioxidant Activity. ACS Omega 2019, 4, 9473–9479. [Google Scholar] [CrossRef]
- Trovarelli, A.; Llorca, J. Ceria Catalysts at Nanoscale: How Do Crystal Shapes Shape Catalysis? ACS Catal. 2017, 7, 4716–4735. [Google Scholar] [CrossRef]
- Li, Y.; Shen, W. Morphology-dependent nanocatalysts: Rod-shaped oxides. Chem. Soc. Rev. 2014, 43, 1543–1574. [Google Scholar] [CrossRef]
- Sun, X.; Gong, C.; Lv, G.; Bin, F.; Song, C. Effect of Ce/Zr molar ratio on the performance of Cu–Cex–Zr1−x/TiO2 catalyst for selective catalytic reduction of NOx with NH3 in diesel exhaust. Mater. Res. Bull. 2014, 60, 341–347. [Google Scholar] [CrossRef]
- Zhou, K.; Wang, X.; Sun, X.; Peng, Q.; Li, Y. Enhanced catalytic activity of ceria nanorods from well-defined reactive crystal planes. J. Catal. 2005, 229, 206–212. [Google Scholar] [CrossRef]
- Rangel, R.; Bartolo-Pérez, P.; Martínez, E.; Trejo-Cruz, X.A.; Díaz, G.; Galván, D.H. Catalytic activity and X-ray photoelectron spectroscopy performance of Bi2MoxW(1−x)O6 solid-solutions. Catal. Sci. Technol. 2012, 2, 847–852. [Google Scholar] [CrossRef]
- Jung, J.C.; Lee, H.; Kim, H.; Chung, Y.M.; Kim, T.J.; Lee, S.J.; Oh, S.H.; Kim, Y.S.; Song, I.K. Effect of Oxygen Capacity and Oxygen Mobility of Pure Bismuth Molybdate and Multicomponent Bismuth Molybdate on their Catalytic Performance in the Oxidative Dehydrogenation of n-Butene to 1,3-Butadiene. Catal. Lett. 2008, 124, 262–267. [Google Scholar] [CrossRef]
- Abanades, S.; Flamant, G. Thermochemical hydrogen production from a two-step solar-driven water-splitting cycle based on cerium oxides. Sol. Energy 2006, 80, 1611–1623. [Google Scholar] [CrossRef]
- Chueh, W.C.; Haile, S.M. A thermochemical study of ceria: Exploiting an old material for new modes of energy conversion and CO2 mitigation. Philos. Trans. R. Soc. A 2010, 368, 3269–3294. [Google Scholar] [CrossRef]
- Bhosale, R.R.; Takalkar, G.; Sutar, P.; Kumar, A.; AlMomani, F.; Khraisheh, M. A decade of ceria based solar thermochemical H2O/CO2 splitting cycle. Int. J. Hydrogen Energy 2019, 44, 34–60. [Google Scholar] [CrossRef]
- Ioannou, M.E.; Pouroutzidou, G.K.; Chatzimentor, I.; Tsamesidis, I.; Florini, N.; Tsiaoussis, I.; Lymperaki, E.; Komninou, P.; Kontonasaki, E. Synthesis and Characterization of Cerium Oxide Nanoparticles: Effect of Cerium Precursor to Gelatin Ratio. Appl. Sci. 2023, 13, 2676. [Google Scholar] [CrossRef]
- Pullar, R.C.; Npvias, R.M.; Caetano, A.P.F.; Barreiros, M.A.; Abanades, S.; Costa Oliveira, F.A. A Review of Solar Thermochemical CO2 splitting using ceria-Based Ceramics With Designed Morphologies and Microstructures. Front. Chem. 2019, 7, 601. [Google Scholar] [CrossRef] [PubMed]
- Winter, L.R.; Chen, R.; Chen, X.; Chang, K.; Liu, Z.; Senanayake, S.D.; Ebrahim, A.M.; Chen, J.G. Elucidating the roles of metallic Ni and oxygen vacancies in CO2 hydrogenation over Ni/CeO2 using isotope exchange and in situ measurements. Appl. Catal. B Environ. 2019, 245, 360–366. [Google Scholar] [CrossRef]
- Du, G.; Lim, S.; Yang, Y.; Wang, C.; Pfefferle, L.; Haller, G.L. Methanation of carbon dioxide on Ni-incorporated MCM-41 catalysts: The influence of catalyst pretreatment and study of steady-state reaction. J. Catal. 2007, 249, 370–379. [Google Scholar] [CrossRef]
- Yamasaki, M.; Habazaki, H.; Asami, K.; Izumiya, K.; Hashimoto, K. Effect of tetragonal ZrO2 on the catalytic activity of Ni/ZrO2 catalyst prepared from amorphous Ni–Zr alloys. Catal. Commun. 2006, 7, 24–28. [Google Scholar] [CrossRef]
- Rahmani, S.; Rezaei, M.; Meshkani, F. Preparation of promoted nickel catalysts supported on mesoporous nanocrystalline gamma alumina for carbon dioxide methanation reaction. J. Ind. Eng. Chem. 2014, 20, 4176–4182. [Google Scholar] [CrossRef]
- Solsona, B.; Sanchis, R.; Dejoz, A.M.; García, T.; Ruiz-Rodríguez, L.; López Nieto, J.M.; Cecilia, J.A.; Rodríguez-Castellón, E. Total Oxidation of Propane Using CeO2 and CuO-CeO2 Catalysts Prepared Using Templates of Different Nature. Catalysts 2017, 7, 96. [Google Scholar] [CrossRef]
- Rao, G.R.; Sahu, H.R. XRD and UV-Vis diffuse reflectance analysis of CeO2–ZrO2 solid solutions synthesized by combustion method. J. Chem. Sci. 2001, 113, 651–658. [Google Scholar]
- Patsalas, P.; Logothetidis, S.; Sygellou, L.; Kennou, S. Structure Dependent Electronic Properties of Nanocrystalline Cerium Oxide Films. Phys. Rev. B 2003, 68, 035104. [Google Scholar] [CrossRef]
- Filtschew, A.; Hofmann, K.; Hess, C. Ceria and Its Defect Structure: New Insights from a Combined Spectroscopic Approach. J. Phys. Chem. C 2016, 120, 6694–6703. [Google Scholar] [CrossRef]
- Kainbayev, N.; Sriubas, M.; Virbukas, D.; Rutkuniene, Z.; Bockute, K.; Bolegenova, S.; Laukaitis, G. Raman Study of Nanocrystalline-Doped Ceria Oxide Thin Films. Coatings 2020, 10, 432. [Google Scholar] [CrossRef]
- Loridant, S. Raman spectroscopy as a powerful tool to characterize ceria-based catalysts. Catal. Today 2021, 373, 98–111. [Google Scholar] [CrossRef]
- Garcia, X.; Soler, L.; Casanovas, A.; Escudero, C.; Llorca, J. X-ray photoelectron and Raman spectroscopy of nanostructured ceria in soot oxidation under operando conditions. Carbon 2021, 178, 164–180. [Google Scholar] [CrossRef]
- Taniguchi, T.; Watanabe, T.; Sugiyama, N.; Subramani, A.K.; Wagata, H.; Matsushita, N.; Yoshimura, M. Identifying Defects in Ceria-Based Nanocrystals by UV Resonance Raman Spectroscopy. J. Phys. Chem. C 2009, 113, 19789–19793. [Google Scholar] [CrossRef]
- Piumetti, M.; Bensaid, S.; Russo, N.; Fino, D. Nanostructured ceria-based catalysts for soot combustion: Investigations on the surface sensitivity. Appl. Catal. B 2015, 165, 742–751. [Google Scholar] [CrossRef]
- Miceli, P.; Bensaid, S.; Russo, N.; Fino, D. CeO2-based catalysts with engineered morphologies for soot oxidation to enhance soot-catalyst contact. Nanoscale Res. Lett. 2014, 9, 254. [Google Scholar] [CrossRef]
- Soler, L.; Casanovas, A.; Urrich, A.; Angurell, I.; Llorca, J. CO oxidation and COPrOx over preformed Au nanoparticles supported over nanoshaped CeO2. Appl. Catal. B Environ. 2016, 197, 47–55. [Google Scholar] [CrossRef]
- Sarli, V.; Landi, G.; Benedetto, A.; Lisi, L. Synergy Between Ceria and Metals (Ag or Cu) in Catalytic Diesel Particulate Filters: Efect of the Metal Content and of the Preparation Method on the Regeneration Performance. Top. Catal. 2021, 64, 256–269. [Google Scholar] [CrossRef]
- Leofanti, G.; Padovan, M.; Tozzola, G.; Venturelli, B. Surface area and pore texture of catalysts. Catal. Today 1998, 41, 207–219. [Google Scholar] [CrossRef]
- Peymani, M.; Alavi, S.M.; Arandiyan, H.; Rezaei, M. Rational Design of High Durface Area mesoporous Ni/CeO2 for Partial Oxidation of Propane. Catalysts 2018, 8, 388. [Google Scholar] [CrossRef]
- Damyanova, S.; Pawelec, B.; Palcheva, R.; Karakirova, Y.; Capel Schanez, M.C.; Tyuliev, G.; Gaigneaux, E.; Fierro, J.L.G. Strucutre and Surface properties of ceria- modified Ni-based catalysts for hydrogen production. Appl. Catal. B Environ. 2018, 5, 340–353. [Google Scholar] [CrossRef]
- Rakshit, S.; Ghosh, S.; Chall, S.; Mati, S.S.; Moulik, S.P.; Bhattacharya, S.C. Controlled synthesis of spin glass nickel oxide nanoparticles and evaluation of their potential antimicrobial: A cost effective and eco friendly approach. RSC Adv. 2013, 3, 19348. [Google Scholar] [CrossRef]
- Liu, X.; Han, L.; Liu, W.; Yang, Y. Synthesis of Co/Ni Unitary-or Binary-Doped CeO2 mesoporous Nanospheres and Their Catalytic Performance for CO Oxidation. Eur. J. Inorg. Chem. 2014, 28, 742–746. [Google Scholar] [CrossRef]
- Qiao, D.; Lu, G.; Guo, Y.; Wang, Y.; Guo, Y. Effect of water vapor on the CO and CH4 catalytic oxidation over CeO2-MOx (M=Cu, Mn, Fe, Co, and Ni) mixed oxide. J. Rare Earths 2010, 28, 742–746. [Google Scholar] [CrossRef]
- Guan, J.; Mou, F.; Sun, Z.; Shi, W. Preparation of hollow spheres with controllable interior structures by heterogeneous contraction. Chem. Commun. 2010, 46, 6605–6607. [Google Scholar] [CrossRef] [PubMed]
- Wang, L.; Liu, H.; Liu, Y.; Chen, Y.; Yang, S. Influence of preparation method on performance of Ni–CeO2 catalysts for reverse water-gas shift reaction. J. Rare Earths 2013, 31, 559–564. [Google Scholar] [CrossRef]
- Peymani, M.; Alavi, S.M.; Rezaei, M. Preparation of highly active and stable nanostructured Ni/CeO2 catalysts for syngas production by partial oxidation of methane. Int. J. Hydrogen Energy 2016, 41, 6316–6325. [Google Scholar] [CrossRef]
- Pastor-Pérez, L.; Ramirez Reina, T.; Ivanova, S.; Centeno, M.Á.; Odriozola, J.A.; Sepúlveda-Escribano, A. Ni-CeO2/C catalysts with enhanced OSC for the WGS reaction. Catalysts 2015, 5, 298–309. [Google Scholar] [CrossRef]
- Megías-Sayago, C.; Bonincontro, D.; Lolli, A.; Ivanova, S.; Albonetti, S.; Cavani, F.; Odriozola, J.A. 5-Hydroxymethyl-2-furfural oxidation over Au/CexZr1−xO2 catalysts. Front. Chem. 2020, 8, 461. [Google Scholar] [CrossRef]
- Gurbani, A.; Ayastuy, J.L.; González-Marcos, M.P.; Gutiérrez-Ortiz, M.A. CuO–CeO2 catalysts synthesized by various methods: Comparative study of redox properties. Int. J. Hydrogen Energy 2010, 35, 11582–11590. [Google Scholar] [CrossRef]
- Gurbani, A.; Ayastuy, J.L.; González-Marcos, M.P.; Herrero, J.E.; Guil, J.M.; Gutiérrez-Ortiz, M.A. Comparative study of CuO–CeO2 catalysts prepared by wet impregnation and deposition–precipitation. Int. J. Hydrogen Energy 2009, 34, 547–553. [Google Scholar] [CrossRef]
- Iriarte-Velasco, U.; Ayastuy, J.L.; Boukha, Z.; Bravo, R.; Gutierrez-Ortiz, M.Á. Transition metals supported on bone-derived hydroxyapatite as potential catalysts for the Water-Gas Shift reaction. Renew. Energy 2018, 115, 641–648. [Google Scholar] [CrossRef]
- Boukha, Z.; González-Velasco, J.R.; Gutiérrez-Ortiz, M.A. Platinum supported on lanthana-modified hydroxyapatite samples for realistic WGS conditions: On the nature of the active species, kinetic aspects and the resistance to shut-down/start-up cycles. Appl. Catal. B Environ. 2020, 270, 118851. [Google Scholar] [CrossRef]
- Bensouilah, R.; Olivet, L.; Hammedi, T.; Pronier, S.; Barbier, J.; Fontaine, C.; Ghorbel, A.; Ksibi, Z. Effect of the variation of metal and cerium loadings on CeO2x–TiO2(100−x) supports in the complete catalytic oxidation of formaldehyde. Res. Chem. Intermed. 2021, 47, 813–834. [Google Scholar] [CrossRef]
- Poggio-Fraccari, E.; Bader, G.; Alemany, L.; Mariño, F. Pelletized Cu-Ni/CePr5 catalysts for H2 purification via water gas shift reaction. Fuel 2020, 271, 117653. [Google Scholar] [CrossRef]
- Boukha, Z.; Ayastuy, J.L.; González-Velasco, J.R.; Gutiérrez-Ortiz, M.A. CO elimination processes over promoter-free hydroxyapatite supported palladium catalysts. Appl. Catal. B Environ. 2017, 201, 189–201. [Google Scholar] [CrossRef]
- Serafin, J.; Ouzzine, M.; Sreńscek-Nazzal, J.; Llorca, J. Photocatalytic hydrogen production from alcohol aqueous solutions over TiO2-activated carbon composites decorated with Au and Pt. J. Photochem. Photobiol. A Chem. 2022, 425, 113726. [Google Scholar] [CrossRef]
- Serafin, J.; Kusiak-Nejman, E.; Wanag, A.; Morawski, A.W.; Llorca, J. Hydrogen photoproduction on TiO2-reduced graphene oxide hybrid materials from water-ethanol mixture. J. Photochem. Photobiol. A Chem. 2021, 418, 113406. [Google Scholar] [CrossRef]
- Stokes, D.J. Principles and Practice of Variable Pressure Environmental Scanning Electron Microscopy (VP-ESEM); John Wiley & Sons: Chichester, UK, 2008; ISBN 978-0470758748. [Google Scholar]


Disclaimer/Publisher’s Note: The statements, opinions and data contained in all publications are solely those of the individual author(s) and contributor(s) and not of MDPI and/or the editor(s). MDPI and/or the editor(s) disclaim responsibility for any injury to people or property resulting from any ideas, methods, instructions or products referred to in the content. |
© 2023 by the authors. Licensee MDPI, Basel, Switzerland. This article is an open access article distributed under the terms and conditions of the Creative Commons Attribution (CC BY) license (https://creativecommons.org/licenses/by/4.0/).