Article

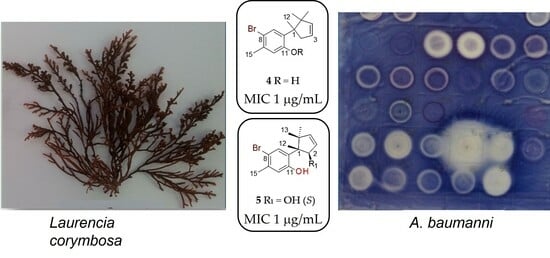
Antimicrobial Activity of the Secondary Metabolites Isolated from a South African Red Seaweed, Laurencia corymbosa

1
Faculty of Pharmacy, Rhodes University, Makhanda 6140, South Africa
2
Department of Biological Sciences, University of Cape Town, Rondebosch 7701, South Africa
3
Applied Microbial and Health Biotechnology Institute, Cape Peninsula University of Technology, Bellville 7535, South Africa
4
Department of Chemistry, University of the Western Cape, Bellville 7535, South Africa
5
School of Pharmacy, University of the Western Cape, Bellville 7535, South Africa
*
Author to whom correspondence should be addressed.
Molecules 2023, 28(5), 2063; https://doi.org/10.3390/molecules28052063
Submission received: 23 January 2023 / Revised: 17 February 2023 / Accepted: 19 February 2023 / Published: 22 February 2023
(This article belongs to the Special Issue Discovery of Bioactive Ingredients from Natural Products III)

Abstract

:
South Africa’s highly diverse marine biota includes several endemic marine red algae of the Laurencia genus. Cryptic species and morphological variability make the taxonomy of Laurencia plant challenging, and a record of the secondary metabolites isolated from South African Laurencia spp. can be used to assess their chemotaxonomic significance. In addition, the rapid development of resistance against antibiotics, coupled with the inherent ability of seaweeds to resist pathogenic infection, supported this first phycochemical investigation of Laurencia corymbosa J. Agardh. A new tricyclic keto-cuparane (7) and two new cuparanes (4, 5) were obtained alongside known acetogenins, halo-chamigranes, and additional cuparanes. These compounds were screened against Acinetobacter baumannii, Enterococcus faecalis, Escherichia coli, Staphylococcus aureus, and Candida albicans, with 4 exhibiting excellent activity against the Gram-negative A. baumanii (minimum inhibitory concentration (MIC) 1 μg/mL) strain.

Graphical Abstract

1. Introduction

The increasing number of marine-derived therapeutic agents justifies the continued exploration of the oceans as a source of new medicines [1]. To date, more than 20 drugs from the marine environment have been approved for use. In 1969, the FDA approved cytarabine (Cytosar-U®), isolated from the Caribbean sponge Cryptotheca crypta, for use as an anticancer drug. Since then, the analgesic cone-snail-derived peptide ziconotide (Prialt®) and the anticancer sponge-derived macrolide eribulin mesylate (Halaven®) as well as other natural products with anticancer (Fludarabine, Nelarabine, Keyhole Limpet Hemocyanin K, Protamine Sulfate, Lurbinectedin, Brentuximab vedotin etc.), antiviral (Vidarabine), and antihypertriglyceridemia (Eicosapentaenoic acid ethyl ester, Omega-3-carboxylic acid) activities have been approved [2,3,4,5,6,7]. In addition, propylene glycol alginate sulfate sodium (PSS) and propylene glycol mannuronate sulfate (PGMS) isolated from macroalgae have been approved for use in cardiovascular and hyperlipidemia disease areas [8,9]. Currently, there are more than 50 drug candidates in different stages of clinical trials, with more than 85% undergoing trials as anticancer agents [2,3,4,5,6,7]. However, there are very few anti-infective agents that have been approved or are undergoing clinical trials. Economic and regulatory obstacles have effectively halted the development of new antibiotics, while funding cuts have resulted in a decrease in academic research. The development of antibiotics is not considered economically sound since antibiotics are often curative and used for relatively short periods, i.e., antibiotics are not as profitable as drugs that treat chronic conditions, such as diabetes and asthma. All these factors have led to the antibiotic resistance crisis [10].
Marine macroalgae (seaweeds) have generated over 3000 biologically active, new chemical structures in the last 40 years, most of which were isolated from the phylum Rhodophyta [11]. More than 1200 unique natural products, including halogenated sesquiterpenes, diterpenes, C15 acetogenins, and indoles, have been reported from the red algal genus Laurencia [12,13]. Unfortunately, factors such as high morphological variability amongst individual species make the classification and/or identification of members within this genus increasingly difficult [14].
Marine organisms, including seaweeds, are constantly exposed to potentially pathogenic microorganisms but are rarely infected. It is thus hypothesized that seaweeds produce small molecules that act as antimicrobial substances and prevent infection [15]. Seaweed natural products may thus provide lead compounds in the discovery of new antibiotics. Fortunately, natural products remain the leading source of new antibiotics against pathogenic microorganisms [16,17].
The purpose of the current study is therefore two-fold: (1) to document, for the first time, the secondary metabolites of L. corymbosa, which may assist in the taxonomic classification of species of Laurencia, and (2) to assess their antimicrobial potential. In this first phycochemical analysis of South African Laurencia corymbosa, we report the isolation, structural characterization, and antimicrobial activity of the known chamigranes (1 and 2), the C15 acetogenin neolaurencenyne (3), and new cuparanes (4, 5, and 7) (Figure 1) [18].

2. Results and Discussion
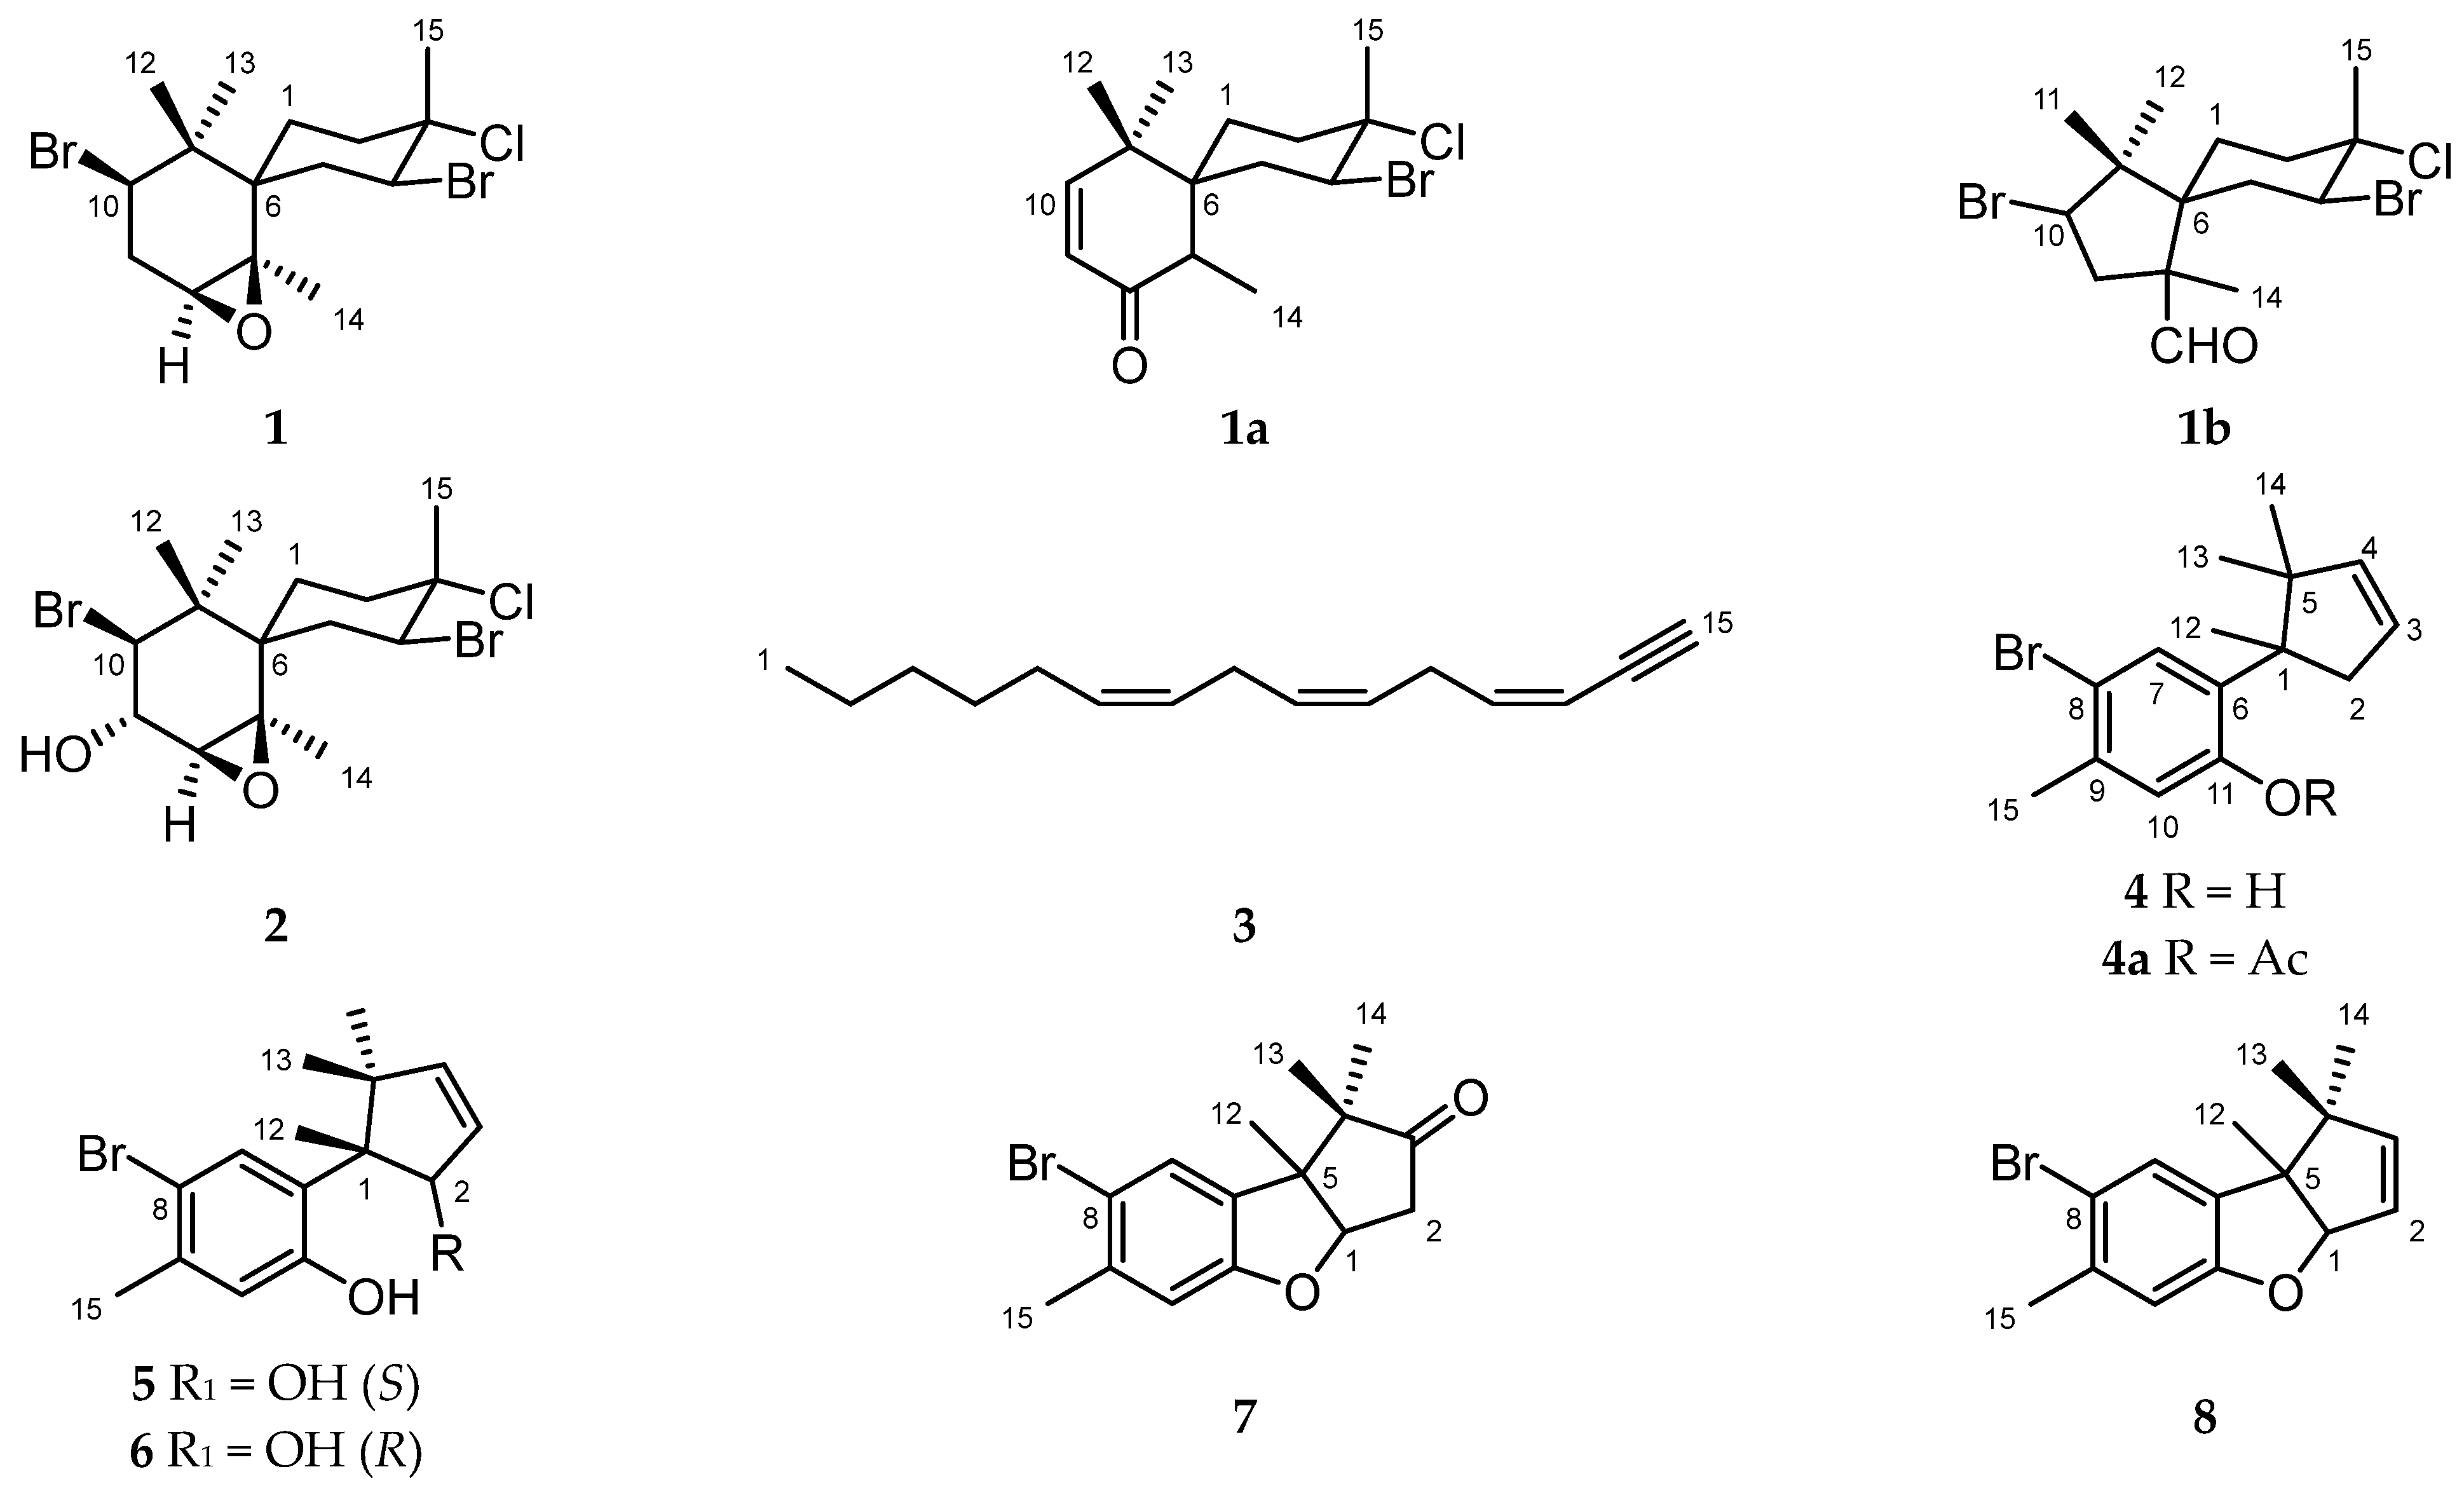
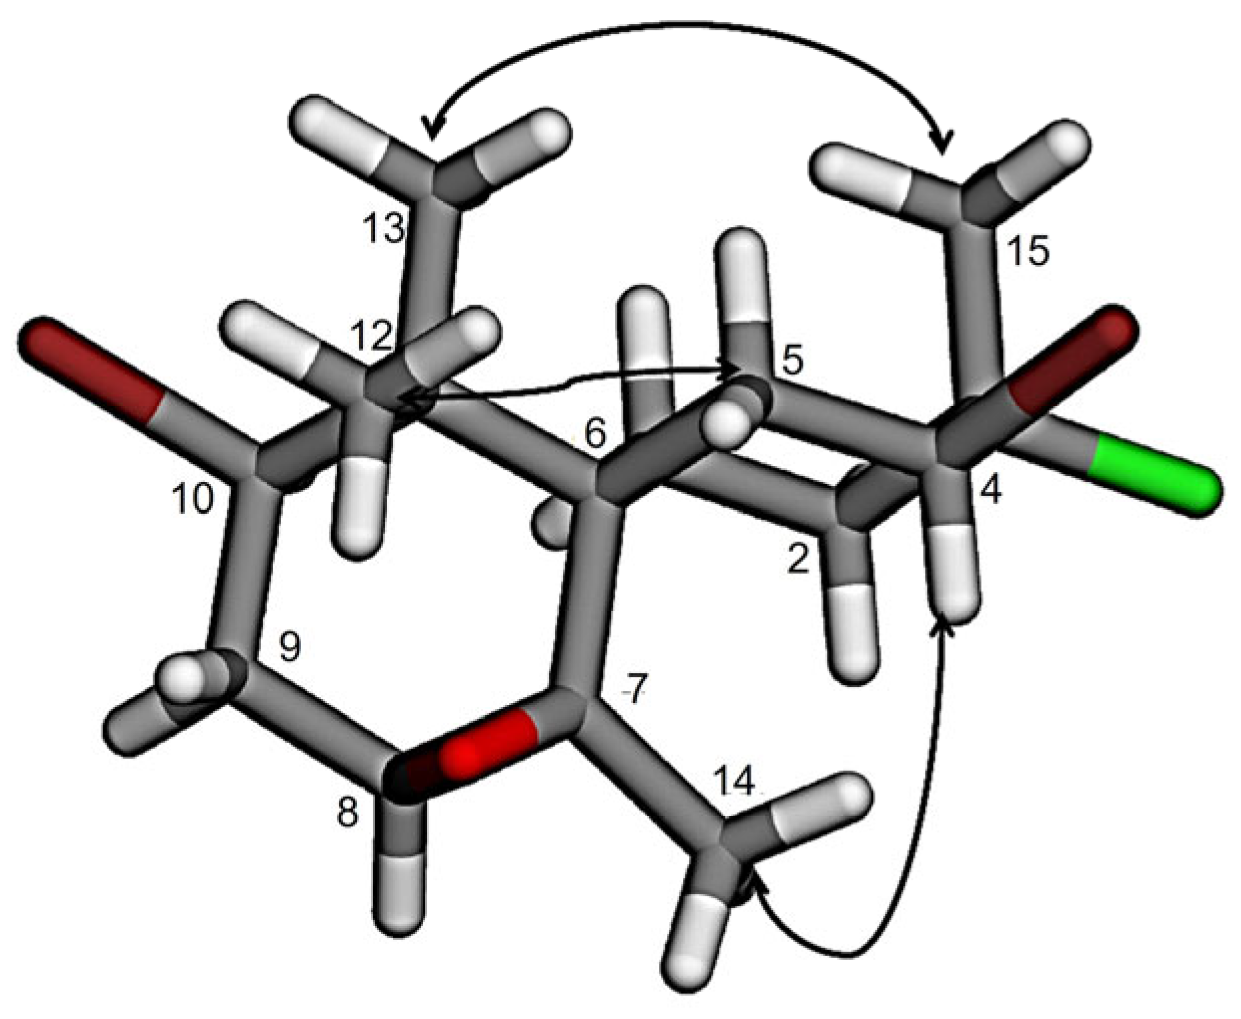
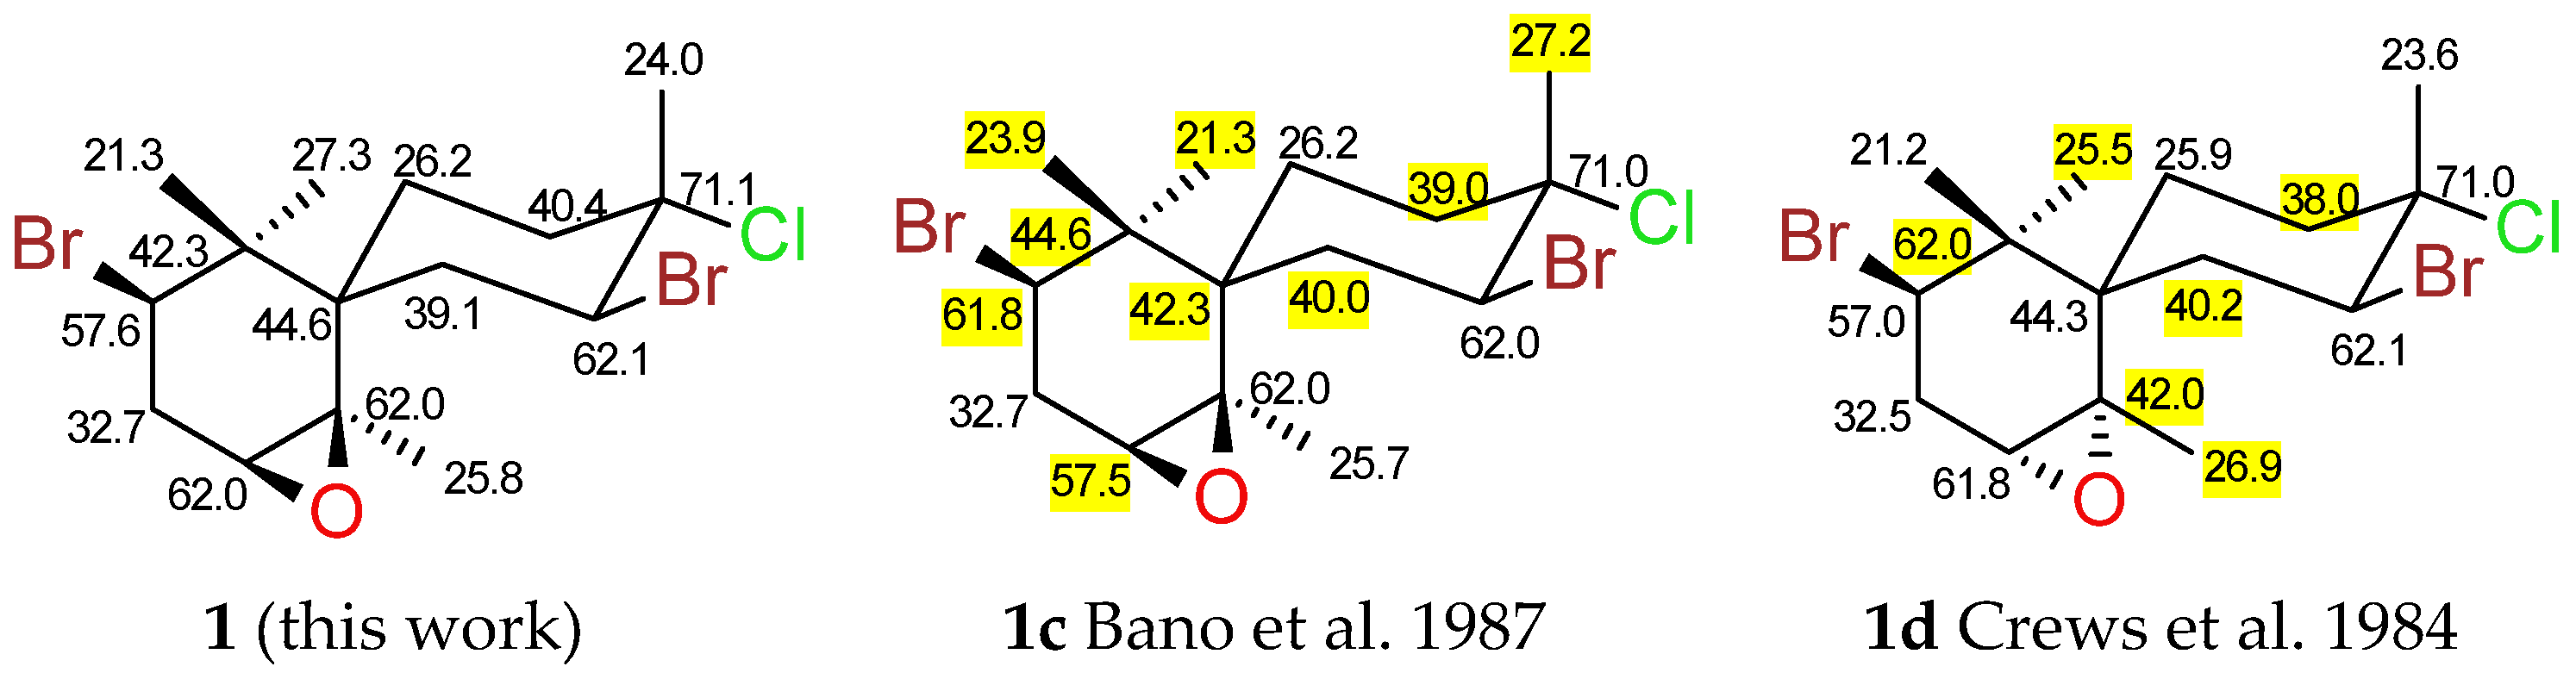
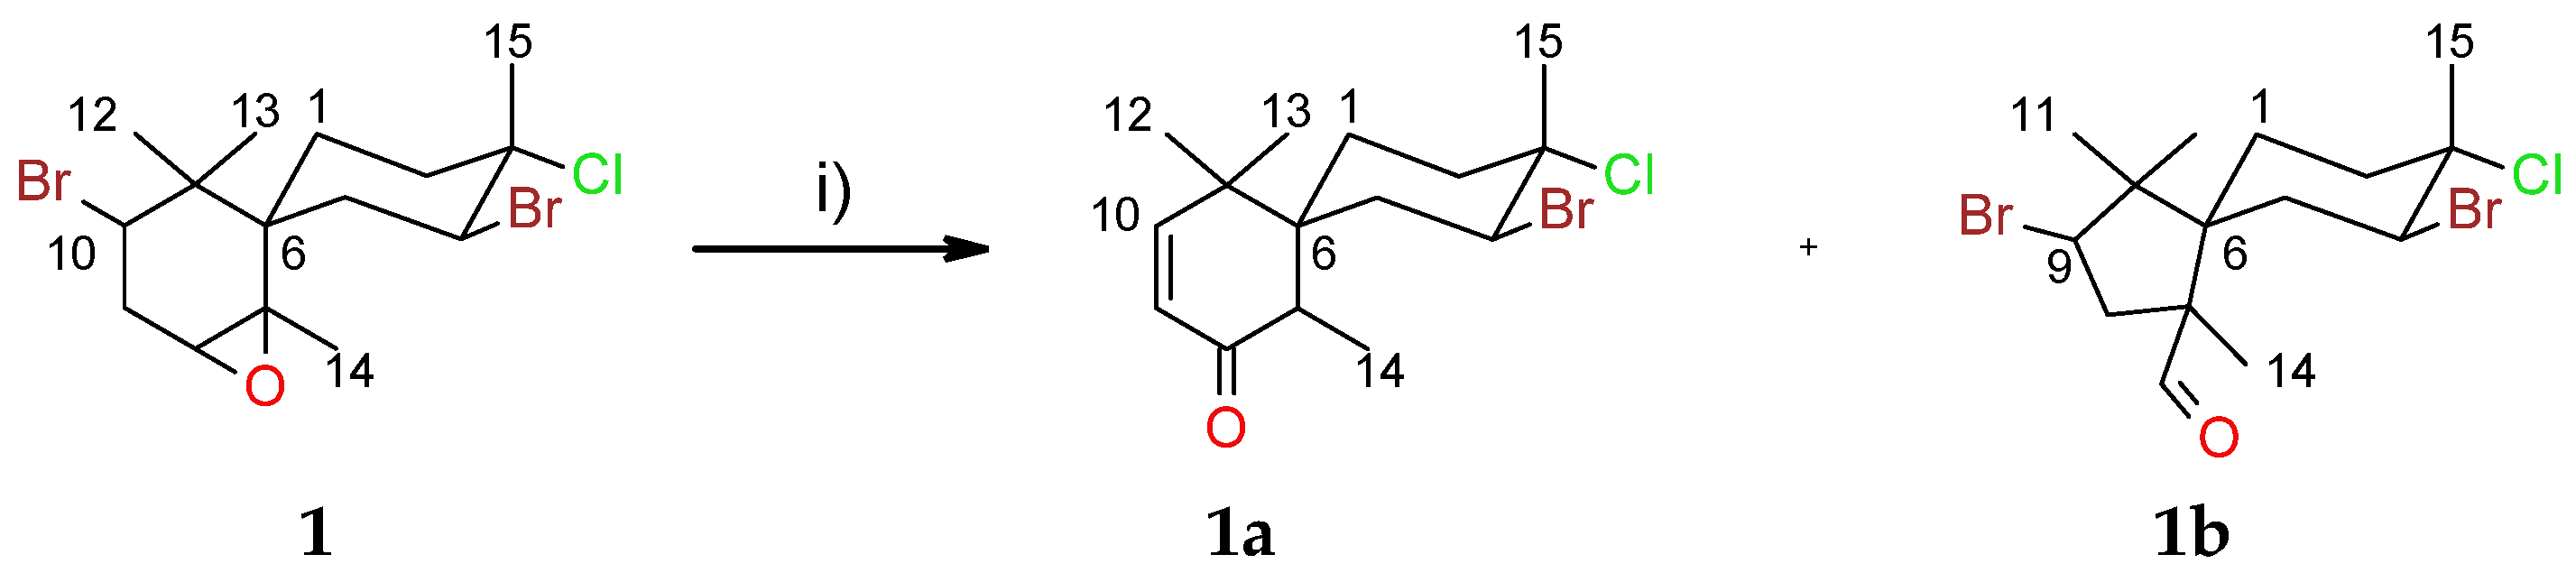
Specimens of L. corymbosa were extracted with MeOH and MeOH-CH2Cl2, and the combined extracts were concentrated at 40 °C. Column chromatography on silica gel using hexane-EtOAc-MeOH solvent combinations of increasing polarity resulted in eight fractions (frs A-H, Scheme S1). The effectiveness of this extraction and separation protocol in separating different polarity classes and concentrating minor natural products is easily seen when comparing the 1H NMR spectra of the various fractions (Figure 2). Further fractionation and purification by normal phase HPLC resulted in the isolation of compounds 18.

2.1. Chamigranes

Compound 1, crystalline solid, was purified by normal phase HPLC of column fr B (hexane-EtOAc, 9:1).
The 1H NMR spectrum (Figure S2) of the crystalline material together with a multiplicity-edited HSQC spectrum (Figure S5) were key in identifying three sets of diastereotopic methylene resonances at δH 1.67 and 1.98, δH 2.38 and 2.47, δH 2.10 and 2.84, and one enantiotopic methylene resonance at δH 2.61 (dd, J = 7.7, 3.0 Hz). A total of three methine moieties observed at δH 4.77 (dd, J = 13.3, 4.7 Hz), δH 2.92 (t, J = 3.0 Hz) and δH 4.06 (t, J = 7.7 Hz), together with four methyl singlets between δH 1.0 and 2.0, were suggestive of a sesquiterpene skeleton. These data, together with the 13C and HMBC data obtained, supported a chamigrane sesquiterpene structure with a spiro [5.5] undecane arrangement for metabolites typically produced by Laurencia spp. [14].
Compound 1 was identified as a previously isolated metabolite, 3-chloro-4,10-dibromo-7,8-epoxychamigrane, isolated from a Laurencia sp. in the Gulf of California [19], with the crystal structure reported by Cowe et al. (1989) [20]. Analysis of the NOESY spectrum of compound 1 allowed for the confident assignment of the stereo-centers as shown in Figure 3 and Figure S8. This allowed for a distinction to be made between compound 1 and the corresponding epoxy-epimer about C7/C8, compound 1d (Figure 4), which was isolated by Ojika et al. (1982) [21] from Laurencia okamurai. The relative configuration displayed in compound 1 is further justified as 1H NMR data were consistent with those provided by Howard and Fenical (1975) [19].
Although compound 1 had previously been isolated from a Laurencia sp. in the Gulf of California [19], there is some conflict in the reported carbon chemical shifts [22] requiring an informed re-assignment following comprehensive analysis of the 13C NMR data of compound 1. Unambiguous COSY (Figure S4) and HMBC (Figures S6 and S7) correlations obtained for compound 1 in this study conflicted with those reported by Bano et al. (1987) [22], as shown in compound 1 (Figure 4), especially regarding positions C6, C10, and C11. Although 13C NMR data are included by the authors (Ojika et al., 1982) [21] for the epoxy epimer 1d, several discrepancies are observed (Figure 4). Crews et al. (1984) [23], however, report the 13C NMR data for a semi-synthetic analogue prepared by Howard and Fenical (1975) [19].
The C12 and C13 methyl protons show clear 3J HMBC correlations (Figures S6 and S7) to the bromo-methine at C10 where the chemical shift is δC 57.6 and not δC 61.8, as suggested by Bano et al. (1987), while the spiro-center at C6 in compound 1 possesses a quaternary carbon with a chemical shift of δC 44.6 and not δC 42.3 [22]. This is supported by unambiguous 3J HMBC correlations from methyl moieties at C13 and C14. In contrast to 1c, the 13C NMR chemical shift of the gem-dimethyl quaternary carbon at C11 should be δC 42.3 and not δC 44.6, as both methyl groups C12 and C13 display strong 2J HMBC correlations to C11 (δC 42.3). Bano et al. (1987) [22] and Crews et al. (1984) [23] both report two carbon resonances at δC 62.0 (Figure 4).
Comprehensive 2D analysis as well as a solvent change from CDCl3 to acetone failed to resolve the overlapped signals of C7 and C8. Cleavage of the epoxide with BF3·Et2O provided this confirmation through the formation of the dehydrohalogenated ketone 1a and the ring-contracted cyclopentenyl aldehyde 1b (Scheme 1). The formation of the α,β unsaturated ketone in 1a was revealed by the 1H NMR spectrum (Figure S9, Table S1) with coupled (J = 10.2 Hz) olefinic doublets at δH 5.82 and δH 6.43, together with a carbonyl signal at δC 201.5 and a carbonyl stretch at 1681 cm−1 in the 13C NMR (Table S1) and IR data, respectively.
Compound 1b showed a distinctive aldehyde singlet in its 1H NMR spectrum (Figure S10, Table S2) at δH 9.79, while the condensed five-membered ring was confirmed by examining 2,3J HMBC correlations within the pentacyclic ring from the methyl moieties positioned at C7 and C10. Additionally, the aldehyde functionality at C13 was clearly visible in the 13C NMR spectrum (Figure S11) of compound 1b at δC 203.5. These data thus confirmed the integrity of the C7 assignment at δC 62.0.
The 1H NMR spectrum of compound 2 (Figure S12) indicated a similar chamigrane skeleton to that observed for compound 1. Terpenoid shielded methyl moieties were apparent between δH 1.0 and δH 2.0, together with a cluster of methylene signals between δH 2.0 and 2.8. An additional methine signal in the range δH 3.7–5.0 suggested further substitution on the chamigrane skeleton of compound 2 vs. compound 1. COSY and HMBC experiments revealed the presence of a methine moiety at C9 in 2 with the chemical shift at δC 70.7 supporting a hydroxyl moiety (Table S3, Figure S13). A coupling constant of (J = 9.1 Hz) suggested a trans-axial arrangement for the methine protons H9 and H10, while a coupling constant of J = 2.8 Hz for H9 allowed the assignment of the relative configuration at C7/C8. Elsworth and Thomson (1989) reported the isolation of compound 2 previously from Laurencia glomerata [24].

2.2. Linear Acetogenin
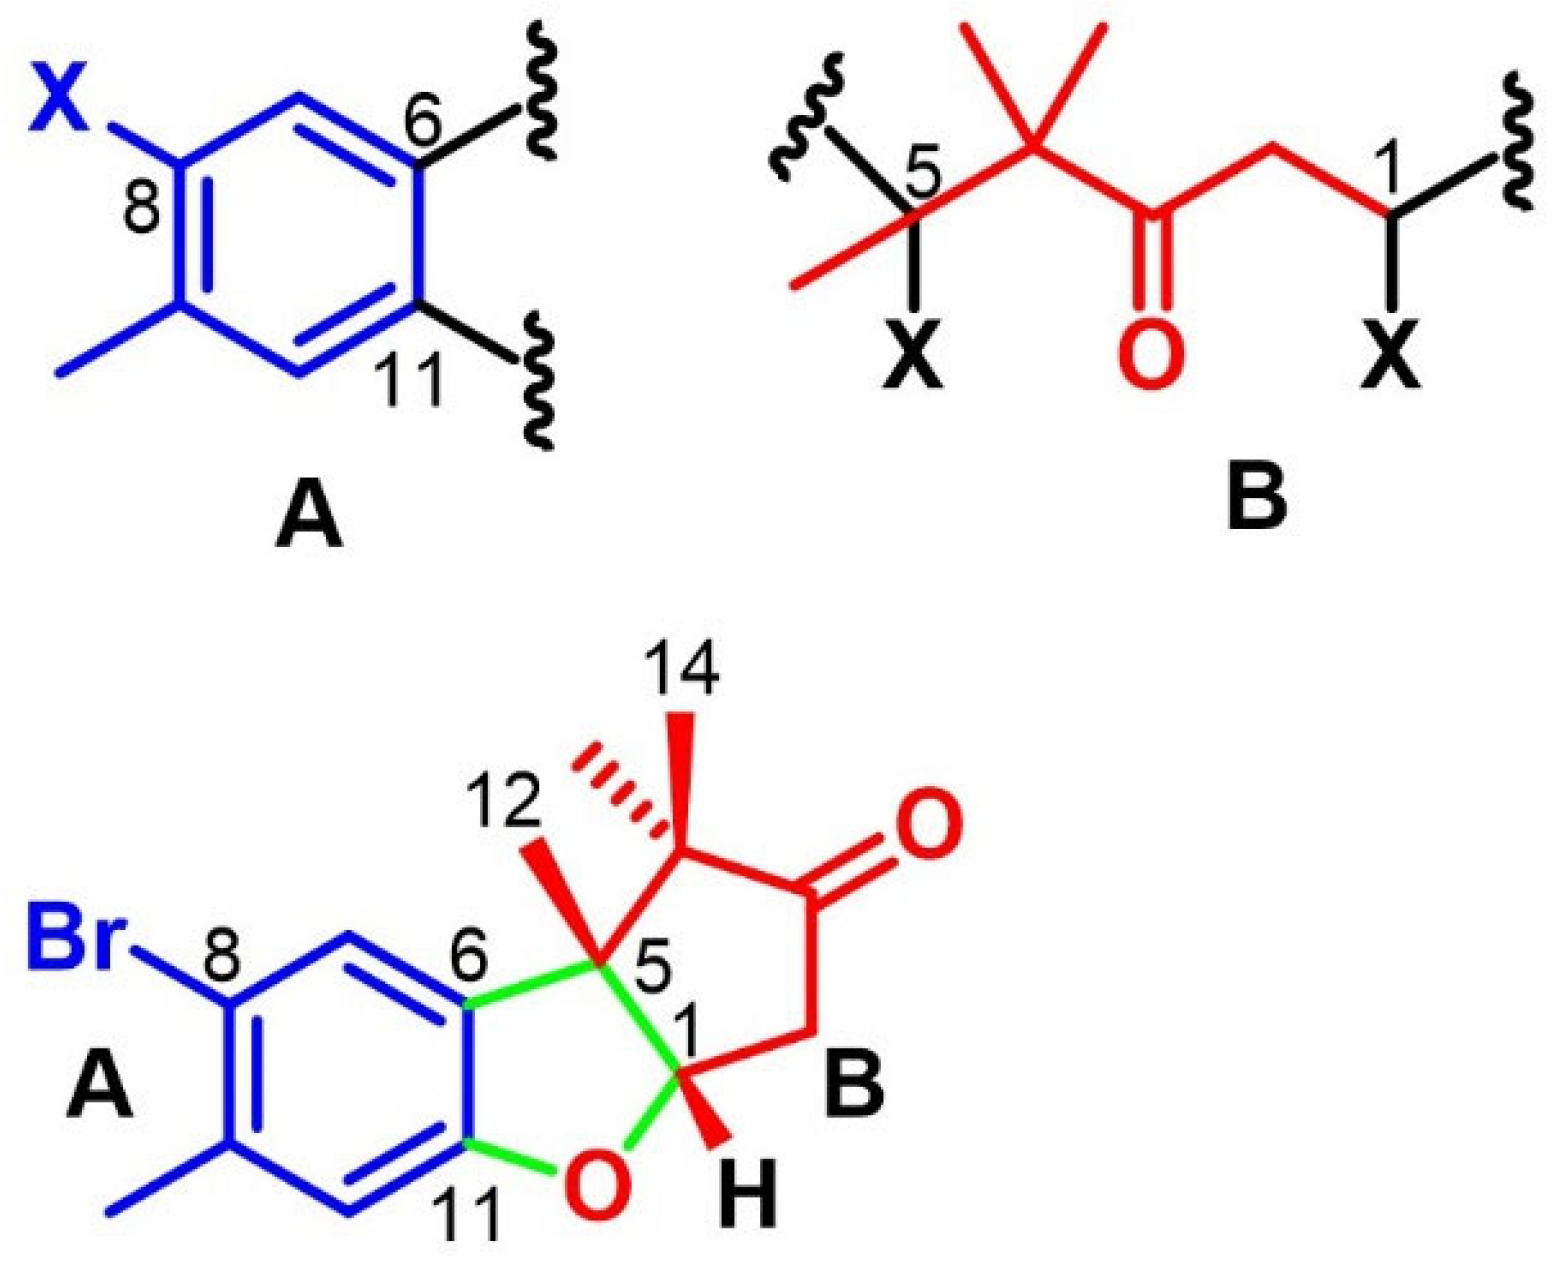
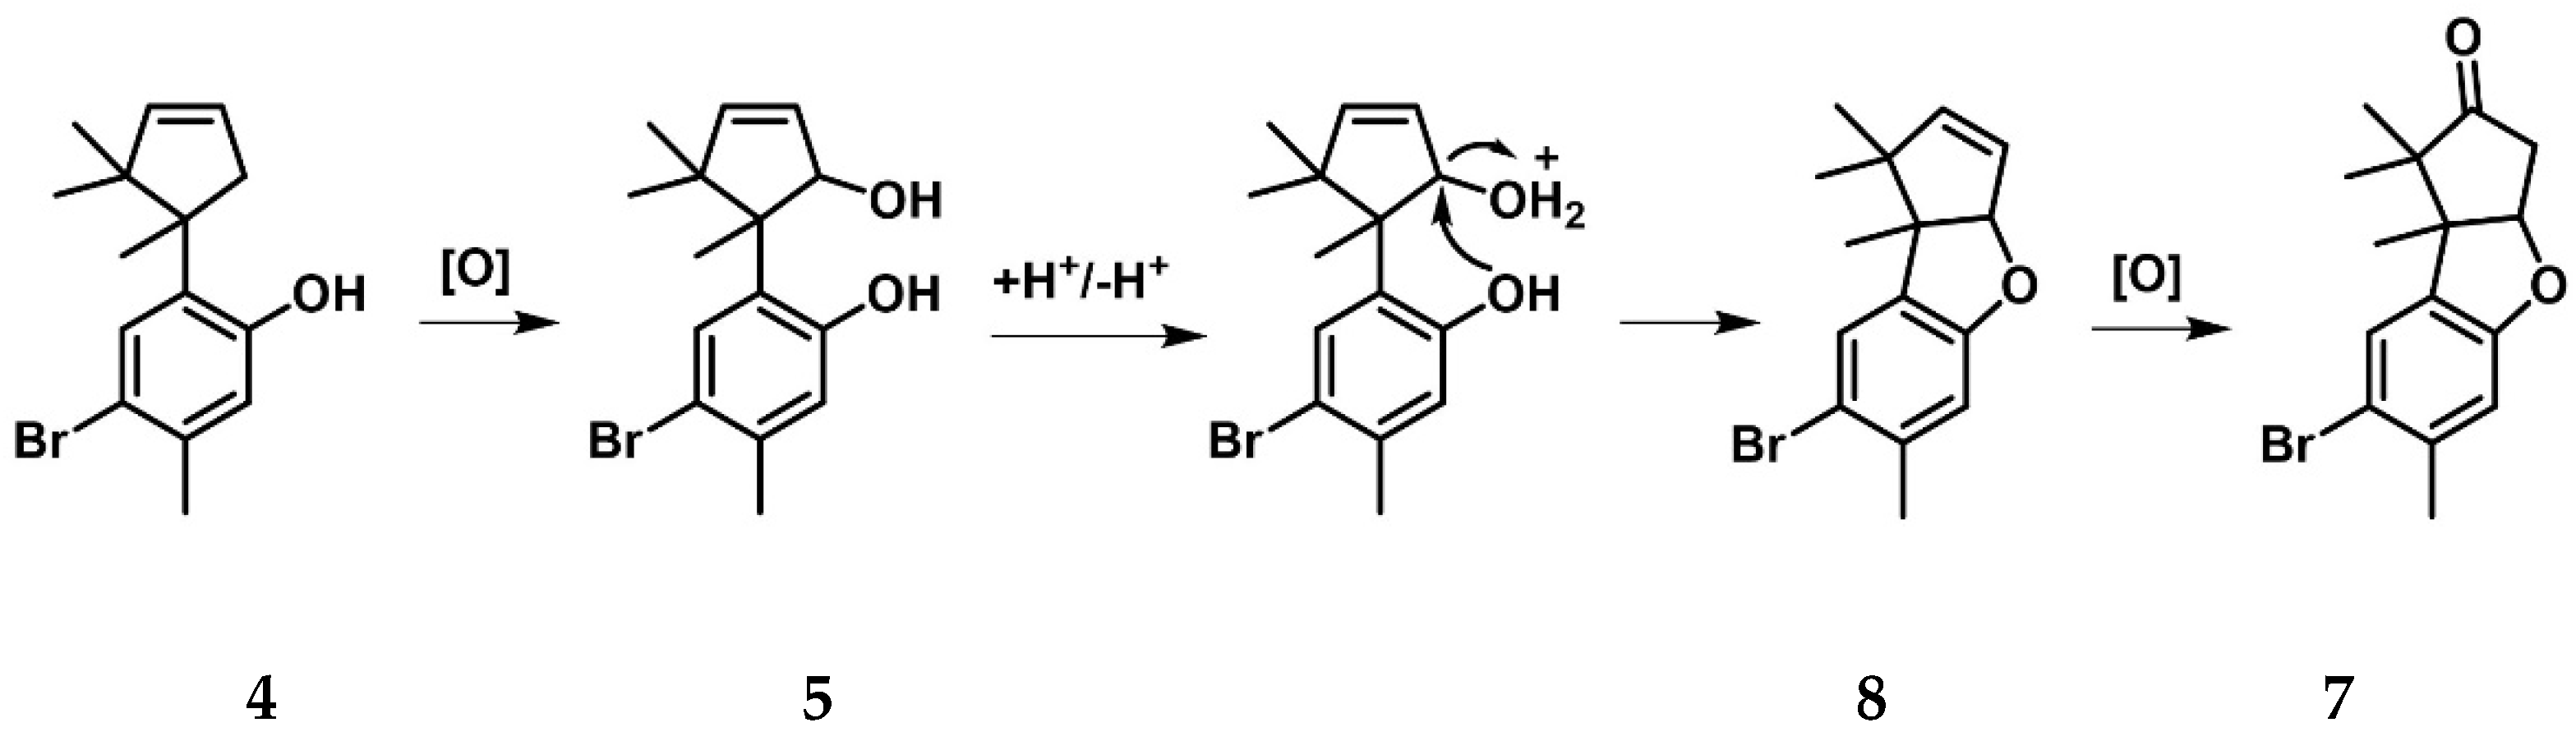
Compound 3 was isolated as a viscous nonpolar oil. The 1H NMR spectrum (Figure S14) contained a complex cluster of olefinic signals in the region of δH 5.0–6.0, suggesting unsaturated functionalities. A terminal methyl flanked by a methylene group was deduced from a broad triplet at δH 0.89 (t, J = 7.1 Hz), while a broad singlet at δH 3.11 identified a terminal alkyne proton. A further two double bonds (δC 125.8, 127.4, 129.9, and 130.6) and five methylene moieties (δC 28.7, 29.3, 31.5, 25.8, and 27.2) were deduced from a multiplicity edited HSQC spectrum (Table S4). Compound 3 was identified as neolaurencenyne, a non-terpenoid linear acetogenin previously isolated from Laurencia okamurai and successfully synthesized by Kigoshi et al. (1981) [25]. Compounds within this structural class are thought to be precursors to the more complex cyclic acetylenic compound. The orientation of the terminal alkyne about Δ3,4 was assigned as cis, as deduced by the carbon chemical shift at C2; with cis and trans systems resonating at ~δC 80 and ~δC 76, respectively [25]. The 13C NMR spectrum (Figure S15) exhibited 15 signals including resonances characteristic of a terminal conjugated alkenyne moiety (δC 81.8, 80.3, 108.3 and 143.7), which was further confirmed by an IR stretch at ~3300 cm−1.
A biosynthetically significant metabolite showing the precursor nature of 3 is the Δ6,7 hydroxy-chloro derivative of neolaurencenyne which was isolated by Norte et al. (1991) from a Spanish sample of Laurencia pinnatifida [26]. The latter compound hints at the enzyme-driven substitution of the olefin within 3.

2.3. Cuparanes

Compound 4, isolated as a colourless oil, showed a molecular ion cluster at m/z 294 and 296 in the HRGCEIMS spectrum (Figure S24), indicative of a single isotopic halo-substituent within the molecule. The molecular formula was deduced to be C15H19O79Br with a calculated double bond equivalent of six. The 13C NMR (Figure S18, Table 1), together with HSQC and HMBC data spectra, revealed 15 signals (Figures S20 and S21, respectively), as well as a broad hydroxy stretch in the IR spectrum which added integrity to the molecular formula. The 1H NMR spectrum (Figure S17) of 4 revealed four methyl resonances between δH 0.5 and 2.5, suggesting a sesquiterpenoid skeleton. The 1H NMR spectrum also showed aromatic singlets between δH 6.5 and 7.5, two deshielded, broad olefinic singlets between δH 5.5 and 6.5, and mutually coupled (J = 16.1 Hz) allylic methylene doublets at δH 2.5 and δH 3.0.
This new compound, compound 4, was identified as an isomer of iso-allolaurinterol isolated by Dias et al. (2009) from Laurencia filiformis [27]. Iso-allolaurinterol shows a methyl shift from C5 to C4, whereas compound 4 exhibits the presence of a broad olefin singlet at C4 (δH 5.67) and a gem-dimethyl moiety at C5. Aromatic, hydroxyl substituents are known to be more deshielded than bromo-substituents [28]; thus, critical assessment of HMBC correlations from the methyl substituents at C1 and C9 to various carbon centers on the aromatic ring (Figures S21 and S22) allowed for the determination of the positions of the bromine and hydroxy moieties. Moreover, the proposed substituent locations in compound 4 are typical for metabolites isolated from Laurencia spp., as is shown by Dias et al. (2009), Yu et al. (2014), and Yamada et al. (1969) [27,29,30].
Acetylation of compound 4 to form 4a, confirmed by acetyl carbon signals δC 169.6 and δC 21.8 (Figure S26, Table S5), resulted in clearer splitting of olefinic signals H3 and H4 as well as a more distinctive split for H2 (Figure S25). The HRGCEIMS spectrum (Figure S27) of the acetylated compound, 4a, showed a molecular ion cluster [M+H]+ at m/z 337.0789 (calculated for 337.0803) and 339.0823, confirming the molecular formula C17H2179BrO2. Assignment of the positions of the C8 and C11 substituents in compound 4 were further substantiated as similar 2D correlations were observed in the acetylated derivative.
Compound 5 was successfully purified via HPLC; however, numerous attempts at purifying compound 6 were unsuccessful as 6, an isomer of 5, co-eluted with compound 5. The structure of compound 6 was still resolved, albeit as a mixture with 5. The 1H NMR spectra of compounds 5 and 6 (Figures S28 and S35, respectively) closely resembled that of compound 4 (Figure S17) except for the absence of the shielded methylene cluster between δH 2.5 and 3.0 and the emergence of extra deshielded signals within the region of ~ δH 4.2. Of interest in the 1H NMR spectrum of 5 (Figure S28) was the peak splitting of the coupled olefinic doublets at δH 5.92 (J = 5.5 Hz) and δH 6.13 (J = 5.5 Hz) vs. that of the broad signals observed for 4 (Figure 4). The 1H NMR data (Table 2) of these isomers, particularly the additional resonances at ~ δH 4.5, implied a structure like that of 4, save for the substitution of the methylene group at C2. The carbon chemical shift at C2 of ~ δC 85 (Figure S36) implied a hydroxyl moiety, and compound 6 is analogous to a hydroxy cuparane isolated by Mann (2008) from Laurencia flexuosa [31].
The HRGCEIMS spectrum (Figure S34) of compound 5 showed the same molecular formula (C15H1979BrO2) as compound 6 with [M-OH] at m/z 293.0533 (calculated for 293.0541). Both 5 and 6 possess the same basic carbon skeleton; however, several differences in 1H and 13C spectral data between the two compounds at C2, C4, C12, C13, and C14 required further investigation. Careful analysis of the NOESY NMR data revealed compound 5 to be a diastereomer of 6 at C1 due to NOESY cross-peaks (Figure S33) from the hydroxy methine H2 (δH 4.50) to the methyl singlets H12 (δH 1.38) and H13 (δH 1.19) in 5, in contrast to 6, where a correlation only from H2 to H14 was observed (Figure S40).
Compound 7 was recrystallized in hexane to afford white, needle-like crystals. Analysis of the HRGCEIMS spectrum (Figure S47) showed isotopic molecular ion signals at m/z 308.0356 (calc. 308.0412) and 310.0346. After identifying a total of 15 carbon signals by analysis of the 13C NMR (Figure S42) and HMBC (Figure S45) spectra, the molecular formula of 7 was determined to be C15H1779BrO2 with a calculated double bond equivalent of seven. The 13C NMR spectrum (Figure S42) displayed a deshielded methine signal at δC 89.1 as well as a cluster of methyl peaks between δC 20 and 24, like that observed for compound 4. The 1H NMR spectrum of 7 (Figure S41) showed deshielded singlets corresponding to the same tetra-substituted aromatic ring, as previously seen with compound 4. The appearance of a doublet of doublets at δH 4.68 (J = 6.9, 3.5 Hz) and a methylene multiplet at δH 2.82 deviated from that obtained for 4. Following careful analysis of the 1D and 2D NMR data (Table 3), partial structures A and B (Figure 5) were considered. The aromatic substructure A was like that of 4 except for a more highly deshielded quaternary carbon at C11 (δC 159 vs. δC 154 for 4). For substructure B, COSY NMR data (Figure S43) allowed for the construction of a (-CHXCH2-) spin system (C1 and C2), while the presence of the carbonyl moiety at C3 was supported by HMBC correlations from the methylene functionality at C2, as well as gem-dimethyl moieties on C4 (Figure S45, Table 3). Additionally, IR spectra revealed a C=O stretch at 1742 cm−1 which is typical of five-membered cyclic ketones. The merging of substructures A and B was achieved by HMBC correlations between H12-C6 and H7-C5 (Table 3).
Since the molecular formula revealed the presence of two oxygen atoms and considering a carbon chemical shift at C1 (δC 89.1), substructure B is proposed to cyclize and form a cyclopentanyl moiety linked to substructure A via a dihydrofuran-like heterocycle as shown in Figure 5. In addition, the aromatic ring and carbonyl moiety within 7 account for a total of five degrees of unsaturation. The additional two double bond equivalents required by the molecular formula must therefore be accommodated by two additional rings within 5, i.e., the dihydrofuran ring and cyclopentanyl ring. The relative configurations at C1, C4, and C5 were assigned by analysis of NOESY correlations from H1 to H12 and H14 (Table 3 and Figure S46).
The only major spin system (-CH-CH-) differentiating the 1H NMR spectrum of compound 8 (Figure S48) compared to 7 (Figure S41) was a doublet at δH 5.82 (J = 6.2 Hz) coupled to a doublet of doublets at δH 5.62 (J = 6.2, 1.9 Hz). Since 8 lacked a shielded methylene multiplet in the 1H NMR spectrum (Figure S48, Table S6) and a deshielded carbonyl correlation in the HMBC spectrum, two deshielded carbon signals were detected at δC 124.8 and δC 147.7, suggesting the presence of an olefin between C2 and C3 as opposed to a carbonyl at C3 as for compound 7 (Table 3). Compound 8 (Table S6) was isolated previously from L. flexuosa by Mann (2008) [31].
Compounds 4, 5, 7, and 8 appear to be part of a proposed biosynthetic series (Figure 6) with compound 4 serving as a plausible precursor. Conversely, the removal of water on the five-membered ring of 5 is likely to give rise to 4.

2.4. Antimicrobial Study

The antibacterial activity of South African marine algal extracts has been assessed [32,33]. However, comparison of results from various studies is difficult due to the different extraction, storage, and testing procedures used [34]. In this study, we investigated the antimicrobial effects of the pure compounds (17) isolated from L. corymbosa against a panel of five clinically important pathogens including the Gram-negative Acinetobacter baumannii and Escherichia coli, the Gram-positive Enterococcus faecalis and Staphylococcus aureus subsp. aureus, and Candida albicans. The minimum inhibitory concentrations (MIC) in μg/mL, disk diffusion in mm2, and the bioautography results are presented in Table 4. Compound 8 was not tested due to the paucity of the available material. The compounds and the crude extract were initially screened using disk diffusion assays and bioautography with vancomycin, ampicillin, and actidione as controls. Several compounds exhibited activity against S. aureus with compounds 1, 2, 4, and 6 as well as the crude extract revealing disk diffusion zones of 18.85, 30.63, 76.18, 24.74, and 31.42 mm2, respectively (Table 4). Compound 4 exhibited excellent activity against S. aureus at 50 mg/mL as well as an inhibition zone of 24.74 mm2 against C. albicans. Several compounds showed regrowth of the pathogens, e.g., compounds 4, 5, and 6 as well as the crude extract (Table 4), indicating that an initial inhibition of growth took place but that insufficient amounts of the compound were present to kill the organisms. All compounds tested were active against one or more of the pathogens. Compounds 4 and 5 revealed excellent activity against the Gram-negative A. baumannii with MICs at 1 μg/mL (Table 4). Compounds 14 and 7 all showed good activity with MICs at 100 μg/mL against the vancomycin-resistant E. faecalis, with compounds 1 and 3 showing potent activity at 1 μg/mL. Compounds 1, 4a, 7 and the crude extract also showed good activity with MICs at 100 μg/mL against the Gram-negative E. coli. Candida albicans was resistant to all the test compounds when tested under liquid media conditions (Table 4). Coprinol, a cuparane isolated from the Coprinus fungi, showed moderate activity against Gram-positive multiresistant strains such as penicillin-resistant pneumococci, methicillin- and quinolone-resistant staphylococci, and a vancomycin-intermediate-resistant staphylococcus, with MICs in the range of 6–25 μg/mL [34]. The authors also found no activity against C. albicans. The cuparane 10-hydroxycuparaldehyde isolated from L. obtusa lamouroux showed good inhibitory activity against E. coli, K. pneumoniae, P. mirabilis, P. aeruginosa, E. faecalis, and S. aureus with MIC (minimum inhibitory concentration) values in the range of 0.08–0.15 mM [35]. Debromolaurinterol and α-bromocuparane isolated from a Bornean L. snapeyi showed good antibacterial activity against S. typhi, with an MIC/MBC ratio of 2.79 and 2.72, respectively, which is indicative of bactericidal antibiosis [35].
The discrepancies among the different methods of testing for antimicrobial activity may be due to the diffusability of the compounds in and on solid media vs. liquid media. Disk diffusion assays and bioautography are good initial screening tools, whereas true MIC values can be determined in liquid media assays.

3. Conclusions

In this, the first phycochemical investigation of a South African Laurencia corymbosa J. Agardh, three new (a tricyclic keto-cuparane (7) and cuparanes (4, 5)) and five known (acetogenins, halo-chamigranes and additional cuparanes) secondary metabolites were isolated. This information can thus be used to assist in future chemotaxonomic investigations of these cryptic species. Marine algae are known to be excellent sources of antimicrobial compounds. Thus, the compounds were screened against several Gram-negative and Gram-positive strains with compounds 4 and 5 exhibiting an MIC of 1 µg/mL against the Gram-negative A. baumanii strain. In addition, compounds 1 and 3 showed potent activity at 1 µg/mL against the vancomycin-resistant E. faecalis. The bioactivity observed against drug-resistant strains such as E. faecalis and S. aureus subsp. aureus (methicillin resistant), highlights the importance of screening marine algae for compounds which have potential application against these pathogens.

4. Experimental Section

4.1. General Experimental Procedures

NMR experiments were performed on a Bruker® Avance 600 MHz spectrometer (Rheinstetten, Germany) using standard pulse sequences with CDCl3 as the solvent. All spectra were referenced according to residual proton residues in deuterated solvent (CHCl3 δH 7.26, CDCl3 δC 77.0). High-resolution gas chromatography electron impact mass spectrometry (HRGCEIMS) spectra were obtained using a Waters® GCT spectrometer (Milford, MA, USA) in positive mode using an oven ramp from 100 to 280 °C using an HP5 column, helium as the carrier gas (1 mL/min), and an injector temperature of 280 °C. HRESIMS (high-resolution electron spray ionisation mass spectrometry) spectra were obtained using a Waters® Synapt G2 spectrometer (Milford, MA, USA). The ionisation source varied between ESI+ and ESI depending on the compound analyzed, with a cone voltage of 15 V. The lock mass was set with Leucine enkephalin. Both sets of spectra were acquired at the Central Analytical Facility, University of Stellenbosch (Stellenbosch, South Africa). All solvents used were of chromatography grade (LiChrosolv®), obtained from Merck® (Darmstadt, Germany), while column chromatography was performed using Merck® Silica gel 60 (0.040–0.063 mm), (Darmstadt, Germany). HPLC was performed using a semi-preparative normal phase Whatman Partisil® 10 M9/50 (9.5 mm × 500 mm) column and a Rheodyne® manual injector containing a Waters® HPLC pump (Milford, MA, USA) with a Spectra physics® RI detector attached to a Ridenki® chart recorder.

4.2. Plant Material and Taxonomy

Laurencia corymbosa was collected by hand at Noordhoek beach in the south-east coastal region of South Africa in August 2013. All voucher specimens are kept in the seaweed sample repository at the School of Pharmacy, University of the Western Cape. Specimens from these collections were included in detailed taxonomic studies of the genus Laurencia in South Africa [36,37]. Though initially described in 1842, little was known about the species until it was demonstrated to be molecularly and morphologically distinct [37]. Although first described in South Africa, this species name has been used in various other world regions, including South-East Asia and the tropical Western Atlantic. Species names of seaweeds are often used erroneously outside of their regions of origin [38], and it seems likely that many of the latter records are misidentifications.

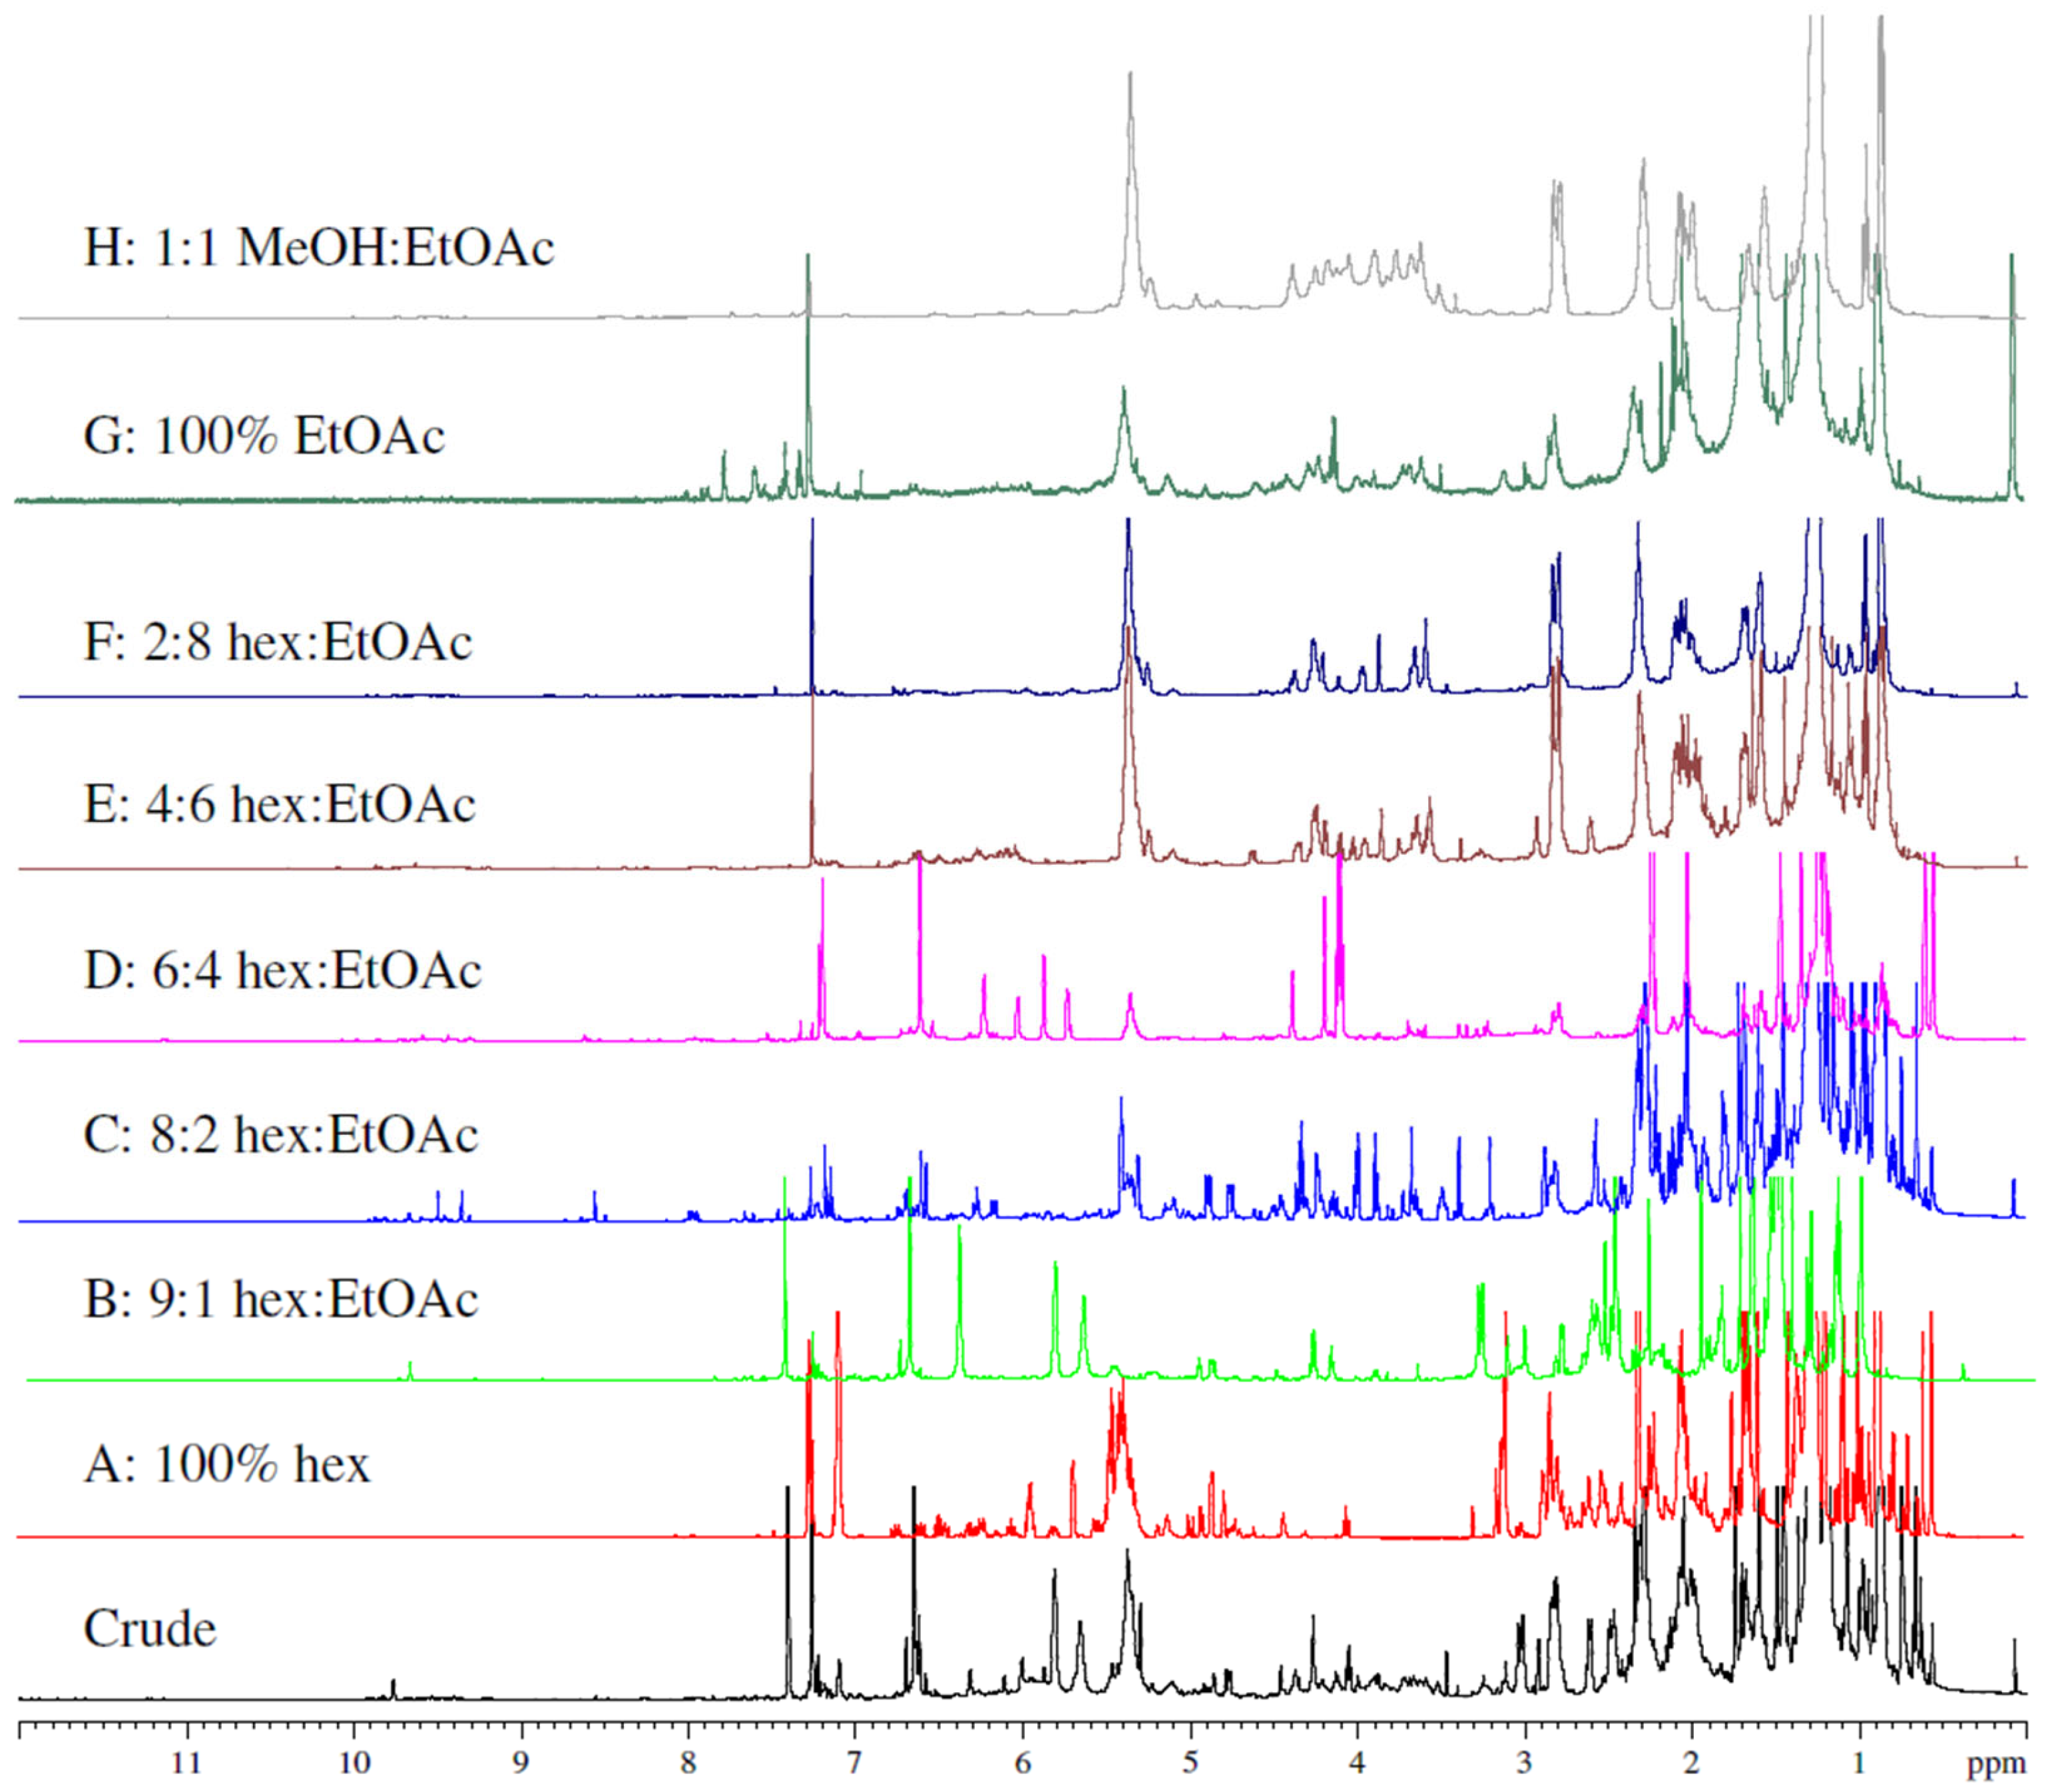
4.3. Extraction and Isolation

The algal material, with a dry mass of 41.6 g, was initially steeped in MeOH at room temperature for one hour, after which it was extracted three times with CH2Cl2-MeOH (2:1, 770 mL × 3) at a constant temperature of 40 °C. The quantity of solvent varied to completely submerge the algal material. The combined organic phases were collected (after an adequate amount of water was added for phase separation) and concentrated under reduced pressure to produce the crude extract (1.17 g, 3.9% dry wt).
Fractionation of the crude was further carried out via step gradient column chromatography using hexane-EtOAc (50 mL, per fraction) as an eluent to yield eight fractions (Scheme S1): A = 100% hexane; B = 9:1 hex-EtOAc, C = 8:2 hex-EtOAc, D = 6:4 hex-EtOAc, E = 4:6 hex-EtOAc, F = 2:8 hex-EtOAc, G = 100% EtOAc, H = 1:1 MeOH-EtOAc). Semi-preparative normal phase HPLC of fr A using hexane as the mobile phase resulted in the isolation of compound 3 while HPLC of fr B using EtOAc-hexane (1:19) as the mobile phase gave compounds 1, 4, and 7. Repeated column chromatography followed by normal phase HPLC using hexane-EtOAc (3:2 and 7:3) as the mobile phase allowed the purification of compounds 2, 5, 6, and 8.

Compounds Isolated from L. corymbosa

3-chloro-4,10-dibromo-7,8 epoxychamigrane (1): White plate-like crystals, 8 mg (yield 0.027%); 1H and 13C-NMR (CDCl3) data available in Table 5. As previously reported by Howard and Fenical (1975) [19].
Cleavage of the epoxy group in compound 1 to produce compounds 1a and 1b: Compound 1 (15 mg) was dissolved in dry Et2O (15 mL). In a separate round-bottomed flask, BF3·Et2O (2 mL) was added to Et2O (15 mL) and cooled to −70 °C in a dry ice/acetone bath. The previously prepared solution of compound 1 was gradually added to the BF3·Et2O solution, after which stirring occurred for 18 h under a N2 stream, allowing the vessel to slowly reach room temperature. The reaction mixture was quenched with NaHCO3 (30 mL), filtered, and dried under vacuum. The resultant crude mixture was purified via normal phase HPLC (4:1 Hex: EtOAc) yielding pure compounds 1a (6.1 mg, 40.6%) and 1b (2.3 mg, 15.3%).
3-chloro-9-hydroxy-4,10-dibromo-7,8-epoxychamigrane (2): White crystals, 2 mg (yield 0.007%); 1H and 13C-NMR (CDCl3) data available in Table S3. As previously reported by Elsworth and Thomson (1989) [24].
Neolaurencenyne ((3Z,6Z,9Z)-pentadeca-3,6,9-trien-1-yne) (3): 14.1 mg (yield 0.047%); 1H and 13C-NMR (CDCl3) data available in Table S4. As previously isolated by Kigoshi et al. (1981) [25].
4-bromo-5-methyl-2-(1,2,2-trimethylcyclopent-3-en-1-yl)phenol (4): Clear oil, 14.5 mg (yield 0.049%); [α]D25 + 93.2° (c = 0.005, MeOH); 1H and 13C-NMR (CDCl3) data available in Table 5; IR Vmax 3397; 2916; 1375 cm−1; HRGCEIMS m/z 294.0620 (Calculated for 294.0619); C15H1979BrO.
4-bromo-5-methyl-2-(1,2,2-trimethylcyclopent-3-en-1-yl)phenyl acetate (4a): White solid; [α]D25 + 61.2o (c = 0.002, MeOH); 1H and 13C-NMR (CDCl3) data available in Table S5; IR Vmax 3402; 2962; 2921; 1742 cm−1; HRGCEIMS, [M+H]+ m/z 337.0789 (calculated for 337.0803); C17H2179BrO2. Compound 4 (4 mg) was weighed out and placed in a round-bottomed flask with 10 drops of pyridine and 20 drops of acetic anhydride. The reaction mixture was left to stir overnight at ambient temperature, after which HCl (1M, 12 mL) was used to acidify the mixture. EtOAc (3 × 10 mL) was used to extract the resultant product, after which semi-preparative TLC was used (4:6 hex:EtOAc) to obtain the acetate derivative compound 4a.
4-bromo-2-[(1S*,5S*)-5-hydroxy-1,2,2-trimethylcyclopent-3-en-1-yl]-5-methylphenol (5): Clear oil, 4 mg (yield 0.013%); 1H and 13C-NMR (CDCl3) data available in Table 2; IR Vmax 3296; 2962; 2151; 1390 cm−1; HRGCEIMS [M-OH] m/z 293.0533 (calculated for 293.0541); C15H1979BrO2.
8-bromo-6-[(1R*,5S*)-2-hydroxy-1,5,5-trimethylcyclopent-3-en-1-yl]-9-methylphenol (6): Colourless oil, 6 mg (yield 0.020%); 1H and 13C NMR (CDCl3) data available in Table 2. As previously reported by Mann (2008) [31].
(3aS*,8bR*)-7-bromo-1,1,6,8b-tetramethyl-1,3,3a,8b-tetrahydro-2H-benzo[b]cyclopenta[d]furan-2-one (7): White crystals, 19.8 mg (yield 0.066%); [α]D25 − 86.5° (c = 0.008, MeOH); 1H and 13C-NMR (CDCl3) data available in Table 3; IR Vmax 2972, 1742, 1471, 1392 cm−1; HRGCEIMS m/z 308.0356 (calculated for 308.0412); C15H1779BrO2.
7-bromo-1,1,6,8b-tetramethyl-3a,8b-dihydro-1H-benzo[b]cyclo-penta[d] furan (8): Colourless oil, 3 mg (yield 0.010%); 1H and 13C-NMR (CDCl3) data available in Table S5. As previously reported by Mann (2008) [31].

4.4. Antimicrobial Activity Study

4.4.1. Preparation of the Extracts

The seaweed extract was re-dissolved in 1 mL ethyl acetate to a final concentration of 1 mg/mL.

4.4.2. Initial Antimicrobial Screening—Disk Diffusion Assays

Filter disks were sterilised by autoclaving and were impregnated with a 20 µg solution of the extract (20 µL of a 1 mg/mL solution per disk). Ten filter disks were prepared per sample tested. The filter disks were allowed to dry overnight. Control filter disks containing no additive, containing ethyl acetate, and containing ampicillin/vancomycin/actidione were used to ensure that the killing of the test strains was due to the extracts and not the organic solvent, that the filter disks were sterile, and that the strains could be killed when a standard antimicrobial was used.

4.4.3. Preparation of the Test Strains

The following strains were used to determine the antimicrobial activity of the extracts: Acinetobacter baumannii ATCC BAA-1605 (tryptic soy broth, TSB; Merck Millipore, MA, USA), Enterococcus faecalis ATCC 51299 (brain heart infusion broth supplemented with 4 μg/mL vancomycin; Merck Millipore), Escherichia coli ATCC 25922 (TSB), Staphylococcus aureus subsp. aureus ATCC 33591 (TSB), and Candida albicans ATCC 24433 (nutrient broth; Merck Millipore, Burlington. MA, USA). The strains were inoculated into 5 mL of the growth media indicated (prepared according to the manufacturer’s instructions) and incubated at 37 °C for 24 h. The optical density (OD) of the cultures was measured at 600 nm and the culture OD adjusted to 0.5 using sterile growth media prior to use in the disk diffusion assays. A measure of 100 µL of the culture was spread-plated onto agar media (the same as the growth media, but with 15 g/L bacteriological agar added) and the filter disks were placed on the agar plate prior to incubation at 37 °C for 24 h. Duplicate filters per sample were used. After 24 h of growth, the plates were examined for the presence of zones of inhibition.

4.4.4. Bioautography

The same test strains were used in the bioautography experiment. The same amount of sample was spotted in duplicate onto aluminum-backed silica gel 60 F254 thin layer chromatography (TLC) plates (Merck, Burlington, MA, USA) and allowed to dry. Sterile camera lens tissues were saturated with the test strains, and the tissue was placed over the TLC plate to allow for the transfer of the test strain. The TLC plates were placed in a plastic container containing moist paper towel and incubated at 37 °C for 24 h. The TLC plates were treated with the tetrazolium salt, i.e., 3-(4,5-dimethylthiazol-2-yl)-2,5-diphenyltetrazolium bromide (MTT) (0.25%, w/v in phosphate-buffered saline, PBS), re-incubated and evaluated for the appearance of purple spots (indicative of growth) or white spots (indicative of killing).

4.4.5. Liquid Assays

Measures of 400 µL of the 1 mg/mL solutions were transferred to new tubes and allowed to evaporate. The samples were resuspended in 1 mL DMSO to give a final concentration of 400 µg/mL for each sample. To determine the minimal inhibitory concentration (MIC) of the samples, several dilutions were prepared using 0.45–45 µL of sample in DMSO and made up to 180 µL with the culture to give final concentrations of 1–100 µg/mL. Vancomycin, ampicillin, or actidione was used as the positive control, while the sterile control simply contained distilled water, broth, and 50 µL of DMSO. The test strains were grown in optimal growth media as indicated previously. After 24 h of growth, the OD600 of the culture was determined and adjusted to 0.8 for the purpose of this experiment. The samples and cultures were dispensed into microtiter plates and incubated for 24 h at 37 °C. A measure of 20 µL of 0.25% (w/v) MTT in PBS was added to each well, and the plates were incubated at 37 °C for 3 h. A measure of 100 µL DMSO was added to each well and incubated at room temperature for 4 h. The OD of the samples was determined at 570 nm. The MIC was determined to be where all colour is lost as compared to the control containing the DMSO equivalent.

Supplementary Materials

The following supporting information can be downloaded at: https://www.mdpi.com/1420-3049/28/5/2063/s1, Figure S1. Images of Laurencia corymbosa (Francis, 2014) (a) habit, (b) cross section through the thallus with the outermost cortical cells and spaces between medullary and cortical cells in view and (c) cortical cells showing one corps en cerise per cell (40x magnification); Figure S2: 1H NMR spectrum (CDCl3, 600 MHz) of compound 1; Figure S3: 13C NMR spectrum (CDCl3, 150 MHz) of compound 1; Figure S4: 1H-1H COSY correlations of compound 1; Figure S5: Partial multiplicity-edited HSQC spectrum of compound 1 showing methylene correlations; Figure S6: Partial HMBC spectrum of compound 1 showing key correlations; Figure S7: Partial HMBC spectrum of compound 1 showing key correlations; Figure S8: NOESY NMR spectrum (CDCl3, 600 MHz) of compound 1; Figure S9: 1H NMR spectrum (CDCl3, 600 MHz) of compound 1a; Figure S10: 1H NMR spectrum (CDCl3, 600 MHz) of compound 1b; Figure S11: 13C NMR spectrum (CDCl3, 150 MHz) of compound 1b; Figure S12: 1H NMR spectrum (CDCl3, 600 MHz) of compound 2; Figure S13: 13C NMR spectrum (CDCl3, 600 MHz) of compound 2; Figure S14: 1H NMR spectrum (CDCl3, 600 MHz) of compound 3; Figure S15: 13C NMR spectrum (CDCl3, 150 MHz) of compound 3; Figure S16: NOESY NMR spectrum (CDCl3, 600 MHz) of compound 3; Figure S17: 1H NMR spectrum (CDCl3, 600 MHz) of compound 4; Figure S18: 13C NMR spectrum (CDCl3, 150 MHz) of compound 4; Figure S19: COSY NMR spectrum (CDCl3, 600 MHz) of compound 4; Figure S20: HSQC NMR spectrum (CDCl3, 600 MHz) of compound 4; Figure S21: HMBC NMR spectrum (CDCl3, 600 MHz) of compound 4; Figure S22: Partial HMBC spectrum of compound 4 showing key correlations; Figure S23: NOESY NMR spectrum (CDCl3, 600 MHz) of compound 4; Figure S24: HRGCEIMS spectra of compound 4; Figure S25: 1H NMR spectrum (CDCl3, 600 MHz) of compound 4a; Figure S26: 13C NMR spectrum (CDCl3, 150 MHz) of compound 4a; Figure S27: Expansion of the HRESIMS spectrum of compound 4a; Figure S28: 1H NMR spectrum (CDCl3, 600 MHz) of compound 5; Figure S29: 13C NMR spectrum (CDCl3, 150 MHz) of compound 5; Figure S30: COSY NMR spectrum (CDCl3, 600 MHz) of compound 5; Figure S31: HSQC NMR spectrum (CDCl3, 600 MHz) of compound 5; Figure S32: HMBC NMR spectrum (CDCl3, 600 MHz) of compound 5; Figure S33: NOESY NMR spectrum (CDCl3, 600 MHz) and key NOESY correlations for compound 5; Figure S34: HRGCEIMS spectrum of compound 5; Figure S35: 1H NMR spectrum (CDCl3, 600 MHz) of compound 6; Figure S36: 1H NMR spectrum (CDCl3, 600 MHz) of compound 7; Figure S37: 13C NMR spectrum (CDCl3, 150 MHz) of compound 7; Figure S38: COSY NMR spectrum (CDCl3, 600 MHz) of compound 7; Figure S39: HSQC NMR spectrum (CDCl3, 600 MHz) of compound 7; Figure S40: HMBC NMR spectrum (CDCl3, 600 MHz) of compound 7; Figure S41: NOESY NMR spectrum (CDCl3, 600 MHz) of compound 7; Figure S42: HRESIMS spectrum of compound 7; Figure S43: 1H NMR spectrum (CDCl3, 600 MHz) of compound 8. Compound 8 was isolated as a mixture with compound 7; Figure S44: 13C NMR spectrum (CDCl3, 150 MHz) of compound 8; Figure S45: COSY NMR spectrum (CDCl3, 600 MHz) of compound 8; Figure S46: HSQC NMR spectrum (CDCl3, 600 MHz) of compound 8; Figure S47: HMBC NMR spectrum (CDCl3, 600 MHz) of compound 8; Figure S48: NOESY NMR spectrum (CDCl3, 600 MHz) of compound 8; Table S1: NMR spectroscopic data of compound 1a; Table S2: NMR spectroscopic data of compound 1b; Table S3: NMR spectroscopic data of compound 2; Table S4: NMR spectroscopic data of compound 4a; Table S5: NMR spectroscopic data of compound 6; Table S6. NMR spectroscopic data of compound; Scheme S1. Isolation of compounds 18 from L. corymbosa.

Author Contributions

Conceptualization, D.R.B. and J.J.B.; methodology, D.R.B.; validation, D.R.B., J.J.B., J.F. and E.A.; formal analysis, J.F., J.J.B., D.R.B., M.L.R.-H. and K.A.D.; investigation, J.F.; resources, D.R.B. and M.L.R.-H.; writing—original draft preparation, E.A. and J.F.; writing—review and editing, D.R.B., J.F., E.A. and M.L.R.-H.; supervision, D.R.B.; project administration, D.R.B.; funding acquisition, D.R.B. All authors have read and agreed to the published version of the manuscript.

Funding

This research was funded by the National Research Foundation of South Africa, grant numbers 93639 and 138000.

Institutional Review Board Statement

Not applicable.

Informed Consent Statement

Not applicable.

Data Availability Statement

Data are contained within the article or supplementary material. The data presented in this study are available in the paper and supplementary material of this paper.

Conflicts of Interest

The authors declare no conflict of interest.

Correction Statement

This article has been republished with a minor correction to the supplemental data. This change does not affect the scientific content of the article.

References

  1. Papon, N.; Copp, B.R.; Courdavault, V. Marine drugs: Biology, pipelines, current and future prospects for production. Biotechnol. Adv. 2022, 54, 107871. [Google Scholar] [CrossRef]
  2. NIH US National Library of Medicine. ClinicalTrials.gov. 2000–2022. Available online: https://clinicaltrials.gov/ (accessed on 4 February 2023).
  3. NCI. NCI Thesaurus. 2022. Available online: https://ncit.nci.nih.gov/ (accessed on 4 February 2023).
  4. ACDREVIEW. Journal of Antibody-drug Conjugates. 2022. Available online: https://www.adcreview.com/ (accessed on 4 February 2023).
  5. Mayer, A. Marine Pharmacology. 2022. Available online: https://www.marinepharmacology.org (accessed on 4 February 2023).
  6. Newman, D.J. The “utility” of highly toxic marine-sourced compounds. Mar. Drugs 2019, 17, 324. [Google Scholar] [CrossRef]
  7. Gerwick, W.; Moore, B. Lessons from the past and charting the future of marine natural products drug discovery and chemical biology. Chem. Biol. 2012, 19, 85–98. [Google Scholar] [CrossRef]
  8. Zeng, Y.; Yang, D.; Qiu, P.; Han, Z.; Zeng, P.; He, Y.; Guo, Z.; Xu, L.; Cui, Y.; Zhou, Z.; et al. Efficacy of Heparinoid PSS in treating cardiovascular diseases and beyond—A review of 27 years clinical experiences in China. Clin. Appl. Thromb. Hemost. 2016, 22, 222–229. [Google Scholar] [CrossRef]
  9. Gao, Y.; Zhang, L.; Jiao, W. Marine glycan-derived therapeutics in China. Prog. Mol. Biol. Transl. Sci. 2019, 163, 113–134. [Google Scholar]
  10. Ventola, C.I. The antibiotic resistance crisis: Part 1: Causes and threats. Pharm. Ther. 2015, 40, 277–283. [Google Scholar]
  11. Leal, M.C.; Munro, M.H.G.; Blunt, J.W.; Puga, J.; Jesus, B.; Calado, R.; Rosa, R.; Madeira, C. Biogeography and biodiscovery hotspots of macroalgal marine natural products. Nat. Prod. Rep. 2013, 30, 1380–1390. [Google Scholar] [CrossRef]
  12. Harizani, M.; Ioannou, E.; Roussis, V. The Laurencia Paradox: An Endless Source of Chemodiversity. In Progress in the Chemistry of Organic Natural Products; Kinghorn, A.D., Falk, H., Gibbons, S., Kobayashi, J., Eds.; Springer International Publishing: Cham, Switzerland, 2016; Volume 102, pp. 91–252. [Google Scholar]
  13. Harizani, M.; Diakaki, D.I.; Perdikaris, S.; Roussis, V.; Ioannou, E. New C15 Acetogenins from Two Species of Laurencia from the Aegean Sea. Molecules 2022, 27, 1866. [Google Scholar] [CrossRef]
  14. Wang, B.-G.; Gloer, J.B.; Ji, N.-Y.; Zhao, J.-C. Halogenated organic molecules of Rhodomelaceae origin: Chemistry and biology. Chem. Rev. 2013, 113, 3632–3685. [Google Scholar] [CrossRef]
  15. Kubanek, J.; Jensen, J.P.R.; Keifer, P.A.; Sullards, M.; Collins, D.O.; Fenical, W. Seaweed resistance to microbial attack: A targeted chemical defense against marine fungi. Proc. Natl. Acad. Sci. USA 2003, 100, 6916–6921. [Google Scholar] [CrossRef]
  16. Moloney, M.G. Natural products as a source for novel antibiotics. Trends Pharmacol. Sci. 2016, 37, 689–701. [Google Scholar] [CrossRef]
  17. Wright, G.D. Opportunities for natural products in 21st century antibiotic discovery. Nat. Prod. Rep. 2017, 34, 694–701. [Google Scholar] [CrossRef]
  18. Fakee, J. The Isolation, Characterisation and Chemotaxonomic Significance of Secondary Metabolites from Selected South African Laurencia spp. Rhodophyta. Ph.D. Thesis, Rhodes University, Grahamstown (Makhanda), South Africa, 2015. [Google Scholar]
  19. Howard, B.M.; Fenical, W. Structures and chemistry of two new halogen-containing chamigrene derivatives from Laurencia. Tetrahedron Lett. 1975, 21, 1687–1690. [Google Scholar] [CrossRef]
  20. Cowe, H.J.; Cox, P.J.; Howie, R.A. Structure of 2,10-dibromo-3-chloro-7R,8S-epoxychamigrene. Z. Krist. Cryst. 1989, 188, 1–4. [Google Scholar]
  21. Ojika, M.; Shizuri, Y.; Yamada, K. A halogenated chamigrane epoxide and six related halogen-containing sesquiterpenes from the red alga Laurencia okamurai. Phytochemistry 1982, 21, 2410–2411. [Google Scholar] [CrossRef]
  22. Bano, S.; Ali, M.S.; Ahmad, V.U. Marine Natural Products; VI. A Halogenated Chamigrene Epoxide from the Red Alga Laurencia pinnatifida. Planta Med. 1987, 53, 508. [Google Scholar] [CrossRef]
  23. Crews, P.; Naylor, S.; Hanke, J.F.; Hogue, R.E.; Kho, E.; Braslau, R. Halogen regiochemistry and substituent stereochemistry determination in marine monoterpenes by carbon-13 NMR. J. Org. Chem. 1984, 49, 1371–1377. [Google Scholar] [CrossRef]
  24. Elsworth, J.F.; Thomson, R.H. A new chamigrane from Laurencia glomerata. J. Nat. Prod. 1989, 52, 893–895. [Google Scholar] [CrossRef]
  25. Kigoshi, H.; Shizuri, Y.; Niwa, H.; Yamada, K. Laurencenyne, a plausible precursor of various nonterpenoid C15-compounds, and neolaurencenyne from the red alga Laurencia okamurai. Tetrahedron Lett. 1981, 22, 4729–4732. [Google Scholar] [CrossRef]
  26. Norte, M.; Gonzalez, A.G.; Cataldo, F.; Rodriguez, M.L.; Brito, I. New examples of acyclic and cyclic C-15 acetogenins from laurencia pinnatifida. Reassignment of the absolute configuration for E and Z pinnatifidienyne. Tetrahedron 1991, 47, 9411–9418. [Google Scholar] [CrossRef]
  27. Dias, D.A.; White, J.M.; Urban, S. Laurencia filiformis: Phytochemical profiling by conventional and HPLC-NMR approaches. Nat. Prod. Commun. 2009, 4, 157–172. [Google Scholar] [CrossRef]
  28. Kladi, M.; Vagias, C.; Furnari, G.; Moreau, D.; Roussakis, C.; Roussis, V. Cytotoxic cuparene sesquiterpenes from Laurencia microcladia. Tetrahedron Lett. 2005, 46, 5723–5726. [Google Scholar] [CrossRef]
  29. Yu, X.Q.; He, W.F.; Liu, D.Q.; Feng, M.T.; Fang, Y.; Wang, B.; Feng, L.H.; Guo, Y.W.; Mao, S.C. A seco-laurane sesquiterpene and related laurane derivatives from the red alga Laurencia okamurai Yamada. Phytochemistry 2014, 103, 162–170. [Google Scholar] [CrossRef]
  30. Yamada, K.; Yazawa, H.; Uemura, D.; Toda, M.; Hirata, Y. Total synthesis of (±) aplysin and (±) debromoaplysin. Tetrahedron 1969, 25, 3509–3520. [Google Scholar] [CrossRef]
  31. Mann, M.G.A. An Investigation of the Antimicrobial and Antifouling Properties of Marine Algal Metabolites. Master’s Thesis, Rhodes University, Grahamstown, South Africa, 2008. [Google Scholar]
  32. Lategan, C.; Kellerman, T.; Afolayan, A.F.; Mann, M.G.; Antunes, E.M.; Smith, P.J.; Bolton, J.J.; Beukes, D.R. Antiplasmodial and antimicrobial activities of South African marine algal extracts. Pharm. Biol. 2009, 47, 408–413. [Google Scholar] [CrossRef]
  33. Vlachos, V.; Critchley, A.T.; von Holy, A. Antimicrobial activity of extracts from selected southern African marine macroalgae. S. Afr. J. Sci. 1997, 93, 328–332. [Google Scholar]
  34. Johansson, M.; Sterner, O.; Labischinski, H.; Anke, T. Coprinol, a new antibiotic cuparane from a Coprinus species. Z. Nat. C 2001, 56c, 31–34. [Google Scholar] [CrossRef]
  35. Li, H.-Y.; Yang, W.-Q.; Zhou, X.-Z.; Shao, F.; Shen, T.; Guan, H.-Y.; Zheng, J.; Zhang, L.-M. Antibacterial and Antifungal Sesquiterpenoids: Chemistry, Resource, and Activity. Biomolecules 2022, 12, 1271. [Google Scholar] [CrossRef]
  36. Francis, C.M. Systematics of the Laurencia complex (Rhodomelaceae, Rhodophyta) in South Africa. Ph.D. Thesis, University of Cape Town, Cape Town, South Africa, 2015. [Google Scholar]
  37. Francis, C.M.; Bolton, J.J.; Mattio, L.; Mandiwana-Neudani, T.G.; Anderson, R.J. Molecular systematics reveals increased diversity within the South African Laurencia complex (Rhodomelaceae, Rhodophyta). J. Phycol. 2017, 53, 804–819. [Google Scholar] [CrossRef]
  38. Bolton, J.J. The problem of naming commercial seaweeds. J. Appl. Phycol. 2020, 32, 751–758. [Google Scholar] [CrossRef]
Figure 1. Compounds 18 isolated (and derivatives produced) from the South African Laurencia corymbosa sp.
Molecules 28 02063 g001
Figure 2. 1H NMR spectra (CDCl3, 600 MHz) of the crude organic extract of L. corymbosa and the column fractions A–H. Abbreviations: Hex: hexane; EtOAc: ethyl acetate; MeOH: methanol.
Molecules 28 02063 g002
Figure 3. Key NOESY correlations for compound 1.
Molecules 28 02063 g003
Figure 4. 13C NMR shift comparisons for compound 1. All δC chemical shifts reported in CDCl3 [22,23]. Chemical shifts in dispute are highlighted in yellow.
Molecules 28 02063 g004
Scheme 1. Epoxy cleavage of compound 1. Conditions: (i) BF3 Et2O in anhydrous Et2O. Stirred for 18 h from −78 °C to RT (room temperature). NMR data are available in the supplementary information.
Molecules 28 02063 sch001
Figure 5. Partial substructures A and B followed by the elucidation of compound 5 with sub-structures A and B attached via a furan ring.
Molecules 28 02063 g005
Figure 6. Proposed biosynthetic pathway of compounds 4, 5, 8, and 7.
Molecules 28 02063 g006
Table 1. NMR spectroscopic data for compound 4.
Atom
No.
δC (Mult.)δH, Mult, J (Hz)COSYHMBC
156.3 (C)---
2a47.6 (CH2)3.01, d, 16.1H2b-
2b2.50, d, 16.1H2a-
3126.8 (CH)5.83, br sH2a, H2bC1 1
4144.3 (CH)5.67, br sH2a, H2b 1-
549.9 (C)---
6133.4 (C)---
7132.0 (CH)7.41, sH12, H15C5, C8, C9, C11, C15
8114.7 (C)---
9136.5 (C)---
10119.0 (CH)6.65, sH15C6, C8, C11, C15
11154.1 (C)---
1225.3 (CH3)1.47, s-C1, C2, C5, C6
1325.9 (CH3)1.19, s-C41, C5, C14
1424.9 (CH3)0.75, s-C4, C5, C13
1522.1 (CH3)2.30, sH7, H10C8, C9, C10
1 Indicates a weak correlation. Abbreviations: Mult.—multiplicity; COSY—Correlation Spectroscopy; HMBC—Heteronuclear Multiple Bond Correlation.
Table 2. NMR spectroscopic data for compound 6 as a mixture with 5.
56
Atom No.δCδH, Mult, J (Hz)NOESYδCδH, Mult, J (Hz)NOESY
155.2--56.0--
285.34.50, d, 7.4H12, H1385.64.28, br sH14
3131.85.92, d, 5.5H4131.06.02, d, 5.5H4
4141.46.13, d, 5.5H3 144.66.33, d, 5.5H3
548.9--47.1--
6128.7--129.7--
7132.27.27, sH12132.17.26, sH12
8115.5--115.1--
9137.3--137.0--
10119.76.64, sH15119.06.62, s-
11154.0--153.8--
1223.41.38, sH2, H7, H1326.41.49, sH7, H13
1323.41.19, br sH2, H12, H1418.81.22, sH12, H14
1420.30.66, sH1327.10.66, sH2, H13
1522.22.30, sH1022.32.29, sH10
Abbreviations: Mult.—multiplicity; NOESY—Nuclear Overhauser Effect Spectroscopy.
Table 3. NMR spectroscopic data for compound 7.
Atom No.δC (Mult.)δH, Mult, J (Hz)COSYHMBCNOESY
189.1 (CH)4.86, dd, 6.9, 3.5H2-H2, H12, H14
240.7 (CH2)2.82, mH1C3H12, H13
3218.5 (C)----
451.9 (C)-- --
555.2 (C)----
6132.1 (C)----
7127.6 (CH)7.23, s-C9, C11H12, H13, H14
8115.4 (C)----
9138.3 (C)----
10112.4 (CH)6.69, sH15C15H15
11159.2 (C)----
1221.8 (CH3)1.32, s-C1, C4, C5, C6H1, H2, H7
1323.1 (CH3)0.86, sH1, H2C3, C4, C5, C14H2, H7
1420.2 (CH3)1.08, s-C3, C4, C5, C13H1
1523.3 (CH3)2.34, s-C8, C9, C10-
Abbreviations: Mult.—multiplicity; COSY—Correlation Spectroscopy; HMBC—Heteronuclear Multiple Bond Correlation; NOESY—Nuclear Overhauser Effect Spectroscopy.
Table 4. Antimicrobial data for the crude extract and the compounds isolated. MIC values are given in μg/mL, while the disk diffusion (in mm2) and bioautography results are also shown.
AbEfEcSaCa
SampleMIC (μg/mL)dd
(Ba)
MIC (μg/mL)dd
(Ba)
MIC (μg/mL)dd
(Ba)
MIC (μg/mL)dd
(Ba)
MIC
(μg/mL)
dd
(Ba)
1--1-100--18.85--
2--100----30.63--
3--1-------
41(rg)100(rg)--5076.18-24.74 (rg)
4a--100-100-----
51--(rg)---(rg)-(rg)
6--100(rg)---24.74 (rg)-(rg)
7----100-----
crude---(rg)100--31.42--
Vancomycin100-100-100-20-100-
Ampicillin100-1-1->100-100-
Actidione100-50-100-100->100-
Ab: Acinetobacter baumannii ATCC BAA-1605; Ef: Enterococcus faecalis ATCC 51299; Ec: Escherichia coli ATCC 25922; Sa: Staphylococcus aureus subsp. aureus ATCC 33591; Ca: Candida albicans ATCC 24433. MIC (μg/mL): minimum inhibitory concentration; dd: Disk diffusion (mm2); in parentheses: Ba: Bioautography (rg = with regrowth). -: no activity observed.
Table 5. NMR spectroscopic data for compound 1.
Atom No.δC (Mult.)δH, Mult, J (Hz)COSYHMBCNOESY
1a26.2 (CH2)1.67, dq, 15.2, 5.7H1b, H2a-H1b, H13, H14
1b1.98, dt, 15.2, 5.7H1a, H2a, H2b-H1a, H13
2a40.4 (CH2)2.47, dt, 14.6, 5.7H1a, H1bC1, C3, C15H2b, H14
2b2.38, dd, 14.6, 2.9H1bC1, C3, C4, C6, C15H2a, H15
371.1 (C)----
462.1 (CH)4.77, dd, 13.3, 4.7H5a, H5bC3, C5, C15H5a, H14
5a39.1 (CH2)2.84, br d, 13.3H4, H5b-H4
5b2.10, t, 13.3H4, H5aC4, C7, C6, C11H1a, H12, H13, H15
644.6 (C)----
762.0 (C)----
862.0 (CH)2.92, t, 3.0H9C9, C10, C14H9, H14
932.7 (CH2)2.61, dd, 7.7, 3.0H8, H10C7/8, C10, C11H8, H10, H12, H13
1057.6 (CH)4.06, t, 7.7H9, H12C6, C8, C9, C12, C13H1a, H9, H13
1142.3 (C)----
1221.3 (CH3)1.18, sH10C6, C11, C13H5a, H5b, H9
1327.3 (CH3)1.08, s-C6, C11, C2H1a, H1b, H5b, H15
1425.8 (CH3)1.50, s-C6, C7/8H2a, H4, H8
1524.0 (CH3)1.74, s-C2, C3, C4H1a, H2b, H5b, H13
Abbreviations: Mult.—multiplicity; COSY—COrrelation SpectroscopY; HMBC—Heteronuclear Multiple Bond Correlation NOESY—Nuclear Overhauser Effect SpectroscopY.
Disclaimer/Publisher’s Note: The statements, opinions and data contained in all publications are solely those of the individual author(s) and contributor(s) and not of MDPI and/or the editor(s). MDPI and/or the editor(s) disclaim responsibility for any injury to people or property resulting from any ideas, methods, instructions or products referred to in the content.

