Abstract
The shortage of water resources has always been one of the most difficult problems that perplexes humanity. Solar steam generation (SSG) has been a new non-polluting and low-cost water purification method in recent years. However, the high cost of traditional photothermal conversion materials and the low efficiency of photothermal conversion has restricted the large-scale application of SSG technology. In this work, composite materials with Fe3O4 nanospheres attached to MoS2 nanosheets were synthesized, which increased the absorbance and specific surface area of the composite materials, reduced the sunlight reflection, and increased the photothermal conversion efficiency. During the experiment, the composite material was evenly coated on cotton. The strong water absorption of cotton ensured that the water could be transported sufficiently to the surface for evaporation. Under one sun irradiation intensity, the evaporation rate of the sample synthesized in this work reached 1.42 kg m−2 h−1; the evaporation efficiency is 89.18%. In addition, the surface temperature of the sample can reach 41.6 °C, which has far exceeded most photothermal conversion materials. Furthermore, the use of this composite material as an SSG device for seawater desalination and sewage purification can remove more than 98% of salt ions in seawater, and the removal rate of heavy metal ions in sewage is close to 100%, with a good seawater desalination capacity and sewage purification capacity. This work provides a new idea for the application of composite materials in the field of seawater desalination and sewage purification.
1. Introduction
Since the twentieth century, with the continuous growth of the global population and the development of industry, although water resources on the earth are very abundant, freshwater resources only account for 2.5%. The shortage of freshwater resources has gradually become one of the problems that people need to solve urgently [1,2]. Efficient, inexpensive, and convenient access to freshwater resources is the goal pursued by numerous scholars [3,4], that can be used directly by humans, which has attracted the attention of many scholars [5].
The high-efficiency strategy of the SSG system is to improve the rate of water evaporation; the main ways to accomplish this are as follows: (1) Increase the rate of water transportation [6]. (2) Improve the photothermal conversion efficiency of photothermal conversion materials [7]. (3) Improve the light absorption performance of photothermal conversion materials. (4) Reduce the heat loss of the system and reduce the salt deposition on the evaporation surface. In response to the above key points, many scholars have proposed approaches to solve them. For example, Tao et al. reported a semiconductor composite material based on 3D CuS nanoflowers. Nanoflower composites with 3D morphology can be in contact with more sunlight, increasing the photothermal conversion efficiency of the materials [8]. Kim et al. used Ni to deposit a self-aggregating alumina nanowire structure to prepare a broadband solar energy absorption surface, and the light absorption property of the material is then improved [9]. He et al. made a renewable SSG material based on cellulose composite aerogels with cellulose nanofibers as the skeleton and polyethylene imine as the binder. The material has a strong water absorption, which can ensure sufficient water transmission to the evaporation interface [10]. Li et al. prepared a unique Janus photothermal material using Fe3O4 nanoparticles and carbon aerogel. In that aerogels can provide a fast water supply, Fe3O4 has good photothermal conversion properties, and the material also effectively retards salts deposition [11]. Many scholars have proposed methods to improve the water evaporation rate, few have achieved a high evaporation rate, low cost, and green environmental protection at the same time. Therefore, this work is focused on the synthesis of a material with high water evaporation performance and low cost.
Due to its high stability, low thermal conductivity, and high water absorption, cotton is an ideal material for water transmission and heat insulation. Under the effect of the capillary phenomenon, water will be transported through cotton to the water evaporation interface, and will soon be transported to the entire light receiving layer. Also, because cotton has good thermal insulation, it will separate sunlight from water, prevent sunlight from contacting directly with water, and improve the efficiency of light–heat conversion of materials [12]. In terms of photothermal conversion materials, MoS2 has quickly become the object of many scholars’ research because of its good photothermal conversion performance, mechanical properties, large specific surface area, good stability, strong adsorption, and low price. The research shows that MoS2 has good light absorption performance, and can absorb 5–10% of the sun’s light in a single layer of MoS2 with a thickness of less than 1 nm [13,14]. Although MoS2 has a strong absorbance, its surface morphology is similar to graphene and is layered, so it will reflect sunlight to some extent and reduce the absorption rate of sunlight. Furthermore, MoS2 has a high rate of photogenerated carrier recombination, and the sunlight absorbed by MoS2 will be partially converted into chemical energy, so the growth of nanoparticles in MoS2 semiconductor materials is conducive to improving its photothermal conversion efficiency [15]. For example, Zhang et al. used the hydrothermal method to achieve Zn-doped MoS2 to prepare Zn-MoS2 to achieve higher solar absorption, and then used Zn-MoS2 to improve the evaporation performance of sorghum straw, which has a high innovation and practical prospect [16]. Fe3O4 is a typical narrowband semiconductor with a strong photothermal conversion efficiency in the visible band. If Fe3O4 is grown on the surface of MoS2 to prepare Fe3O4@MoS2 composite material, the combination of the N-type narrowband gap semiconductor Fe3O4 and MoS2 will further broaden the optical conversion wavelength range of MoS2 and improve sunlight utilization [17,18,19]. The N-type semiconductor Fe3O4 and the P-type semiconductor MoS2 will form a P-N heterostructure at the contact point, which can improve the photothermal conversion performance of the composite [20,21,22,23].
Here, we report the hydrothermal synthesis of Fe3O4@MoS2 materials for seawater desalination and sewage treatment. The material was applied uniformly to the cotton surface as a photothermal conversion layer of the SSG for desalination and sewage purification. Using a hydrothermal method to grow Fe3O4 nanospheres on MoS2 nanosheets, two kinds of particles would form a P-N heterostructure at the contact point, enhancing the performance of photothermal conversion. Furthermore, using cotton as a support for the photothermal conversion material, hydrophilic cotton and hydrophobic Fe3O4@MoS2 composed the photothermal conversion layer, cotton hydrophilicity provided a path for water and salt diffusion, and hydrophobic Fe3O4@MoS2 played a role in hindering water and thermal insulation. Simulated seawater with a mass fraction of 3.5 wt% was used as the water source to be desalinated. Under one sun irradiation, the evaporation rate was 1.42 kg m−2 h−1, and the evaporation efficiency was 89.18%. This SSG device can almost completely remove heavy metal ions, soluble organics, and oils from seawater and sewage.
2. Results and Discussion
2.1. Characterization of Samples
The morphology and microstructure of Fe3O4, MoS2, Fe-Mo-1, and Fe-Mo-2 observed by SEM are shown in Figure 1a–f. Figure 1a shows the microscopic images of Fe3O4 magnified 20k times. It can be seen that the nano-Fe3O4 sample prepared in this work is spherical, the diameter of the spheres is not uniform, the average is about 200 nm, the surface of the nanospheres is rough, and the compact between the nanospheres makes the comparison area of the samples smaller. Figure 1b shows the microscopic image of MoS2 magnified 20k times. It can be seen that MoS2 is flaky with a smooth surface and each piece is irregular in shape and size. Figure 1c,d shows the microscopic images of the Fe-Mo-1 sample magnified 10k and 20k times, respectively. It can be found that Fe3O4 nanospheres were grown on MoS2 nanosheets and the density of the nanospheres decreased so that more surfaces of the nanospheres were exposed, making the comparative area of the Fe-Mo-1 sample increase and sunlight be more easily absorbed, so this sample has a higher potential for solar absorbance [24]. Figure 1e,f shows the microscopic images of sample Fe-Mo-2 magnified 10k and 20k times, respectively. The figure shows that the nanoparticles on the surface of the sample are denser compared to those of Figure 1c,d, which is mainly due to the higher Fe3O4 content in the reactants.
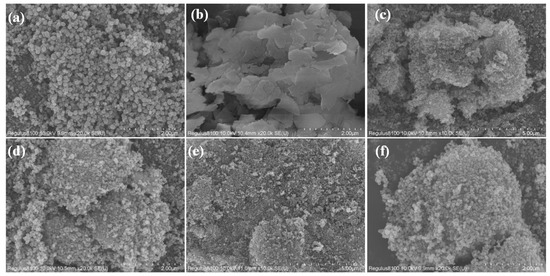
Figure 1.
SEM of (a) Fe3O4 at 20k times, (b) MoS2 at 20k times, (c) Fe-Mo-1 at 10k times, (d) Fe-Mo-1 at 20k times, (e) Fe-Mo-2 at 10k times and (f) Fe-Mo-2 at 20k times.
The XRD patterns of the Fe3O4, MoS2, and Fe-Mo-1 samples are shown in Figure 2a. The diffraction peaks of Fe3O4 prepared in this work appear mainly at 30.12°, 35.48°, 43.12°, 53.50°, 57.03°, and 62.62°, corresponding to the characteristic peak planes of (220), (311), (400), (422), (511), and (440), respectively (JCPDS: 88-0866). The diffraction peaks of MoS2 appear mainly at 14.40°, 32.70°, 33.52°, 39.57°, 44.18°, 49.82°, 58.36°, and 60.45°, respectively, corresponding to (002), (100), (101), (103), (006), (105), (110), and (112) characteristic peak planes (JCPDS: 87-2416). The characteristic peaks of Fe3O4 and MoS2 appear in the XRD patterns of the Fe-Mo-1 composite sample, which indicates that Fe3O4 and MoS2 are contained in the sample. As can be seen by the characteristic peak contrast, the intensity of the characteristic peak of MoS2 was slightly enhanced. This may be due to the absence of water inclusion in the MoS2 crystals after the hydrothermal reaction, which makes the crystals tighter and diffract more strongly between each other. There is no obvious change in the characteristic peaks of Fe3O4 [25]. The solar absorption rate of the samples directly determines the working efficiency of the SSG device. A UV-Vis-NIR spectrometer is used to determine the solar absorption rate of Fe-Mo-1, Fe-Mo-2, Fe3O4, MoS2, and cotton, and the measurement results are shown in Figure 2b. The absorption rates of Fe-Mo-1, Fe-Mo-2, Fe3O4, MoS2, and cotton at 200–2500 nm are approximately 97.11%, 96.19%, 94.6%, 89.71%, and 39.76%, respectively. The absorption rates of MoS2 and Fe3O4 were similar to those of the references [20,26]. As expected, both MoS2 and Fe3O4 showed high absorption. The Fe3O4 absorption rate can be found to be better than that of MoS2. This may be because the surface of the Fe3O4 nanosphere is rough, while the surface of the MoS2 nanosheet is smooth, which will reflect some of the sunlight. However, the light absorption of the Fe-Mo-1 and Fe-Mo-2 samples is better than that of Fe3O4 and MoS2; this is mainly due to the fact that Fe3O4 nanospheres are attached to the surface of MoS2 nanosheets, which increases the specific surface area of the sample and increases the contact area with sunlight, thus increasing the light absorption rate. The light absorption of Fe-Mo-1 is slightly better than that of Fe-Mo-2, which is mainly caused by the different content of Fe3O4 attached to the surface of MoS2. The author has done many experiments and found that it is not the higher the Fe3O4, the better the light absorption of the composite, nor the higher the MoS2, the better the light absorption of the composite, but the existence of the best proportion that can make the composite achieve the best light absorption.
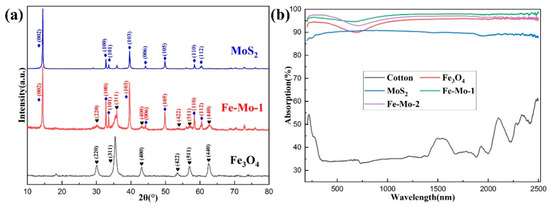
Figure 2.
(a) XRD peaks of Fe3O4, MoS2, and Fe-Mo-1. (b) Optical absorption spectra of cotton, Fe3O4, MoS2, Fe-Mo-1, and Fe-Mo-2.
2.2. Photothermal Conversion Performance Test
The physical picture of the SSG test device in the laboratory is shown in Figure 3a. The evaporation performance of Fe-Mo-1, Fe-Mo-2, Fe3O4, MoS2, cotton, and seawater samples was tested, and the evaporation performance of all samples was analyzed and compared. The test results are shown in Figure 3b. It can be clearly seen from the figure that, under one sun irradiation, after one hour’s test, the mass change of pure seawater and cotton is less, which is 0.29 kg m−2 and 0.52 kg m−2, respectively. When Fe3O4 and MoS2 samples are used for the tests, the mass change is increased to a certain extent; they are 1.26 kg m−2 and 1.19 kg m−2, respectively. The mass change of Fe-Mo-1 and Fe-Mo-2 is greater than that of pure Fe3O4 and pure MoS2, which are 1.42 kg m−2 and 1.33 kg m−2, respectively. According to the calculation method described in Formula (1), the evaporation rates of several samples can be obtained in descending order as follows: Fe-Mo-1 (1.42 kg m−2 h−1), Fe-Mo-2 (1.33 kg m−2 h−1), Fe3O4 (1.26 kg m−2 h−1), MoS2 (1.19 kg m−2 h−1), cotton (0.52 kg m−2 h−1), and seawater (0.29 kg m−2 h−1). Furthermore, according to Formula (2), the evaporation efficiency of four samples can be calculated as follows: Fe-Mo-1 (89.18%), Fe-Mo-2 (83.52%), Fe3O4 (79.13%), MoS2 (74.73%), cotton (32.66%) and seawater (18.21%) (Figure 3c). To verify the stability of the photothermal conversion performance of the prepared Fe-Mo-1 sample, 10 cyclic tests were performed under the condition that the external conditions remained unchanged, as shown in Figure 3d. The average evaporation rate and evaporation efficiency of the 10 experiments were respectively obtained as 1.418 kg m−2 h−1 and 89.1%. It can be seen that the photothermal conversion performance of the sample is relatively stable. On the basis of the above data, it can be seen that the Fe3O4@MoS2 produced in this work has better water evaporation performance than pure Fe3O4 and pure MoS2, and higher photothermal conversion performance under the same irradiation intensity. Figure 3e shows the comparison of the evaporation efficiency and evaporation rate of this work with different literature under one sun irradiation. It can be seen that this work is better than most reported studies [8,12,19,24,27,28,29,30,31,32,33].
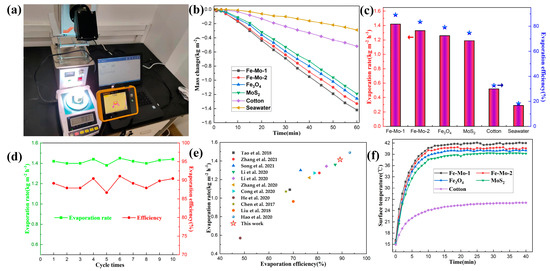
Figure 3.
(a) Physical picture of the SSG test device in the laboratory. (b) Variation of the change in seawater mass with time for different samples under one sun irradiation. (c) Seawater evaporation rate and efficiency of different samples under one sun irradiation (The bar graph corresponds to the evaporation rate on the left axis and the pentagram corresponds to the evaporation efficiency on the right axis). (d) Cyclic experiment of the Fe-Mo-1 sample under one sun irradiation. (e) Comparison of the evaporation rate and efficiency of the Fe-Mo-1 with other literature (The top to bottom plots correspond to refs. [8,12,19,27,28,29,30,31,32,33,34], respectively). (f) Trend chart of surface temperature changes over time for different samples during the SSG test.
In order to measure the trend of surface temperature variation of different samples under one sun irradiation, the photothermal conversion performance of the samples was reflected. In the evaporation experiment of different samples, the infrared radiation imager is used to record the temperature changes on the surface of the samples, and the curve of the changes is shown in Figure 3f. In the figure, the temperature of the cotton surface is the slowest and the surface temperature of the other four samples rises faster. In the first five minutes, the surface temperature of Fe-Mo-1, Fe-Mo-2, Fe3O4, MoS2, and cotton increased by 19.6 °C, 19.1 °C, 18.9 °C, 17.4 °C, and 7.1 °C, respectively. The first three samples have the highest temperature increase, including Fe3O4, which shows that Fe3O4 has good photothermal conversion performance. The temperature of all samples began to rise relatively slowly between 5 min and 10 min. The temperature of the first four samples increased by about 5 °C on average, while the temperature of cotton rose less, by about 2 °C. After 10 min, the surface temperature of all samples began to become stable. When the temperature of the sample surface is stable, it can be found that the surface temperature of the Fe-Mo-1 sample is higher than that of Fe-Mo-2, Fe3O4, MoS2, and cotton by 1.4 °C, 2 °C, 2.8 °C, and 15.9 °C, respectively [34]. Figure 4 shows the infrared imaging of five different samples under one sun radiation for 0 min, 1 min, 5 min, 10 min, and 20 min. The above data confirmed the good photothermal conversion performance of Fe-Mo-1.
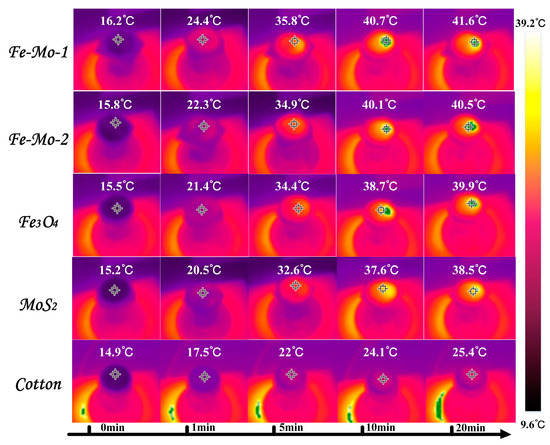
Figure 4.
Infrared radiation images of different samples at different times in the test process.
Figure 5a shows the curves of seawater mass changes in 60 min under 1, 2, and 3 sun irradiations using the Fe-Mo-1 sample. It can be seen from the figure that the greater the light intensity, the greater the loss of seawater quality. Under 1, 2, and 3 sun irradiation, the mass change for 60 min is 1.42 kg m−2, 2.56 kg m−2, and 3.58 kg m−2, respectively, indicating that the mass change is not linear with light intensity. According to the calculation, the seawater evaporation rates under 1, 2, and 3 sun irradiation are 1.42 kg m−2 h−1, 2.56 kg m−2 h−1, and 3.58 kg m−2 h−1, respectively, and the evaporation efficiency is 89.2%, 80.4%, and 74.9%, respectively (Figure 5b). With an increase in light intensity, the evaporation efficiency decreases. This is mainly because the stronger the light intensity, the higher the temperature of the sample surface will be, and then the intensity of thermal convection and thermal radiation will increase. At the same time, the more reflection of solar light there will be, the stronger the solar light intensity will be, and the lower the evaporation efficiency will be [35]. Figure 5c shows the trend of surface temperature variation with time during the evaporation of the Fe-Mo-1 sample under 1, 2, and 3 sun irradiation, respectively. The temperature of the sample Fe-Mo-1 surface has a similar overall change trend under different sun irradiations; the temperature rises very fast in the first 5 min, rises slowly between 5 min and 10 min, and tends to stabilize after 10 min. After the temperature of the sample surface stabilized, it was found that the temperature of the sample surface under 2 and 3 sun irradiations was higher than that of the sample surface under 1 sun irradiation by 10 °C and 14 °C, respectively; nor was the magnitude of the rise in visible temperature and light intensity linear, further confirming that the stronger the light intensity, the lower the photothermal conversion efficiency would be.
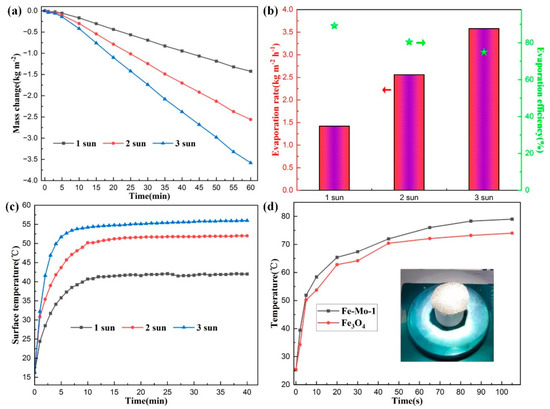
Figure 5.
(a) The mass change of the Fe-Mo-1 sample with time under 1, 2, and 3 sun irradiation, respectively. (b) Evaporation rate and evaporation efficiency of Fe-Mo-1 under 1, 2, and 3 sun irradiation, respectively (The bar graph corresponds to the evaporation rate on the left axis and the pentagram corresponds to the evaporation efficiency on the right axis). (c) The surface temperature trend diagram of Fe-Mo-1 with time under 1, 2, and 3 sun irradiation. (d) Time dependent trend graph of surface temperature under 1 sun irradiation for Fe-Mo-1 (dried) and Fe3O4 (dried); inset is the physical picture of the sample at the time of experiment.
To further verify that the photothermal conversion efficiency of the Fe-Mo-1 compound synthesized in this work is higher than that of Fe3O4, the two dried samples were placed under 1 sun irradiation for testing, respectively, and the real-time trend graphs of the changes in surface temperature over time for the two samples were taken as shown in Figure 5d, and the inset is the physical picture at the time of sample testing. The temperature on the surface of both samples in the first 30 s rises very quickly, followed by a temperature rise that starts to slow down, and the temperature starts to approach a plateau after 80 s. Overall, the sample surface temperature after stabilization of Fe-Mo-1 is higher than that of Fe3O4 by approximately 5 °C, confirming the better photothermal conversion efficiency of Fe-Mo-1. Figure 6 presents the infrared radiation images of the two samples at different times.
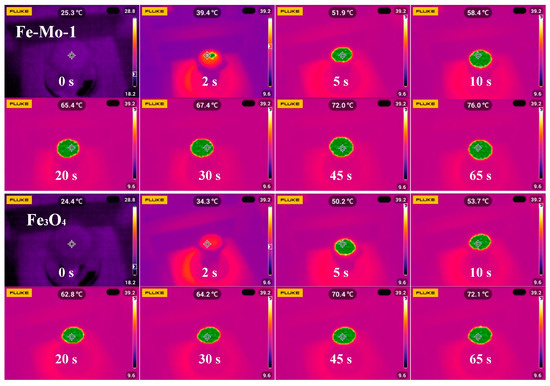
Figure 6.
Infrared radiation images of Fe-Mo-1 (dried) and Fe3O4 (dried) at different times during the experiment.
The main reasons for the good photothermal conversion rate of Fe-Mo-1 are as follows: (1) Both MoS2 and Fe3O4 have a strong photothermal conversion performance themselves, although the smooth MoS2 surface reflects a large amount of sunlight and reduces its photothermal conversion performance; Fe3O4 nanospheres attached to the MoS2 nanosheets increase the specific surface area of the composite sample greatly, also reducing the reflection of sunlight and reducing heat conduction and thermal radiation loss, increasing the photothermal conversion efficiency [36]. (2) The sample was evenly spread on cotton, which has strong water absorption and can transmit enough seawater to the sample in real time to complete evaporation [37].
2.3. Water Treatment Performance
Figure 7a shows the physical map for the outdoor SSG test setup in the laboratory, below which an electronic weight is placed, which is used to measure the mass change of water during the experiment. The schematic diagram of the test setup is shown in Figure 7b; the Fe-Mo-1 sample was placed on the polyethylene foam surface, using both ends of the cotton wick to connect the sample and seawater, respectively, which guaranteed that seawater could be adequately transmitted to the photothermal conversion layer. The role of polyethylene foam is to prevent direct sunlight and seawater/sewage contact, which can effectively reduce the loss of sunlight. Once the seawater evaporates, steam is pumped to the inside of the device, which is subsequently cooled into small drops that slip along the device into a beaker to complete the collection [38,39].
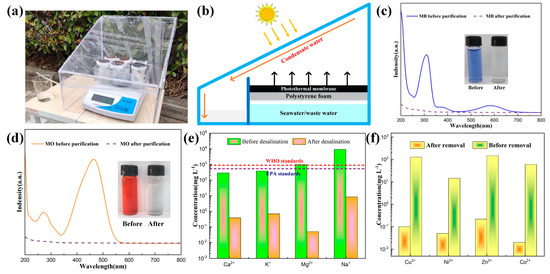
Figure 7.
(a) Physical map of the SSG apparatus for outdoor measurements. (b) Schematic diagram of the outdoor SSG apparatus. (c) Solar absorption spectra before and after MB solution purification; inset shows the photos before and after MB solution purification. (d) Solar absorption spectra before and after MO solution purification; inset shows the photos before and after MO solution purification. (e) Comparison of ion concentrations in a simulated seawater solution before and after desalination. (f) Comparison of the concentrations of heavy metal ions in the sewage solution before and after purification.
To verify the decontamination capacity of the SSG setup for sewage, the Fe-Mo-1 sample was used as the photothermal conversion layer. Figure 7c shows the sunlight absorption spectrum of the MB solution before and after purification, and the illustration shows the comparison of the MB images before and after purification. Figure 7d shows the absorption spectrum of sunlight before and after MO purification, and the illustration shows the comparison of MO before and after purification [40]. It can be found that the absorption rates of MO and MB are close to 0 after purification, and the purified sewage becomes transparent and clear; it is visible that the SSG apparatus has a good outcome for the purification of sewage. Figure 7e shows the comparison of the concentrations of Ca2+, K+, Mg2+, and Na+ in simulated seawater solution (a mass fraction of 3.5 wt%) before and after desalination. After desalination, the concentrations of several ions decreased by 3, 3, 4, and 3 orders of magnitude, respectively (Table 1). The ion concentration before desalination is far beyond the WHO standard, and after desalination, the ion concentration reaches the international standard for drinking water. The concentration of heavy metal ions Cu2+, Ni2+, Zn2+, and Co2+ in the sewage solution decreased by 3, 3, 3, and 4 orders of magnitude, respectively (Figure 7f, Table 2), indicating that the heavy metal ions in the sewage solution have been almost removed [41,42]. In addition, it has been shown that the sample and the SSG device fabricated in this work are an effective method for water purification.

Table 1.
Concentrations of Ca2+, K+, Mg2+, and Na+ ions in solutions before and after desalination.
Table 2.
Concentrations of Cu2+, Ni+, Zn2+, and Co2+ ions in solution before and after purification.
The quality of water can also be expressed using resistance values obtained from resistance tests performed at a constant distance with the multimeter electrode [43]. As shown in Figure 8, the resistances measured for the configured simulated seawater and the real seawater are 36.73 kΩ and 36.84 kΩ, respectively, indicating that the configured simulated seawater and the real seawater have similar ion concentrations. The simulated seawater and deionized water resistance after desalination were both measured to be 1.05 MΩ, which illustrated that seawater was effectively desalinated.
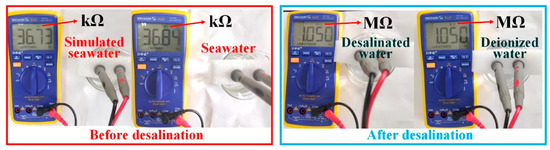
Figure 8.
Comparison of resistance values of different water quality tested with a multimeter.
3. Experimental Section
3.1. Materials
Both ethylene glycol and diethylene glycol were purchased from Xilong Science Co., Ltd. (Shenzhen, China), and MoS2 was purchased from Shanghai Macklin Biochemical Co., Ltd. (Shanghai, China). Both sodium acetate and FeCl3·6H2O were purchased from Fuchen Chemical Reagent Co., Ltd. (Tianjin, China). Sodium citrate was purchased from Tianjin Guangfu Technology Development Co., Ltd. (Tianjin, China). Cotton was purchased from Anqing Nursing Co., Ltd. (Anqing, China). All materials are analytical reagents without further purification.
3.2. Preparation of Samples
3.2.1. Preparation of Fe3O4
The Fe3O4 nanospheres were prepared by the hydrothermal method [44], and the preparation process is shown in Figure 9. First, FeCl3·6H2O (1.95 g, 7.2 mmol) and 0.1 g sodium citrate were added, respectively, to 40 mL of ethylene glycol solution and vigorously stirred with a magnetic stirrer (180 r/min) for approximately 30 min. Similarly, 4 g of sodium acetate was weighed and added to 40 mL of diethylene glycol, using a magnetic stirrer to stir vigorously (180 r/min) for about 30 min. Then the above two solutions were poured into the beaker and continued to be stirred with the magnetic stirrer (180 r/min) for about 30 min. After the fusion was uniform, the mixed solution was put in the reactor and reacted for 8 h at 200 °C. Finally, after the reactants were cooled to room temperature, the black precipitate was collected by the magnetic decantation method, rinsed 3 times with deionized water and anhydrous alcohol, and dried at 50 °C vacuum for 12 h, thus preparing nano Fe3O4.
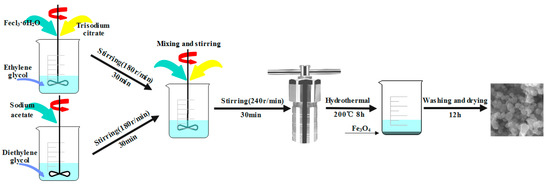
Figure 9.
Production process of Fe3O4.
3.2.2. Preparation of Fe3O4@MoS2
The hydrothermal method used to prepare Fe3O4@MoS2 was similar to that used to prepare Fe3O4. FeCl3·6H2O (1.95 g, 7.2 mmol) and 0.1 g of sodium citrate were added to 40 mL of ethylene glycol, respectively, and vigorously stirred (180 r/min) for 30 min. Similarly, to contrast the evaporation performance of the materials synthesized by Fe3O4 and MoS2 at different mass ratios, the authors found the best evaporation performance at a mass ratio of 2:1 after several experiments. Therefore, 275 mg of MoS2 and 4 g of sodium acetate were weighed in 40 mL of diethylene glycol, vigorously stirred (180 r/min) for about 30 min and continued to be stirred (180 r/min) for 8 h after ultrasonic treatment for approximately 3 h, so that the mixed solution was evenly dispersed and uniform. The two solutions were mixed together, with continued stirring (240 r/min) for 30 min, and the mixture was transferred to a 100 mL Teflon lined stainless steel autoclave and reacted at 200 °C for 8 h using the hydrothermal method. After the reaction was complete, it was removed from the reactor and cooled to room temperature, and the black precipitate was collected using the magnetic precipitation method; it was washed repeatedly with deionized water and anhydrous ethanol three times and dried for 12 h in a vacuum environment of 50 °C; then Fe3O4@MoS2 was obtained, marked Fe-Mo-1. The Fe3O4 and MoS2 mass ratio of 5:1 was chosen as a comparison example, so the MoS2 mass in the reactant was changed to 110 mg and the rest was kept unchanged. The prepared sample was marked Fe-Mo-2.
3.3. Characterization of Samples
The scanning electron microscope was used to observe the microstructure of the sample (Hitachi Regulus 8100, Tokyo, Japan). X-ray diffraction (XRD) (Bruker D2 Phaser, Karlsruhe, Germany) was used for the components analysis of the sample. The scanning speed was 5°/min, and the scanning angle range was 10–80°. The solar absorption of the sample was measured by UV-Vis-NIR spectrophotometer (Shimadzu UV-3600, Tokyo, Japan).
3.4. SSG Experiment
The schematic diagram of the SSG experiment platform is shown in Figure 10a. The laptop was connected to a balance with automatic measurement data recording, and the quality information collected was transmitted to the laptop in real time. A beaker was placed above the balance and the liquid in the beaker was sewage/seawater to be vaporized. The schematic diagram of the photothermal conversion device is shown in Figure 10b. The photothermal conversion layer was the sample prepared in this work. The sample was placed on polyethylene foam which was suspended in the middle of the beaker as a heat insulation layer. The main function of the heat insulation layer was to block the contact between sunlight and seawater, to block heat radiation and heat convection, so that sunlight was absorbed by the material as much as possible and converted into heat energy for water evaporation, which makes the experimental results more accurate. The transfer of water between seawater and the photothermal conversion material used a cotton wick, which ensured that the liquid in the beaker could be continuously transported to the photothermal conversion layer for evaporation [45]. The xenon lamp (CEL-HXF300-T3, CEAULIGHT, Beijing, China) was used to simulate sunlight and an electronic scale (JS-A5, CEAULIGHT, Suzhou, China) was used to measure the evaporation quality of seawater in real time; the scale was connected to the computer and fed the measured data back to the computer for real-time recording. The infrared radiation imager (PTi120, Fluke, Shanghai, China) was used to measure the temperature of the sample surface and take infrared photos. The optical power meter (CEL-FZ-A, CEAULIGHT, Beijing, China) was used to calibrate the light intensity of xenon light.
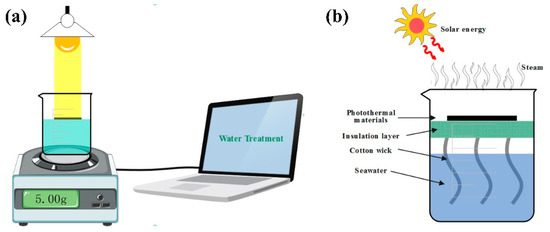
Figure 10.
(a) Schematic diagram of SSG system experimental platform. (b) Schematic diagram of the photothermal conversion device.
3.5. SSG Test
By adjusting the light power of the xenon lamp, the sample was carried out under 1, 2, and 3 sun irradiation, and all experiments were completed at an ambient temperature of 20 °C and an ambient humidity of 60%. In the experiment, the liquid in the beaker was simulated seawater, and 150 mL of simulated seawater with a mass fraction of 3.5 wt% was prepared with sea salt (Yiery1, Yier, Guangzhou, China) and deionized water. The cotton piece was made into a round piece with a diameter of 4 cm, and a brush was used to evenly smear the sample on the cotton piece; it was placed on the polyethylene foam in the beaker, allowed to stand for half an hour while waiting for the seawater to wet the whole photothermal conversion layer through capillarity, and then the test was started. The electronic scale was used to measure the change in seawater quality in real time within one hour, and the infrared radiation imager was used to monitor the change in the surface temperature of samples under different light intensity and different times.
In the SSG experiment, the evaporation rate and the evaporation efficiency are the key parameters that reflect the performance of the prepared sample. The evaporation rate can be calculated by weighing the mass change of seawater during the experiment, and the evaporation efficiency can be further calculated. The evaporation rate of water (v) (kg m−2 h−1) is calculated as follows [46]:
In the above formula, Δm refers to the difference between the mass change of seawater with and without light during the experiment. Δt is the duration of the evaporation experiment. S refers to the surface area of the photothermal conversion layer, which is 4π cm2 in this experiment.
The evaporation efficiency (η) represents the photothermal conversion capacity of the sample. The higher the value, the higher the photothermal conversion efficiency of the sample. This is calculated using the following formula [47]:
In the above formula, η is the evaporation efficiency of seawater. v is the result calculated using Formula (1), which represents the evaporation rate of seawater. hv represents the total evaporation enthalpy of water; referring to the relevant literature, this value is 2260 kJ kg−1 [48]. P0 is the radiant light power of the sun, and the corresponding incident light power under 1~3 sun is 1~3 kW m−2, respectively.
3.6. SSG Water Treatment
The laboratory used ICP-OES/MS (Agilent 5110, Santa Clara, CA, USA) to measure the concentration of Cu2+, Ni2+, Zn2+, Co2+ ions before and after sewage purification and the concentration of Na+, Mg2+, K+, Ca2+ ions before and after simulated seawater desalination. The sewage used in the experiment was simulated sewage (10 mg L−1 MB and 10 mg L−1 MO) prepared with organic dyes, and the seawater was prepared with sea salt according to the standard of 3.5 wt% mass fraction. The UV-Vis-NIR spectrophotometer (UV-3600, Shimadzu, Tokyo, Japan) was used to detect the light absorption performance of organic dyes and then judge the purification effect of the SSG device on organic dyes. The digital multimeter (V96C, Mechanic, Shenzhen, China) was used to measure resistance before and after simulated seawater desalination, and then judge whether the seawater desalination experiment achieved the expected effect.
4. Conclusions
In this work, the composite material with Fe3O4 nanospheres attached to the surface of the MoS2 nanosheet was synthesized by the hydrothermal method. The composite material has a larger specific surface area, an average light absorption rate of 97.11%, and a higher light absorption ability. Under one sun irradiation, the evaporation rate and efficiency were 1.42 kg m−2 h−1 and 89.18%, respectively, which was better than most reported materials. After 10 cycles of testing, it was observed that the sample has high stability. In addition, in this work an outdoor SSG test device was also made. Through the test, it was found that purified seawater and sewage reached the international drinking water standard. In general, this work provides new ideas for sustainable and efficient freshwater production.
Author Contributions
Conceptualization, Z.B.; Data curation, Z.B.; Funding acquisition, Z.B.; Methodology, J.Y. and N.W.; Resources, H.X., K.G. and Z.B.; Software, Z.B.; Writing—original draft, Z.B.; Writing—review & editing, H.X., B.Y., J.Y., G.L. and Z.B. All authors have read and agreed to the published version of the manuscript.
Funding
This work was supported by the Suzhou University key project (2022yzd07), Major Projects of Natural Science Research in Universities of Anhui Province (KJ2021ZD0137), the Open Research Fund of National Engineering Research Center for Agro-Ecological Big Data Analysis & Application, Anhui University (AE202201), the Key Projects of Natural Science Research in Universities of Anhui Province (KJ2021A0907, 2022AH050378), the Research Platform of Anhui Provincial Engineering Laboratory on Information Fusion and Control of Intelligent Robot under grants (IFCIR2020005).
Acknowledgments
The authors would like to thank He Lei from Shiyanjia Lab (www.shiyanjia.com, accessed on 1 January 2023) for the SEM analysis.
Conflicts of Interest
The authors declare no conflict of interest.
References
- Mehrkhah, R.; Goharshadi, E.K.; Ghafurian, M.M.; Mohammadi, M.; Mahian, O. Clean water production by non-noble metal/reduced graphene oxide nanocomposite coated on wood: Scalable interfacial solar steam generation and heavy metal sorption. Solar Energy 2021, 224, 440–454. [Google Scholar] [CrossRef]
- Wang, L.; Feng, Y.; Liu, Q.; Liu, G. Solar-thermo-radiative evaporator for continuous steam generation and salt harvesting. Solar Energy 2023, 250, 347–354. [Google Scholar] [CrossRef]
- Yang, T.; Lin, H.; Lin, K.-T.; Mesa Saldarriaga, D.; Yang, G.; Guo, C.; Zhang, H.; Zhang, J.; Fraser, S.; Lau, A.K.-T.; et al. Single-shot production of Janus graphene thin film for solar steam generation with 94.5% efficiency. Carbon 2022, 199, 469–478. [Google Scholar] [CrossRef]
- Ibrahim, I.; Seo, D.H.; McDonagh, A.M.; Shon, H.K.; Tijing, L. Semiconductor photothermal materials enabling efficient solar steam generation toward desalination and wastewater treatment. Desalination 2021, 500, 114853. [Google Scholar] [CrossRef]
- Lim, H.W.; Park, S.H.; Lee, S.J. 3D thermoresponsive hydrogel with enhanced water uptake and active evaporation for effective interfacial solar steam generation. Desalination 2023, 550, 116368. [Google Scholar] [CrossRef]
- Gao, C.; Zhu, J.; Li, J.; Zhou, B.; Liu, X.; Chen, Y.; Zhang, Z.; Guo, J. Honeycomb-structured fabric with enhanced photothermal management and site-specific salt crystallization enables sustainable solar steam generation. J. Colloid Interface Sci. 2022, 619, 322–330. [Google Scholar] [CrossRef]
- Ai, L.; Xu, Y.; Qin, S.; Luo, Y.; Wei, W.; Wang, X.; Jiang, J. Facile fabrication of Ni5P4-NiMoOx nanorod arrays with synergistic thermal management for efficient interfacial solar steam generation and water purification. J. Colloid Interface Sci. 2023, 634, 22–31. [Google Scholar] [CrossRef]
- Tao, F.; Zhang, Y.; Cao, S.; Yin, K.; Chang, X.; Lei, Y.; Fan, R.; Dong, L.; Yin, Y.; Chen, X. CuS nanoflowers/semipermeable collodion membrane composite for high-efficiency solar vapor generation. Mater. Today Energy 2018, 9, 285–294. [Google Scholar] [CrossRef]
- Kim, C.; Ryu, Y.; Shin, D.; Urbas, A.M.; Kim, K. Efficient solar steam generation by using metal-versatile hierarchical nanostructures for nickel and gold with aerogel insulator. Appl. Surf. Sci. 2020, 517, 146177. [Google Scholar] [CrossRef]
- He, M.; Alam, M.K.; Liu, H.; Zheng, M.; Zhao, J.; Wang, L.; Liu, L.; Qin, X.; Yu, J. Textile waste derived cellulose based composite aerogel for efficient solar steam generation. Compos. Commun. 2021, 28, 100936. [Google Scholar] [CrossRef]
- Li, L.; Hu, T.; Li, A.; Zhang, J. Electrically Conductive Carbon Aerogels with High Salt-Resistance for Efficient Solar-Driven Interfacial Evaporation. ACS Appl. Mater. Interfaces 2020, 12, 32143–32153. [Google Scholar] [CrossRef] [PubMed]
- Zhang, L.; Bai, B.; Hu, N.; Wang, H. Low-cost and facile fabrication of a candle soot/adsorbent cotton 3D-interfacial solar steam generation for effective water evaporation. Sol. Energy Mater. Sol. Cells 2021, 221, 110876. [Google Scholar] [CrossRef]
- Zhang, L.; Mu, L.; Zhou, Q.; Hu, X. Solar-assisted fabrication of dimpled 2H-MoS2 membrane for highly efficient water desalination. Water Res. 2020, 170, 115367. [Google Scholar] [CrossRef] [PubMed]
- Wang, Q.; Jia, F.; Huang, A.; Qin, Y.; Song, S.; Li, Y.; Arroyo, M.A.C. MoS2@sponge with double layer structure for high-efficiency solar desalination. Desalination 2020, 481, 114359. [Google Scholar] [CrossRef]
- Wang, Q.; Qin, Y.; Jia, F.; Li, Y.; Song, S. Magnetic MoS2 nanosheets as recyclable solar-absorbers for high-performance solar steam generation. Renew. Energy 2021, 163, 146–153. [Google Scholar] [CrossRef]
- Zhang, L.; Liu, G.; Wu, L.; Chen, Z.; Dai, Z.; Yu, F.; Wang, X. Integrated light adsorption and thermal insulation of Zn doping 1T phase MoS2-based evaporation prototype for continuous freshwater generation. Chem. Eng. J. 2023, 454, 140298. [Google Scholar] [CrossRef]
- Shin, Y.; Ham, J.; Boldoo, T.; Cho, H. Magnetic effect on the enhancement of photo-thermal energy conversion efficiency of MWCNT/Fe3O4 hybrid nanofluid. Sol. Energy Mater. Sol. Cells 2020, 215, 110635. [Google Scholar] [CrossRef]
- Shi, L.; He, Y.; Huang, Y.; Jiang, B. Recyclable Fe3O4@CNT nanoparticles for high-efficiency solar vapor generation. Energy Convers. Manag. 2017, 149, 401–408. [Google Scholar] [CrossRef]
- Song, L.; Zhang, X.-F.; Wang, Z.; Zheng, T.; Yao, J. Fe3O4/polyvinyl alcohol decorated delignified wood evaporator for continuous solar steam generation. Desalination 2021, 507, 115024. [Google Scholar] [CrossRef]
- Xiao, J.; Guo, Y.; Luo, W.; Wang, D.; Zhong, S.; Yue, Y.; Han, C.; Lv, R.; Feng, J.; Wang, J.; et al. A scalable, cost-effective and salt-rejecting MoS2/SA@melamine foam for continuous solar steam generation. Nano Energy 2021, 87, 106213. [Google Scholar] [CrossRef]
- Xu, R.; Cui, H.; Sun, K.; Song, X.; Yang, K.; Wei, N.; Hou, C.; Zhao, M. Controllable 3D interconnected featured pore structure of transition metal borides-carbonitride/MoS2 for efficiently solar evaporation and wastewater purification. Chem. Eng. J. 2022, 446, 137275. [Google Scholar] [CrossRef]
- Xu, R.; Wei, N.; Li, Z.; Song, X.; Li, Q.; Sun, K.; Yang, E.; Gong, L.; Sui, Y.; Tian, J.; et al. Construction of hierarchical 2D/2D Ti3C2/MoS2 nanocomposites for high-efficiency solar steam generation. J. Colloid Interface Sci. 2021, 584, 125–133. [Google Scholar] [CrossRef]
- Guo, Q.; Yi, H.; Jia, F.; Song, S. Design of MoS2/MMT bi-layered aerogels integrated with phase change materials for sustained and efficient solar desalination. Desalination 2022, 541, 116028. [Google Scholar] [CrossRef]
- Li, W.; Chen, Y.; Yao, L.; Ren, X.; Li, Y.; Deng, L. Fe3O4/PVDF-HFP photothermal membrane with in-situ heating for sustainable, stable and efficient pilot-scale solar-driven membrane distillation. Desalination 2020, 478, 114288. [Google Scholar] [CrossRef]
- Garousi, E.; Hossaini Sadr, M.; Rashidi, A.; Yousefi, M. MoS2 QDs-nanoparticle-engineered based hydrophobic filter for high performance water-oil separation. Inorg. Chem. Commun. 2022, 138, 109223. [Google Scholar] [CrossRef]
- Bai, Z.; Xu, H.; Yang, B.; Yao, J.; Li, G.; Guo, K.; Wang, N.; Liang, N. Fe3O4/Diatomite-Decorated Cotton Evaporator for Continuous Solar Steam Generation and Water Treatment. Materials 2022, 15, 6110. [Google Scholar] [CrossRef]
- Li, D.; Li, A.; Chen, Y.; Chen, G.; Chen, X.; Zhang, D.; Zhu, H.; Samo, I.A.; Song, H. Spray-freezing induced multidimensional morphology tuning of assembled spherical carbon for solar-driven steam generation. Carbon 2020, 162, 481–489. [Google Scholar] [CrossRef]
- Zhang, C.; Xiao, P.; Ni, F.; Yan, L.; Liu, Q.; Zhang, D.; Gu, J.; Wang, W.; Chen, T. Converting Pomelo Peel into Eco-friendly and Low-Consumption Photothermic Biomass Sponge toward Multifunctioal Solar-to-Heat Conversion. ACS Sustain. Chem. Eng. 2020, 8, 5328–5337. [Google Scholar] [CrossRef]
- Cong, C.; Gao, M.; Xing, G.; Wu, Y.; Liu, L.; Mainul, M.; Wang, J.; Wang, Z. Carbon nanomaterials treated by combination of oxidation and flash for highly efficient solar water evaporation. Chemosphere 2021, 277, 130248. [Google Scholar] [CrossRef] [PubMed]
- He, J.; Foysal, T.R.; Yang, H.; Islam, M.; Li, L.; Li, W.; Cui, W. A facile and low-cost method to improve the efficiency of solar steam evaporation. Mater. Lett. 2020, 261, 126962. [Google Scholar] [CrossRef]
- Chen, R.; Zhu, K.; Gan, Q.; Yu, Y.; Zhang, T.; Liu, X.; Ye, M.; Yin, Y. Interfacial solar heating by self-assembled Fe3O4@C film for steam generation. Mater. Chem. Front. 2017, 1, 2620–2626. [Google Scholar] [CrossRef]
- Liu, S.; Huang, C.; Luo, X.; Rao, Z. High-performance solar steam generation of a paper-based carbon particle system. Appl. Therm. Eng. 2018, 142, 566–572. [Google Scholar] [CrossRef]
- Hao, L.; Liu, N.; Zhang, B.; Niu, R.; Gong, J.; Tang, T. Waste-to-wealth: Sustainable conversion of polyester waste into porous carbons as efficient solar steam generators. J. Taiwan Inst. Chem. Eng. 2020, 115, 71–78. [Google Scholar] [CrossRef]
- Wu, X.; Wu, L.; Tan, J.; Chen, G.Y.; Owens, G.; Xu, H. Evaporation above a bulk water surface using an oil lamp inspired highly efficient solar-steam generation strategy. J. Mater. Chem. A 2018, 6, 12267–12274. [Google Scholar] [CrossRef]
- Li, Q.; Zhang, S.; Wei, N.; Xu, R.; Li, X.; Gong, L.; Cui, H. Porous Ni/CNTs composite membrane as solar absorber for highly efficient solar steam generation. Sol. Energy Mater. Sol. Cells 2022, 243, 111815. [Google Scholar] [CrossRef]
- Zhang, Z.; Fang, Y.; Zhuo, L.; Yuan, H.; Zhang, L. Reduced graphene oxide wrapped Fe3O4@TiO2 yolk–shell nanostructures as a magnetic recyclable photocatalytic antibacterial agent. J. Alloy. Compd. 2022, 904, 164001. [Google Scholar] [CrossRef]
- Chen, Y.; Fang, J.; Ling, T.; Xia, M.; Xu, P.; Cao, Y.; Wei, D.; Gao, J. Bamboo shoot-based evaporator with self-cleaning and mildew-resistant for efficient solar steam generation. Desalination 2022, 541, 116003. [Google Scholar] [CrossRef]
- Bai, L.; Zhang, H.; Lou, R.; Li, J.; Chi, M.; Sha, J.; Zhou, X. A biomass-based bilayer aerogel for efficient solar-driven steam production and electricity generation. Chem. Eng. J. 2023, 455, 140934. [Google Scholar] [CrossRef]
- Wu, X.; Gao, T.; Han, C.; Xu, J.; Owens, G.; Xu, H. A photothermal reservoir for highly efficient solar steam generation without bulk water. Sci. Bull. 2019, 64, 1625–1633. [Google Scholar] [CrossRef]
- Yang, M.; Chu, T.; Shi, J.; Zhang, J.; Zhang, Y.; Wang, L. Synergy of photothermal effect in integrated 0D natural melanin/2D reduced graphene oxide for effective solar steam generation and water purification. Colloids Surf. A Physicochem. Eng. Asp. 2022, 632, 127786. [Google Scholar] [CrossRef]
- Wang, J.; Guo, Z.; Xiao, B.; Xiong, X.; Liu, G.; Wang, X. Reduced graphene oxide/Cu7·2S4 composite hydrogels for highly efficient solar steam generation. Mater. Today Sustain. 2022, 18, 100121. [Google Scholar] [CrossRef]
- Ahmad Wani, T.; Garg, P.; Bera, S.; Bhattacharya, S.; Dutta, S.; Kumar, H.; Bera, A. Narrow-Bandgap LaMO3 (M = Ni, Co) nanomaterials for efficient interfacial solar steam generation. J. Colloid Interface Sci. 2022, 612, 203–212. [Google Scholar] [CrossRef] [PubMed]
- Zhao, F.; Zhou, X.; Shi, Y.; Qian, X.; Alexander, M.; Zhao, X.; Mendez, S.; Yang, R.; Qu, L.; Yu, G. Highly efficient solar vapour generation via hierarchically nanostructured gels. Nat. Nanotechnol. 2018, 13, 489–495. [Google Scholar] [CrossRef] [PubMed]
- Yao, J.; Zhang, K.; Wang, W.; Zuo, X.; Yang, Q.; Wu, M.; Li, G. Great enhancement of electrochemical cyclic voltammetry stabilization of Fe3O4 microspheres by introducing 3DRGO. Electrochim. Acta 2018, 279, 168–176. [Google Scholar] [CrossRef]
- Li, Y.; Zhang, S.; Xia, Z.; Wang, L.; Fan, J. Micro-macro-capillaries fabric-based evaporator for eliminating salt accumulation and highly efficient solar steam generation. Sep. Purif. Technol. 2023, 308, 122852. [Google Scholar] [CrossRef]
- Ibrahim, I.; Seo, D.H.; Angeloski, A.; McDonagh, A.; Shon, H.K.; Tijing, L.D. 3D microflowers CuS/Sn2S3 heterostructure for highly efficient solar steam generation and water purification. Sol. Energy Mater. Sol. Cells 2021, 232, 111377. [Google Scholar] [CrossRef]
- Zhang, X.; Pi, M.; Lu, H.; Li, M.; Wang, X.; Wang, Z.; Ran, R. A biomass hybrid hydrogel with hierarchical porous structure for efficient solar steam generation. Sol. Energy Mater. Sol. Cells 2022, 242, 111742. [Google Scholar] [CrossRef]
- Feng, J.; Bai, B.; Yang, L.; Hu, N.; Wang, H. Low-cost and facile hydrophilic amplification of raw corn straws for the applications of highly efficient interfacial solar steam generation. Mater. Chem. Phys. 2021, 271, 124904. [Google Scholar] [CrossRef]
Disclaimer/Publisher’s Note: The statements, opinions and data contained in all publications are solely those of the individual author(s) and contributor(s) and not of MDPI and/or the editor(s). MDPI and/or the editor(s) disclaim responsibility for any injury to people or property resulting from any ideas, methods, instructions or products referred to in the content. |
© 2023 by the authors. Licensee MDPI, Basel, Switzerland. This article is an open access article distributed under the terms and conditions of the Creative Commons Attribution (CC BY) license (https://creativecommons.org/licenses/by/4.0/).