
Bioactivity Profiles on 15 Different Effect Mechanisms for 15 Golden Root Products via High-Performance Thin-Layer Chromatography, Planar Assays, and High-Resolution Mass Spectrometry


Abstract
:1. Introduction
2. Results and Discussion
2.1. Optimization of the Effect-Directed Profiling Method
2.2. Effect-Directed Profiling of 15 Golden Root Samples
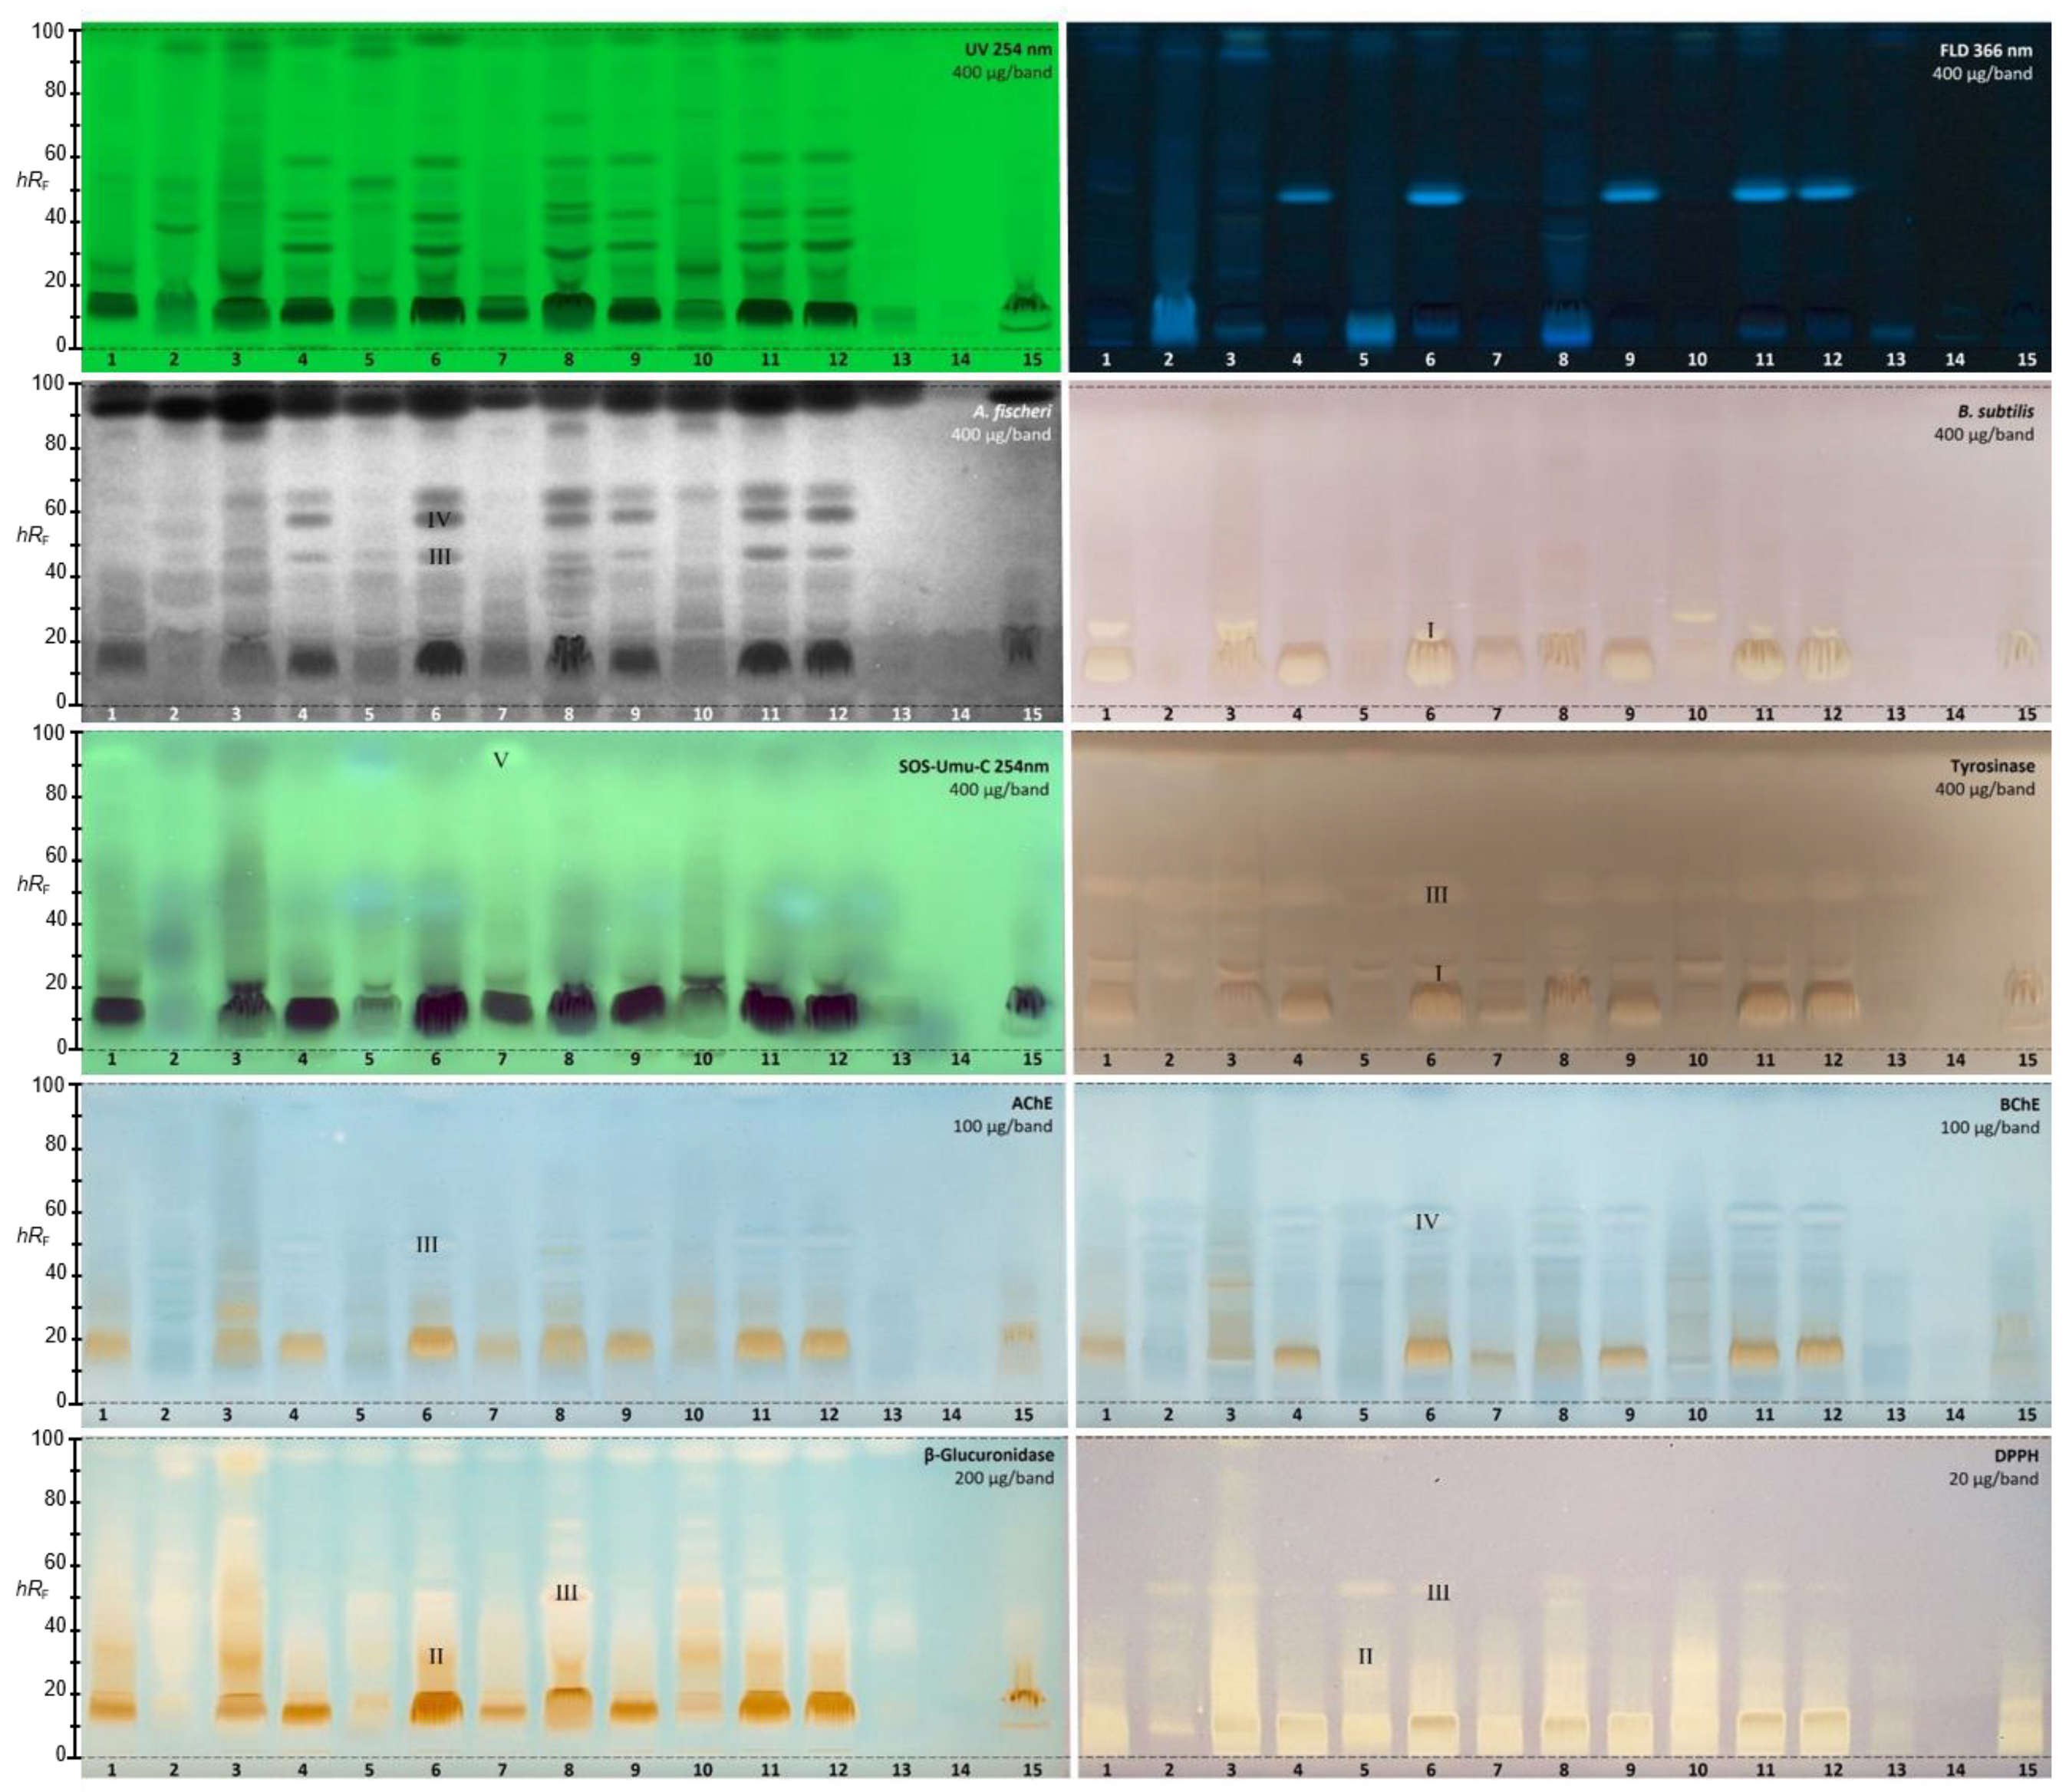
2.2.1. Aliivibrio fischeri Bioassay
2.2.2. Bacillus subtilis Bioassay
2.2.3. SOS-Umu-C Genotoxicity Bioassay
2.2.4. Tyrosinase Inhibition Assay
2.2.5. Acetyl- and Butyrylcholinesterase Inhibition Assays
2.2.6. β-Glucuronidase Inhibition Assay
2.2.7. DPPH• Scavenging Assay
2.2.8. α-Glucosidase and β-Glucosidase Inhibition Assays
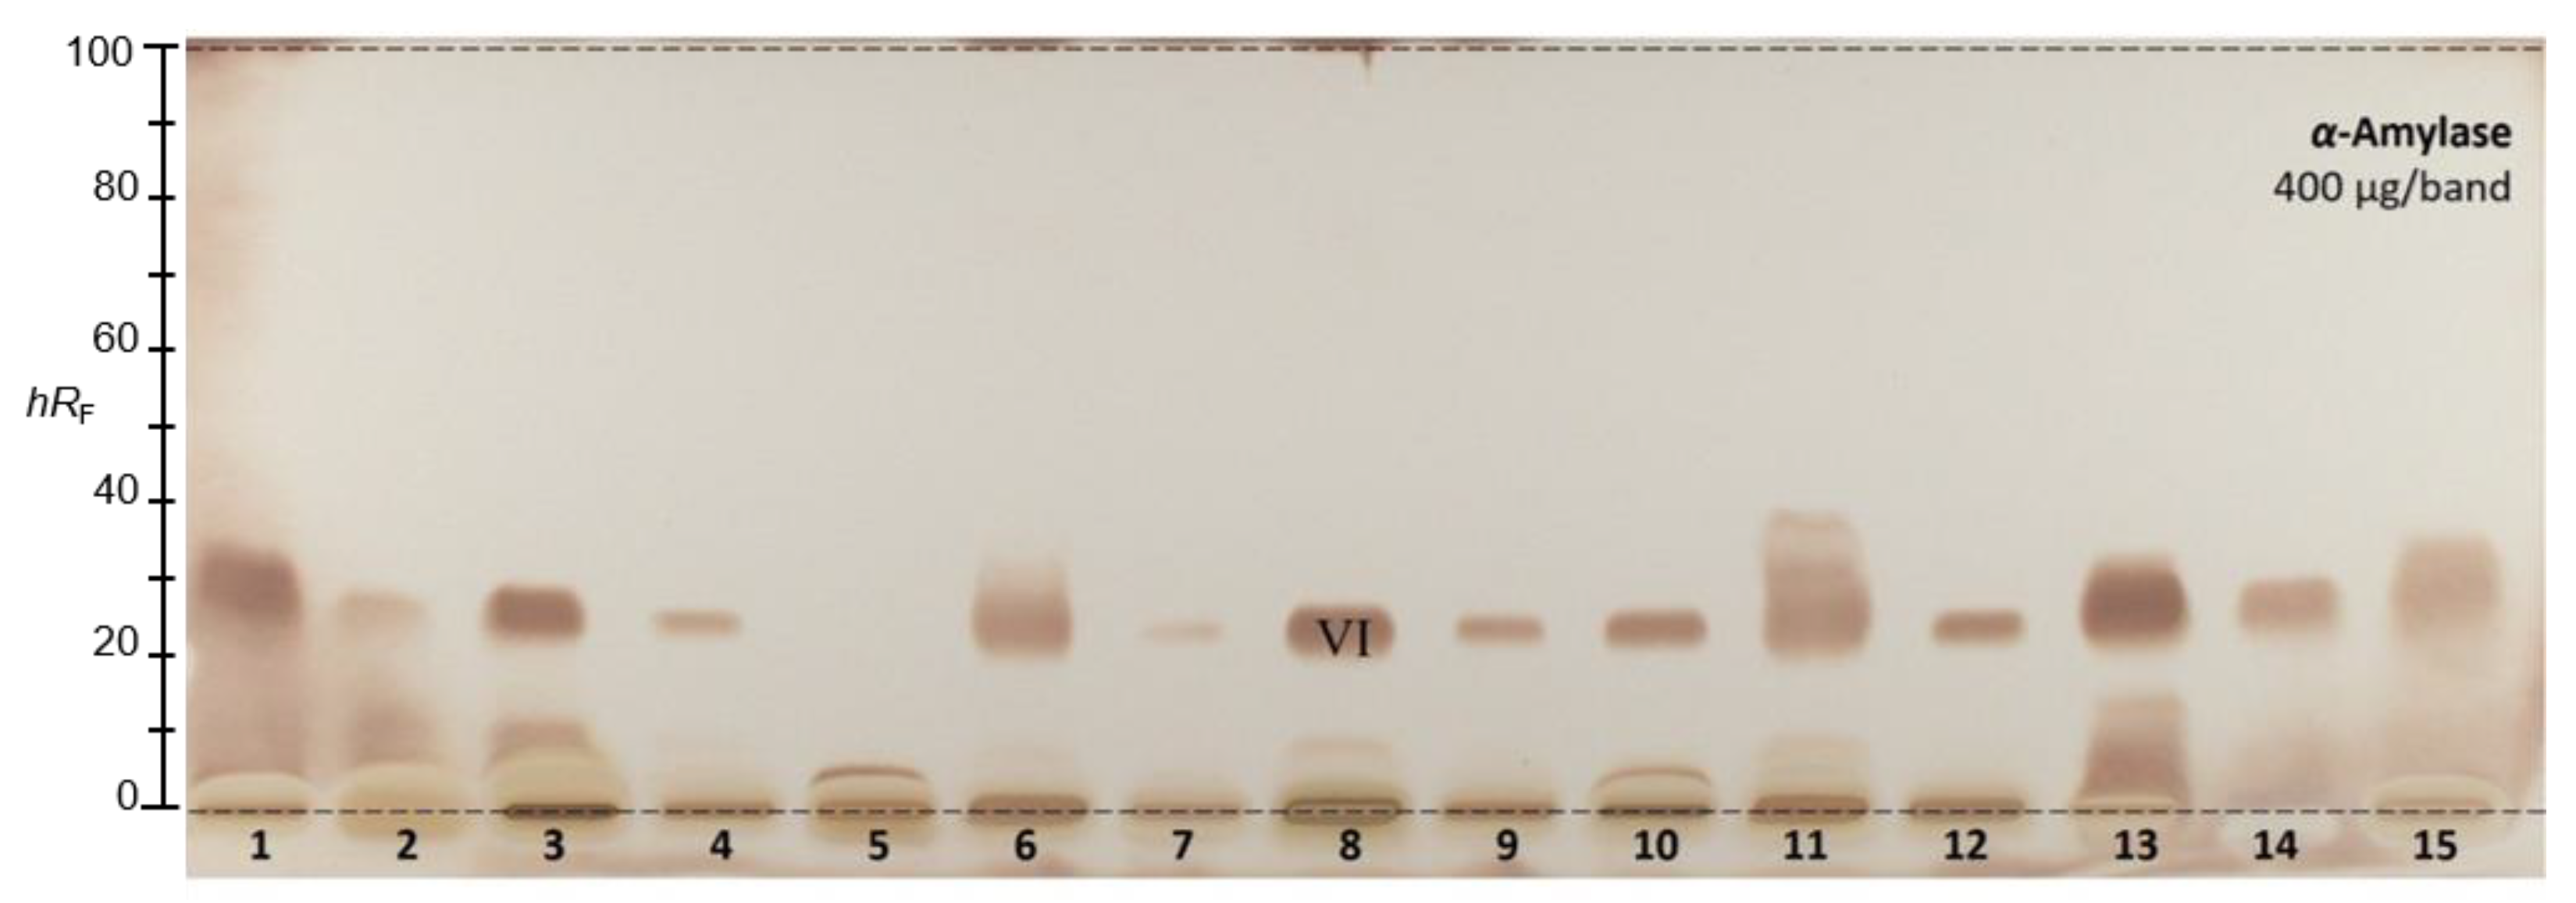
2.2.9. α-Amylase Inhibition Assay
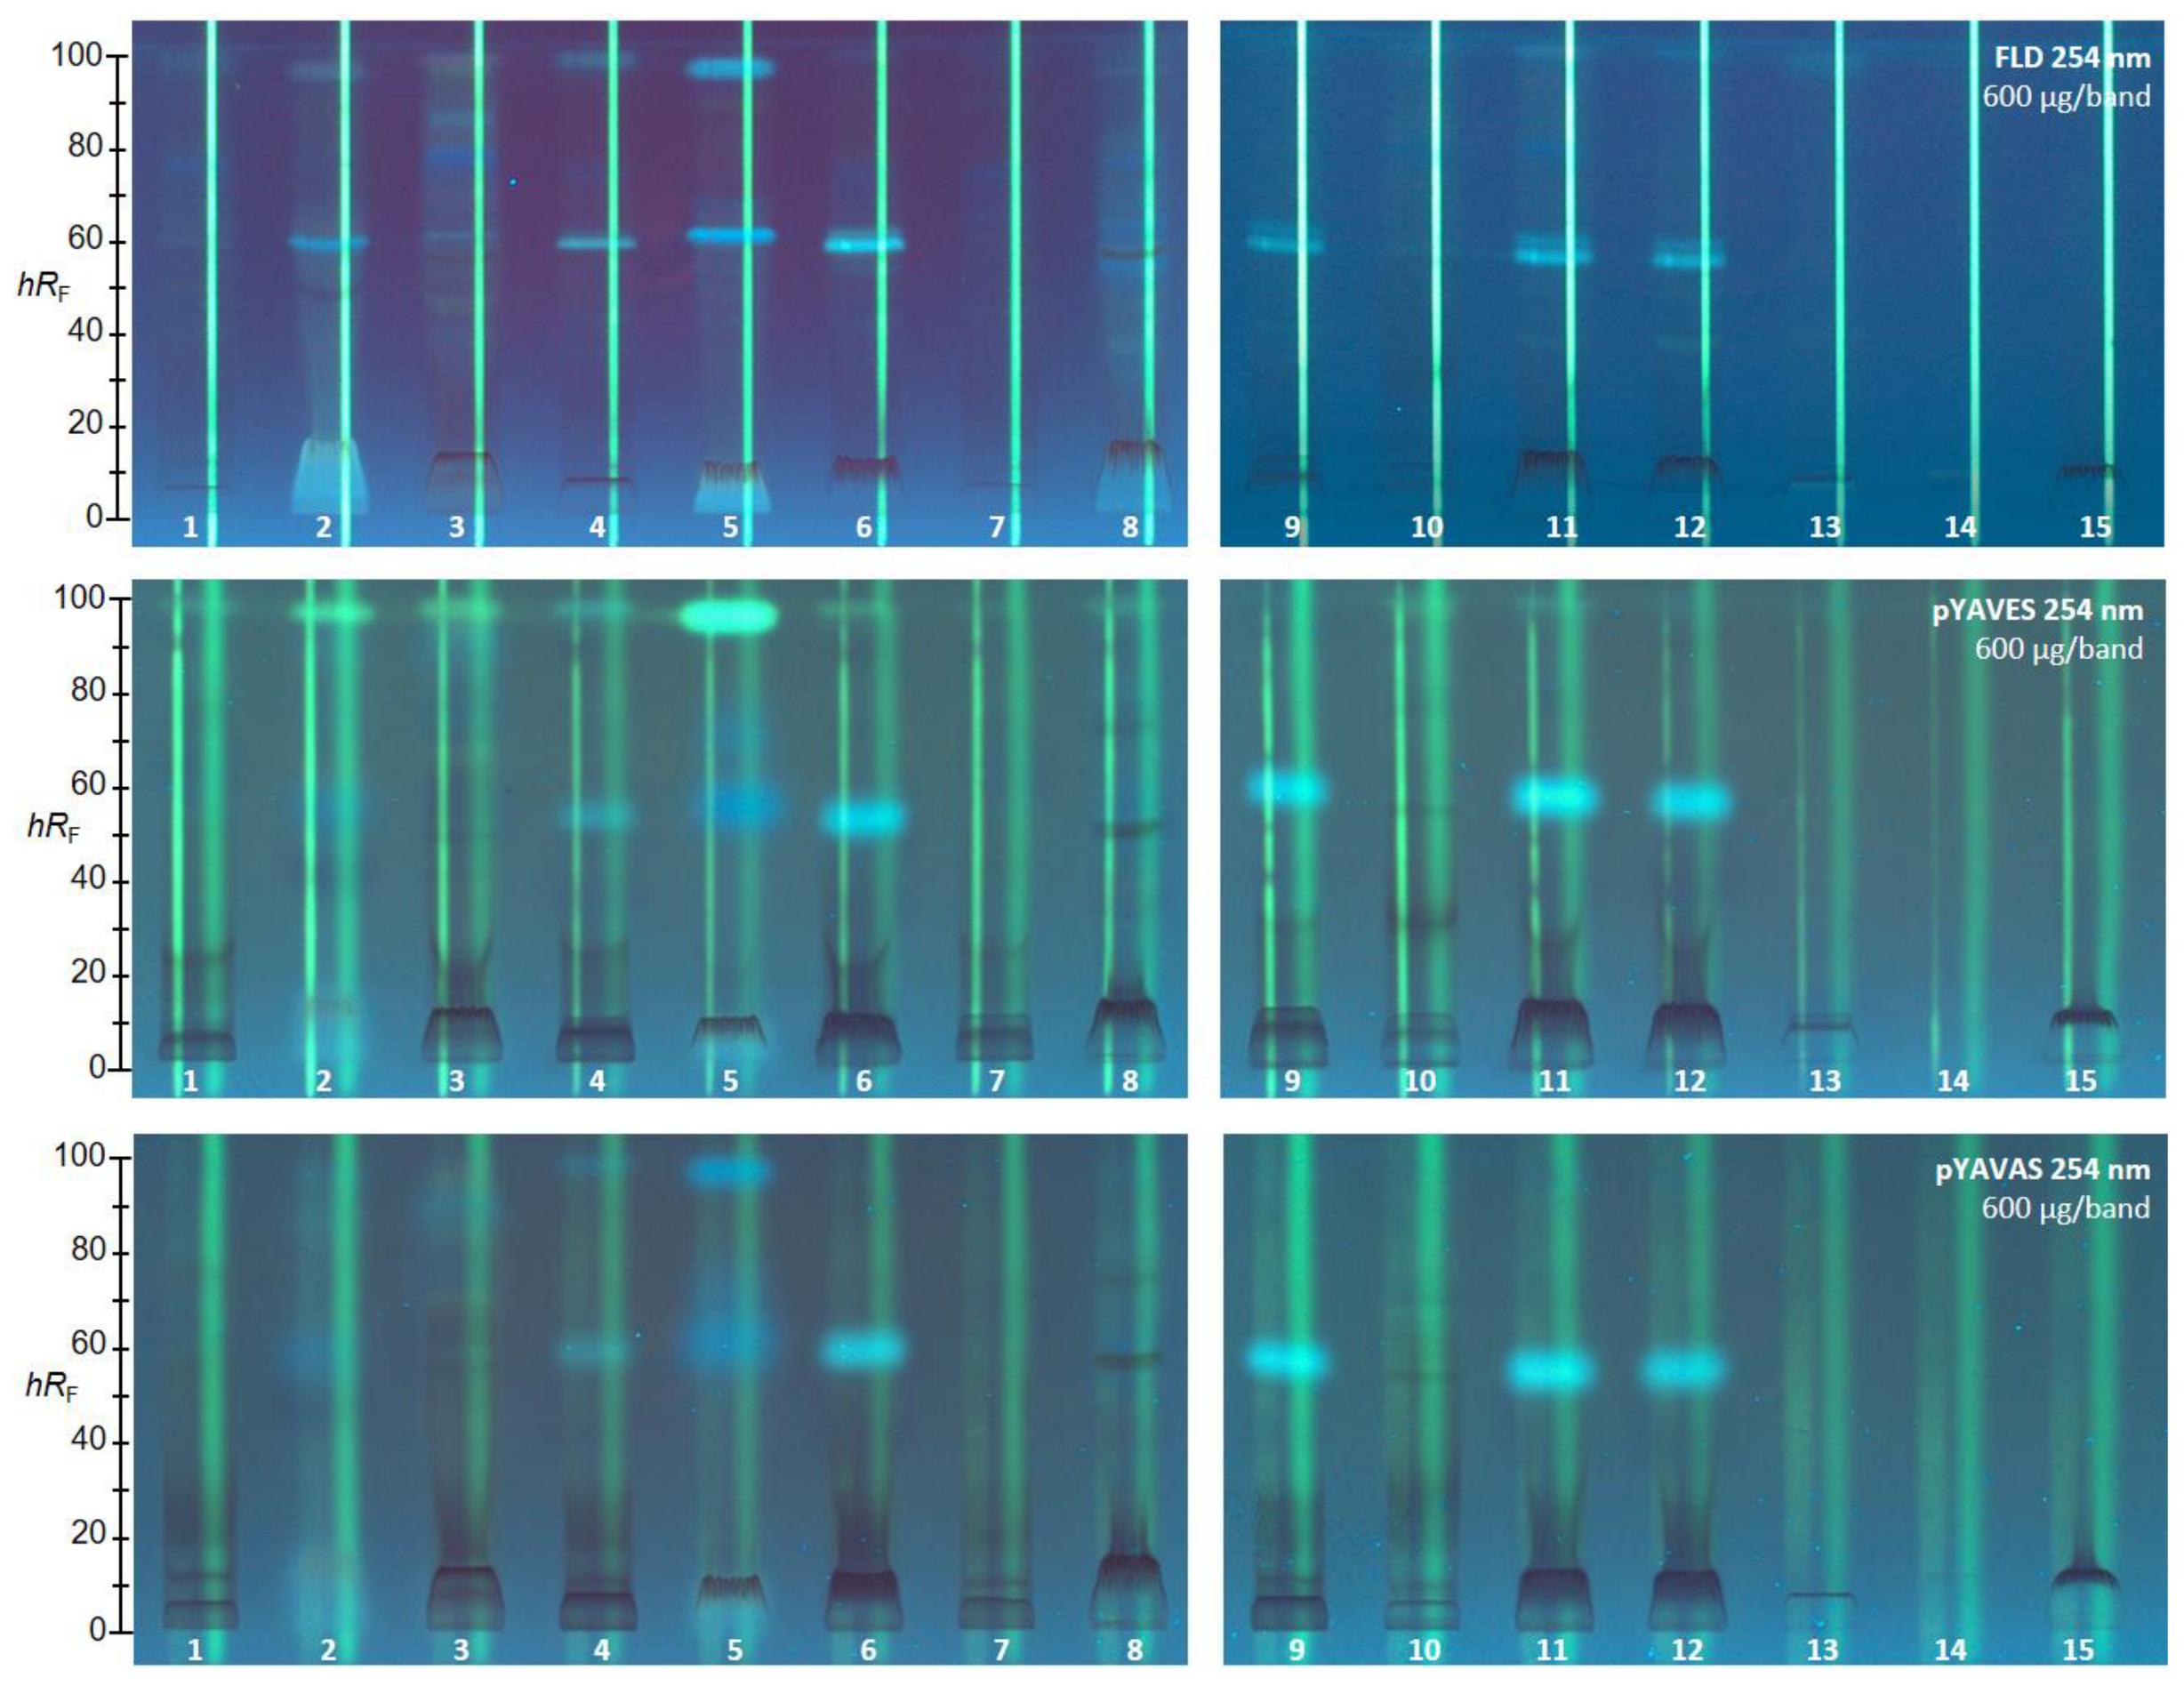
2.2.10. pYAVAS and pYAVES Bioassays
2.3. Characterization of Six Active Compound Zones Using HPTLC−HPLC−HESI-HRMS
3. Materials and Methods
3.1. Chemicals
3.2. Sample Preparation
3.3. HPTLC−UV/Vis/FLD−EDA Profiling Method
3.4. HPTLC−HPLC−HESI-HRMS
4. Conclusions
Supplementary Materials
Author Contributions
Funding
Institutional Review Board Statement
Informed Consent Statement
Data Availability Statement
Acknowledgments
Conflicts of Interest
Sample Availability
References
- Panossian, A.; Wikman, G.; Sarris, J. Rosenroot (Rhodiola rosea): Traditional use, chemical composition, pharmacology and clinical efficacy. Phytomedicine 2010, 17, 481–493. [Google Scholar] [CrossRef]
- Kelly, G.S. Rhodiola rosea: A possible plant adaptogen. Altern. Med. Rev. 2001, 6, 293–302. [Google Scholar] [PubMed]
- Bokelmann, J.M. Rhodiola (Rhodiola rosea): Root. In Med. Herbs Prim. Care. An Evidence-Guided Reference for Healthcare Providers; Bokelmann, J.M., Ed.; Elsevier: Amsterdam, The Netherlands, 2022; pp. 535–543. [Google Scholar] [CrossRef]
- Panossian, A.G.; Efferth, T.; Shikov, A.N.; Pozharitskaya, O.N.; Kuchta, K.; Mukherjee, P.K.; Banerjee, S.; Heinrich, M.; Wu, W.; Guo, D.A.; et al. Evolution of the adaptogenic concept from traditional use to medical systems: Pharmacology of stress- and aging-related diseases. Med. Res. Rev. 2021, 41. [Google Scholar] [CrossRef]
- Zhuang, W.; Yue, L.; Dang, X.; Chen, F.; Gong, Y.; Lin, X.; Luo, Y. Rosenroot (Rhodiola): Potential applications in aging-related diseases. Aging Dis. 2019, 10, 134–146. [Google Scholar] [CrossRef]
- Pu, W.-L.; Zhang, M.-Y.; Bai, R.-Y.; Sun, L.-K.; Li, W.-H.; Yu, Y.-L.; Zhang, Y.; Song, L.; Wang, Z.-X.; Peng, Y.-F.; et al. Anti-inflammatory effects of Rhodiola rosea L.: A review. Biomed. Pharmacother. 2020, 121, 109552. [Google Scholar] [CrossRef] [PubMed]
- Panossian, A.; Wikman, G. Effects of adaptogens on the central nervous system and the molecular mechanisms associated with their stress-Protective activity. Pharmaceuticals 2010, 3, 188–224. [Google Scholar] [CrossRef]
- Mao, J.J.; Xie, S.X.; Zee, J.; Soeller, I.; Li, Q.S.; Rockwell, K.; Amsterdam, J.D. Rhodiola rosea versus sertraline for major depressive disorder: A randomized placebo-controlled trial. Phytomedicine 2015, 22, 394–399. [Google Scholar] [CrossRef] [PubMed]
- Jówko, E.; Sadowski, J.; Długołęcka, B.; Gierczuk, D.; Opaszowski, B.; Cieśliński, I. Effects of Rhodiola rosea supplementation on mental performance, physical capacity, and oxidative stress biomarkers in healthy men. J. Sport Heal. Sci. 2018, 7, 473–480. [Google Scholar] [CrossRef]
- Lee, O.H.; Kwon, Y.I.; Apostolidis, E.; Shetty, K.; Kim, Y.C. Rhodiola-induced inhibition of adipogenesis involves antioxidant enzyme response associated with pentose phosphate pathway. Phyther. Res. 2011, 25, 106–115. [Google Scholar] [CrossRef]
- Ishaque, S.; Shamseer, L.; Bukutu, C.; Vohra, S. Rhodiola rosea for physical and mental fatigue: A systematic review. BMC Complement. Altern. Med. 2012, 12, 70. [Google Scholar] [CrossRef]
- Ahmed, M.; Henson, D.A.; Sanderson, M.C.; Nieman, D.C.; Zubeldia, J.M.; Shanely, R.A. Rhodiola rosea Exerts Antiviral Activity in Athletes Following a Competitive Marathon Race. Front. Nutr. 2015, 2, 24. [Google Scholar] [CrossRef]
- Chen, X.F.; Li, X.L.; Yang, M.; Song, Y.; Zhang, Y. Osteoprotective effects of salidroside in ovariectomized mice and diabetic mice. Eur. J. Pharmacol. 2018, 819, 281–288. [Google Scholar] [CrossRef]
- Li, Y.; Pham, V.; Bui, M.; Song, L.; Wu, C.; Walia, A.; Uchio, E.; Smith-Liu, F.; Zi, X. Rhodiola rosea L.: An Herb with Anti-Stress, Anti-Aging, and Immunostimulating Properties for Cancer Chemoprevention. Curr. Pharmacol. Reports 2017, 3, 384–395. [Google Scholar] [CrossRef]
- Barnes, J.; Anderson, L.A.; David, J.; Barnes, P.; Phillipson, A.; Phillipson, J.D. Herbal Medicines, 3rd ed.; Pharmaceutical Press: London, UK, 2007. [Google Scholar]
- Khanna, K.; Mishra, K.P.; Ganju, L.; Singh, S.B. Golden root: A wholesome treat of immunity. Biomed. Pharmacother. 2017, 87, 496–502. [Google Scholar] [CrossRef]
- Xin, T.; Li, X.; Yao, H.; Lin, Y.; Ma, X.; Cheng, R.; Song, J.; Ni, L.; Fan, C.; Chen, S. Survey of commercial Rhodiola products revealed species diversity and potential safety issues. Sci. Rep. 2015, 5, 8337. [Google Scholar] [CrossRef] [PubMed]
- Hung, S.K.; Perry, R.; Ernst, E. The effectiveness and efficacy of Rhodiola rosea L.: A systematic review of randomized clinical trials. Phytomedicine 2011, 18, 235–244. [Google Scholar] [CrossRef]
- Duncan, M.; Clarke, N.D. An Overview on Rhodiola rosea in Cardiovascular Health, Mood Alleviation, and Energy Metabolism. In Sustained Energy for Enhanced Human Functions and Activity; Bagchi, D., Ed.; Elsevier: Amsterdam, The Netherlands, 2017; pp. 173–186. [Google Scholar]
- Todorova, V.; Ivanov, K.; Delattre, C.; Nalbantova, V.; Karcheva-Bahchevanska, D.; Ivanova, S. Plant adaptogens—History and future perspectives. Nutrients 2021, 13, 2861. [Google Scholar] [CrossRef] [PubMed]
- Ballmann, C.G.; Maze, S.B.; Wells, A.C.; Marshall, M.M.; Rogers, R.R. Effects of short-term Rhodiola Rosea (Golden Root Extract) supplementation on anaerobic exercise performance. J. Sports Sci. 2019, 37, 998–1003. [Google Scholar] [CrossRef] [PubMed]
- Parisi, A.; Tranchita, E.; Duranti, G.; Ciminelli, E.; Quaranta, F.; Ceci, R.; Cerulli, C.; Borrione, P.; Sabatini, S. Effects of chronic Rhodiola Rosea supplementation on sport performance and antioxidant capacity in trained male: Preliminary results. J. Sports Med. Phys. Fitness 2010, 50, 57–63. [Google Scholar]
- Yu, L.; Qin, Y.; Wang, Q.; Zhang, L.; Liu, Y.; Wang, T.; Huang, L.; Wu, L.; Xiong, H. The efficacy and safety of Chinese herbal medicine, Rhodiola formulation in treating ischemic heart disease: A systematic review and meta-analysis of randomized controlled trials. Complement. Ther. Med. 2014, 22, 814–825. [Google Scholar] [CrossRef]
- Nabavi, S.F.; Braidy, N.; Orhan, I.E.; Badiee, A.; Daglia, M.; Nabavi, S.M. Rhodiola rosea L. and Alzheimer’s Disease: From Farm to Pharmacy. Phyther. Res. 2016, 30, 532–539. [Google Scholar] [CrossRef]
- Lee, Y.; Jung, J.C.; Jang, S.; Kim, J.; Ali, Z.; Khan, I.A.; Oh, S. Anti-inflammatory and neuroprotective effects of constituents isolated from Rhodiola rosea. Evid.-Based Complement. Altern. Med. 2013, 2013, 514049. [Google Scholar] [CrossRef]
- Gao, J.; He, H.; Jiang, W.; Chang, X.; Zhu, L.; Luo, F.; Zhou, R.; Ma, C.; Yan, T. Salidroside ameliorates cognitive impairment in a d-galactose-induced rat model of Alzheimer’s disease. Behav. Brain Res. 2015, 293, 27–33. [Google Scholar] [CrossRef] [PubMed]
- Gao, J.; Zhou, R.; You, X.; Luo, F.; He, H.; Chang, X.; Zhu, L.; Ding, X.; Yan, T. Salidroside suppresses inflammation in a D-galactose-induced rat model of Alzheimer’s disease via SIRT1/NF-κB pathway. Metab. Brain Dis. 2016, 31, 771–778. [Google Scholar] [CrossRef] [PubMed]
- Zhang, Y.H.; Chen, S.; Li, J.L.; Yang, H.Q.; Zheng, R.; Zhou, H.Y.; Wang, G.; Lu, G.Q. Salidroside promotes the expression of GDNF in the MPTP model of Parkinson’s disease. Chinese J. Neurol. 2006, 39, 540. [Google Scholar]
- Wang, Z.-S.; Gao, F.; Lu, F.-E. Effect of ethanol extract of Rhodiola rosea on the early nephropathy in type 2 diabetic rats. J. Huazhong Univ. Sci. Technol.-Med. Sci. 2013, 33, 375–378. [Google Scholar] [CrossRef]
- Zheng, T.; Bian, F.; Chen, L.; Wang, Q.; Jin, S. Beneficial Effects of Rhodiola and Salidroside in Diabetes: Potential Role of AMP-Activated Protein Kinase. Mol. Diagnosis Ther. 2019, 23, 489–498. [Google Scholar] [CrossRef]
- Chiang, H.M.; Chen, H.C.; Wu, C.S.; Wu, P.Y.; Wen, K.C. Rhodiola plants: Chemistry and biological activity. J. Food Drug Anal. 2015, 23, 359–369. [Google Scholar] [CrossRef]
- Cai, Z.; Li, W.; Wang, H.; Yan, W.; Zhou, Y.; Wang, G.; Cui, J.; Wang, F. Antitumor effects of a purified polysaccharide from Rhodiola rosea and its action mechanism. Carbohydr. Polym. 2012, 90, 296–300. [Google Scholar] [CrossRef]
- Zhao, G.; Shi, A.; Fan, Z.; Du, Y. Salidroside inhibits the growth of human breast cancer in vitro and in vivo. Oncol. Rep. 2015, 33, 2553–2560. [Google Scholar] [CrossRef]
- Gerbarg, P.L.; Brown, R.P. Pause menopause with Rhodiola rosea, a natural selective estrogen receptor modulator. Phytomedicine 2016, 23, 763–769. [Google Scholar] [CrossRef] [PubMed]
- Powers, C.N.; Setzer, W.N. A molecular docking study of phytochemical estrogen mimics from dietary herbal supplements. Silico Pharmacol. 2015, 3, 4. [Google Scholar] [CrossRef] [PubMed]
- Yang, S.M.; Wang, T.; Wen, D.G.; Hou, J.Q.; Li, H.B. Protective effect of Rhodiola rosea polysaccharides on cryopreserved boar sperm. Carbohydr. Polym. 2016, 135, 44–47. [Google Scholar] [CrossRef] [PubMed]
- Kosakowska, O.; Bączek, K.; Przybył, J.L.; Pióro-Jabrucka, E.; Czupa, W.; Synowiec, A.; Gniewosz, M.; Costa, R.; Mondello, L.; Węglarz, Z. Antioxidant and antibacterial activity of roseroot (Rhodiola rosea L.) dry extracts. Molecules 2018, 23, 1767. [Google Scholar] [CrossRef] [PubMed]
- Ming, D.S.; Hillhouse, B.J.; Guns, E.S.; Eberding, A.; Xie, S.; Vimalanathan, S.; Towers, G.H.N. Bioactive compounds from Rhodiola rosea (Crassulaceae). Phyther. Res. 2005, 19, 740–743. [Google Scholar] [CrossRef] [PubMed]
- Nikolaichuk, H.; Typek, R.; Gnat, S.; Studziński, M.; Choma, I.M. Effect-directed analysis as a method for quality and authenticity estimation of Rhodiola rosea L. preparations. J. Chromatogr. A 2021, 1649, 462217. [Google Scholar] [CrossRef] [PubMed]
- Schreiner, T.; Sauter, D.; Friz, M.; Heil, J.; Morlock, G.E. Is Our Natural Food Our Homeostasis? Array of a Thousand Effect-Directed Profiles of 68 Herbs and Spices. Front. Pharmacol. 2021, 12, 755941. [Google Scholar] [CrossRef]
- Morlock, G.E.; Heil, J.; Inarejos-Garcia, A.M.; Maeder, J. Effect-directed profiling of powdered tea extracts for catechins, theaflavins, flavonols and caffeine. Antioxidants 2021, 10, 117. [Google Scholar] [CrossRef]
- Ronzheimer, A.; Schreiner, T.; Morlock, G.E. Multiplex planar bioassay detecting estrogens, antiestrogens, false-positives and synergists as sharp zones on normal phase. Phytomedicine 2022, 103, 154230. [Google Scholar] [CrossRef]
- Mehl, A.; Schwack, W.; Morlock, G.E. On-surface autosampling for liquid chromatography−mass spectrometry. J. Chromatogr. A 2021, 1651, 462334. [Google Scholar] [CrossRef] [PubMed]
- O’Donoghue, J.L.; Beevers, C.; Buard, A. Hvdroquinone: Assessment of genotoxic potential in the in vivo alkaline comet assay. Toxicol. Reports 2021, 8, 206–214. [Google Scholar] [CrossRef]
- Elameen, A.; Kosman, V.M.; Thomsen, M.; Pozharitskaya, O.N.; Shikov, A.N. Variability of major phenyletanes and phenylpropanoids in 16-year-old Rhodiola rosea L. Clones in Norway. Molecules 2020, 25, 3463. [Google Scholar] [CrossRef] [PubMed]
- Ioset, K.N.; Nyberg, N.T.; Van Diermen, D.; Malnoe, P.; Hostettmann, K.; Shikov, A.N.; Jaroszewski, J.W. Metabolic profiling of Rhodiola rosea rhizomes by 1H NMR spectroscopy. Phytochem. Anal. 2011, 22, 158–165. [Google Scholar] [CrossRef] [PubMed]
- Booker, A.; Zhai, L.; Gkouva, C.; Li, S.; Heinrich, M. From traditional resource to global commodities: A comparison of Rhodiola species using NMR spectroscopy-metabolomics and HPTLC. Front. Pharmacol. 2016, 7, 254. [Google Scholar] [CrossRef] [PubMed]
- Klingelhöfer, I.; Hockamp, N.; Morlock, G.E. Non-targeted detection and differentiation of agonists versus antagonists, directly in bioprofiles of everyday products. Anal. Chim. Acta 2020, 1125, 288–298. [Google Scholar] [CrossRef] [PubMed]
- Jamshidi-Aidji, M.; Morlock, G.E. From bioprofiling and characterization to bioquantification of natural antibiotics by direct bioautography linked to high-resolution mass spectrometry: Exemplarily shown for Salvia miltiorrhiza root. Anal. Chem. 2016, 88, 10979–10986. [Google Scholar] [CrossRef] [PubMed]
- Meyer, D.; Marin-Kuan, M.; Debon, E.; Serrant, P.; Cottet-Fontannaz, C.; Schilter, B.; Morlock, G.E. Detection of low levels of genotoxic compounds in food contact materials using an alternative HPTLC-SOS-Umu-C assay. ALTEX 2021, 38, 387–397. [Google Scholar] [CrossRef]
- Debon, E.; Rogeboz, P.; Latado, H.; Morlock, G.E.; Meyer, D.; Cottet-Fontannaz, C.; Scholz, G.; Schilter, B.; Marin-Kuan, M. Incorporation of Metabolic Activation in the HPTLC-SOS-Umu-C Bioassay to Detect Low Levels of Genotoxic Chemicals in Food Contact Materials. Toxics 2022, 10, 501. [Google Scholar] [CrossRef] [PubMed]
- Meyer, D.; Marin-Kuan, M.; Mayrhofer, E.; Kirchnawy, C.; Debon, E.; Latado, H.; Patin, A.; Schilter, B.; Morlock, G.E. Effect-detection by planar SOS-Umu-C genotoxicity bioassay and chemical identification of genotoxins in packaging migrates, proven by microtiter plate assays SOS-Umu-C and Ames-MPF. Food Control. 2023, 147, 109546. [Google Scholar] [CrossRef]
- Jamshidi-Aidji, M.; Morlock, G.E. Fast Equivalency Estimation of Unknown Enzyme Inhibitors in Situ the Effect-Directed Fingerprint, Shown for Bacillus Lipopeptide Extracts. Anal. Chem. 2018, 90, 14260–14268. [Google Scholar] [CrossRef]
- Azadniya, E.; Morlock, G.E. Automated piezoelectric spraying of biological and enzymatic assays for effect-directed analysis of planar chromatograms. J. Chromatogr. A 2019, 1602, 458–466. [Google Scholar] [CrossRef] [PubMed]


| ID | Sample Form | Dosage Form | Product Name | Manufacturer, City, Country | Plant Origin | Batch Number | Expiration Date |
|---|---|---|---|---|---|---|---|
| 1 | Root powder | Powder | Rhodiola-Rosenwurz | Vitaideal Vegan, Enshede, Netherlands | Netherlands | - | - |
| 2 | Root dry extract 25:1 | Capsule | Rhodiola rosea | Green Naturals, Berlin, Germany | Germany | - | - |
| 3 | Root dry extract 20:1 | Powder | Różeniec górski | Proherbis, Zarzecze, Poland | China | - | 04/2023 |
| 4 | Dried root | Dried root | Korzeń różeńca górskiego | Farmvit, Peterborough, UK | - | - | - |
| 5 | Root dry extract, 520 mg | Capsule | Różeniec górski | Medica herbs, Cracow, Poland | - | ROZ-0-01 | 02/2024 |
| 6 | Root dry extract, 500 mg | Capsule | Rhodiola | Now Foods, Chicago, USA | - | 3196374 | 02/2026 |
| 7 | Dried rhizome | Dried rhizome | Kłącze różeńca górskiego | Dary natury, Grodzisk, Poland | - | - | 06/2023 |
| 8 | Root and rhizome dry extract | Powder | Rhodiola rosea root and rhizome dry extract | Sigma Aldrich | Canada | F00100 | - |
| 9 | Dried root and rhizome | Dried root/ rhizome | Różeniec górski | Natvita, Mirków, Poland | Russia | 29995 | 02/2023 |
| 10 | Powdered root, 400 mg | Capsule | Rhodiola | Fushi, London, UK | China | FOHC6180/12970CN | 09/2023 |
| 11 | Root dry extract, 250 mg, with additives | Capsule | Rhodiola | Solgar Leonia, USA | - | 530923-02 | 12/2023 |
| 12 | Root dry extract, 500 mg, with inulin | Capsule | Rhodiola | ForMeds, Poznań, Poland | - | K220221 | 02/2023 |
| 13 | Root dry extract, 140 mg, with additives | Capsule | Rhodiola | Pharmovit, Płock, Poland | - | RG0719/ PH | 07/2023 |
| 14 | Root dry extract, 100 mg | Tablet | Różeniec górski | Herbapol, Lublin, Poland | - | 010621 | 06/2023 |
| 15 | Root powder, 225 mg | Tablet | Arktyczny korzeń | Altermedica Laboratories, Żywiec, Poland | - | A0419/7 | 05/2023 |
| Zone ID | hRF | Bioactivity | Tentative Assignment | Formula | Calculated Mass [Da] | Observed Mass [Da] | Mass Error (Δ ppm) | Adduct Ions |
|---|---|---|---|---|---|---|---|---|
| I 6 | 20 |  | Rhodioloside D | C16H30O8 | 350.1941 | 409.2084 373.1828 | −1.09 1.13 | [M+CH3COO]− [M+Na]+ |
| II 6 | 35 | 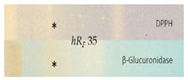 | Rosavin/rosarin | C20H28O10 | 428.1683 | 427.1610 451.1576 | −0.01 −0.26 | [M-H]− [M+Na]+ |
| III 6 | 51 | 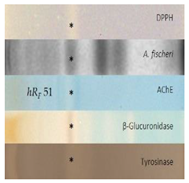 | Rosiridin | C16H28O7 | 332.1835 | 391.1978 355.1722 | −1.33 1.54 | [M+CH3COO]− [M+Na]+ |
| Viridoside | C15H22O7 | 314.1365 | 359.1351 337.1258 | −1.06 −0.10 | [M+CHOO]− [M+Na]+ | |||
| Salidroside | C14H20O7 | 300.1209 | 299.1139 323.1096 | −0.74 1.57 | [M-H]− [M+Na]+ | |||
| IV 6 | 61 | 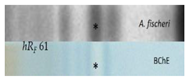 | Rosin | C15H20O6 | 296.1260 | 355.1399 319.1146 | −0.02 1.98 | [M+CH3COO]− [M+Na]+ |
| V 1 | 93 |  | Hydroquinone | C6H6O2 | 110.0368 | 109.0294 111.0444 | 0.68 −2.74 | [M-H]− [M+H]+ |
| VI 6 | 23 |  | Stearic acid | C18H36O2 | 284.2715 | 283.2643 | −0.13 | [M-H]− |
| Palmitic acid | C16H32O2 | 256.2402 | 255.2330 | −0.26 | [M-H]− |
Disclaimer/Publisher’s Note: The statements, opinions and data contained in all publications are solely those of the individual author(s) and contributor(s) and not of MDPI and/or the editor(s). MDPI and/or the editor(s) disclaim responsibility for any injury to people or property resulting from any ideas, methods, instructions or products referred to in the content. |
© 2023 by the authors. Licensee MDPI, Basel, Switzerland. This article is an open access article distributed under the terms and conditions of the Creative Commons Attribution (CC BY) license (https://creativecommons.org/licenses/by/4.0/).
Share and Cite
Nikolaichuk, H.; Choma, I.M.; Morlock, G.E. Bioactivity Profiles on 15 Different Effect Mechanisms for 15 Golden Root Products via High-Performance Thin-Layer Chromatography, Planar Assays, and High-Resolution Mass Spectrometry. Molecules 2023, 28, 1535. https://doi.org/10.3390/molecules28041535
Nikolaichuk H, Choma IM, Morlock GE. Bioactivity Profiles on 15 Different Effect Mechanisms for 15 Golden Root Products via High-Performance Thin-Layer Chromatography, Planar Assays, and High-Resolution Mass Spectrometry. Molecules. 2023; 28(4):1535. https://doi.org/10.3390/molecules28041535
Chicago/Turabian StyleNikolaichuk, Hanna, Irena M. Choma, and Gertrud E. Morlock. 2023. "Bioactivity Profiles on 15 Different Effect Mechanisms for 15 Golden Root Products via High-Performance Thin-Layer Chromatography, Planar Assays, and High-Resolution Mass Spectrometry" Molecules 28, no. 4: 1535. https://doi.org/10.3390/molecules28041535
APA StyleNikolaichuk, H., Choma, I. M., & Morlock, G. E. (2023). Bioactivity Profiles on 15 Different Effect Mechanisms for 15 Golden Root Products via High-Performance Thin-Layer Chromatography, Planar Assays, and High-Resolution Mass Spectrometry. Molecules, 28(4), 1535. https://doi.org/10.3390/molecules28041535