2.1. Study of the Reactivity of the Extracts by Cd2+ Complexation
Results of Cd
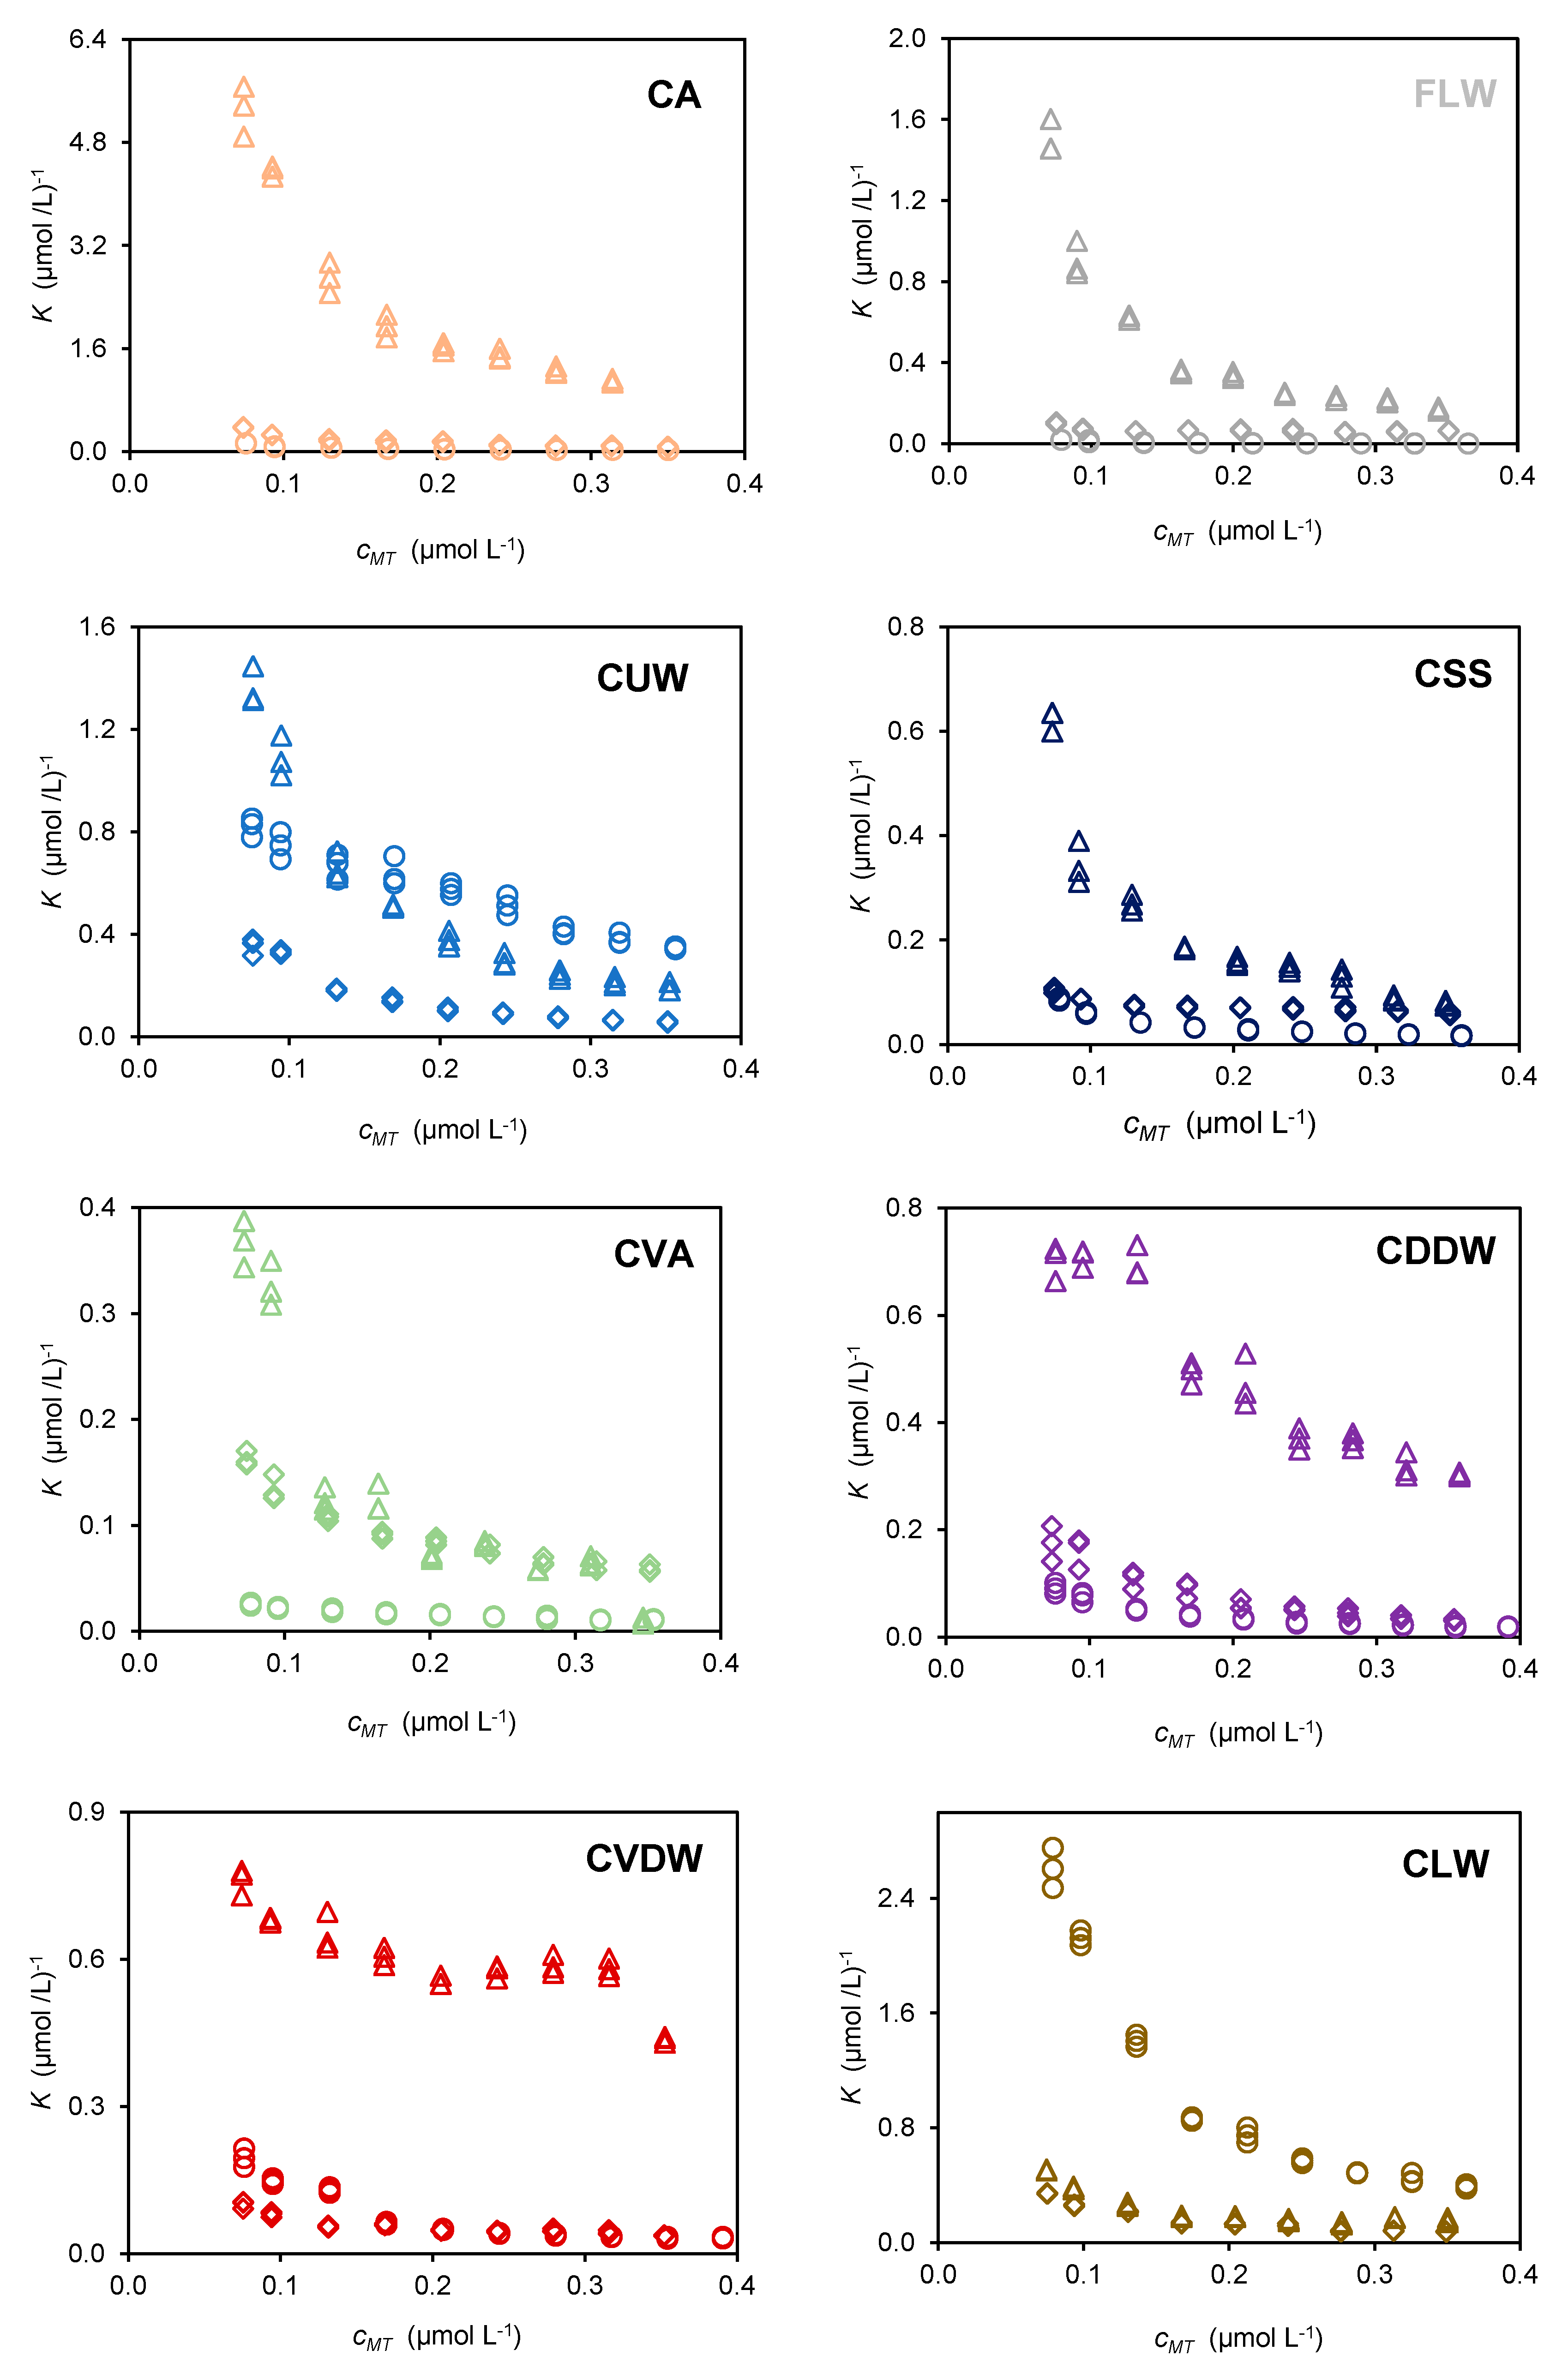
2+ by FA, HA, and DOM extracted from each compost are shown in
Figure 1 along with results from a uncomposted fertiliser for comparison. The plots show the complexation ratio,
K (expressed in (µmol/L)
−1) as a function of total Cd
2+ concentration,
cMT, (expressed in µmol/L). The
K values, calculated as the ratio of complexed Cd
2+ (
cML) to the product of free Cd
2+ (
cM) and organic matter (
cL), are related to the stability constant of metal complexes. The concentrations are expressed in terms of the abundance of deprotonated groups at pH 7.0,
QpH 7.0, which were calculated from acid–base titrations. The values of
Q pH 7.0 from the extracts can be found in the
Supplementary Material (Table S1). The plots in
Figure 1 exhibit exponential-like variations, which are typical of heterogeneous materials. The binding capacity is strongly dependent on the metal to ligand ratio and the relative abundance of the strongest binding groups (carboxylic groups) is highest in the lower concentration range of added Cd
2+ [
15]. The decrease in the average
K value follows the increasing involvement of weaker binding groups higher concentrations of added Cd
2+.
The results shown in
Figure 1 indicate that, in general, HA extracts have a higher binding capacity than FA extract, which in turn have higher complexing ability than DOM. This trend is likely due to differences in the chemical structure of these substances. HA is typically composed of larger, more highly condensed and cross-linked molecular structures than FA, which contribute to its higher binding capacity. Additionally, DOM typically contains a broader range of molecular structures and functional groups than HA ad FA, allowing for diverse complexing ability.
There are two exceptions to this trend in compost of urban waste (CUW) and compost of livestock waste (CLW) samples. In the case of CLW, binding capacity of FA is comparable to HA and both are lower than that of DOM, which can be attributed to the specific composition of the humic and non-humic substances present in these extracts.
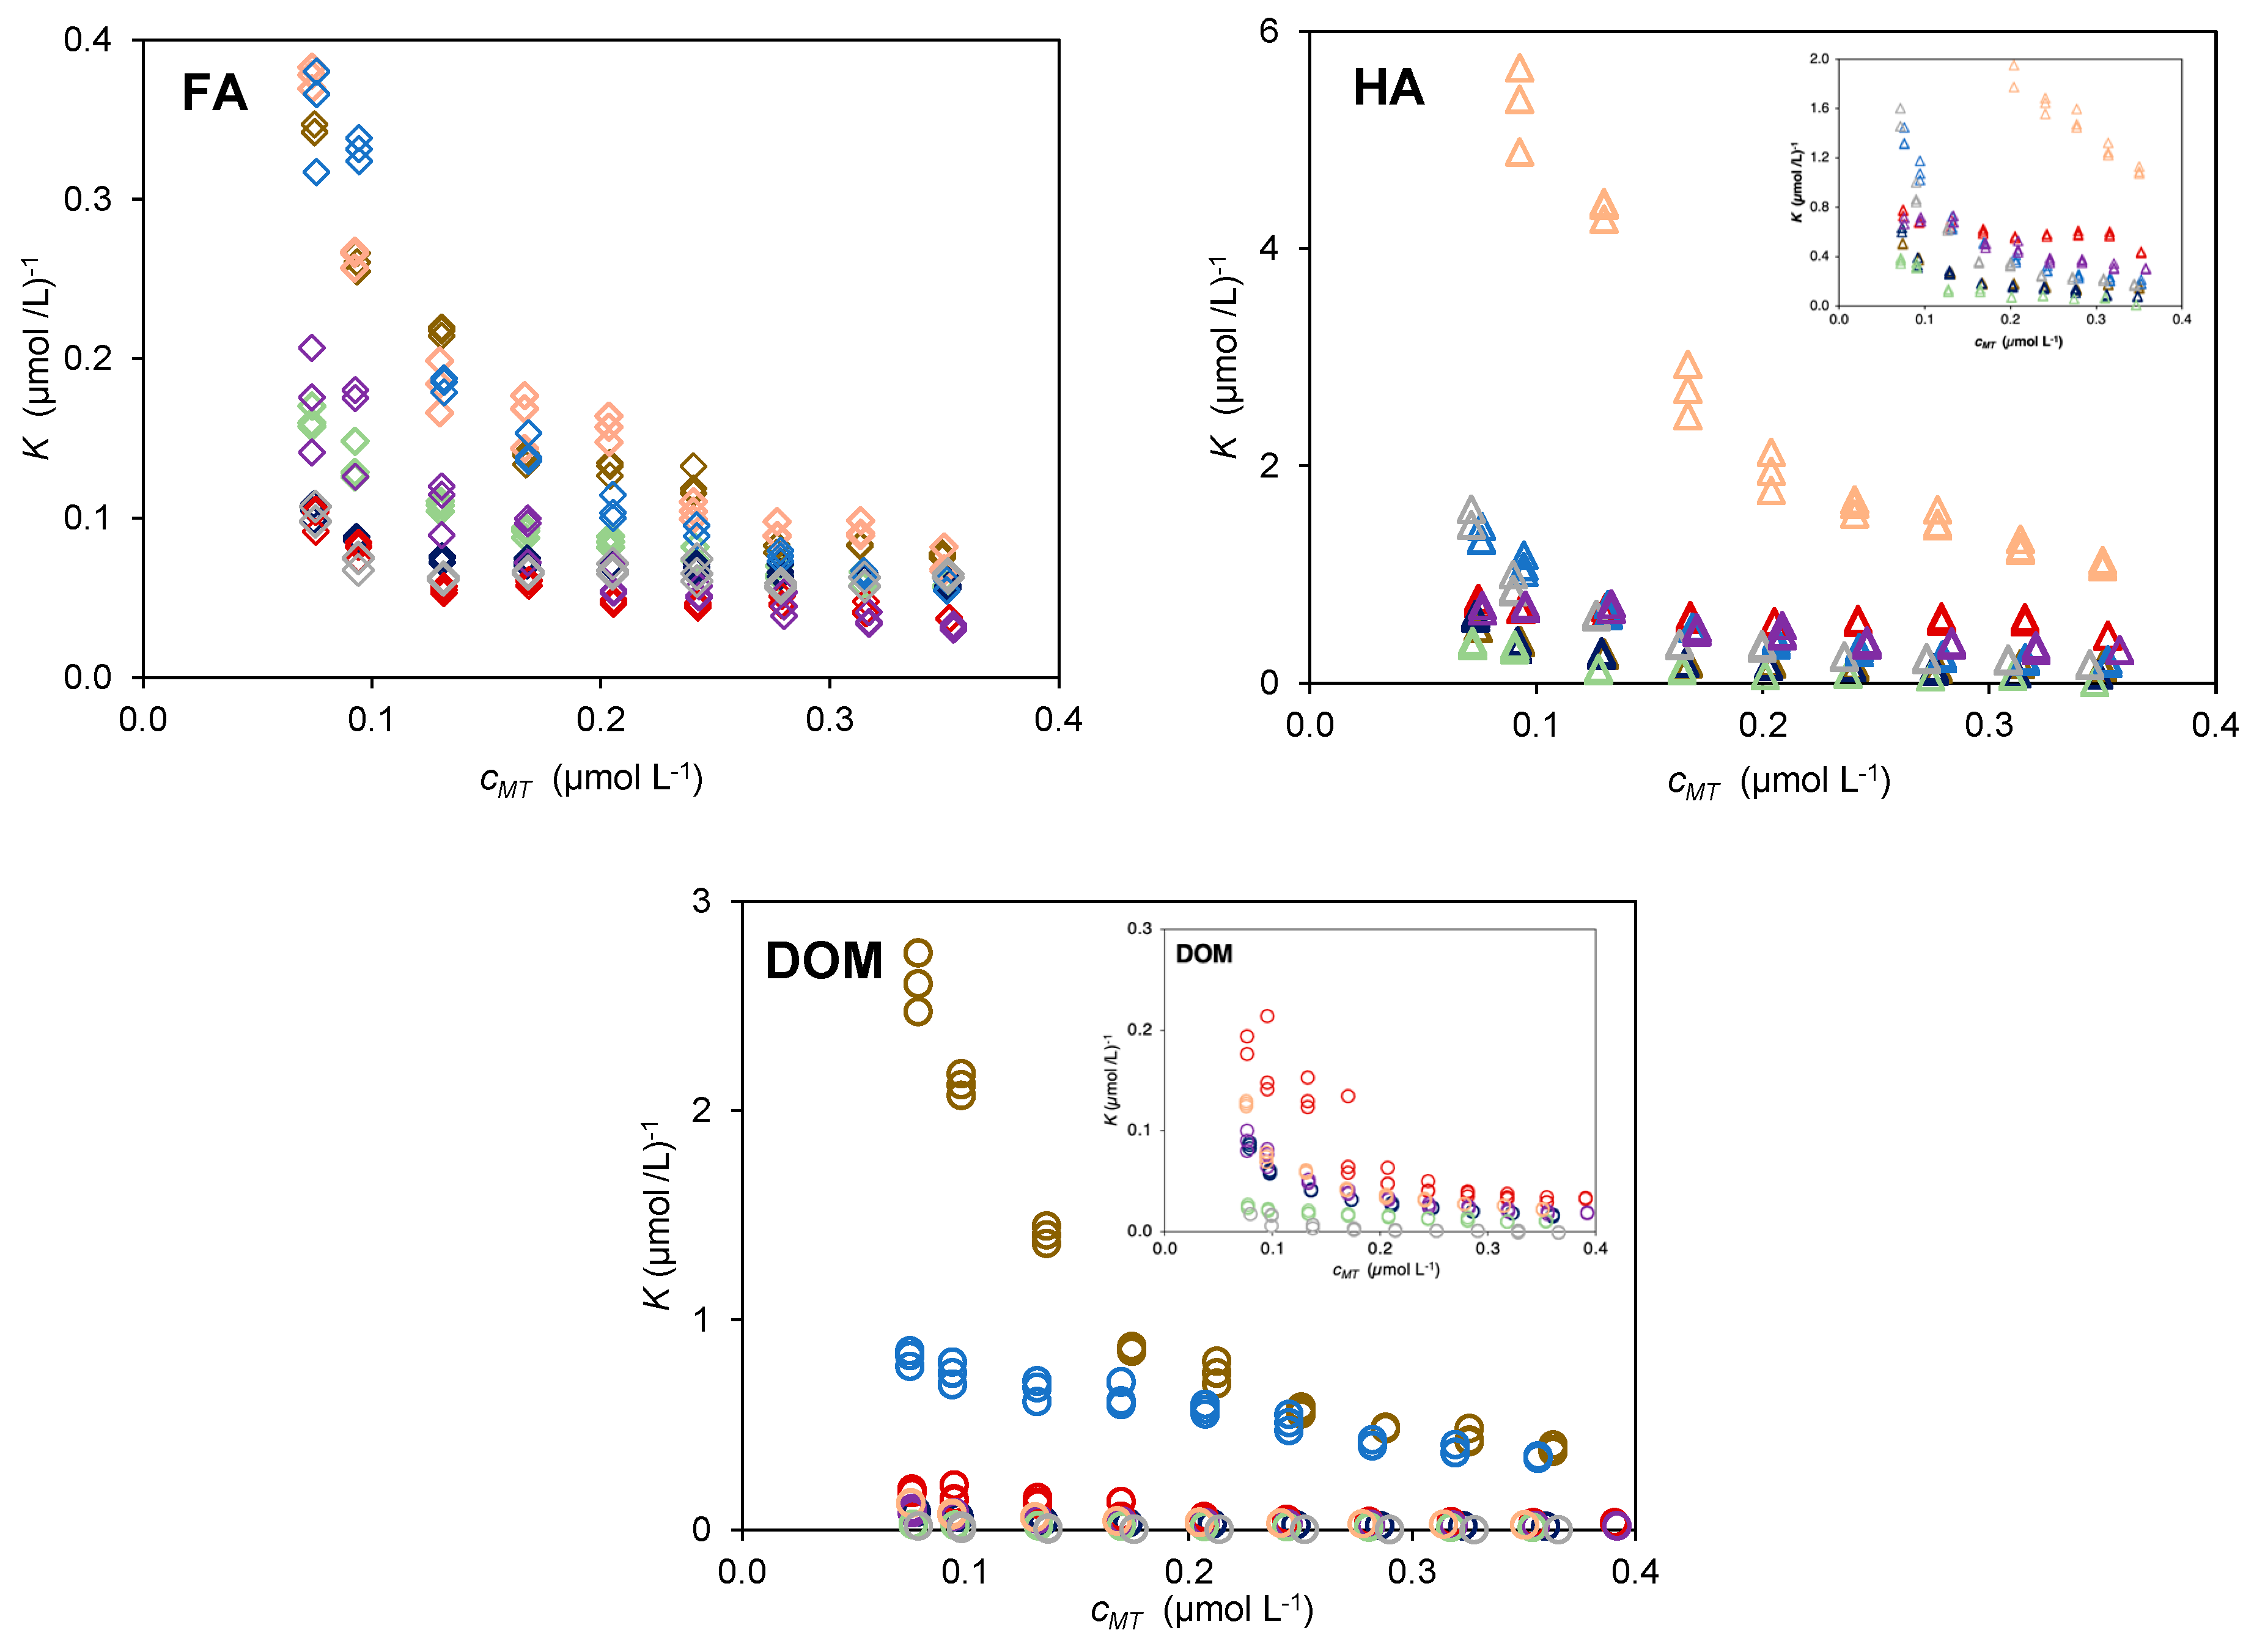
Figure 2 compares the binding curves from extracts of the same nature. Each plot show results from the different composts and one fertiliser. The absolute variation in
K values for a given extract can be used to evaluate the heterogeneity in each extract. The HA extracts from CA display the highest heterogeneity (
K values vary from 5.9 (µmol/L)
−1 to 0.63 (µmol/L)
−1), while the CVDW, CVA, CLW, and FLW exhibit the lowest heterogeneities (e.g., for CVDW the
K values vary from 0.77 (µmol/L)
1 to 0.43 (µmol/L
−1). The heterogeneity of the FA extracts is lower than that of the HA extracts. The FA extracts from CUW, CA, and CLW have higher heterogeneity (
K values vary approximately between 0.38 (µmol/L)
−1 and 0.06 (µmol/L)
−1. Regarding the heterogeneity of the DOM extracts, CLW displays the highest one (
K values varying between 2.75 (µmol/L)
−1 and 0.41 (µmol/L)
−1) as opposed to CVA which displayed the least heterogeneous extract (
K values vary between 0.03 (µmol/L)
−1 and 0.01 (µmol/L)
−1).
The relative position of the experimental points of each sample on the plots in
Figure 2 provides information on the relative reactivity of each type of extract. The FA extracts show similar reactivity among this set of materials, as the data points of the different samples are very close to each other. The HA extracts from CA stands out with the highest values of
K and the remaining samples can also be differentiated. The DOM extracts from CLW displayed the highest values followed by CUW, while the points from the remaining composts appear very close to each other.
2.2. Evaluation of the Extent of Cd2+ Binding by the Different Extracts
While the reactivity of the extracts is important for their characterization, its operational relevance is limited in compost applications, such as in agriculture. The effectiveness of the interaction between HA, FA, and DOM with the environment (either soil or plants) depends not only on the reactivity of the extracts but also on the content of each extract in the compost. To establish the appropriate compost dose for the desired effects, it is necessary to quantify the abundance of each extract which can be expressed in terms of the carbon content of each humic extract, CHS, and dissolved organic matter, CDOM (in gC kgcompost−1).
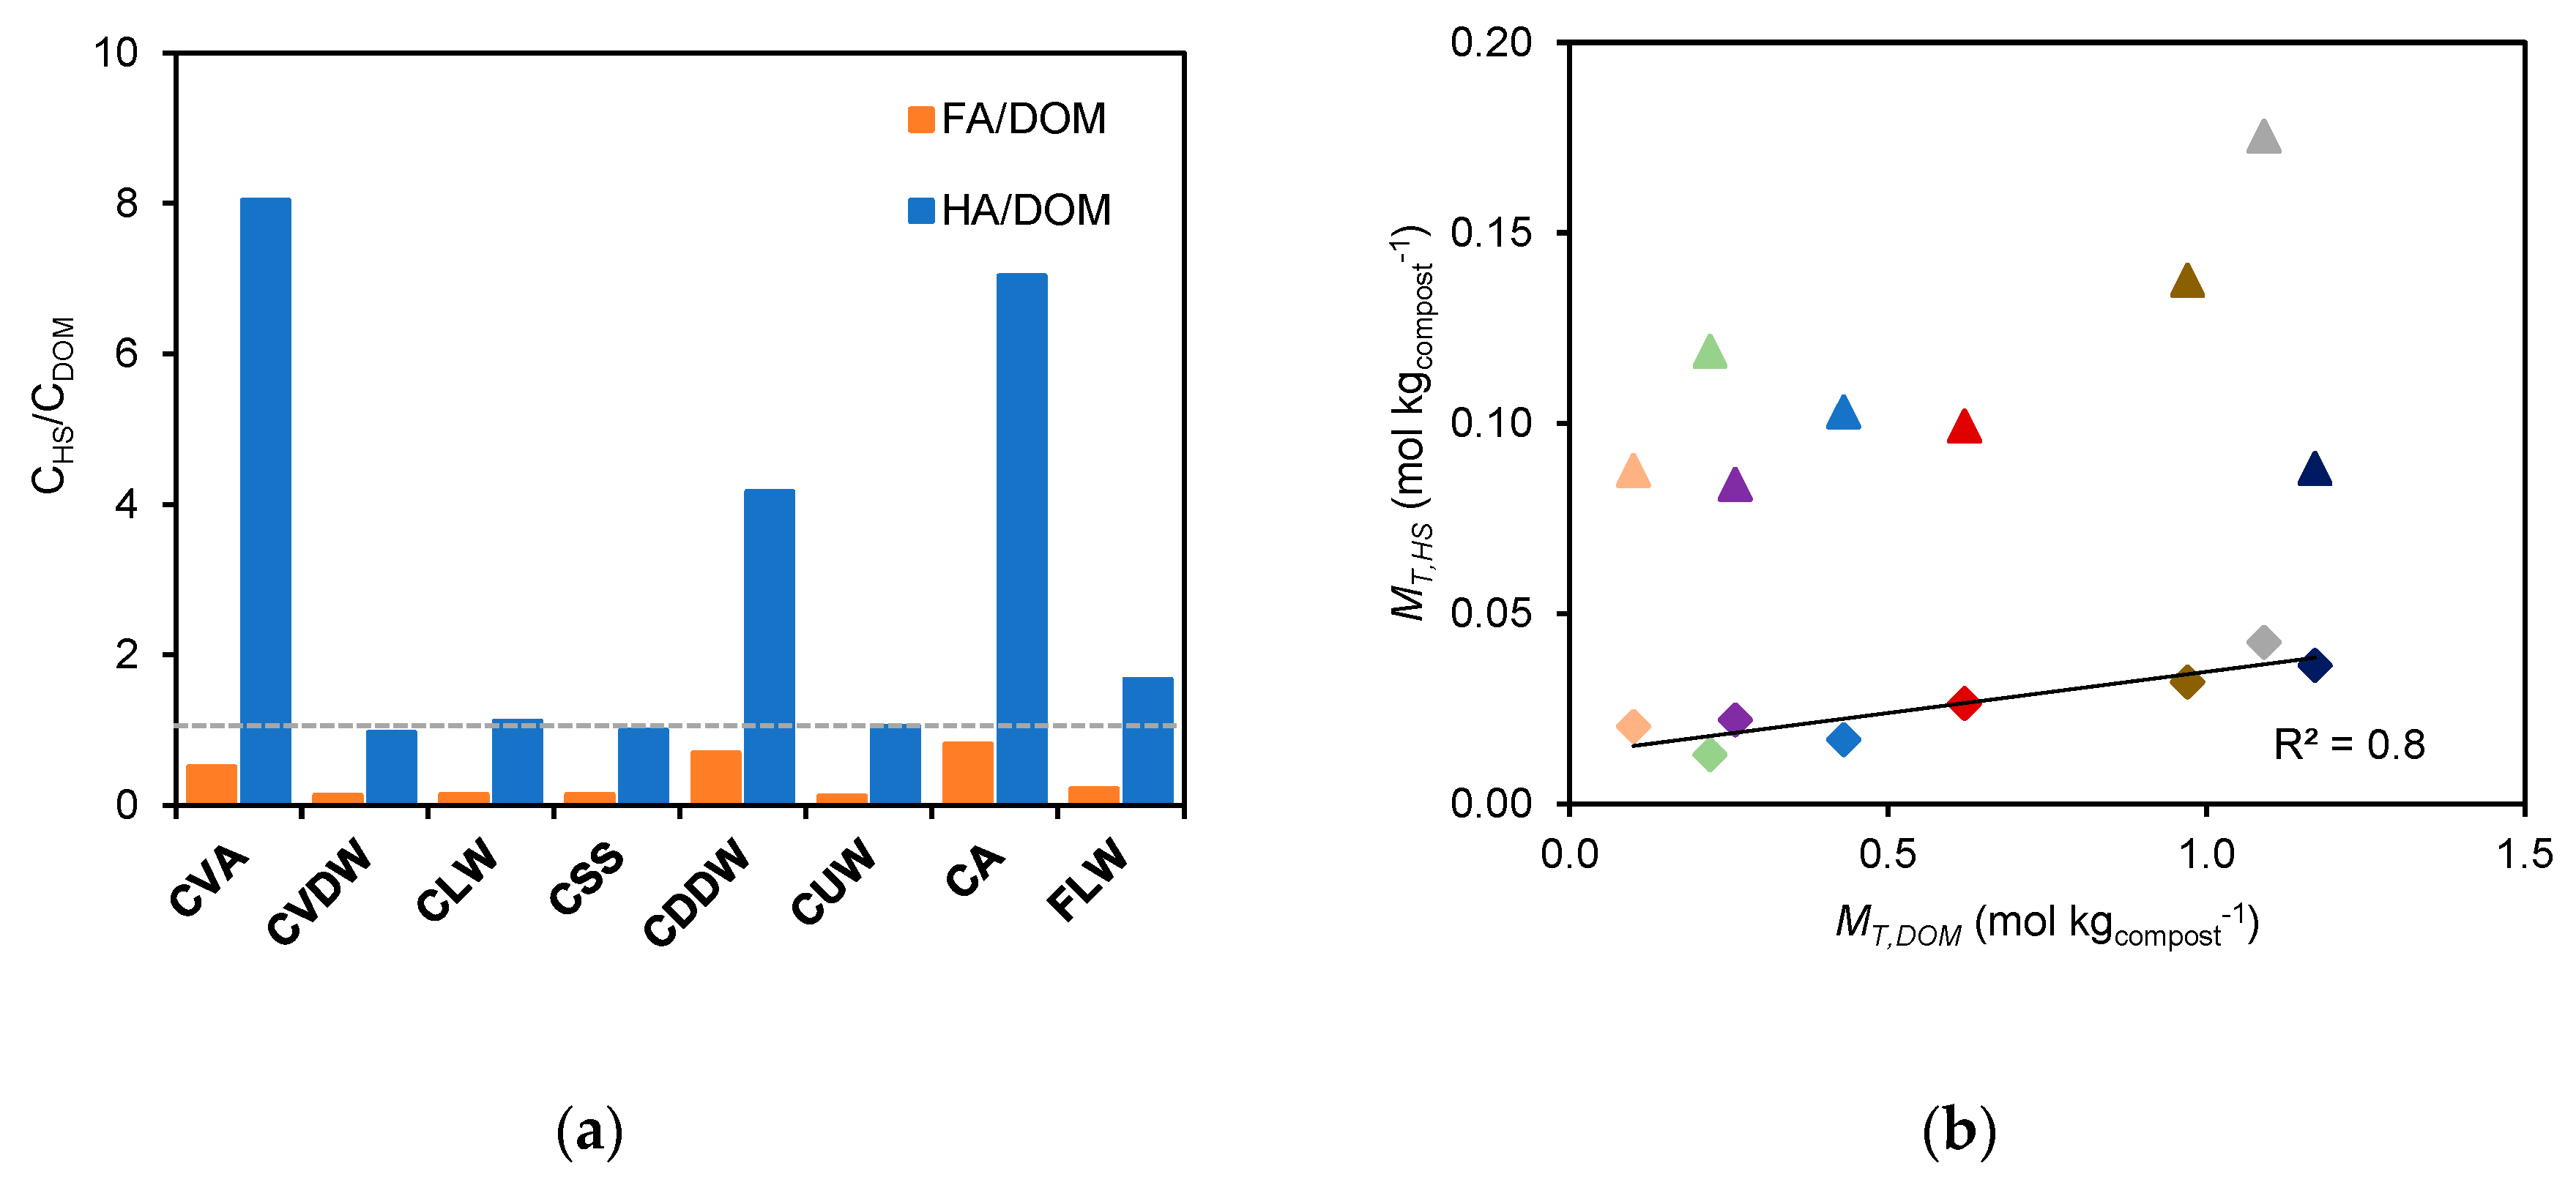
The carbon content of the HA and FA extracts for each sample is compared with that of the DOM in
Figure 3a. The data used to calculate the results in
Figure 3a, including carbon content and extraction yields, are shown in
Table S2. For most of the characterized composts and the fertiliser, the amount of carbon of DOM is similar to that of HA, with a ratio
CHA/
CDOM ≈1. However, for samples CVA, CA, and CDDW, the HA extracts contain 8 to 4 times more carbon than the respective DOM. The FA extracts in all samples contain lower amounts of carbon than the respective DOM, with ratios of
CFA/
CDOM less than 1 for all composts and an average value of 0.35.
Figure 3b compares the abundance of acid sites in humic extracts (
MT,HSS) and DOM (
MT,DOM). The acid sites abundance, expressed in mol kg
compost−1, was calculated using the proton titration values
MT (mmol g
C−1) from
Table S2 [
16] and the carbon content (expressed in g
C kg
compost−1) of each extract (
CHS or
CDOM).
The high correlation (r = 0.9) found between M
T values of both FA and DOM extracts is likely due to their similar composition. The solubility of the FA in neutral or slightly acidic solutions means that it may be a significant fraction of the organic species present in DOM, along with other hydrophilic substances, such as transphilic acids, which are known to play a significant role in the fouling of ultrafiltration membranes in water treatment plants that are recovered (and can be recovered using a XAD-4 column) [
17,
18]. Additionally, the abundance of acid sites
per kg of compost in DOM is roughly 20 times higher than that found for the FA extracts. This discrepancy may be due to the purification process used to obtain FA extracts, which may result in a loss of low molecular weight organic acids. Additionally, the hydrolysis of divalent (Ca, Mg) and trivalent cations (Al and Fe) present in DOM (with values ranging from 28.6 mg kg
−1 (CA) to 171.1 mg kg
−1 (CSS)) [
3], may also contribute to the overestimation of the acid sites in DOM compared with the extensively washed FA extracts.
The average abundance of acid sites in HA was found to be 5 times lower than that of the DOM extracts when expressed in kgcompost−1. This discrepancy may be due to the significant loss of carbon content in the humic fraction during purification and the presence of high levels of divalent and trivalent cations. In terms of carbon content and abundance of acid sites, DOM appears to be more significant than humic extracts when it comes the impact on soil acid-base properties. This is particularly relevant when solid compost is applied directly to farmland rather than using of HA/FA formulations that are commercially available or prepared by those with technical expertise.
After determining the carbon content and the amount of acid groups, the comparison between the extracts was conducted by measuring the extent of the Cd
2+ binding, referred to as
cML. This value, expressed in mmol kg
compost−1 was calculated by referencing the Cd
2+ binding by each extract to 1 kg of compost. The calculation was based in complexation data at pH 7.0 and took into account the abundance of the extracts using Equations (1) and (2) for the humic substances and water-soluble extracts, respectively:
where
cML (mol L
−1) and
cHS (kg
HS L
−1) are the concentrations of metal complex and of organic matter (HA and FA), respectively, obtained from the electrochemical assay; Y is the yield of the HA/FA extractions (in g
HS kg
compost−1),
Fd is the dilution factor (
Fd = VDOM/VTotal) and 50 corresponds to the amount of compost
per litre used to prepare the equilibrium solution (g
compost L
−1).
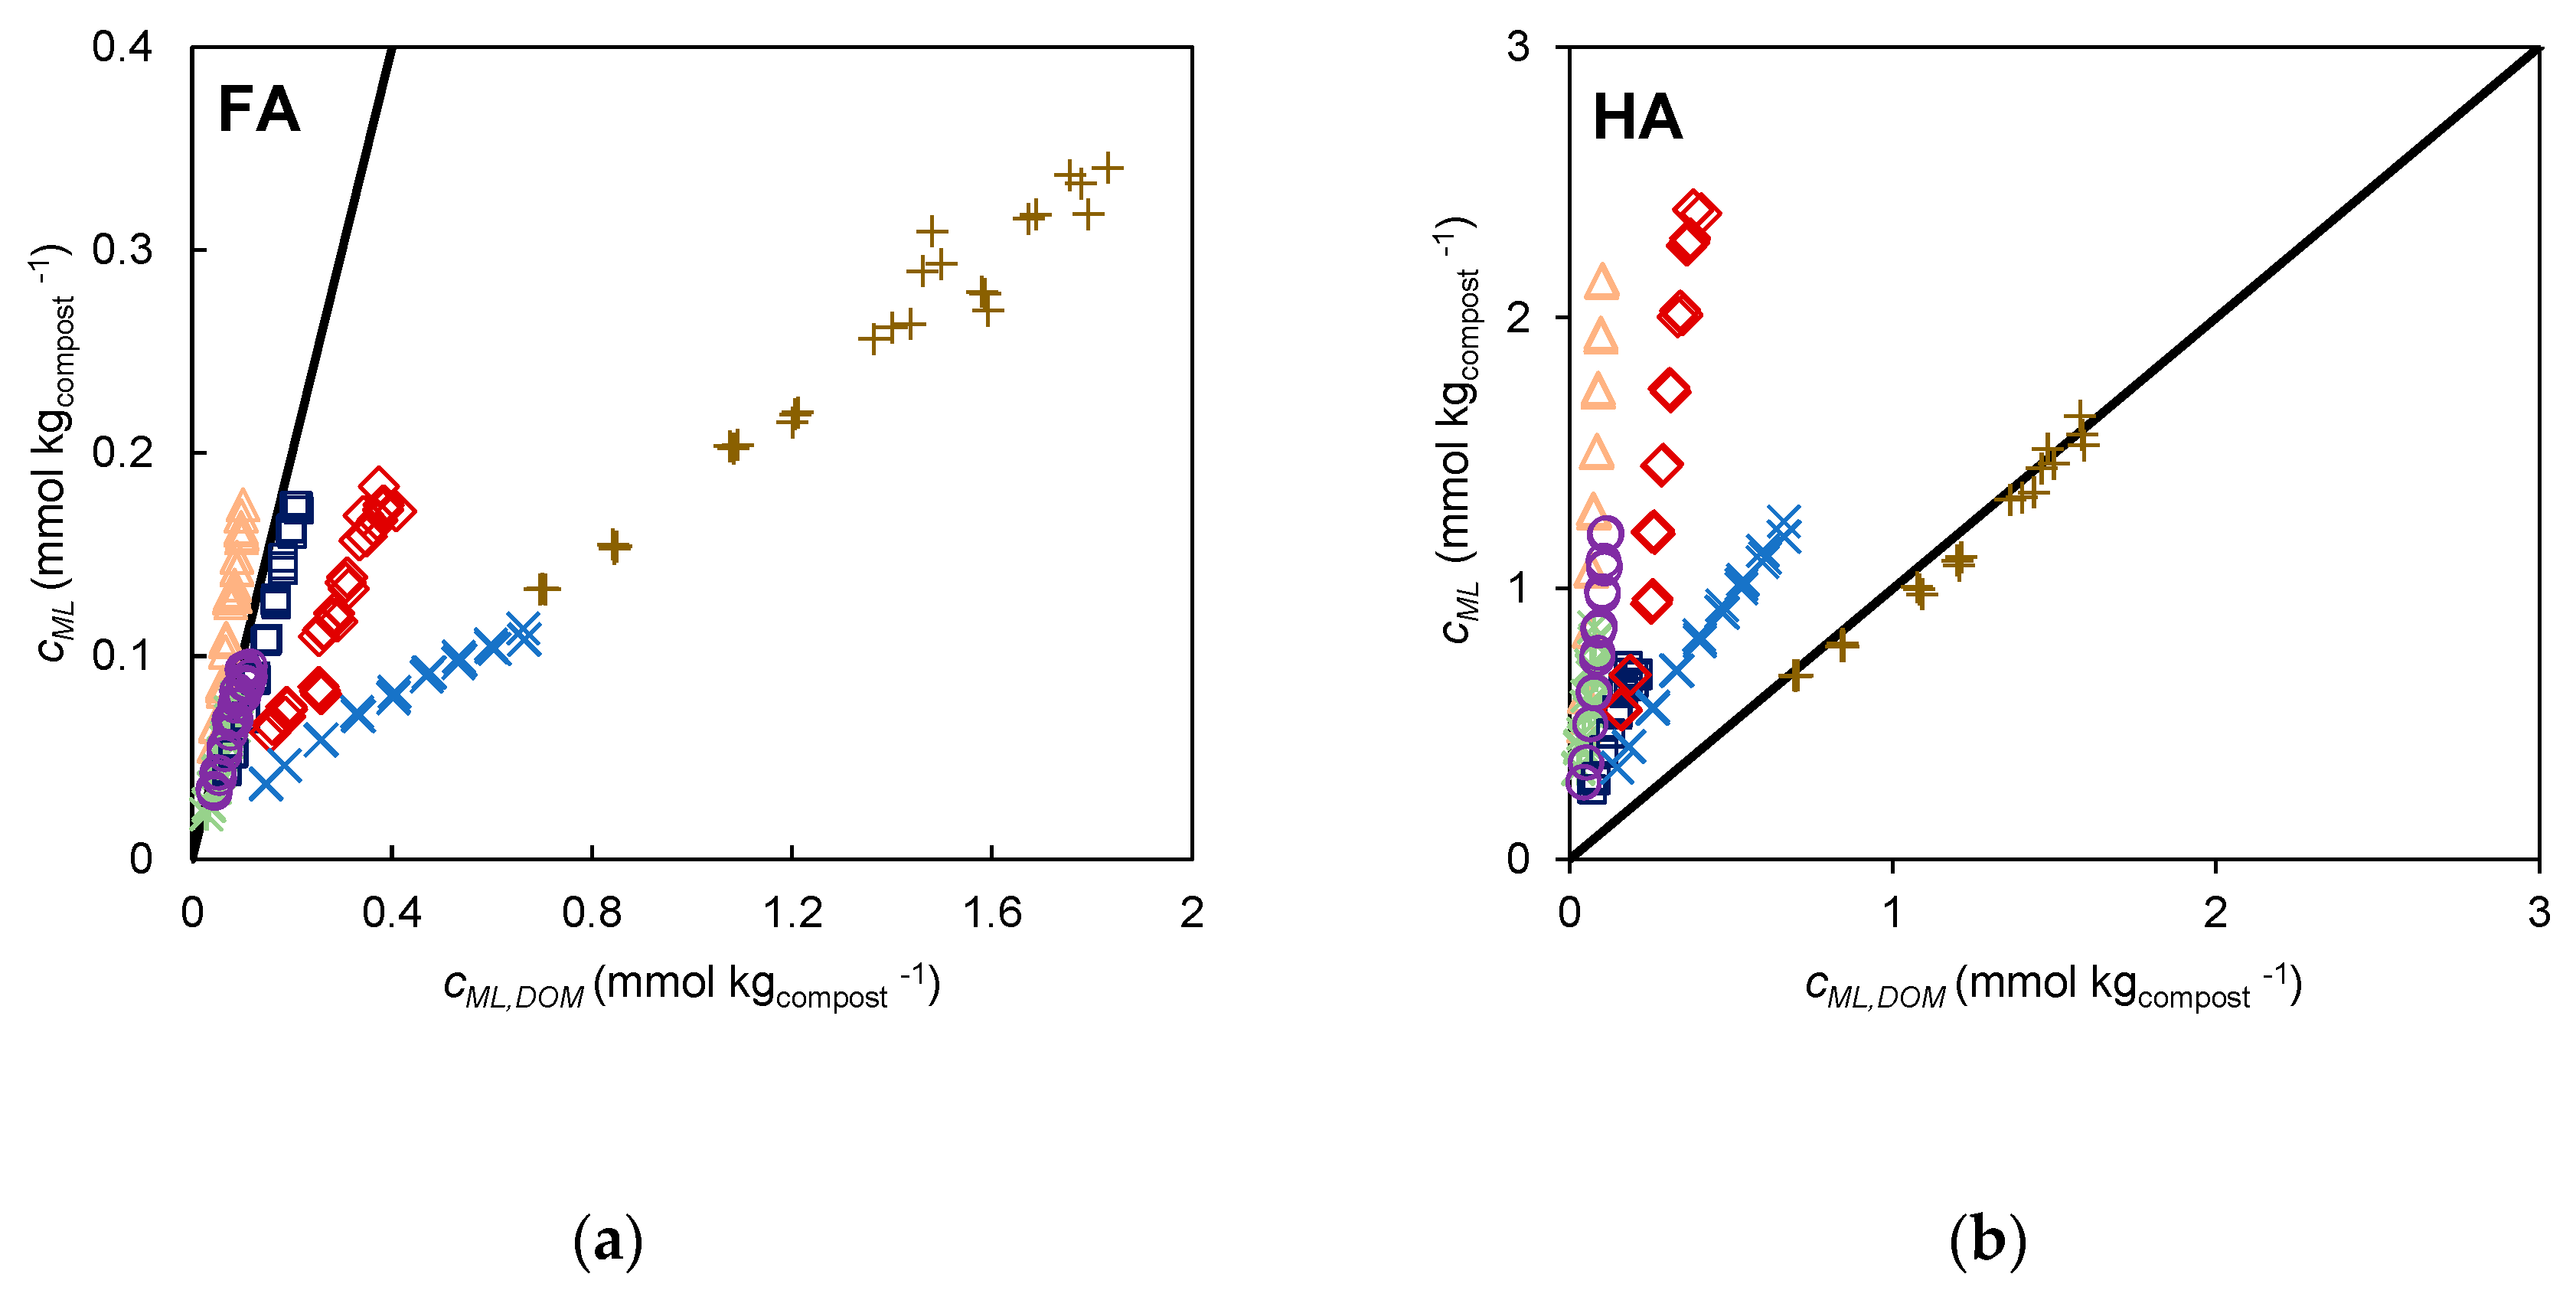
From
Figure 4a, it is observed that the binding extent of the FA extracts for CA, CSS, CVA, and CDDW is similar to that of DOM, but for CVDW, CUW, and CLW it is lower than that of DOM. This is despite the fact that carbon content and acid sites abundance is much higher for DOM. The slope of the straight lines defined by the experimental points vary from about 1 (for CA, CSS, CVA, and CDDW) to 0.2 (for CUW and CLW), which is considerably higher than the corresponding
MT ratio (0.022, obtained from the slope of the straight line in
Figure 3b). This suggests that DOM is less reactive with Cd
2+ compared with FA, indicating that the chemical structures present in the two extracts are likely different. A similar conclusion can be drawn from the comparison between the extent of binding of HA and DOM shown in
Figure 4b. In this case, all the experimental points, except CLW, are above the
y = x line, despite the carbon content of the majority of the HA extracts (CVDW, CLW, CSS, FLW, and CUW) being comparable to that of DOM and the acid sites abundance being 5 times lower on average than that of DOM.
2.3. Comparison of Extent of Cd2+ Binding of Compost with That of an Uncomposted Organic Fertiliser
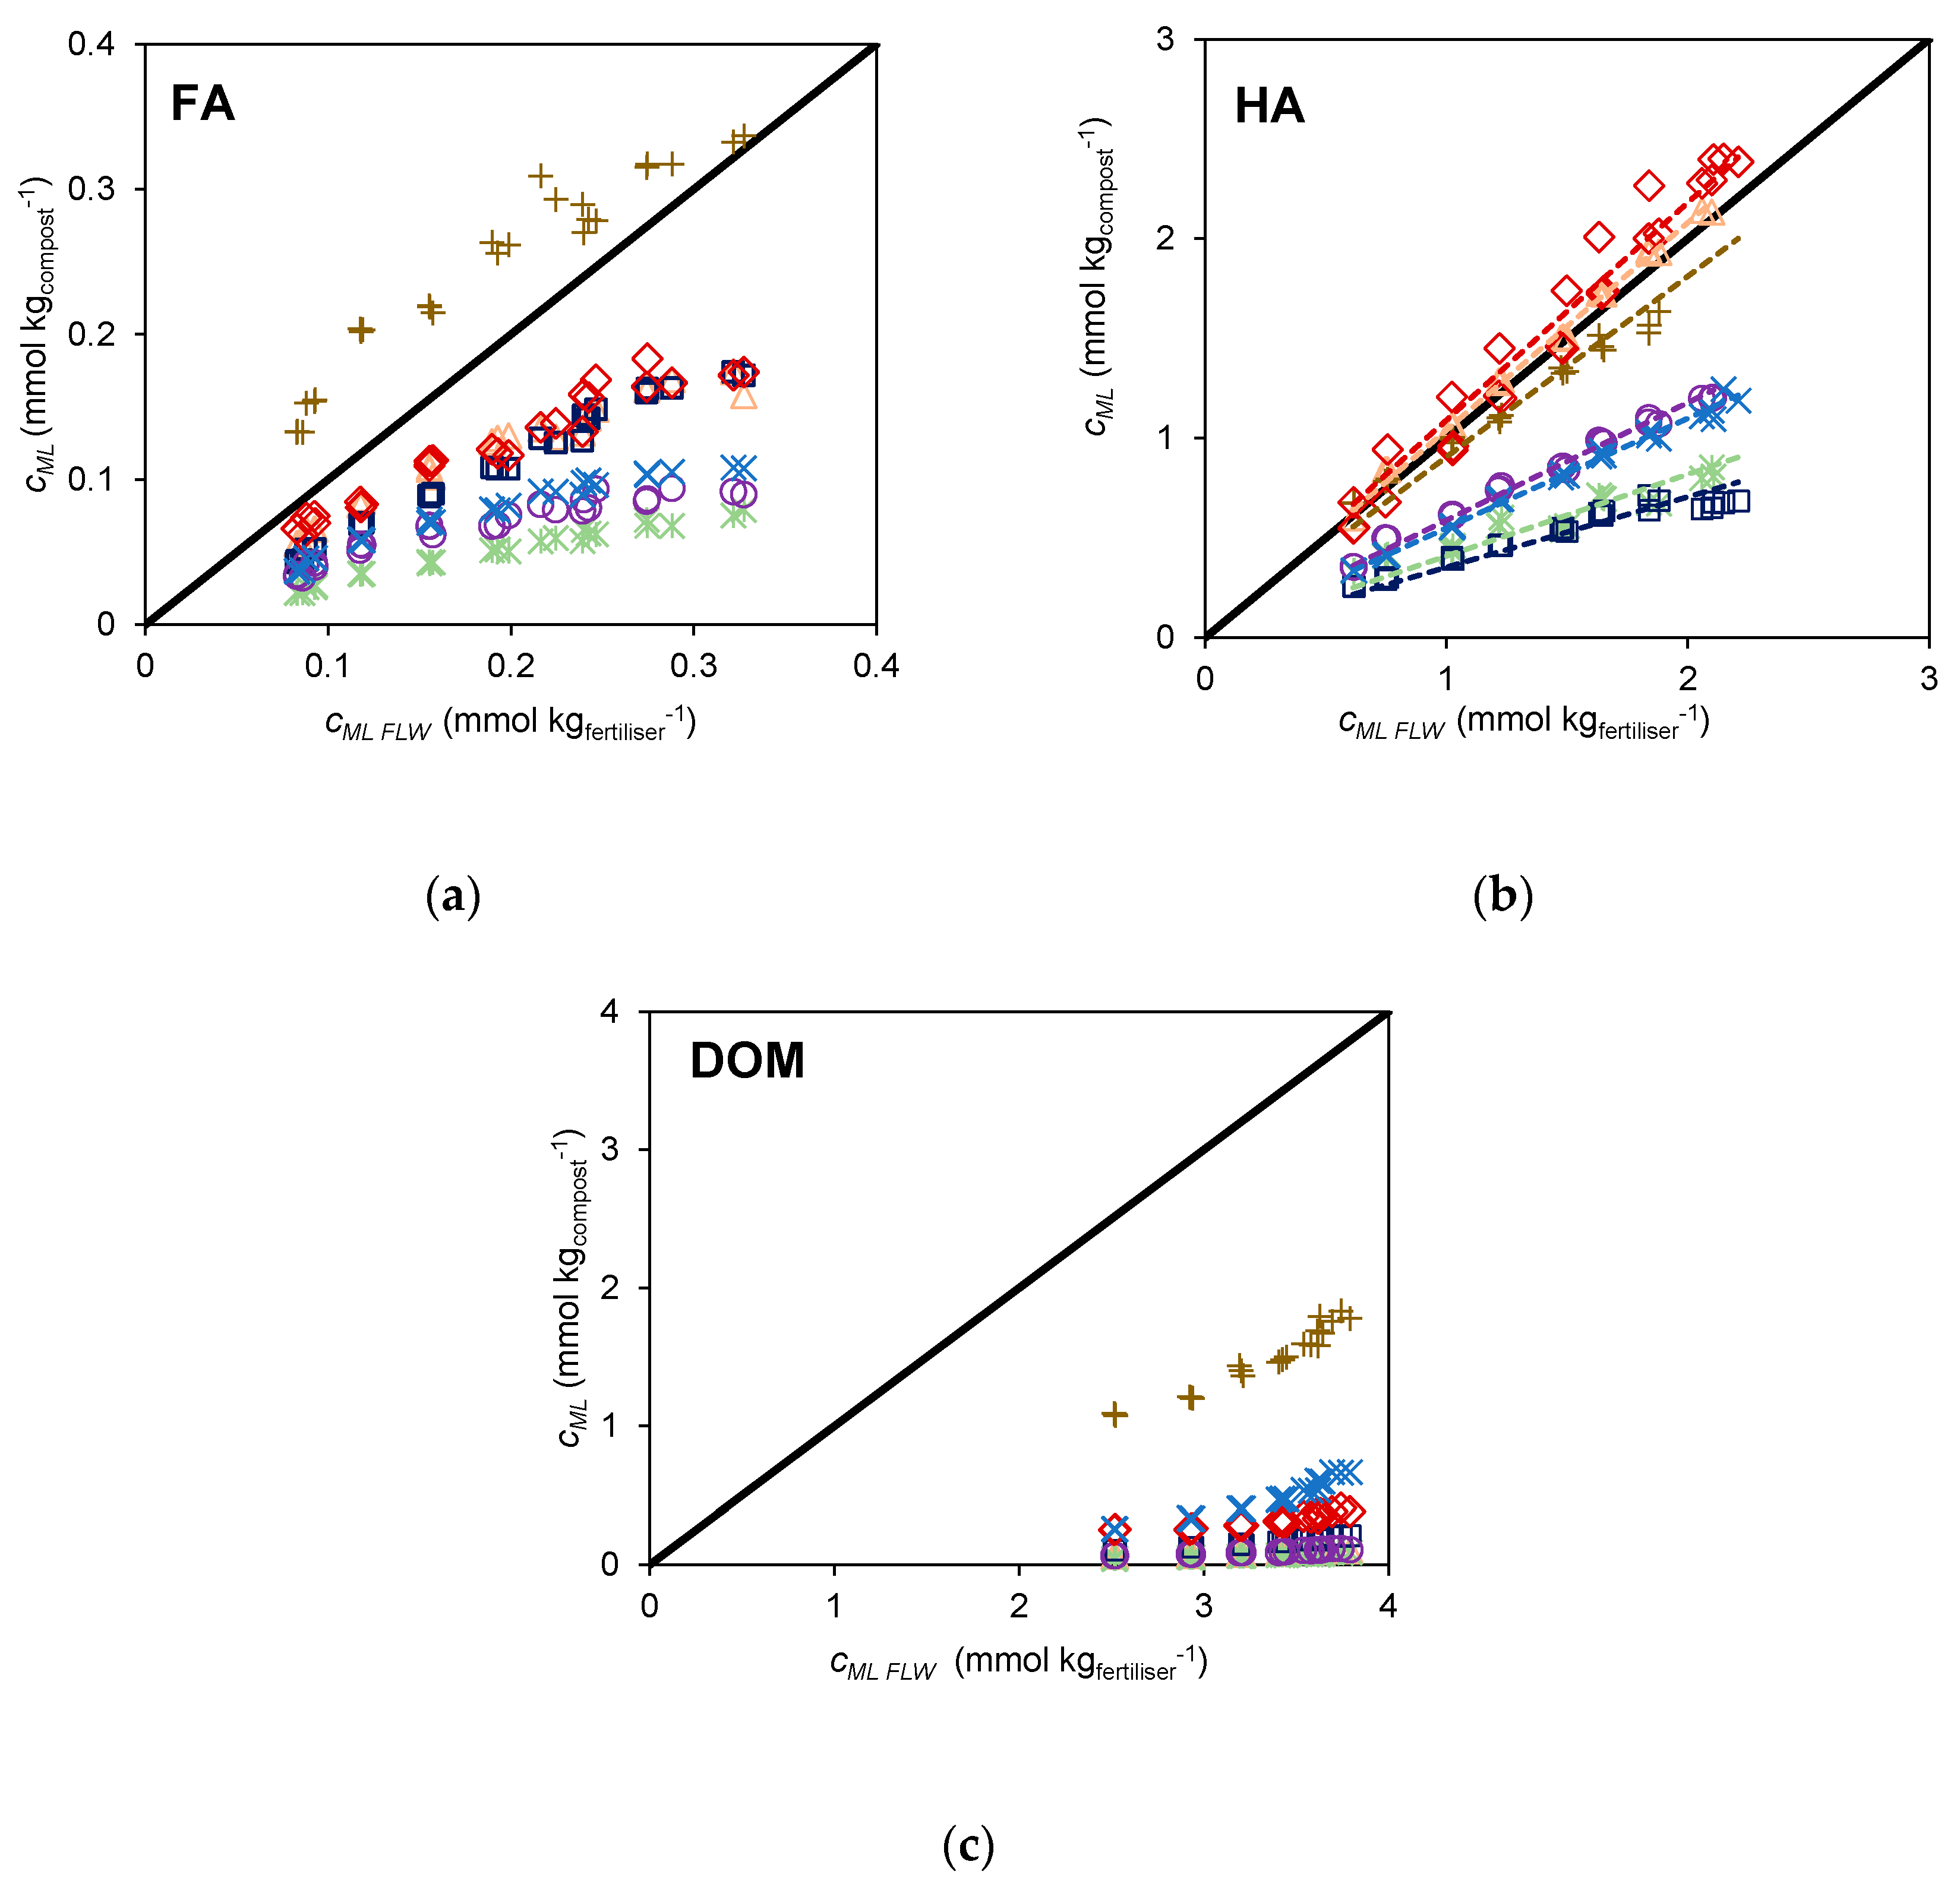
The extent of Cd
2+ binding of the extracts from different composts can be compared with that of identical extracts from an uncomposted livestock fertiliser (manure) which serves as a reference fertiliser. The results from the three types of extracts, FA, HA, and DOM are depicted in
Figure 5. On the vertical axis the values for the composts are represented, and on the horizontal axis the values from the fertiliser are represented. The position of the experimental points of the different composts relative to the
y = x line, which represents equivalence to FLW, provides a simple way to compare the binding extent of all compost extracts. The FA extract of CLW shows the most extensive binding of Cd
2+ and is the only sample whose FA binds more extensively than the FA of FLW (data located above the
y = x line) (
Figure 5a). The FA extracts of all the remaining composts are below this line, indicating lower binding ability than FLW. For the HA extracts, CLW, CVDW, and CA, whose points are distributed along the
y = x line (
Figure 5b), have a Cd
2+ binding extent comparable to FLW, whereas CSS, CDDW, CVA, and CUW, whose points are below the
y = x line, have lower binding ability than FLW.
For the DOM extracts all points are well below the equivalence line (
Figure 5c). CLW is the only sample that stands out from the remaining compost samples whose results are very close to the equivalence line.
Based on these results, we suggest using Cd2+ as probe to compare different composts based on the extent of binding of this metal cation by the HA extract. This ranking highlights composts that contain higher amounts of humic acids, with greater abundance of acid groups and extensive Cd2+ binding. In other words, the extent of Cd2+ binding provides a measure that takes into account both the reactivity and the abundance of humic acids.
The HA extracts were selected for this evaluation due to their relative abundance, the larger absolute values of
cML, and larger differences observed between the
cML values of the different composts. Using this parameter,
cMLobtained from the HA extracts, a ranking can be established by means of an operative scale based on the ratio (
cML)
compos/(
cML)
FLW that compares the reactivity of the HA extracts of composts with respect to the organic fertiliser (corresponding to the slopes of the regression lines in
Figure 5b). This parameter, designated as equivalent mass of fertiliser (
mEF)
, represents the mass of fertiliser required for binding an amount of Cd
2+ as the HA extracts present in 1 kg of compost. This parameter may be used as a quality index to compare composts in terms of different features, such as the price, compared with the application of FLW. The calculated values of the parameter equivalent mass of FLW (
mEF) are displayed in
Figure 6a. In this ranking the composts CVDW, CA, and CLW (with
mEF, values of 1.09, 1.04, and 0.906 kg of FLW, respectively) are in the top places, followed by CDDW and CUW (with 0.589 and 0.550 kg of FLW, respectively) and then CVA and CSS (with 0.409 and 0.353 kg of FLW, respectively).
2.4. Verification of the Potential of the Reactivity Parameter, cML, as a Marker of Compost Bioactivity
The proposed reactivity ranking, based on the binding extent of the extracts, can only be considered valid if there is a correlation between this parameter and the ability of the corresponding composts to promote crop productivity. We attempted to analyse this correlation using results from a previous study where we compared the agricultural effect of the composts CUW, CVA, CA, and the fertiliser FLW in a field study using lettuce (
Lactuca sativa L.) as a model plant, evaluating the total leaf area (
TLA) of the lettuce plants 5 weeks after planting [
3]. The three compost samples and the fertiliser were applied in the field at the doses recommended by the producers. The treatment effect was also evaluated for two doses of CUW and FLW. Using the previously reported
TLA values, a correlation analysis was performed with respect to the extent of the Cd
2+ binding by each extract (calculated from the amount of extract that would be obtained considering the dose of compost/fertiliser placed in each bed) for an addition of 0.10 µmol L
−1 and 0.30 µmol L
−1 of Cd
2+. The extent of binding for the lowest and highest concentrations of added Cd
2+ are
cML,L and
cML,H, respectively. The obtained regression parameters are displayed in
Table 1. While excellent correlations are obtained for HA and FA, for both
cML,L and
cML,H, indicating a strong association between the
TLA and the extent of the Cd
2+ binding, for DOM the correlation coefficient is almost zero. This result indicates that the species present in the DOM extract cannot be considered as markers of the compost/fertiliser bioactivity, in contrast to HA and FA. The proximity between the
TLA value from the control assay (which was not included in the regression analysis) and the intercept of the regression lines support the validity of the correlations found for HA and FA to some extent. It is worth noting that the values for CVA were not included in these correlations due to their disagreement with the general trend defined from the results of the two remaining composts and the fertiliser, including two doses from two of the samples (CUW and FLW), in a total of five independent results. Despite the results of the HA and FA extracts being apparently similar in terms of the adjustment obtained, for HA there is a better proximity between the intercept of the correlation lines and the
TLA value from the control assay. On the other hand, as the values of
cML,L and
cML,H of HA are higher it allows a better differentiation between composts in absolute terms, making it more suitable for the definition of a quality ranking. As the quality of the correlations obtained with
cML,L and
cML,H are similar, it can be concluded that
cML is robust with regard to the added Cd
2+ concentration, despite the heterogeneity of acid sites that implies an increasing participation of weaker groups to increasing concentrations of added Cd
2+.
The plot in
Figure 6b shows the correlation between the mean values of
TLA and
cML,L for the HA, with the straight line representing the correlation line for five out of six independent results. For comparison, the plot for
cML,H can be found in the
Supplementary Material (Figure S1).
Although the verification of the proposed parameter is limited, as it was performed with a reduced number of composts and a single culture, it supports further research on the use of this reactivity parameter in assessing composts quality.
The most surprising result of this study is the correlation between a result from a culture grown under natural field conditions (TLA) and a reactivity parameter purified humic extracts, which do not contain the fraction of the most soluble constituents.
The fact that the most effective markers of compost bioactivity are not the most accessible from the point of view of ease of release into soil through irrigation or precipitation may seem intriguing. However, several processes in the rhizosphere can facilitate the adsorption of bioactive components, such as root exudates rich in organic acids, which can promote the separation of humic aggregates and provide bioactive substances (phytohormones, HA, and FA) that can induce plant growth and other physiological, biochemical, and metabolic changes [
7].
These organic acids can modify the size of humic substances aggregates [
19], allowing for the penetration of the constituents of lower molecular weight into cells that can induce various responses in plants, such as the polar transport of auxin and stimulation of root plasma membrane H
+-ATPase [
20], as well as mediating the direct transport of nutrients [
21]. These effects demonstrate the existence of intense soil–root–stem crosstalk mediated by HA/FA [
22].


 ,
, 


