Article

Byproducts of Globe Artichoke and Cauliflower Production as a New Source of Bioactive Compounds in the Green Economy Perspective: An NMR Study

1
Food Chemistry Lab, Department of Chemistry and Technology of Drugs, Sapienza University of Rome, P. le Aldo Moro 5, 00185 Rome, Italy
2
“Annalaura Segre” Magnetic Resonance Laboratory, Institute for Biological Systems, CNR, Via Salaria, Km 29,300, 00015 Monterotondo, Italy
3
Department of Agricultural and Forest Sciences, University of Tuscia, Via San Camillo de Lellis, snc, 01100 Viterbo, Italy
*
Author to whom correspondence should be addressed.
These authors contributed equally to this work.
Molecules 2023, 28(3), 1363; https://doi.org/10.3390/molecules28031363
Submission received: 21 December 2022 / Revised: 25 January 2023 / Accepted: 26 January 2023 / Published: 31 January 2023

Abstract

:
The recovery of bioactive compounds from crop byproducts leads to a new perspective way of waste reutilization as a part of the circular economy. The present study aimed at an exhaustive metabolite profile characterization of globe artichoke and cauliflower byproducts (leaves, stalks, and florets for cauliflower only) as a prerequisite for their valorization and future implementations. The metabolite profile of aqueous and organic extracts of byproducts was analyzed using the NMR-based metabolomics approach. Free amino acids, organic acids, sugars, polyols, polyphenols, amines, glucosinolates, fatty acids, phospho- and galactolipids, sterols, and sesquiterpene lactones were identified and quantified. In particular, globe artichoke byproducts are a source of health-beneficial compounds including chiro-inositol (up to 10.1 mg/g), scyllo-inositol (up to 1.8 mg/g), sesquiterpene lactones (cynaropicrin, grosheimin, dehydrocynaropicrin, up to 45.5 mg/g in total), inulins, and chlorogenic acid (up to 7.5 mg/g), whereas cauliflower byproducts enclose bioactive sulfur-containing compounds S-methyl-L-cysteine S-oxide (methiin, up to 20.7 mg/g) and glucosinolates. A variable content of all metabolites was observed depending on the crop type (globe artichoke vs. cauliflower) and the plant part (leaves vs. stalks). The results here reported can be potentially used in different ways, including the formulation of new plant biostimulants and food supplements.

1. Introduction

Worldwide, thousands of tons of agricultural food waste and byproducts are generated along the fruit and vegetable supply chain, which is one of the categories with the highest wastage rate (approximately 45%) [1]. However, vegetable byproducts and waste still represent a valuable raw material as a source of compounds, both nutrients and secondary metabolites, that can be used for different purposes. Many efforts are currently being made for the valorization of byproducts and wastes from plant sources in contrast to conventional or traditional food waste management practices [2]. Novel and emerging valorization approaches are investigated with the aim to turn the waste into a high value-added resource, combining sustainability, high technology, and cost reduction, according to UN Agenda 2030 goals for Sustainable Development [3]. Indeed, the greater interest in agri-food waste mainly relies in the recovery of bioactive compounds, such as polyphenols, pigments, terpenes, anthocyanins, alkaloids for the discovery and development of new pharmaceuticals, nutraceuticals, and cosmetics ingredients [4,5]; dietary fiber, polysaccharides and polymers, such as pectin, for the development of new functional foods [6] and/or biomaterials, such as cellulose, lignin, [7,8] and, to a lesser extent, proteins for the production of bioactive peptides [9,10].
In this context, governments interested in the reutilization and valorization of local agri-food waste often support the development of innovations in this field. It is the case of the Italian Lazio Region government that funded the research project entitled “Valorization of agri-food waste from the fruit and vegetable sector of Lazio region: from biostimulants for agriculture to supplements for human health”. In the frame of this project, byproducts of two crops, globe artichoke and cauliflower, important to the local economy, were chosen. According to FAO statistical data [11], Italy’s annual production of artichoke and cauliflower is about 3.8 × 10⁸ kg and 3.6 × 10⁸ kg, respectively. Considering that the major part of raw material (approximately 80% in the case of globe artichoke [12] and up to 60% in the case of cauliflower [13]) ends up as solid waste or left in the field, it is clear that a huge amount of waste is continuously generated, giving rise to environmental risks. In the case of globe artichoke, the main byproducts (about 65% of all wastes, [12]) are leaves and stalks, whereas cauliflower byproducts include also one part of the florets. A number of researches were dedicated to the valorization of artichoke byproducts as a source of valuable bioactive compounds, that can be extracted and re-utilized (see [14,15] and reference therein). Until now, the chemical characterization of these byproducts has been focused on single compounds or just a number of components belonging to a specific chemical class. Long-chain inulins have been recovered from bracts and stalks [16], roots [12], and external bracts [17]; polyphenols from leaves [18], stalks, and roots [12], or from bracts [19] have been extracted and characterized. Moreover, inositol isomers from the residual biomass of artichoke have been isolated [17,20]. Extracts with high antioxidant activity can be obtained from artichoke industrial byproducts [21]. After the extraction of bioactive compounds, the residual biomass represents a feedstock for energy production, for example by anaerobic digestion [22]. With respect to globe artichoke, cauliflower byproducts valorization received substantially minor attention with only a few examples relative to the extraction of phenolic antioxidants [23,24,25], dietary fibers [26], and peptide hydrolysates [27].
The analysis of reported studies shows that the valorization of globe artichoke and cauliflower byproducts require an integrated approach not limited to the recovery of single compounds or components of a specific chemical class, but considers the byproduct matrix as a source of different classes of bioactive compounds to be recovered altogether. Here, the untargeted NMR approach is proposed for the valorization of globe artichoke and cauliflower byproducts in a comprehensive way. NMR spectroscopy [28] has been successively applied for the comprehensive metabolite composition analysis of different plant tissues [29] including leaves [30], shoots [31], flowers [32], roots [33], tubers [34], and fruits [35]. Moreover, NMR spectroscopy has been already applied for the investigation of metabolite profiles of eatable parts of globe artichoke (entire heads or heads divided in external bracts and heart tissues) [36,37,38] and cauliflower [39], whereas a comprehensive NMR-based metabolite profiling of non-eatable parts of globe artichoke and cauliflower is still absent. The present study aimed to fill this gap by extending NMR characterization to byproducts, including also the identification of apolar metabolite profiles disregarded in the previous NMR studies. An exhaustive NMR characterization of byproducts is an important starting point for their valorization and for future implementations in the formulation of new products, such as plant growth bio-stimulants and food supplements.

2. Results

Here, the results regarding globe artichoke and cauliflower byproducts are reported separately.

2.1. Globe Artichoke Byproducts Metabolite Profiles

2.1.1. Water-Soluble Metabolites: Assignment of NMR Spectra and Metabolite Identification

The assignments of 1H and 13C NMR spectra of leaves and stalks aqueous extracts reported in Table 1 were based on mentioned studies [36,37,38] and were confirmed by 2D NMR experiments (1H-1H TOCSY, 1H-13C HSQC, 1H-13C HMBC, Figures S1–S7 in the Supplementary Materials) and by comparison with corresponding NMR data of pure standard compounds from BMRB database [40].
The differences in the metabolite profile of leaves and stalks, with respect to heads, were observed. For example, the signals of rhamnose [36], shikimic acid, and gallic acid previously identified in head extracts of globe artichoke [37], were absent in leaves and stalks, whereas additional signals have been observed corresponding to metabolites not previously described including amines (ethanolamine, glycerophosphorylcholine, phosphorylcholine), histidine, acetic acid and two isomers of myo-inositol (scyllo-inositol and chiro-inositol).
Ethanolamine was identified thanks to its characteristic triplet signal at 3.15 ppm from CH2 group, whereas two derivatives of choline, namely, phosphorylcholine and glycerophosphorylcholine, show characteristic singlet signals of N(CH3)3 group at 3.23 and 3.24 ppm, respectively. Two-dimensional 1H-13C HSQC spectrum was used to identify all other 1H and 13C signals from CH2 and CH groups of all these amines definitely confirming the assignment (Table 1, Figure S1).
The characteristic broad singlet at 8.13 ppm (1H) correlated in the 1H-1H TOCSY map with the signal at 7.18 ppm was assigned to CH-2 group of histidine heterocycle. The acetate was identified thanks to its 1H singlet signal at 1.93 ppm correlated with the corresponding 13C signal at 24.4 ppm due to CH3 group.
The 1H and 13C NMR signals of scyllo-inositol and chiro-inositol were assigned using the literature data [41,42]. Usually, the presence of chiro-inositol signals in 1H NMR spectra of plant extracts is hardly visible due to the strong overlapping with the signals from common sugars (glucose, fructose, and sucrose). In fact, the signal of CH-3,4 of chiro-inositol at 3.59 ppm is partially overlapped with that from CH-1 of β-fructofuranose at 3.60 ppm, the signal at 3.76 ppm of CH-2,5 group (chiro-inositol) is masked by the signals from CH-3 of sucrose (3.77 ppm), and CH-6 of α- and β-glucose (3.78 and 3.74 ppm, correspondingly), whereas the signal at 4.05 ppm of CH-1,6 is masked by CH-4′ of sucrose (4.06 ppm) and CH-6 of β-fructopyranose (4.03 ppm). In our case, the multiplet signal of CH-3,4 group of chiro-inositol at 3.59 ppm was chosen for the quantification because it was only partially overlapped with other signals (Figure S8) and the level of chiro-inositol in leaves and stalks was comparable with the level of sugars making feasible the direct quantification.
In the case of scyllo-inositol, its 1H NMR spectrum consists of a single singlet signal at 3.36 ppm usually not overlapped with the signals of other molecules except the methanol signal. The correctness of the assignment was verified by the chemical shift value of the corresponding 13C signal in 1H-13C HSQC map observed at 74.6 ppm in accordance with the literature [42]. This information confirms the presence of scyllo-inositol excluding the presence of methanol whose 13C NMR signal is at 49.3 ppm.
Among the different mono- and di-caffeoylquinic acid derivatives characteristic of globe artichoke [36], only 5-caffeoylquinic (chlorogenic) acid and 3-caffeoylquinic (neochlorogenic) acid were identified in the NMR spectra of leaves and stalk extracts. It is noteworthy that the nomenclature and atom numbering of the ring of quinic acid moiety in caffeoylquinic acids reported in literature are sometimes confusing and misleading. The NMR assignment of chlorogenic and neochlorogenic acid here reported (Table 1) leaned upon correct nomenclature and atom numbering reported by [43,44]. The present assignment is related to the most abundant components and does not exclude the presence of dicaffeoylquinic acids (such as cynarine) as lower-level components. Moreover, the presence of a minor fraction of flavonoids reported in the literature for heads extracts [36,37] cannot be excluded, since the related 1H NMR spectral region (6.4–7.6 ppm) is too overlapped to separate the corresponding signals.

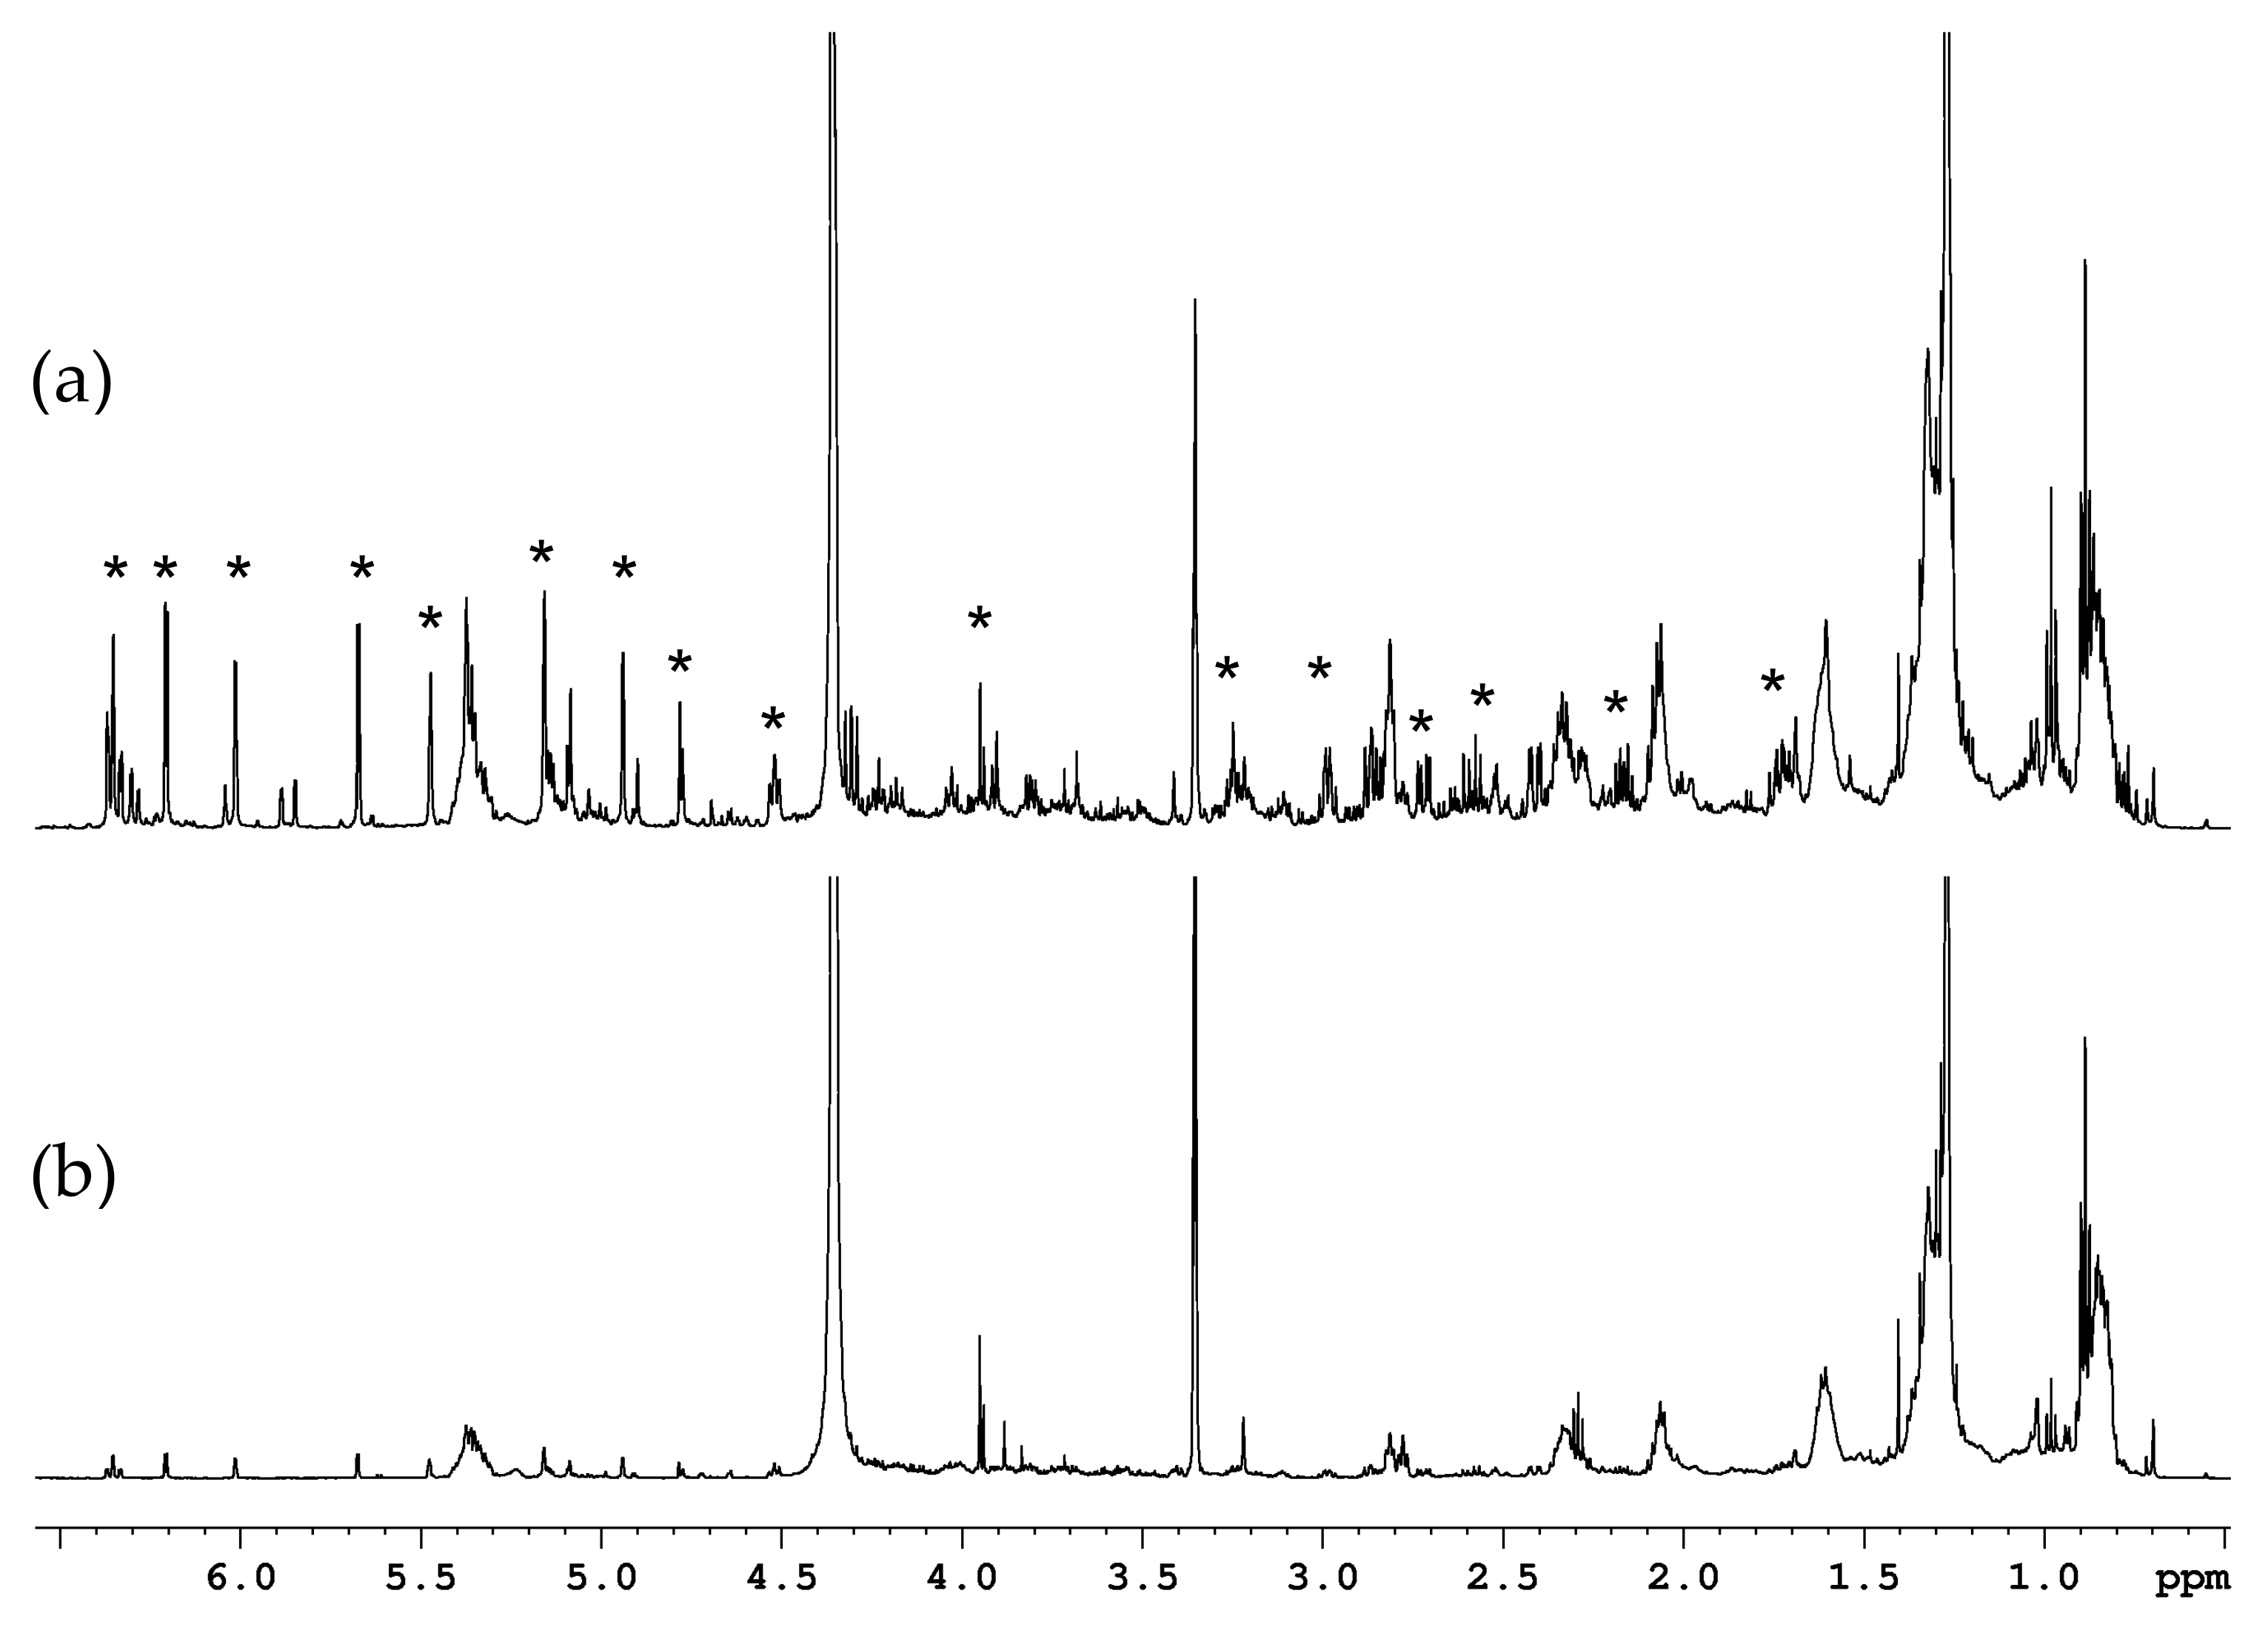
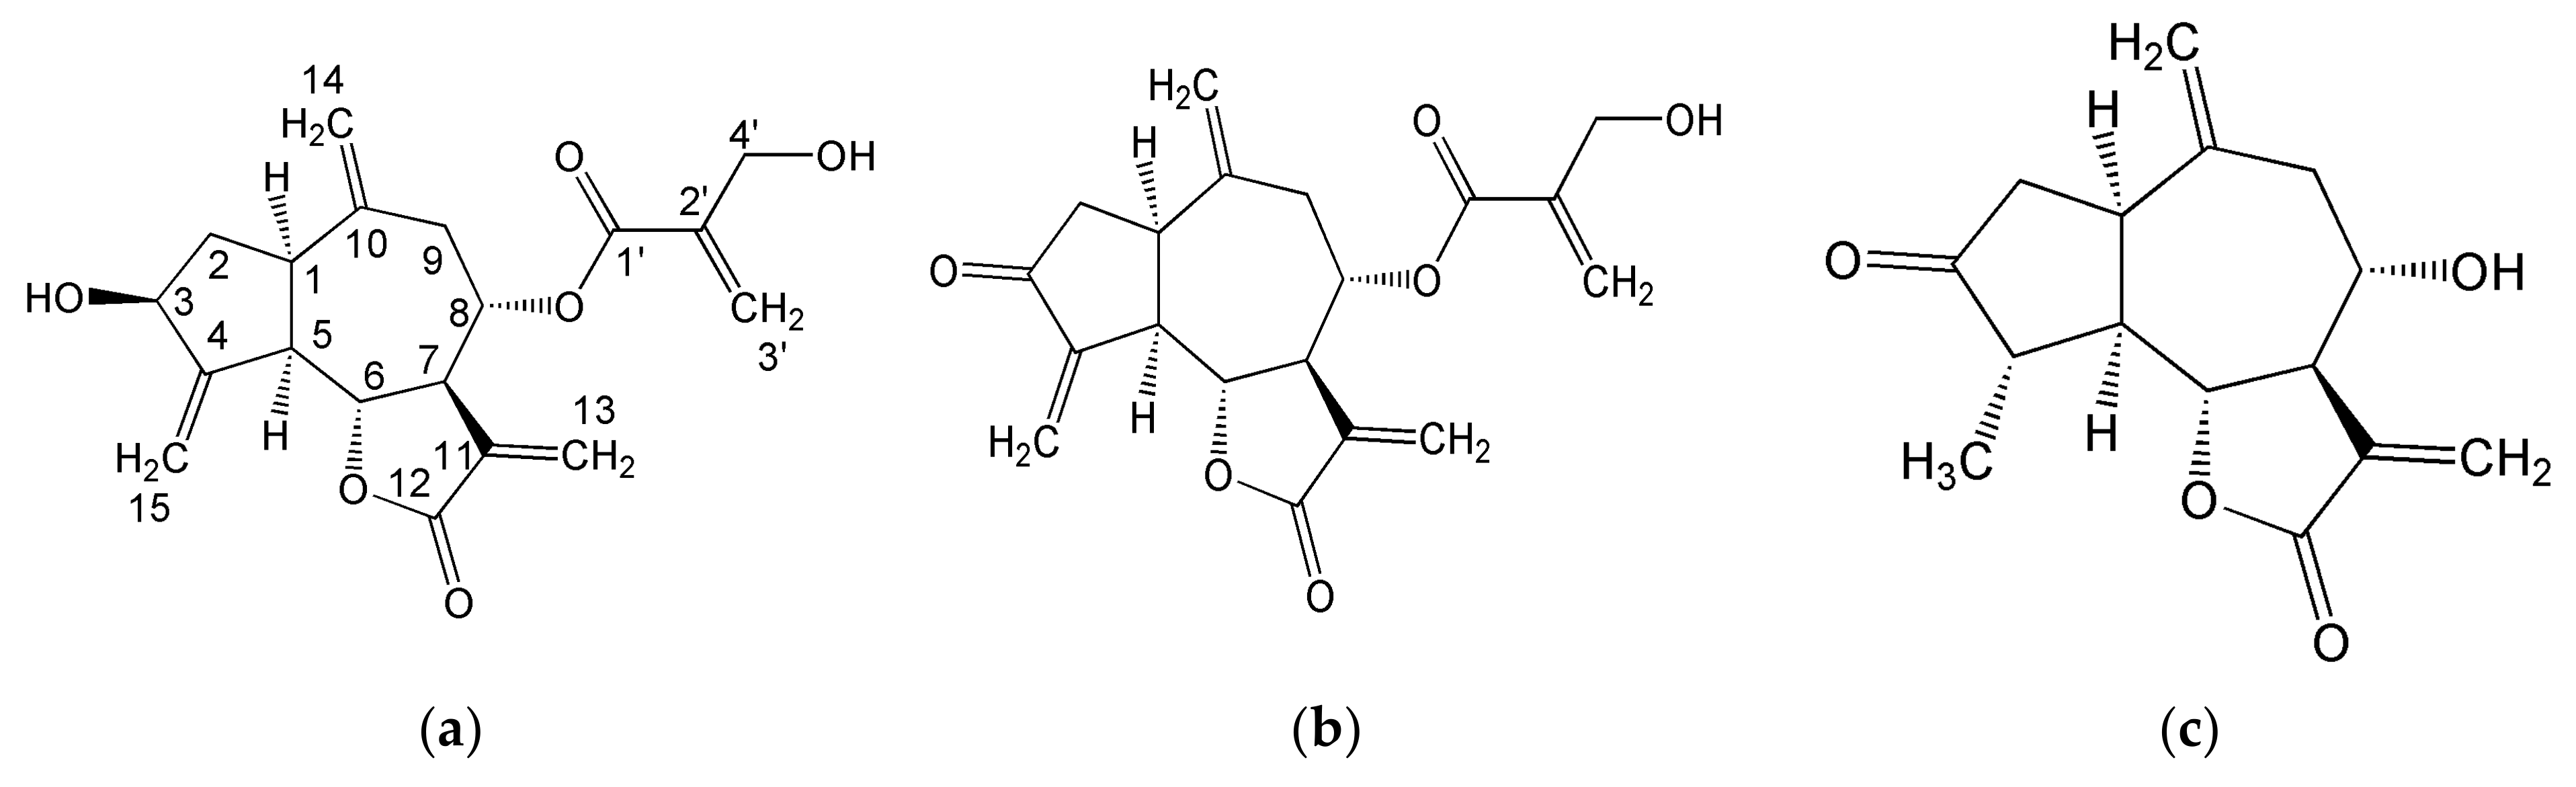
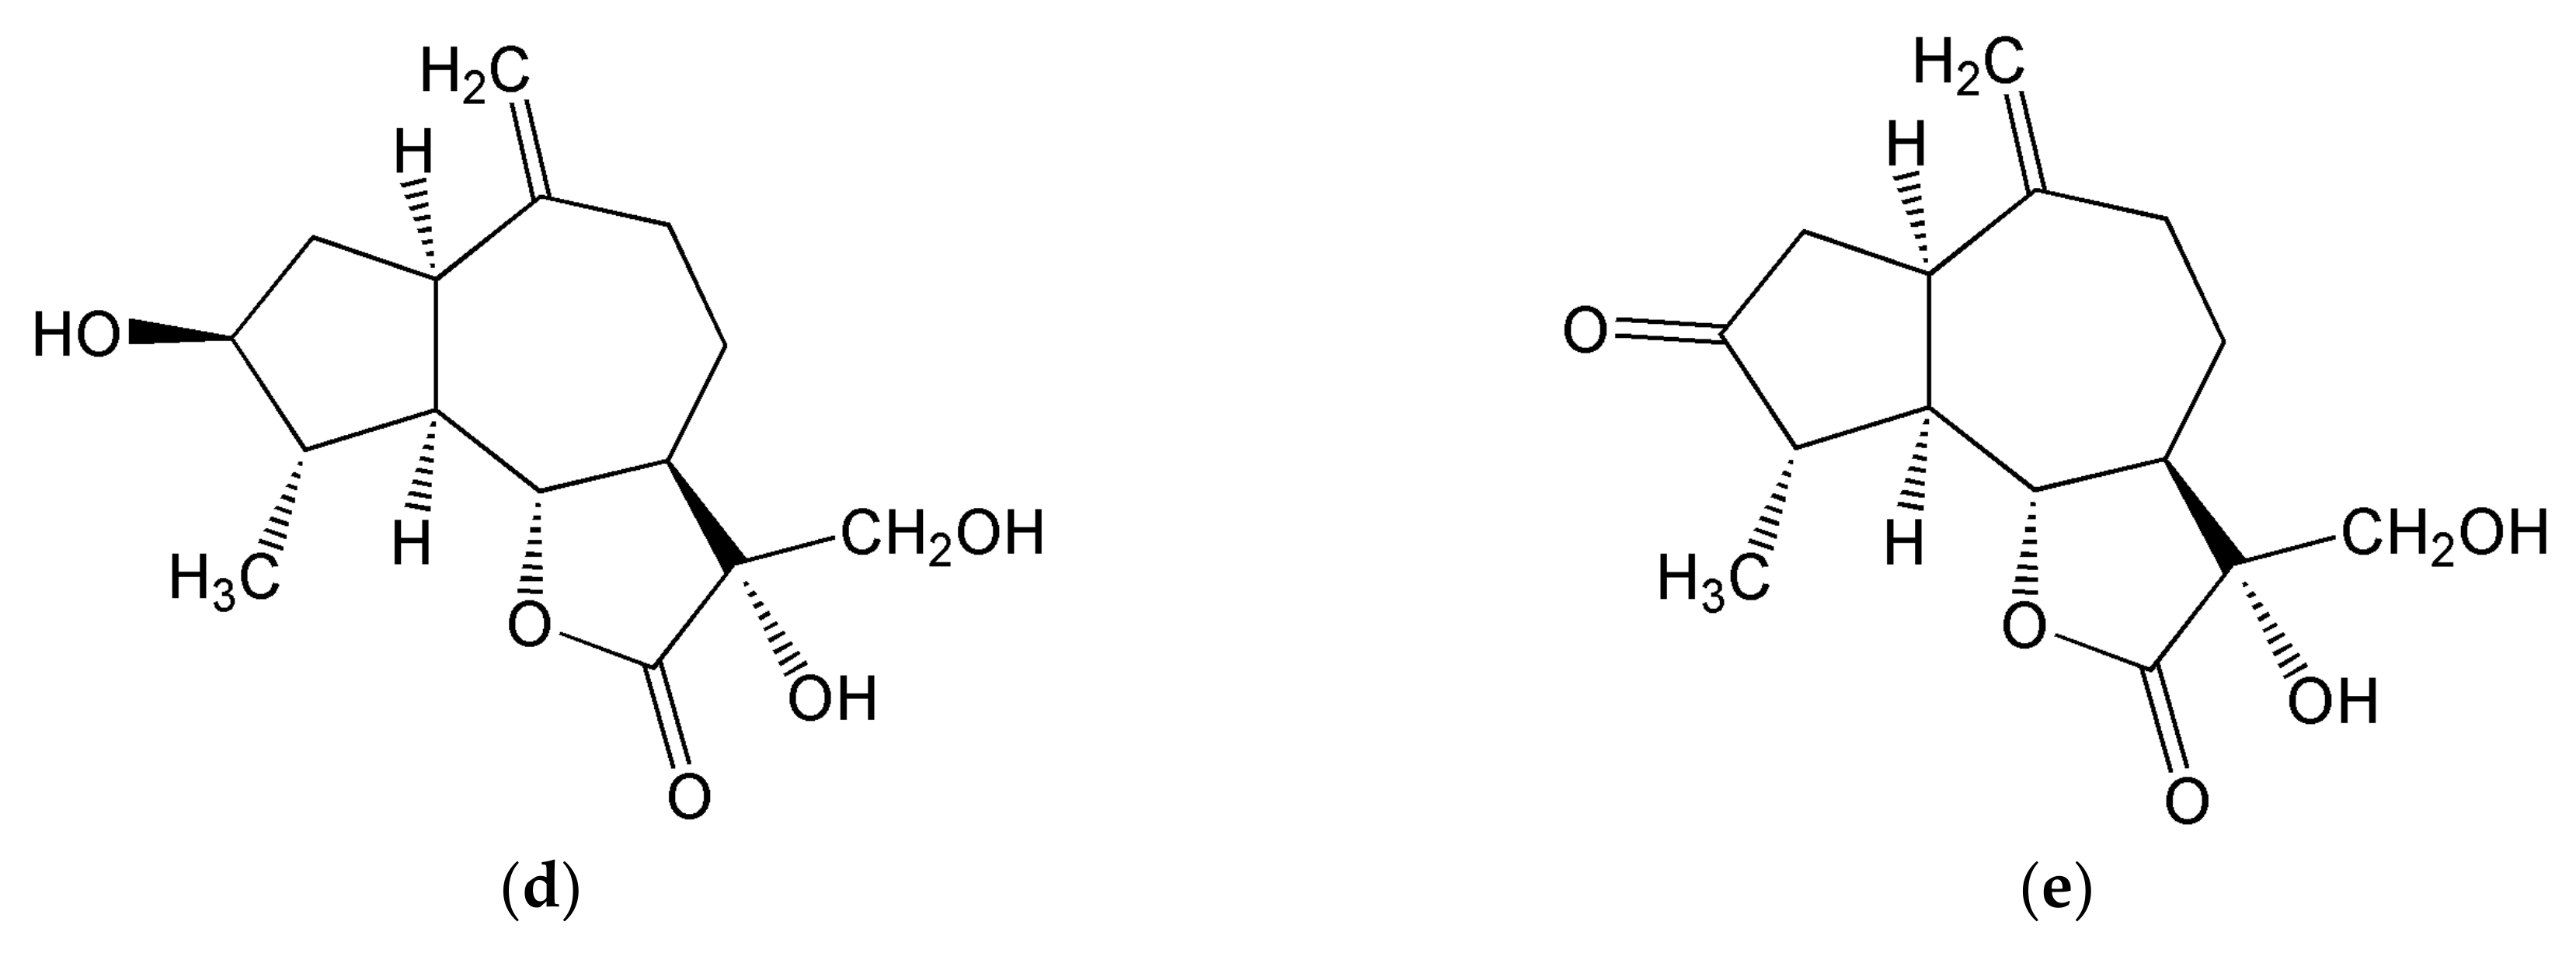
2.1.2. Organic Fraction: Sesquiterpene Lactones and Other Metabolites

The 1H NMR spectrum of the chloroform fraction of leaf extracts is dominated by the signals of sesquiterpene lactones (STLs), (Figure 1), which are spread in the wide spectral range from 1.2 to 6.5 ppm. The characteristic 1H signals of CH2=C double bond fragments are observable in the 4.7–6.5 ppm range. The step-by-step assignment of the NMR signals with the identification of the corresponding three different STLs directly in the mixture was possible thanks to the analysis of 2D NMR experiments: 1H-1H correlations in TOCSY, 1H-13C direct and indirect correlations in HSQC and HMBC experiments (Figures S9–S14 in the Supplementary Materials).
The STLs signals assignment partially rested on literature 1H and 13C NMR data (see below), obtained in similar (CDCl3 or deuterated methanol) but not identical solvents. In the present study a 2:1 v/v mixture of CDCl3 and CD3OD was used instead of a single solvent (CDCl3 or CD3OD). The mixture was chosen as one of the most suitable solvents to obtain narrow signals of lipidic components from vegetable extracts. In particular, cynaropicrin (Figure 2a, Table 2) was identified using NMR assignments in methanol [45] and chloroform [46] solutions. Dehydrocynaropicrin (Figure 2b, Table 2) [47] and grosheimin (Figure 2c, Table 2) [48,49] were identified by comparison our NMR data with the literature relative to chloroform solutions.
The key feature that characterizes both cynaropicrin and dehydrocynaropicrin is the presence of 2-(hydroxymethyl)acrylic acid moiety that forms an ester with C(8)-OH group. The corresponding 1H and 13C NMR signals were identified, see Table 2. The 13C NMR signals of C(3)=O ketone group in dehydrocynaropicrin and grosheimin at 205.2 and 220.8 ppm, respectively, were assigned thanks to long-range 1H-13C correlations in 1H-13C HMBC map.
Besides sesquiterpene lactones specific for globe artichoke, other metabolites such as fatty acids, sterols, pheophytins, phospho- and galactolipids, were also identified (Table 3). These compounds are typical components of lipidic fraction present in many vegetable tissues including leaves, stalks, fruits, and florets. The NMR assignment of these metabolites was based on our previous NMR studies of organic extracts from lettuce leaves [30], celery [50], and kiwifruits [51].
Fatty acid chains can be separated in NMR spectra according to the number of double bonds (mono-, di- and polyunsaturated fatty acids chains) but not according to the chain length; homologous fatty acids (like stearic vs. palmitic) cannot be distinguished. Table 3 reports the assignment of diunsaturated (linoleic type) and triunsaturated (linolenic type) fatty chains spectra. These fatty chains can be readily distinguished and quantified due to the presence of specific signals from bis-allylic methylene groups (CH2 groups between two cis-double bonds) at 2.78 and 2.81 ppm for linoleic and linolenic fatty chains, respectively. In the case of monounsaturated acids, the 1H NMR signals of their double bonds and allylic protons coincide with those from linoleic and linolenic acids, whereas other signals are overlapped with those from saturated fatty acids, therefore monounsaturated and saturated fatty chains were quantified together.
Three sterols, namely, β-sitosterol, campesterol, and stigmasterol, were also identified (Table 3). The characteristic singlet signal at 0.70 ppm is due to 18-CH3 group of both campesterol and β-sitosterol that cannot be separated in the 1H NMR spectra and were quantified as a sum.
The corresponding 18-CH3 signal of stigmasterol was observed separately at 0.72 ppm. The presence of a triterpenoid compound squalene, a precursor for synthesis of plant sterols, was evident due to the double bond CH signal at 5.12 ppm and other signals reported in Table 3.
Phosphatidylcholine and phosphatidylethnolamine were identified thanks to the signals of N(CH3)3 and CH2NH2 groups at 3.23 and 3.16 ppm, respectively. Unfortunately, the corresponding 1H spectral region was overlapped with the signals from other compounds, in particularly sesquiterpene lactones, hindering the quantification of phospholipids. The doublet at 4.91 ppm due to the anomeric proton of galactosyl ring indicated the presence of digalactolipids, typical for plant cells. Finally, chlorophylls from leaves during the extraction have lost magnesium ions and transformed into pheophytins a and b types readily observed in the spectra due to the characteristic proton signals in the range from 8 to 10 ppm from tetrapyrrole structure, Table 3.

2.1.3. Metabolite Quantification

The quantification of the identified water-soluble metabolites was performed by the integration of corresponding selected 1H NMR signals. In a few cases, the strong overlapping of characteristic signals with the signals of other metabolites hampered the integration and quantification as in the case of arginine, GABA, lysine, tyrosine and neochlorogenic acid. The results of quantification for the aqueous extracts are reported in Table 4.
All amino acids, except alanine, were more abundant in leaves than in stalks. Asparagine was the most abundant amino acid in all artichoke byproducts.
Among organic acids, the highest level was shown by malic and quinic acids followed by citric acid in leaves and succinic acid in stalks. The content of malic and quinic acids in leaves and stalks was comparable, whereas the level of citric acid in leaves was about 10 times higher than in stalks.
The total sugar content (mostly glucose, fructose, and sucrose) in stalks was about seven times higher than in leaves; all sugars in stalks were 5–10 times more abundant than in leaves. The inulin level in stalks was approximately ten times higher than in leaves. Among three isomers of cyclic polyols, chiro-inositol was the most abundant in all byproducts followed by myo-inositol in stalks and scyllo-inositol in leaves.
Higher levels of choline and its derivatives were observed in leaves with respect to stalks; on the contrary, ethanolamine level was higher in stalks. Leaves were also characterized by a higher content of trigonelline, uridine and chlorogenic acid (5-caffeoylquinic acid). As mentioned previously, chlorogenic acid was the most abundant component among polyphenols, and other polyphenols were not quantified due to relatively low levels and strong overlapping of the corresponding signals.
The content of metabolites in the organic fraction of artichoke byproducts is reported in Table 5. Notably, leaves with respect to stalks showed a drastically higher level (about ten times) of sesquiterpene lactones, with cynaropicrin as the most abundant one (more than 60% of sesquiterpene lactones fraction) followed by grosheimin and dehydrocynaropicrin. Dehydrocynaropicrin was absent in stalks. The total content of sesquiterpene lactones in leaves was as high as 45.5 mg/g of DW (4.5% of dry weight). Leaves were also characterized by higher levels of sterols (β-sitosterol/campesterol and stigmasterol), squalene, digalactosyldiacylglycerol, and polyunsaturated fatty acids, especially triunsaturated linolenic fatty acid. Pheophytins a:b ratio (c.a. 3.7) reflects the chlorophyll a/b ratio in leaves and is typical for flowering plants. No pheophytin was present in the stalks extract.

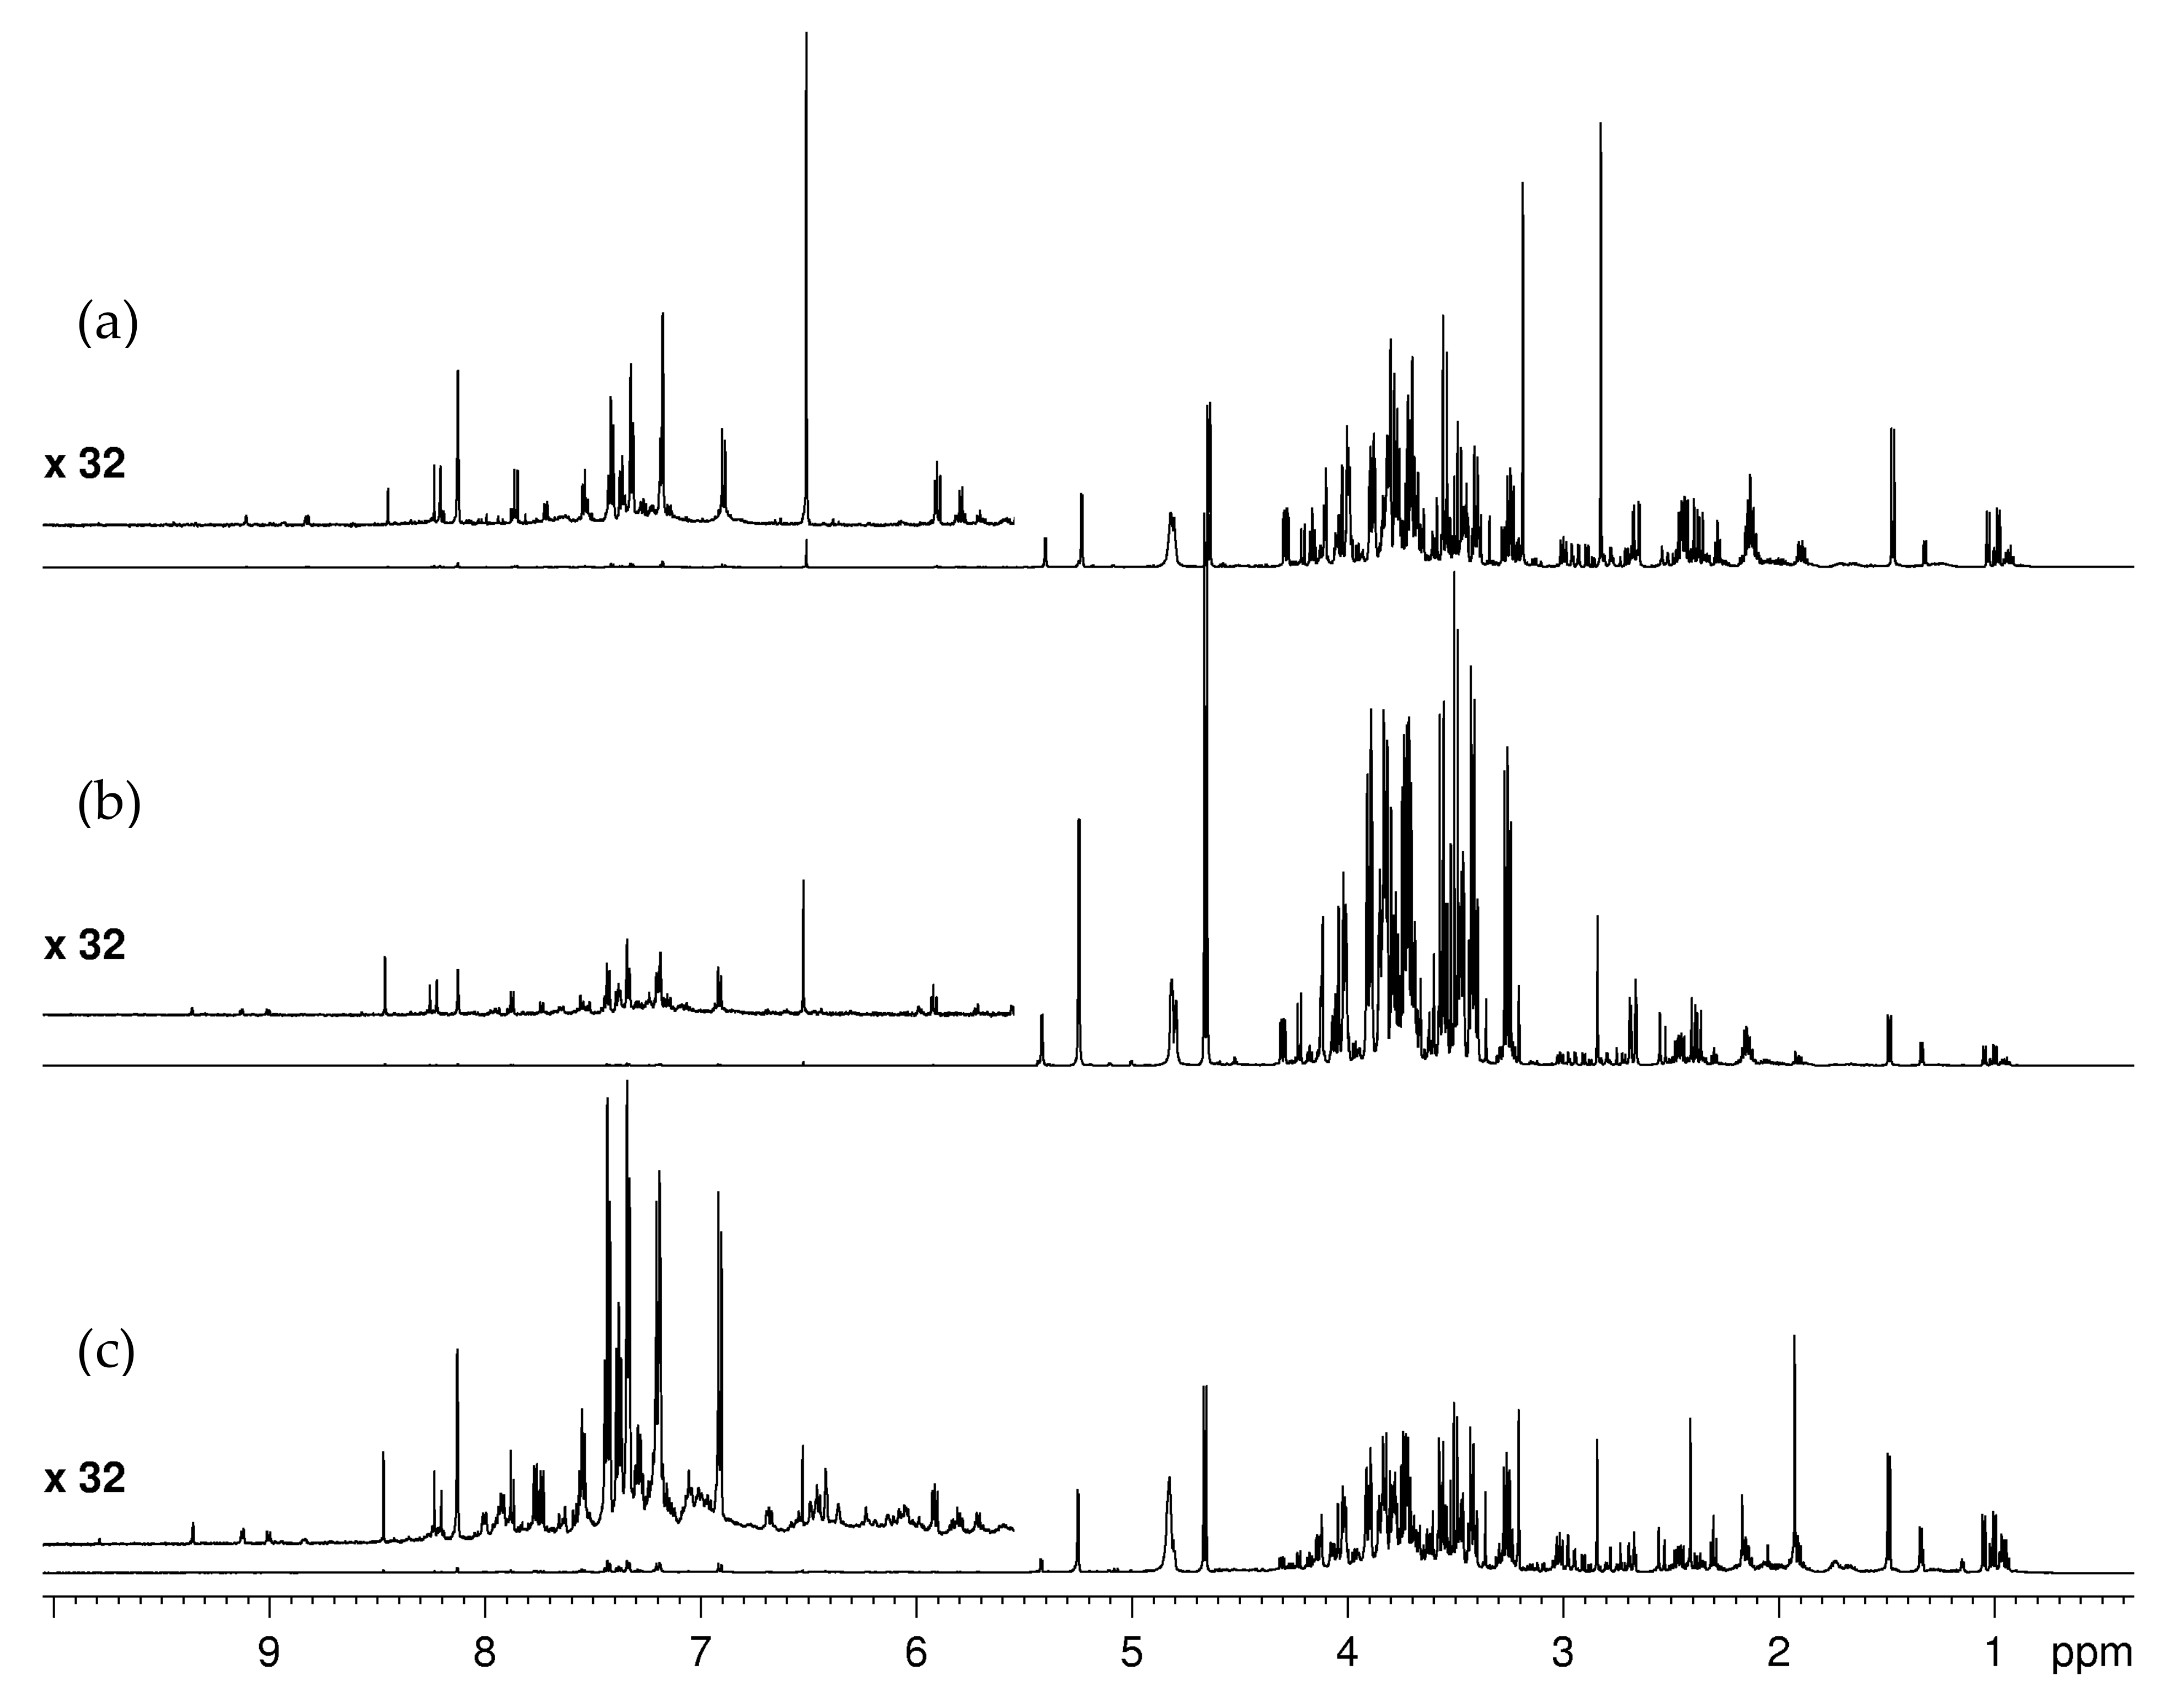
2.2. Cauliflower Byproducts Metabolite Profile

As in the case of globe artichoke byproducts, the NMR-based analysis of the metabolite composition of cauliflower byproducts is still absent in the literature. We included in the analysis not only leaves and stalks, but also florets that partially can end up in waste during the production cycle. Both aqueous and organic fractions of all three types of tissues were examined by NMR. The assignment of NMR spectra (Figure 3) was based on 1H and 13C NMR metabolite profiling of the eatable part (floret) reported in the literature [39] and the same set of 2D NMR experiments used for globe artichoke extracts (Figures S15–S23 in the Supplementary Materials).

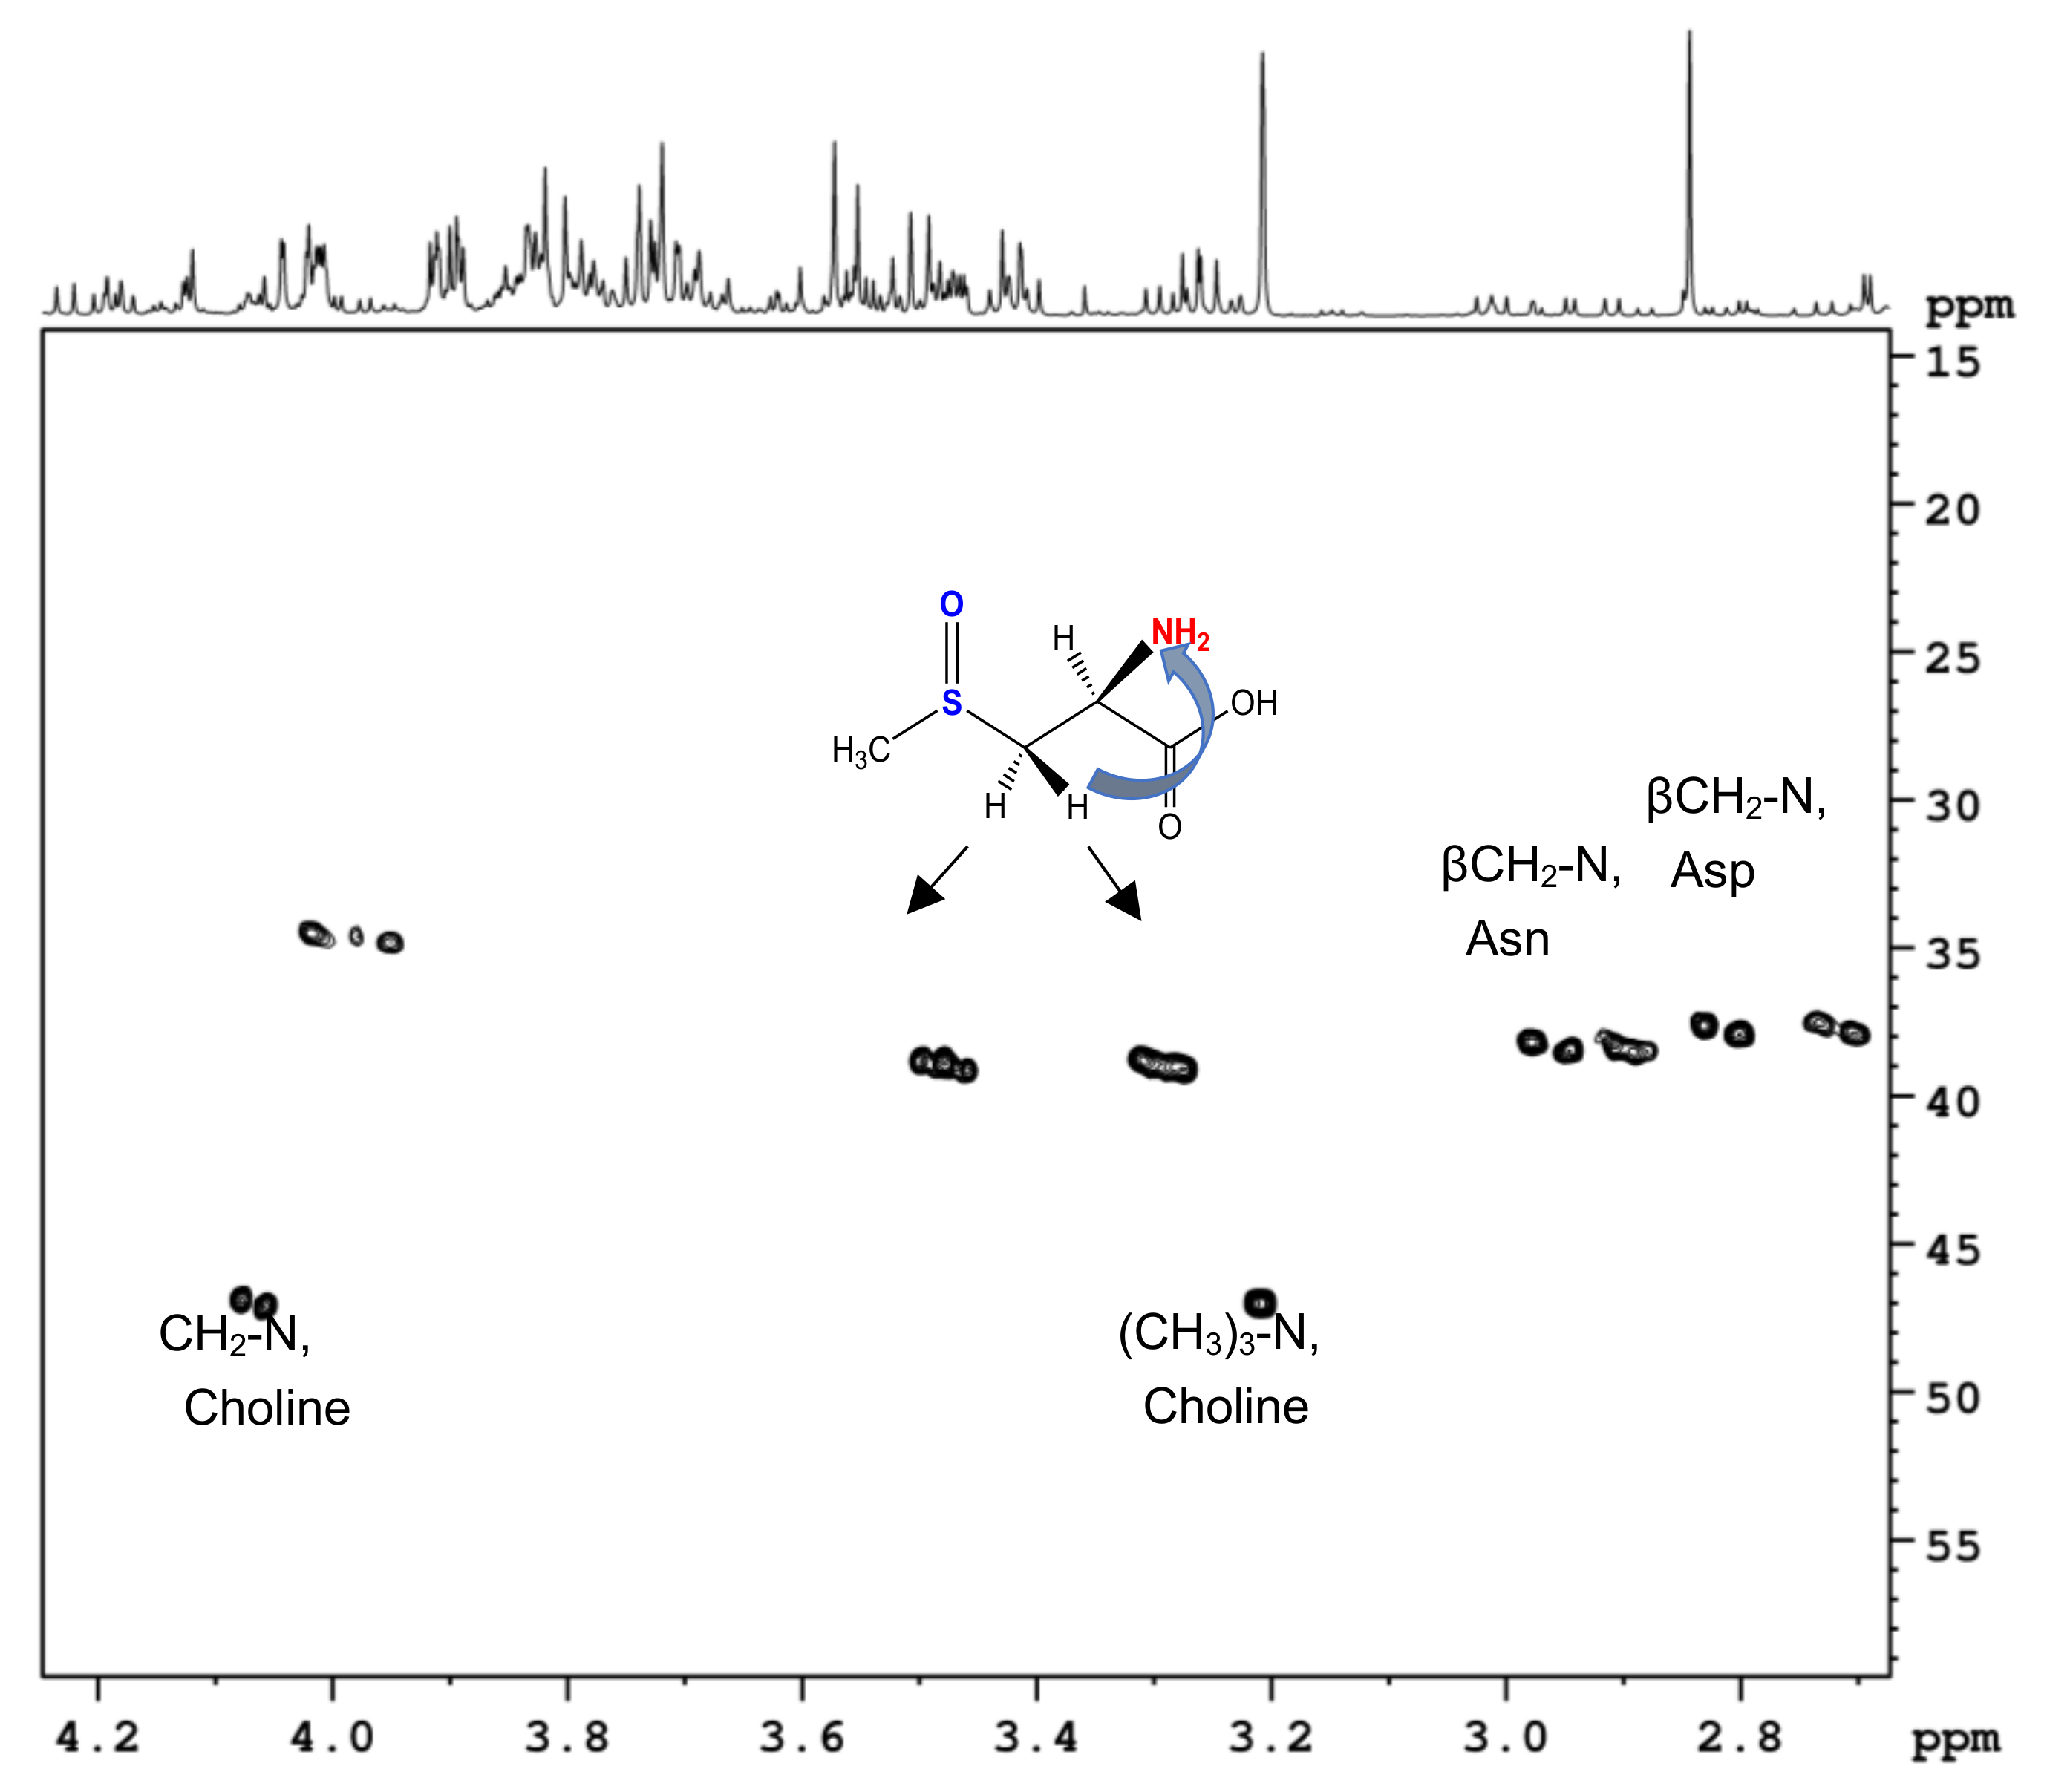
2.2.1. Assignment of S-Methyl-L-Cysteine-Sulfoxide (Methiin) in Aqueous Extracts

All identified amino acids (Table 1) were already noticed in the literature [39], except one. Here, the presence of S-methyl-L-cysteine-sulfoxide (methiin) in the NMR spectra of aqueous extracts of cauliflower is reported for the first time. The identification of methiin had begun from the observation of the intense singlet signal at 2.84 ppm in the proton spectra of all types of cauliflower byproducts. According to 1H and 13C chemical shifts, this signal clearly belongs to an isolated methyl group CH3-X, where X could be a heteroatom (N or S). Heterocorrelation 1H-13C experiments showed the presence of CH2, CH and COOH groups in the molecule (Table 1); moreover, two protons of the methylene group were not chemically equivalent, indicating that the neighbor CH group was a chiral center. Therefore, the first hypothesis was the structure CH3-NH-CH2-CH(COOH)(NH2) known as β-N-methylaminoalanine. It is a non-protein amino acid produced by diverse cyanobacteria, dinoflagellates and diatoms [52] and a neurotoxin suspected to cause human neurodegenerative diseases. Fortunately, the addition of the corresponding standard compound into the extracts, followed by NMR analysis did not confirm the hypothesis. In fact, the methyl group of β-N-methylaminoalanine has a similar but not identical 1H chemical sift (2.79 ppm vs. 2.84 ppm) at the experimental conditions applied. Considering that the presence of nitrogen atoms was only supposed, additional experimental evidence was necessary. The direct observation of 15N NMR was not possible due to a low concentration of corresponding compounds, but the indirect long-range correlation experiment 1H-15N HMBC was successfully performed (Figure 4). In this experiment, no correlation between the proton signal at 2.84 ppm and any 15N signal was observed, indicating that the corresponding CH3 group was not directly bound to any nitrogen atom. Additionally, the correlation between two proton signals of the CH2 group (at 3.47 and 3.28 ppm, 1H) and a nitrogen atom of an amino group at 38.8 ppm (15N) confirmed that the molecule was an α-amino acid. Considering all the data, the following structure was finally deduced: CH3-S(O)-CH2-CH(COOH)(NH2), S-methyl-L-cysteine-sulfoxide (methiin). The experimental 1H and 13C chemical shifts were in good agreement with the literature data for one of the diastereoisomers, namely, (R,S)-S-methyl-cysteine sulfoxide [53], a natural compound present in many cruciferous vegetables [54]. Moreover, thanks to its characteristic 1H NMR signals, methiin was identified in 1H NMR spectra of urines as a marker of cruciferous vegetable consumption [55].

2.2.2. Glucosinolates

Four glucosinolates, namely, glucoiberin, glucobrassicin, sinigrin, and glucoraphanin typical for cauliflower [56] were identified in leaves aqueous extract. Glucoiberin assignment was based on the presence of the characteristic 1H doublet signal (JH-H = 9.8 Hz) from anomeric proton of β-glucose ring at 5.07 ppm and a singlet signal at 2.74 ppm due to the methyl-sulfoxide group, see Table 1. Other glucoiberin signals reported in Table 1 were overlapped in the 1H spectrum with the signals from other metabolites and their assignment was based on 2D experiments, NMR data from the corresponding pure standard compound and the literature data [57]. Glucobrassicin has been identified thanks to its characteristic 1H signal of the CH-4″ group from indol moiety at 7.76 ppm (doublet, JH-H = 8.0 Hz), Table 1. Other indol proton signals were overlapped with those from tryptophane. The 1H signal from the anomeric proton of glucobrassicin glucose ring at 4.84 ppm is masked by an intense signal of residual water protons, but it was clearly visible in 1H-13C HSQC spectrum. The assignment was confirmed by the standard addition and was consistent with the literature [58]. The 1H NMR signals of sinigrin and glucoraphanin were much lower with respect to glucoiberin and glucobrassicin and their concentration was not enough to observe the corresponding cross-peaks in 1H-13C 2D correlation spectra. Only partial assignment of 1H spectrum of sinigrin and glucoraphanin was achievable using available TOCSY correlations, see Table 1. The assignment was confirmed by the addition of the corresponding standards.

2.2.3. Other Metabolites in Aqueous Extracts

In the case of organic acids, in addition to acetic, formic, fumaric, malic, pyruvic, and succinic acids identified previously [39], citric, lactic, and quinic acids were identified (Table 1) in the 1H NMR spectra. Citric acid was present in all cauliflower byproducts, whereas lactic and quinic acids were detected only in leaves. Pyroglutamic acid was also identified in leaves and florets extracts.
The main sugars (glucose, fructose, and sucrose) present in florets [39] were also present in leaves and stalks, whereas no signals of galactose and xylose were observed (Table 1). Stalks and leaves 1H NMR spectrum has shown the presence of two doublet signals at 5.00 and 5.44 ppm characteristic for α-galactose and α-glucose anomeric protons of raffinose trisaccharide not previously reported for cauliflower [39].
Finally, besides choline, three additional amines (ethanolamine, glycerophosphorylcholine, phosphorylcholine) and uridine were identified for the first time in all cauliflower byproducts (Table 1).

2.2.4. Liposoluble Metabolites

In the case of liposoluble metabolites, no specific secondary metabolites, such as sesquiterpene lactones in globe artichoke, were identified. Only the typical components of plant lipidic fraction such as fatty acids, sterols, pheophytins, phospho- and galactolipids were identified in NMR spectra of chloroform extracts (Table 3 and Figure S24) using the same 2D NMR experiments (Figures S25–S33 in the Supplementary Materials) and literature data as for globe artichoke byproducts. It is noteworthy that stigmasterol was not observed in cauliflower byproduct extracts.

2.2.5. Metabolite Quantification in Cauliflower Byproducts

Comparing three different byproducts, the total amino acid content was in the order florets (F) > leaves (L) > stalks (S) (Table 4). Glutamine was the most abundant amino acid in all byproducts followed by methiin in S and F, and Arg in L. Glutamine and methiin levels in F were about four times higher than in L and S. Moreover, methiin content of L and S was very similar. Ala, Asn, Asp, GABA, Glu, Gln, and methiin showed the highest content in F, whereas the highest Arg, Leu, Lys, Phe, Thr, Trp, Tyr, and Val levels were observed in L. His and Ile levels were similar in L and F.
In the case of organic acids, again, F showed the highest total content. Malic acid was the most abundant in F and S, followed by citric acid, while all other acids were low. The relative levels of organic acids in L were quite different, with citric acid as the most abundant one, followed by malic, succinic, and acetic acids. Comparing the byproducts, S showed the highest absolute quantity of citric acid with respect to F and L.
The highest total content of sugars was observed for S, whereas the lowest one was in the case of L. Glucose was the most abundant in all byproducts, followed by fructose. Among all three byproducts the highest glucose, fructose, sucrose, and raffinose levels were found in S. Raffinose, a trisaccharide composed of galactose, fructose, and glucose found in different vegetables, was not present in F. The content of myo-inositol was comparable in L and S, whereas it was not possible to quantify it in F due to low level and strong overlapping with the signals of other metabolites. Maximum levels of all amines (ethanolamine, choline, and phosphorylcholine) and uridine were observed in F, with choline as the most abundant. S was characterized by the lowest levels of choline and ethanolamine. Glycerophosphorylcholine quantification was possible only in S, while in F and L extracts its NMR signals were covered by the signals of other metabolites. Glucosinolate signals were present only in the L extract. Out of four identified glucosinolates only two of them, glucoiberin and glucobrassicin, were quantified, whereas the levels of glucoraphanin and sinigrin were too low for the quantification.
Among the liposoluble metabolites reported in Table 5, sterols (β-sitosterol/campesterol), and all types of fatty acids (saturated, mono- and polyunsaturated) were more abundant in F than in S and L, while the highest levels of squalene and digalactosyldiacylglycerol were observed in leaves. As in the case of globe artichoke, only leaves of cauliflower contained pheophytins with the a:b ratio about 5.4.

3. Discussion

According to the literature, globe artichoke [12,16,18,59,60,61] and cauliflower byproducts [23,24,25,26,27] can be a valuable source of bioactive health-beneficial compounds, but the mentioned studies seem to give a fragmented view and usually are limited to a specific class of bioactive compounds or nutrients; none of them aimed to obtain a comprehensive picture of metabolite composition, including as many different classes of metabolites in the analysis as possible. Consequently, so far, only scattered data on the content of some metabolites obtained by analyzing different matrices and not the same sample have been available. The NMR-based metabolite profiling enables one to circumvent this problem thanks to the unbiased sensitivity of NMR analysis to all classes of organic compounds. Considering the results presented here, it was possible to monitor in the same sample contemporarily the presence of compounds belonging to completely different chemical classes such as free amino acids, organic acids, sugars, polyols, polyphenols, amines, glucosinolates, fatty acids, lipids, sterols, and sesquiterpene lactones.
The results of quantitative NMR analysis can be compared with the previous analytical studies conducted using other methods including HPLC [12,16,20,59], UHPLC/Q-TOF-MS [18], FT-IR [12], and capillary-electrophoretic methods [62], anyway bearing in mind differences in methodology (extraction solvent’s composition, type of extraction, analytical method), tissue type, genetic background, and cultivation practices.

3.1. Globe Artichoke Byproducts

3.1.1. Inositols

Three isomeric cyclic polyalcohols of the inositol family (myo-inositol, chiro-inositol, and scyllo-inositol) are typical components of globe artichoke. Numerous studies attributed to them insulin-mimetic properties with improving insulin resistance [63], antihiperglycemic [64] and hepatoprotective activities [65]. The content of chiro- and scyllo-inositols in leaves and in stalks was in perfect agreement with the literature data [20]. chiro-Inositol in leaves and in stalks (about 10.0 and 5.0 mg/g DW, respectively), was the most abundant with respect to other isomers. Leaves were also richer in scyllo-inositol (1.8 vs. 0.6 mg/g DW in leaves and stalks, respectively). On the contrary, the lowest level of myo-inositol observed in leaves (0.27 mg/g) was too small with respect to the literature data (1.7 mg/g DW) [20].

3.1.2. Sesquiterpene Lactones

The NMR analysis of leaves and stalks organic extracts has shown the presence of sesquiterpene lactones (STL) belonging to guaianolides, an important class of bioactive compounds with an intense bitter taste and a number of health beneficial properties [15]. In particular, cynaropicrin, the most abundant component of this class of compounds in globe artichoke, is known to manifest antihyperlipidemic, antimalarial, antispasmodic, antitrypanosomal, anti-photoaging, and antitumoral actions [66]. According to Rouphael et al. [18], apart from cynaropicrin, dehydrocynaropicrin, and grosheimin, the other two STLs (cynaratriol, Figure 2d, and 8-deoxy-11,13-dihydroxygrosheimin, Figure 2e) can be present in a comparable amount in artichoke leaves. Both 8-deoxy-11,13-dihydroxygrosheimin and cynaratriol are characterized by the absence of the C(8) hydroxyl group and the presence of two additional OH groups attached to C(11) and C(13) carbon atoms. The NMR signals of CH2(8) and CH2OH(13) groups were not observed, evidencing that neither 8-deoxy-11,13-dihydroxygrosheimin nor cynaratriol was present. The content of STLs in artichoke leaves is variable and strongly influenced by the cultivar [18]. The available literature data on the 19 most representative cultivars grown in Europe [18] can be considered as a reference giving the range of possible variations of STL’s content. To compare our data with the literature, where the STL’s levels were measured with respect to fresh weight, our data were recalculated considering that the average water content in leaves was about 89%. The contents of cynaropicrin (247.5 mg/100 g FW) and grosheimin (97.2 mg/100 g FW) were in the reported range (4.5–800) and (6.8–1600), respectively. On the contrary, dehydrocynaropicrin level (65.0 mg/100 g FW) was higher than the upper limit (3.3–25.6) reported. No data on the content of STLs in the stalks of globe artichoke are available in the literature.

3.1.3. Caffeoylquinic Acids

Among caffeoylquinic acids, chlorogenic acid was the most abundant. The content of chlorogenic acid in leaves (7.5 mg/g DW) was relatively high considering the literature data for different cultivars of globe artichoke, such as Spinoso di Palermo (0.7–2.1 mg/g DW) (Violetto di Sicilia (0.1–1.9 mg/g DW) [59], Blanca di Tudela (2.4 mg/g DW) [20], Madrigal (3.9 mg/g DW) [12]. In the case of stalks, chlorogenic acid level (2.3 mg/g DW) was comparable to that reported in the literature for the same cultivars: Spinoso di Palermo (0.5–4.8 mg/g DW) [59], Violetto di Sicilia (0.5–4.7 mg/g DW) [59], Blanca di Tudela (1.6 mg/g DW) [20], Madrigal (2.8 mg/g DW) [12]. This comparison with the literature data does not take into account the differences in the extraction conditions that can substantially influence the yield [67].

3.1.4. Inulins

Inulins, known also as oligofructans, are dietary fibers converted by colon bacteria into short-chain fatty acids necessary to nourish colon cells and stimulate the immune system [68]. In our case, the quantification of inulins extracted in the solution was based on the integration of the characteristic 1H signal at 5.44 ppm from the anomeric proton of the glucose terminal ring. It was not possible to measure the mean degree of oligomerization and therefore the number of fructose units in the inulin chain. The molecular weight of 1-kestose, (containing just one glucose and two fructose units) was used for the calculation of inulin weight in the samples, consequently, the results obtained (0.44 and 4.14 mg/g DW in stalks and leaves, respectively), represented the lowest limit and the real weight could be higher. In the case of globe artichokes, leaves and stalks contain a markedly lower amount of inulin with respect to heads and roots, anyway its reported content can be as high as 37 mg/g DW in leaves and 29 mg/g DW in stalks [12]. In comparison with the literature, our values were too small indicating that the extraction protocol was probably not optimized for inulin extraction. In fact, it is known that inulin’s extraction yield is strikingly dependent on the temperature [12], and Bligh-Dyer extraction temperature (4 °C) was too low with respect to the optimal temperature range (60–85 °C) for inulin.

3.1.5. Other Metabolites

Apart from the content of specific metabolites discussed above, the usual content of all other metabolites identified in the present work in globe artichoke byproducts (such as amino acids, organic acids, amines, fatty acids, and lipids), with some exceptions, has not been reported yet in the literature. The exceptions are related to quinic acid and common sugars (glucose, fructose, and sucrose) already quantified in the leaves and stalks of a few samples [20,67]. In particular, the content of quinic acid in Blanca di Tudela cultivar byproducts was lower than in our case (1.3 vs. 7.6 mg/g DW and 2.6 vs. 6.5 mg/g DW in stalks and leaves, respectively) [20]. The content of fructose, glucose, and sucrose in Blanca di Tudela cultivar byproducts [20] was comparable with those obtained in the present study. In both cases, the total sugar content in stalks was 5–7 times higher than in leaves, with glucose as the most abundant sugar in all byproducts.

3.2. Cauliflower ByProducts

As mentioned in the introduction, cauliflower byproducts valorization topic received substantially minor attention with respect to globe artichoke. Only the content of a few particular classes of metabolites, such as polyphenols [23,24], has been determined so far. As to the other classes of metabolites (amino acids, organic acids, sugars, and some lipids), their content in leaves and stalks is reported here for the first time. Considering the absence of literature data on cauliflower byproducts’ metabolite composition, our NMR data relative to florets, leaves, and stalks can be compared only with those of the eatable part of cauliflower (florets) measured by NMR previously [39]. In the case of amino acids, the levels of aspartic acid, isoleucine and threonine were comparable with those in the previous study, whereas the observed levels of other amino acids were either too small (arginine, lysine, glutamic acid, phenylalanine) or too high (glutamine, histidine, alanine, valine) with respect to the eatable part of cauliflower. In particular, the level of glutamine, the most abundant amino acid in all byproducts, was about five to two times higher; on the contrary, those of arginine and lysine were seven to two times lower with respect to the edible part.
It is noteworthy that the level of methiin, the second most abundant amino acid (not proteinogenic) after glutamine, was not reported in the above mentioned NMR study [39], probably because it was not identified. Methiin is a major S-alkyl-L-cysteine S-oxide found in Brassicaceae (such as broccoli, Brussels sprouts, cabbage, and cauliflower) and in the domesticated Allioideae with concentrations up to 1–2% of dry weight [54,62]. Health-beneficial properties of methiin were observed in animal model studies including its effects on hyperlipidemia, as an antidiabetic, and as an antimicrobial agent [69,70]. The highest methiin level (about 20.7 mg/g DW that corresponds to 2.0 mg/g FW) observed in florets was in good agreement with the literature data for the eatable part of cauliflower (2.8 mg/g FW) [62].
Besides methiin, cauliflower byproducts also include other sulfur-containing secondary metabolites, members of the glucosinolates family. Glucosinolates are present in all Brassicaceae plants and have a common basic structure consisting of a β-D-thioglucoside group, a sulfonated moiety, and a variable side chain derived from one of eight natural amino acids ([71] and references therein). Glucosinolates are precursors of other biologically active compounds (such as isothiocyanates) with a number of health-beneficial properties that include chemopreventive activity against cancer, the risk reduction of cardiovascular disease, neurodegeneration, diabetes, and other inflammatory disorders ([71] and references therein). As in the case of other metabolites, no literature data are yet available on the glucosinolates content in cauliflower byproducts. According to the literature, the edible part of cauliflower (florets) contains 16–151 mg of glucosinolates in 100 g of fresh tissue [71], but in our case, no glucosinolates were detected by NMR in florets and in stalks. Considering that cauliflower byproducts were supplied by a local farm, partial enzymatic hydrolysis of glucosinolates could take place in the span of time between the harvest and delivery of byproducts. Regardless, leaves have shown a good level of glucosinolates (8.13 μmol/g DW or 44.7 mg/100g FW) with glucoiberin as the most abundant (2.09 mg/g DW or 4.94 μmol/g DW), followed by glucobrassicin (1.43 mg/g DW or 3.2 μmol/g DW), Table 4. These levels of glucosinolates seem to be even higher than those reported in a recent work for the eatable part of cauliflower (0.5–1.8 μmol/g DW for glucoiberin, and 0.2 µmol/g DW for glucobrassicin) [56].
The metabolite profiling of both cauliflower and globe artichoke byproducts using the same NMR methodology gives us the opportunity to compare directly the metabolite composition of different tissues of two different plant crops. The results of this comparison indicate:
(1)
Close similarity of qualitative composition of the most abundant metabolites (including sugars, amino acids, organic acids, amines, etc.), in all samples studied. For example, 17 out of 19 identified amino acids were observed in both crops’ byproducts (Table 1). Among sugars, only minor components (such as inulin in artichoke and raffinose in cauliflower) were crop-specific;
(2)
The presence of crop-specific secondary metabolites. In the case of globe artichoke byproducts, the crop-specific metabolites included sesquiterpene lactones, stigmasterol, inositol isomers (chiro- and scyllo-inositols), inulin, chlorogenic and neochlorogenic acids, and glycine betaine, whereas only cauliflower’s byproducts contained methiin, glycine, glucosinolates, pyruvic acid, and raffinose;
(3)
The drastic variation of metabolite levels occurs in crop- and tissue-specific manner. For example, dehydrocynaropicrin present in globe artichoke leaves was absent in stalks, whereas glucosinolates were found only in cauliflower leaves. For both crops, leaves were generally richer in amino acids and amines and poorer in sugars with respect to stalks. Florets (in the case of cauliflower) were even richer in amino acids and amines than leaves;
(4)
The detailed analysis of metabolite profiling of a given byproduct can indicate the best strategies for the recovery and the reutilization of its constituents. Both water-soluble and apolar metabolite fractions contain bioactive compounds that can be extracted and reutilized in food supplements or as components of functional food. In the case of globe artichoke, there is a remarkable potential for new product development from byproducts as sources of inositol isomers, caffeoylquinic acids and inulin in water-soluble fraction and sesquiterpene lactones in organic fraction. Cauliflower byproducts can be utilized for the extraction of bioactive sulfur-containing compounds including S-methyl-L-cysteine S-oxide and glucosinolates.

4. Materials and Methods

4.1. Plant Material

White cauliflower byproducts (Brassica oleracea), mainly consist of leaves and, in less amount, stalks, florets and curd (editable part), representing approximately the 60% [13], were supplied by F.lli Calevi Alberto e Stefano (Viterbo, Lazio, Italy). Cauliflower plants were harvested during the period of head maturity (100–90 days after sowing).
Globe artichoke byproducts (Cynara scolymus) mainly consisted of leaves and stalks (approximately 80%) [11] were supplied by Azienda Agricola Sperlonga-SANVIDA (Sperlonga, Lazio, Italy). The byproducts of two years old globe artichoke plants were harvested.
After collection, fresh cauliflower and globe artichoke byproducts were lyophilized (−55 °C, 0.200 mbar) and ground in power. The dry tissue powder was stored at −80 °C before performing extraction procedures. The mean water content (in % by weight) in globe artichoke was 89% for leaves and 92.5% for stalks, whereas in the case of cauliflower the following values of water content were calculated: 87.3% for leaves, 91% for stalks, and 90% for florets.

4.2. Chemicals

Water (HPLC-grade) and β-N-methylaminoalanine were purchased from Sigma-Aldrich (Milan, Italy). Methanol (HPLC-grade), chloroform, K2HPO3, and KH2PO3 were obtained from Carlo Erba Reagenti (Milan, Italy). Deuterated solvents (D2O, CD3OD, CDCl3) and 3-(trimethylsilyl)-propionic-2,2,3,3-d4 acid sodium salt (TSP), were purchased from Eurisotop (Saint-Aubin, France).

4.3. Extraction Procedures

Bligh–Dyer extraction method [72] was applied to the lyophilized samples. In detail, about 100 mg of grinded lyophilized sample (leaves, stalks, or florets) was mixed sequentially with 3 mL of methanol/chloroform (2:1 v/v) mixture, followed by 0.8 mL distilled water, carefully shaking after each addition. The obtained monophasic system was sonicated for 10 min at room temperature. Then, the extract was sequentially added with 1 mL of chloroform and 1 mL of distilled water to obtain a biphasic system. The extract was then centrifuged (4200 rpm for 15 min at 25 °C) and the upper (hydroalcoholic) and lower (chloroform) phases were carefully separated. The extraction procedure was repeated two more times on the pellet to guarantee the complete extraction of compounds, afterwards, the separated fractions were pooled. Both hydroalcoholic and chloroform fractions were dried under a gentle N2 flow at room temperature until the solvent was completely evaporated. The dried phases were stored at −20 °C until further analyses. For every byproduct type n = 3 replicates were extracted and analyzed by NMR spectroscopy.

4.4. NMR Analysis

4.4.1. NMR Samples Preparation

The dried hydroalcoholic fraction was dissolved in 0.75 mL of buffered D2O, (400 mM phosphate buffer, pH = 7.0) containing the internal standard for chemical shift referencing and quantification (2 mM TSP). The solution was clarified by centrifugation (4200 rpm for 1 min at room temperature) and 0.7 mL of supernatant was put in a standard 5 mm NMR tube.
The dried chloroform fraction was dissolved in 0.75 mL of CDCl3/CD3OD (2:1 v/v) mixture containing tetramethylsilane (TMS) as an internal standard and then transferred in a 5 mm NMR tube that was flame sealed.

4.4.2. NMR Experiments

The NMR spectra of all extracts were recorded at 27 °C on a Bruker AVANCE III HD 600 spectrometer (Rheinstetten, Germany) operating at the proton frequency of 600.13 MHz and equipped with a Bruker multinuclear z-gradient inverse probehead.
Proton spectra were referenced to TSP signal (δ = 0.00 ppm) or TMS signal (δ = 0.00 ppm) for hydroalcoholic and chloroform fractions, respectively.
The 1H spectra of the hydroalcoholic fraction were acquired by co-adding 256 transients with a recycle delay of 7 s and using a 90° pulse of 12–15 μs, 32k data points and 10.2 ppm spectral window width. The residual HDO signal was suppressed using a soft pulse presaturation scheme (Bruker pulse program zgpr) during the relaxation delay. The 1H spectra of the chloroform fraction were acquired by co-adding 256 transients with a recycle delay of 5 s and using a 90° pulse of 10–11 μs, 32k data points and 13 ppm spectral window width. All proton spectra after acquisition were zero-filled to 64k data points, and Fourier transformed using 0.3 Hz exponential multiplication factor. Manual phase and baseline correction were performed.
For the quantification of metabolites, the selected signals listed in Table 1 and Table 3 were integrated and the integrals were normalized with respect to the integral of the internal standard signal at 0.0 ppm (TSP or TMS for aqueous or organic extracts, respectively).
2D NMR spectra of all extracts were acquired under the experimental conditions previously reported [73]. 1H–1H TOCSY experiments were carried out with a mixing time of 80 ms, 1H–13C HSQC experiments with a coupling constant 1J(C-H) of 150 Hz, and 1H–13C HMBC experiments with a delay of 100 ms for the evolution of long-range couplings. 1H–15N HMBC experiment was acquired using 5805 and 12,163 Hz spectral width for 1H and 15N, respectively, with a delay of 125 ms for the evolution of long-range couplings. Chemical shifts were calibrated using TSP and indirect referencing of 15N [74].

5. Conclusions

The present study introduces the NMR methodological approach to a comprehensive analysis of metabolites present in globe artichoke and cauliflower byproducts, aimed at their valorization as a source of different classes of valuable health-beneficial bioactive compounds that still can be recovered and reutilized. The results of qualitative and quantitative NMR analyses are consistent with the available literature data on similar byproducts analyzed by other analytical methods (HPLC [12,16,20,59], UHPLC/Q-TOF-MS [18], FT-IR [12], and electrokinetic capillary chromatography [62]), indicating that NMR analysis is a valid alternative for the characterization of similar agri-food byproducts and waste. The developed NMR-based approach is an important starting point for the valorization of byproducts and future implementation of recovered bioactive compounds in the formulation of new products, such as plant growth bio-stimulants and food supplements.

Supplementary Materials

The following supporting information can be downloaded at: https://www.mdpi.com/article/10.3390/molecules28031363/s1; Figure S1: 1H NMR spectra of aqueous extract from globe artichoke byproducts: stalks (a) and leaves (b); Figure S2: The 1H-13C HSQC NMR 2D map of globe artichoke leaves aqueous extract; Figure S3: The 1H-13C HMBC NMR 2D map of globe artichoke leaves aqueous extract; Figure S4: The 1H-1H TOCSY NMR 2D map of globe artichoke leaves aqueous extract; Figure S5: The 1H-13C HSQC NMR 2D map of globe artichoke stalks aqueous extract; Figure S6: The 1H-13C HMBC NMR 2D map of globe artichoke stalks aqueous extract; Figure S7: The 1H-1H TOCSY NMR 2D map of globe artichoke stalks aqueous extract; Figure S8: The 3.64–3.52 ppm 1H NMR spectral region of globe artichoke leaves aqueous extract (blue) in comparison with fructose 1H NMR spectrum (red trace). Asterisks indicate the components of the chiro-inositol multiplet signal; Figure S9: The 1H-13C HSQC NMR 2D map of globe artichoke leaves chloroform extract; Figure S10: The 1H-13C HMBC NMR 2D map of globe artichoke leaves chloroform extract; Figure S11: The 1H-1H TOCSY NMR 2D map of globe artichoke leaves chloroform extract; Figure S12: The 1H-13C HSQC NMR 2D map of globe artichoke stalks chloroform extract; Figure S13: The 1H-13C HMBC NMR 2D map of globe artichoke stalks chloroform extract; Figure S14: The 1H-1H TOCSY NMR 2D map of globe artichoke stalks chloroform extract; Figure S15: The 1H-13C HSQC NMR 2D map of cauliflower leaves aqueous extract; Figure S16: The 1H-13C HMBC NMR 2D map of cauliflower leaves aqueous extract; Figure S17: The 1H-1H TOCSY NMR 2D map of cauliflower leaves aqueous extract; Figure S18: The 1H-13C HSQC NMR 2D map of cauliflower florets aqueous extract; Figure S19: The 1H-13C HMBC NMR 2D map of cauliflower florets aqueous extract; Figure S20: The 1H-1H TOCSY NMR 2D map of cauliflower florets aqueous extract; Figure S21: The 1H-13C HSQC NMR 2D map of cauliflower stalks aqueous extract; Figure S22: The 1H-13C HMBC NMR 2D map of cauliflower stalks aqueous extract; Figure S23: The 1H-1H TOCSY NMR 2D map of cauliflower stalks aqueous extract; Figure S24: 1H NMR spectra of cauliflower florets (a), stalks (b) and leaves (c) chloroform extracts. Solvent: CDCl3/CD3OD 2:1 v/v; Figure S25: The 1H-13C HSQC NMR 2D map of cauliflower leaves chloroform extract; Figure S26: The 1H-13C HMBC NMR 2D map of cauliflower leaves chloroform extract; Figure S27: The 1H-1H TOCSY NMR 2D map of cauliflower leaves chloroform extract; Figure S28: The 1H-13C HSQC NMR 2D map of cauliflower florets chloroform extract; Figure S29: The 1H-13C HMBC NMR 2D map of cauliflower florets chloroform extract; Figure S30: The 1H-1H TOCSY NMR 2D map of cauliflower florets chloroform extract; Figure S31: The 1H-13C HSQC NMR 2D map of cauliflower stalks chloroform extract; Figure S32: The 1H-13C HMBC NMR 2D map of cauliflower stalks chloroform extract; Figure S33: The 1H-1H TOCSY NMR 2D map of cauliflower stalks chloroform extract.

Author Contributions

Conceptualization, A.P.S., L.M. and E.C.; methodology, G.D.M. and C.I.; validation, E.A. and M.S.; formal analysis, G.D.M. and M.S.; investigation, C.I., G.D.M. and M.S.; data curation, C.I., G.D.M. and M.S.; writing—original draft preparation, A.P.S. and L.M.; writing—review and editing, A.P.S., C.I., M.S., E.C., E.A. and G.D.M.; visualization, E.A.; supervision, A.P.S.; project administration, L.M. and E.C.; funding acquisition, L.M., A.P.S. and E.C. All authors have read and agreed to the published version of the manuscript.

Funding

This research was funded by POR FESR Lazio 2014–2020, RicicloHorto Project (POR FESR Lazio 2014–2020. Progetto T0002E0001. “Progetti di Gruppi di Ricerca 2020” Protocol A0375-2020-36541 CUP: B85F21001170002).

Institutional Review Board Statement

Not applicable.

Informed Consent Statement

Not applicable.

Data Availability Statement

The data presented in this study are available in the article and in the supplementary material.

Conflicts of Interest

The authors declare no conflict of interest.

References

  1. FAO The State of Food and Agriculture. Moving forward on Food Loss and Waste Reduction. Licence: CC BYNC-SA 3.0 IGO. Rome. 2019. Available online: https://www.fao.org/3/ca6030en/ca6030en.pdf (accessed on 20 December 2022).
  2. Esparza, I.; Jiménez-Moreno, N.; Bimbela, F.; Ancín-Azpilicueta, C.; Gandía, L.M. Fruit and vegetable waste management: Conventional and emerging approaches. J. Environ. Manag. 2020, 265, 110510. [Google Scholar] [CrossRef] [PubMed]
  3. United Nations Department of Economic and Social Affairs. Goal 12: Ensure Sustainable Consumption and Production Patterns. Available online: https://sdgs.un.org/goals/goal12 (accessed on 16 November 2022).
  4. Ben-Othman, S.; Jõudu, I.; Bhat, R. Bioactives from agri-food wastes: Present insights and future challenges. Molecules 2020, 25, 510. [Google Scholar] [CrossRef] [PubMed] [Green Version]
  5. Lau, K.Q.; Sabran, M.R.; Shafie, S.R. Utilization of vegetable and fruit byproducts as functional ingredient and food. Front. Nutr. 2021, 8, 661693. [Google Scholar] [CrossRef] [PubMed]
  6. Wang, Z.; Xu, B.; Luo, H.; Meng, K.; Wang, Y.; Liu, M.; Bai, Y.; Yao, B.; Tu, T. Production pectin oligosaccharides using Humicola insolens Y1-derived unusual pectate lyase. J. Biosci. Bioeng. 2020, 129, 16–22. [Google Scholar] [CrossRef]
  7. Basri, M.S.M.; Shah, N.N.A.K.; Sulaiman, A.; Tawakkal, I.S.M.A.; Nor, M.Z.M.; Ariffin, S.H.; Ghani, N.H.A.; Salleh, F.S.M. Progress in the valorization of fruit and vegetable wastes: Active packaging, biocomposites, byproducts, and innovative technologies used for bioactive compound extraction. Polymers 2021, 13, 3503. [Google Scholar] [CrossRef]
  8. Arquelau, P.B.F.; de Silva, V.D.M.; Garcia, M.A.V.T.; de Araújo, R.L.B.; Fante, C.A. Characterization of edible coatings based on ripe “Prata” banana peel flour. Food. Hydrocolloid. 2019, 89, 570–578. [Google Scholar] [CrossRef]
  9. González-García, E.; Marina, M.L.; García, M.C. Plum (Prunus Domestica L.) byproduct as a new and cheap source of bioactive peptides: Extraction method and peptides characterization. J. Funct. Foods 2014, 11, 428–437. [Google Scholar] [CrossRef]
  10. Xu, Y.; Bao, T.; Han, W.; Chen, W.; Zheng, X.; Wang, J. Purification and identification of an angiotensin I-converting enzyme inhibitory peptide from cauliflower byproducts protein hydrolysate. Process. Biochem. 2016, 51, 1299–1305. [Google Scholar] [CrossRef]
  11. Food and Agriculture Organization of the United Nations. FAOSTAT Statistical Database—Crops and Livestock Products. FAO, 2020. Available online: https://www.fao.org/faostat/en/#data/QCL (accessed on 20 December 2022).
  12. Francavilla, M.; Marone, M.; Marasco, P.; Contillo, F.; Monteleone, M. Artichoke biorefinery: From food to advanced technological applications. Foods 2021, 10, 112. [Google Scholar] [CrossRef]
  13. Khedkar, M.A.; Nimbalkar, P.R.; Chavan, P.V.; Chendake, Y.J.; Bankar, S.B. Cauliflower waste utilization for sustainable biobutanol production: Revelation of drying kinetics and bioprocess development. Bioprocess. Biosyst. Eng. 2017, 40, 1493–1506. [Google Scholar] [CrossRef] [Green Version]
  14. Zayed, A.; Farag, M.A. Valorization, extraction optimization and technology advancements of artichoke biowastes: Food and non-food applications. Food. Sci. Technol. 2020, 132, 109883. [Google Scholar] [CrossRef]
  15. de Falco, B.; Incerti, G.; Amato, M.; Lanzotti, V. Artichoke: Botanical, agronomical, phytochemical, and pharmacological overview. Phytochem. Rev. 2015, 14, 993–1018. [Google Scholar] [CrossRef]
  16. Zeaiter, Z.; Regonesi, M.E.; Cavini, S.; Labra, M.; Sello, G.; Di Gennaro, P. Extraction and characterization of inulin-type fructans from artichoke wastes and their effect on the growth of intestinal bacteria associated with health. Biomed. Res. Int. 2019, 2019, 1083952. [Google Scholar] [CrossRef] [PubMed] [Green Version]
  17. Ruiz-Aceituno, L.; García-Sarrió, M.J.; Alonso-Rodriguez, B.; Ramos, L.; Sanz, M.L. Extraction of bioactive carbohydrates from artichoke (Cynara scolymus L.) external bracts using microwave assisted extraction and pressurized liquid extraction. Food Chem. 2016, 196, 1156–1162. [Google Scholar] [CrossRef] [PubMed]
  18. Rouphael, Y.; Bernardi, J.; Cardarelli, M.; Bernardo, L.; Kane, D.; Colla, G.; Lucini, L. Phenolic compounds and sesquiterpene lactones profile in leaves of nineteen artichoke cultivars. J. Agric. Food. Chem. 2016, 64, 8540–8548. [Google Scholar] [CrossRef]
  19. Órbenes, G.; Rodríguez-Seoane, P.; Torres, M.D.; Chamy, R.; Zúñiga, M.E.; Domínguez, H. Valorization of artichoke industrial byproducts using green extraction technologies: Formulation of hydrogels in combination with paulownia extracts. Molecules 2021, 26, 4386. [Google Scholar] [CrossRef]
  20. Mena-García, A.; Rodríguez-Sánchez, S.; Ruiz-Matute, A.I.; Sanz, M.L. Exploitation of artichoke byproducts to obtain bioactive extracts enriched in inositols and caffeoylquinic acids by microwave assisted extraction. J. Chromatogr. A 2020, 1613, 460703. [Google Scholar] [CrossRef]
  21. Mabeau, S.; Baty-Julien, C.; Chodosas, O.; Surbled, M.; Metra, P.; Durand, D.; Morice, G.; Chesné, C.; Mekideche, K. Antioxidant activity of artichoke extracts and byproducts. Acta Hortic. 2007, 744, 431–443. [Google Scholar] [CrossRef]
  22. De Menna, F.; Malagnino, R.A.; Vittuari, M.; Molari, G.; Seddaiu, G.; Deligios, P.A.; Solinas, S.; Ledda, L. Potential biogas production from artichoke byproducts in Sardinia, Italy. Energies 2016, 9, 92. [Google Scholar] [CrossRef]
  23. Llorach, R.; Espín, J.C.; Tomás-Barberán, F.A.; Ferreres, F. Valorization of cauliflower (Brassica oleracea L. var. botrytis) byproducts as a source of antioxidant phenolics. J. Agric. Food Chem. 2003, 51, 2181–2187. [Google Scholar] [CrossRef]
  24. Collado-González, J.; Piñero, M.C.; Del Amor, F.M.; Otálora, G.; López-Marín, J. The effect of foliar putrescine application, ammonium exposure, and heat stress on antioxidant compounds in cauliflower waste. Antioxidants 2021, 10, 707. [Google Scholar] [CrossRef] [PubMed]
  25. Ahmed, F.A.; Ali, R.F.M. Bioactive compounds and antioxidant activity of fresh and processed white cauliflower. Biomed. Res. Int. 2013, 2013, 367819. [Google Scholar] [CrossRef]
  26. Femenia, A.; Robertson, J.A.; Waldron, K.W.; Selvendran, R.R.; Cauliflower (Brassica oleracea, L. Cauliflower (Brassica oleracea L.), globe artichoke (Cynara scolymus) and chicory witloof (Cichorium intybus) processing byproducts as sources of dietary fibre. J. Sci. Food. Agric. 1998, 77, 511–518. [Google Scholar] [CrossRef]
  27. Caliceti, C.; Capriotti, A.L.; Calabria, D.; Bonvicini, F.; Zenezini Chiozzi, R.; Montone, C.M.; Piovesana, S.; Zangheri, M.; Mirasoli, M.; Simoni, P.; et al. Peptides from cauliflower byproducts, obtained by an efficient, ecosustainable, and semi-industrial method, exert protective effects on endothelial function. Oxid. Med. Cell Longev. 2019, 2019, 1046504. [Google Scholar] [CrossRef] [PubMed] [Green Version]
  28. Mannina, L.; Sobolev, A.P.; Viel, S. Liquid state 1H high field NMR in food analysis. Prog. Nucl. Magn. Reson. Spectrosc. 2012, 66, 1–39. [Google Scholar] [CrossRef] [PubMed]
  29. Deborde, C.; Fontaine, J.X.; Jacob, D.; Botana, A.; Nicaise, V.; Richard-Forget, F.; Lecomte, S.; Decourtil, C.; Hamade, K.; Mesnard, F.; et al. Optimizing 1D 1H-NMR profiling of plant samples for high throughput analysis: Extract preparation, standardization, automation and spectra processing. Metabolomics 2019, 15, 28. [Google Scholar] [CrossRef] [Green Version]
  30. Sobolev, A.P.; Brosio, E.; Gianferri, R.; Segre, A.L. Metabolic profile of lettuce leaves by high-field NMR spectra. Magn. Reson. Chem. 2005, 43, 625–638. [Google Scholar] [CrossRef] [Green Version]
  31. Wedeking, R.; Maucourt, M.; Deborde, C.; Moing, A.; Gibon, Y.; Goldbach, H.E.; Wimmer, M.A. 1H-NMR metabolomic profiling reveals a distinct metabolic recovery response in shoots and roots of temporarily drought-stressed sugar beets. PLoS ONE 2018, 13, e0196102. [Google Scholar] [CrossRef] [Green Version]
  32. Ingallina, C.; Sobolev, A.P.; Circi, S.; Spano, M.; Fraschetti, C.; Filippi, A.; Di Sotto, A.; Di Giacomo, S.; Mazzoccanti, G.; Gasparrini, F.; et al. Cannabis sativa, L. inflorescences from monoecious cultivars grown in central Italy: An untargeted chemical characterization from early flowering to ripening. Molecules 2020, 25, 1908. [Google Scholar] [CrossRef] [PubMed]
  33. Georgiev, M.I.; Radziszewska, A.; Neumann, M.; Marchev, A.; Alipieva, K.; Ludwig-Müller, J.; Metabolic alterations of Verbascum nigrum, L. Metabolic alterations of Verbascum nigrum L. plants and SAArT transformed roots as revealed by NMR-based metabolomics. Plant. Cell Tissue Organ. Cult. 2015, 123, 349–356. [Google Scholar] [CrossRef]
  34. Ingallina, C.; Spano, M.; Sobolev, A.P.; Esposito, C.; Santarcangelo, C.; Baldi, A.; Daglia, M.; Mannina, L. Characterization of local products for their industrial use: The case of italian potato cultivars analyzed by untargeted and targeted methodologies. Foods 2020, 9, 1216. [Google Scholar] [CrossRef] [PubMed]
  35. Sobolev, A.P.; Mannina, L.; Proietti, N.; Carradori, S.; Daglia, M.; Giusti, A.M.; Antiochia, R.; Capitani, D. Untargeted NMR-based methodology in the study of fruit metabolites. Molecules 2015, 20, 4088–4108. [Google Scholar] [CrossRef] [PubMed] [Green Version]
  36. de Falco, B.; Incerti, G.; Pepe, R.; Amato, M.; Lanzotti, V. Metabolomic fingerprinting of Romaneschi globe artichokes by NMR spectroscopy and multivariate data analysis. Phytochem. Anal. 2016, 27, 304–314. [Google Scholar] [CrossRef] [PubMed]
  37. Albergamo, A.; Rotondo, A.; Salvo, A.; Pellizzeri, V.; Bua, D.G.; Maggio, A.; Cicero, N.; Dugo, G. Metabolite and mineral profiling of “Violetto di Niscemi” and “Spinoso di Menfi” globe artichokes by 1H-NMR and ICP-MS. Nat. Prod. Res. 2016, 31, 990–999. [Google Scholar] [CrossRef]
  38. Blanco, E.; Musio, B.; Todisco, S.; Mastrorilli, P.; Gallo, V.; Sonnante, G. Non-targeted NMR approach to unveil and promote the biodiversity of globe artichoke in the Mediterranean area. J. Food Compos. Anal. 2022, 110, 104539. [Google Scholar] [CrossRef]
  39. Lucarini, M.; Di Cocco, M.E.; Raguso, V.; Milanetti, F.; Durazzo, A.; Lombardi-Boccia, G.; Santini, A.; Delfini, M.; Sciubba, F. NMR-based metabolomic comparison of Brassica oleracea (var. italica): Organic and conventional farming. Foods 2020, 9, 945. [Google Scholar] [CrossRef]
  40. Ulrich, E.L.; Akutsu, H.; Doreleijers, J.F.; Harano, Y.; Ioannidis, Y.E.; Lin, J.; Livny, M.; Mading, S.; Maziuk, D.; Miller, Z.; et al. BioMagResBank. Nucleic Acids Res. 2008, 36, D402–D408. [Google Scholar] [CrossRef] [Green Version]
  41. Angyal, S.J.; Odier, L. The effect of O-methylation on chemical shifts in the 1H- and 13C-nm.r. spectra of cyclic polyols. Carbohydr. Res. 1983, 123, 23–29. [Google Scholar] [CrossRef]
  42. Angyal, S.J.; Odier, L. The 13C-nm.r. spectra of inositols and cyclohexanepentols: The validity of rules correlating chemical shifts with configuration. Carbohydr. Res. 1982, 100, 43–54. [Google Scholar] [CrossRef]
  43. Clifford, M.N.; Jaganath, I.B.; Ludwig, I.A.; Crozier, A. Chlorogenic acids and the acyl-quinic acids: Discovery, biosynthesis, bioavailability and bioactivity. Nat. Prod. Rep. 2017, 34, 1391–1421. [Google Scholar] [CrossRef] [Green Version]
  44. Pauli, G.F.; Kuczkowiak, U.; Nahrstedt, A. Solvent effects in the structure dereplication of caffeoyl quinic acids. Magn. Reson. Chem. 1999, 37, 827–836. [Google Scholar] [CrossRef]
  45. Tastan, P.; Hajdú, Z.; Kúsz, N.; Zupkó, I.; Sinka, I.; Kivcak, B.; Hohmann, J. Sesquiterpene lactones and flavonoids from Psephellus pyrrhoblepharus with antiproliferative activity on human gynecological cancer cell lines. Molecules 2019, 24, 3165. [Google Scholar] [CrossRef] [PubMed] [Green Version]
  46. Hussien, T.A.; Mohamed, T.A.; Elshamy, A.I.; Moustafa, M.F.; El-Seedi, H.R.; Pare, P.W.; Hegazy, M.E.F. Guaianolide sesquiterpene lactones from Centaurothamnus maximus. Molecules 2021, 26, 2055. [Google Scholar] [CrossRef]
  47. Samek, Z.; Holub, M.; Drozdz, B.; Iommi, G.; Corbella, A.; Gariboldi, P.; Sesquiterpenic lactones of the Cynara scolymus, L. Sesquiterpenic lactones of the Cynara scolymus L. species. Tetrahedron Lett. 1971, 50, 4775–4778. [Google Scholar] [CrossRef]
  48. Barbetti, P.; Chiappini, I.; Fardella, G.; Grandolini, G. Grosulfeimin and new related guaianolides from Cynara scolymusl. Nat. Prod. Lett. 1993, 3, 21–30. [Google Scholar] [CrossRef]
  49. Adekenov, S.; Shaimerdenova, Z.R.; Adekenova, K.S.; Kishkentayeva, A.S. Synthesis and biological evaluation of new derivatives of grossheimin. Fitoterapia 2022, 158, 105154. [Google Scholar] [CrossRef] [PubMed]
  50. Ingallina, C.; Capitani, D.; Mannina, L.; Carradori, S.; Locatelli, M.; Di Sotto, A.; Di Giacomo, S.; Toniolo, C.; Pasqua, G.; Valletta, A.; et al. Phytochemical and biological characterization of Italian “sedano bianco di Sperlonga” Protected Geographical Indication celery ecotype: A multimethodological approach. Food. Chem. 2020, 309, 125649. [Google Scholar] [CrossRef]
  51. Salzano, A.M.; Sobolev, A.; Carbone, V.; Petriccione, M.; Renzone, G.; Capitani, D.; Vitale, M.; Minasi, P.; Pasquariello, M.S.; Novi, G.; et al. A proteometabolomic study of Actinidia deliciosa fruit development. J. Proteomics 2018, 172, 11–24. [Google Scholar] [CrossRef]
  52. Cox, P.A.; Banack, S.A.; Murch, S.J.; Rasmussen, U.; Tien, G.; Bidigare, R.R.; Metcalf, J.S.; Morrison, L.F.; Codd, G.A.; Bergman, B. Diverse taxa of cyanobacteria produce β-N-methylamino-L-alanine, a neurotoxic amino acid. Proc. Natl. Acad. Sci. USA 2005, 102, 5074–5078. [Google Scholar] [CrossRef] [Green Version]
  53. Hibi, M.; Kawashima, T.; Yajima, H.; Smirnov, S.V.; Kodera, T.; Sugiyama, M.; Shimizu, S.; Yokozeki, K.; Ogawa, J. Enzymatic synthesis of chiral amino acid sulfoxides by Fe(II)/α-ketoglutarate-dependent dioxygenase. Tetrahedron Asymmetry 2013, 24, 990–994. [Google Scholar] [CrossRef] [Green Version]
  54. Marks, H.S.; Hilson, J.A.; Leichtweis, H.C.; Stoewsand, G.S. S-Methylcysteine sulfoxide in Brassica vegetables and formation of methyl methanethiosulfinate from brussels sprouts. J. Agric. Food Chem. 1992, 40, 2098–2101. [Google Scholar] [CrossRef]
  55. Edmands, W.M.B.; Beckonert, O.P.; Stella, C.; Campbell, A.; Lake, B.G.; Lindon, J.C.; Holmes, E.; Gooderham, N.J. Identification of human urinary biomarkers of cruciferous vegetable consumption by metabonomic profiling. J. Proteome Res. 2011, 10, 4513–4521. [Google Scholar] [CrossRef] [PubMed] [Green Version]
  56. Hwang, I.M.; Park, B.; Dang, Y.M.; Kim, S.Y.; Seo, H.Y. Simultaneous direct determination of 15 glucosinolates in eight Brassica species by UHPLC-Q-Orbitrap-MS. Food. Chem. 2019, 282, 127–133. [Google Scholar] [CrossRef]
  57. Jaki, B.; Sticher, O.; Veit, M.; Fröhlich, R.; Pauli, G.F. Evaluation of glucoiberin reference material from Iberis amara by spectroscopic fingerprinting. J. Nat. Prod. 2002, 65, 517–522. [Google Scholar] [CrossRef]
  58. Vo, Q.V.; Trenerry, C.; Rochfort, S.; Wadeson, J.; Leyton, C.; Hughes, A.B. Synthesis and anti-inflammatory activity of indole glucosinolates. Bioorgan. Med. Chem. 2014, 22, 856–864. [Google Scholar] [CrossRef] [PubMed]
  59. Pandino, G.; Lombardo, S.; Mauromicale, G. Globe artichoke leaves and floral stems as a source of bioactive compounds. Ind. Crop. Prod. 2013, 44, 44–49. [Google Scholar] [CrossRef]
  60. Venezia, V.; Pota, G.; Silvestri, B.; Vitiello, G.; Di Donato, P.; Landi, G.; Mollo, V.; Verrillo, M.; Cangemi, S.; Piccolo, A.; et al. A study on structural evolution of hybrid humic acids-SiO2 nanostructures in pure water: Effects on physico-chemical and functional properties. Chemosphere 2022, 287, 131985. [Google Scholar] [CrossRef]
  61. Verrillo, M.; Salzano, M.; Savy, D.; Di Meo, V.; Valentini, M.; Cozzolino, V.; Piccolo, A. Antibacterial and antioxidant properties of humic substances from composted agricultural biomasses. Chem. Biol. Technol. Agric. 2022, 9, 28. [Google Scholar] [CrossRef]
  62. Kubec, R.; Dadáková, E. Quantitative determination of S-alk(en)ylcysteine-S-oxides by micellar electrokinetic capillary chromatography. J. Chromatogr. A 2008, 1212, 154–157. [Google Scholar] [CrossRef]
  63. Mancini, M.; Andreassi, A.; Salvioni, M.; Pelliccione, F.; Mantellassi, G.; Banderali, G. myo-Inositol and D-chiro-inositol in improving insulin resistance in obese male children: Preliminary Data. Int. J. Endocrinol. 2016, 2016, 8720342. [Google Scholar] [CrossRef] [Green Version]
  64. Croze, M.L.; Vella, R.E.; Pillon, N.J.; Soula, H.A.; Hadji, L.; Guichardant, M.; Soulage, C.O. Chronic treatment with myo-inositol reduces white adipose tissue accretion and improves insulin sensitivity in female mice. J. Nutr. Biochem. 2013, 24, 457–466. [Google Scholar] [CrossRef] [Green Version]
  65. Okazaki, Y.; Katayama, T. Effects of dietary carbohydrate and myo-inositol on metabolic changes in rats fed 1,1,1-trichloro-2,2-bis (p-chlorophenyl) ethane (DDT). J. Nutr. Biochem. 2003, 14, 81–89. [Google Scholar] [CrossRef] [PubMed]
  66. Elsebai, M.F.; Mocan, A.; Atanasov, A.G. Cynaropicrin: A comprehensive research review and therapeutic potential as an anti-hepatitis C virus agent. Front. Pharmacol. 2016, 7, 472. [Google Scholar] [CrossRef] [PubMed] [Green Version]
  67. Mena-García, A.; Ruiz-Matute, A.I.; Soria, A.C.; Sanz, M.L. A multi-analytical strategy for evaluation of quality and authenticity of artichoke food supplements for overweight control. J. Chromatogr. A 2021, 1647, 462102. [Google Scholar] [CrossRef]
  68. Roberfroid, M.B. Introducing inulin-type fructans. Br. J. Nutr. 2005, 93, S13–S25. [Google Scholar] [CrossRef] [PubMed]
  69. Kumari, K.; Augusti, K.T. Lipid lowering effect of S-methyl cysteine sulfoxide from Allium cepa Linn in high cholesterol diet fed rats. J. Ethnopharmacol. 2007, 109, 367–371. [Google Scholar] [CrossRef]
  70. Castro, V.M.D.D.; Medeiros, K.C.D.P.; Lemos, L.I.C.D.; Pedrosa, L.D.F.C.; Ladd, F.V.L.; Carvalho, T.G.D.; Araújo Júnior, R.F.D.; Abreu, B.J.; Farias, N.B.D.S. S-methyl cysteine sulfoxide ameliorates duodenal morphological alterations in streptozotocin-induced diabetic rats. Tissue Cell 2021, 69, 101483. [Google Scholar] [CrossRef]
  71. Almushayti, A.Y.; Brandt, K.; Carroll, M.A.; Scotter, M.J. Current analytical methods for determination of glucosinolates in vegetables and human tissues. J. Chromatogr. A 2021, 1643, 462060. [Google Scholar] [CrossRef]
  72. Bligh, E.G.; Dyer, W.J. A rapid method of total lipid extraction and purification. Can. J. Biochem. Physiol. 1959, 37, 911–917. [Google Scholar] [CrossRef]
  73. Sobolev, A.P.; Mannina, L.; Capitani, D.; Sanzò, G.; Ingallina, C.; Botta, B.; Fornarini, S.; Crestoni, M.E.; Chiavarino, B.; Carradori, S.; et al. A multi-methodological approach in the study of Italian PDO “Cornetto di Pontecorvo” red sweet pepper. Food Chem. 2018, 255, 120–131. [Google Scholar] [CrossRef]
  74. Wishart, D.S.; Bigama, C.G.; Yao, J.; Abildgaard, F.; Dyson, H.J.; Oldfield, E.; Markley, J.L.; Sykes, B.D. 1H, 13C and 15N chemical shift referencing in biomolecular NMR. J. Biomol. NMR 1995, 6, 135–140. [Google Scholar] [CrossRef] [PubMed]
Figure 1. 1H NMR spectra of globe artichoke leaves (a) and stalks (b) chloroform extracts. Solvent: CDCl3/CD3OD 2:1 v/v. Asterisks indicate cynaropicrin signals.
Molecules 28 01363 g001
Figure 2. Structures of sesquiterpene lactones: (a) cynaropicrin; (b) dehydrocynaropicrin; (c) grosheimin; (d) cynaratriol; (e) 8-deoxy-11,13-dihydroxygrosheimin.
Molecules 28 01363 g002aMolecules 28 01363 g002b
Figure 3. 1H NMR spectra of cauliflower byproducts aqueous extracts: florets (a), stalks (b), leaves (c).
Molecules 28 01363 g003
Figure 4. Selected region of 1H-15N HMBC NMR spectrum of cauliflower water-soluble metabolite fraction (florets extract).
Molecules 28 01363 g004
Table 1. Metabolites identified in aqueous extracts of cauliflower and globe artichoke byproducts. Relative assignments of 1H and 13C NMR signals are reported. L = leaves; S = stalks; F = florets; d = doublet; dd = doublet of doublets; m = multiplet; qd = quartet of doublets; s = singlet; t = triplet.
MetaboliteAssignmentδ 1H (ppm)Multiplicity (JH-H, Hz)δ 13C (ppm)Globe ArtichokeCauliflower
Amino acids
Alanine (Ala)β-CH31.49 *d (7.2)17.2L, SL, S, F
α-CH3.80 51.5
Arginine (Arg)α-CH3.78 55.1LL, S, F
β-CH21.93 28.6
γ, γ′-CH21.74; 1.67 * 24.9
δ-CH23.24 41.5
Asparagine (Asn)β-CH2.89dd (16.9; 7.2)35.6L, SL, S, F
β′-CH2.96 *dd (16.9; 4.5)35.6
α-CH4.01 52.2
Aspartate (Asp)β-CH2.71dd (17.4; 8.1)37.6L, SL, S, F
β′-CH2.80 *dd (17.4; 3.8)37.6
α-CH3.91 53.2
γ-Aminobutyric acid (GABA)β-CH21.91 24.7L, SL, S, F
α-CH22.30 *t (7.4)35.4
γ-CH23.02t (7.6)40.2
Glycine (Gly)α-CH23.57s42.5 L, F
Glutamate (Glu)β, β′-CH22.13; 2.08m28.0L, SL, S, F
γ-CH22.35 *m34.4
α-CH3.77 55.5
Glutamine (Gln)β-CH22.15m 27.3L, SL, S, F
γ-CH22.46 *m31.8
α-CH3.78 55.2
Histidine (His)β, β′-CH23.30; 3.24 28.2LL, S, F
α-CH4.02 55.4
CH-57.18 118.3
CH-28.13 *
Isoleucine (Ile)δ-CH30.94t (7.4)12.1L, SL, S, F
γ-CH31.01 *d (7.0)15.7
γ, γ′-CH21.48; 1.27 25.5
β-CH1.98 36.8
α-CH3.68 60.5
Leucine (Leu)δ-CH30.96 *d (6.2)22.1L, SL, S, F
δ′-CH30.97 *d (6.0)23.0
β-CH21.73 40.9
α-CH3.74 54.4
γ-CH1.70 25.2
Lysine (Lys)α-CH3.77 55.3LL, F
β-CH21.92 30.9
γ-CH21.49 22.5
δ-CH21.74 27.4
ε-CH23.04 *t (7.6)40.0
S-Methyl-L-cysteine-S-oxide (Methiin)α-CH4.18t (6.8)51.8 L, S, F
β-CH23.47; 3.28dd (14.0; 7.2)54.5
γ-CH32.84 *s39.1
COOH 173.1
Phenylalanine (Phe)β, β′-CH23.27; 3.16 37.4L, SL, S, F
α-CH4.00 56.9
CH-2,67.34d (7.3)130.5
CH-47.38t (7.0)128.7
CH-3,57.43 *t (7.3)130.2
Pyroglutamic acidβ, β’-CH22.04; 2.51 26.3LL, F
γ-CH22.40 30.7
α-CH4.18 59.3
Threonine (Thr)γ-CH31.34 *d (6.6)20.5L, SL, S, F
α-CH3.61 61.4
β-CH4.26qd (6.6; 4.9)66.9
Tryptophan (Trp)CH-47.73 *d (7.9)119.5LL, S, F
CH-77.55d (7.4)113.0
CH-67.29t (7.4)123.2
CH-57.20 120.4
CH-27.34s126.2
α-CH4.06 55.9
β, β′-CH23.48; 3.32 27.4
Tyrosine (Tyr)CH-2,67.20d (8.5)131.7LL, S, F
CH-3,56.91 *d (8.5)116.9
α-CH3.95 57.1
β, β′-CH23.19; 3.07 36.5
Valine (Val)γ-CH31.00d (7.0)17.7L, SL, S, F
γ′-CH31.05 *d (7.0)19.0
β-CH2.28 30.1
α-CH3.62 61.3
Organic acids
Acetic acid (AA)αCH31.93 *s24.4L, SL, S, F
Citric acid (CA)α, γ-CH2.54 *; 2.68d (15.5)46.5L, SL, S, F
Formic acid (FA)HCOO-8.47 *s173.8L, SL, S, F
Fumaric acid (FumA)α, β-HC=CH6.53 *s136.5L, SL, S, F
Lactic acid (LA)β-CH31.33 *d (6.9)21.1SL
α-CH4.12 69.6
Malic acid (MA)β-CH2.68dd (15.4; 3.2)43.6L, SL, S, F
β′-CH2.39dd (15.4; 10.0)43.6
α-CH4.30 *dd (10.0; 3.2)71.4
Pyruvic acid (PA)CH32.36s30.0 L, F
Quinic acid (QA)C(OH)COOH 78.1L, SL
2,2′-CH22.04; 1.97 38.5
6,6′-CH22.08; 1.88 * 41.8
CH-34.16 71.5
CH-43.56 76.3
CH-54.03 68.0
Succinic acid (SA)α, β-CH22.41 *s35.1L, SL, S, F
Carbohydrates, polyols
α-Glucose (α-Glc)CH-15.25 *d (3.8)93.1L, SL, S, F
CH-23.55 72.4
CH-33.72 73.8
CH-43.42 70.7
CH-53.84 72.5
CH2-63.84; 3.78 61.6
β-Glucose (β-Glc)CH-14.65 *d (8.0)96.9L, SL, S, F
CH-23.26 75.2
CH-33.50 76.7
CH-43.42 70.7
CH-53.47 76.9
CH2-63.90; 3.74 61.7
α-FructofuranoseCH-34.13 * 82.9L, SL, S, F
CH-54.07 82.4
β-FructofuranoseCH2-1,1′3.60; 3.57 63.8L, SL, S, F
CH-34.12 * 76.4
CH-44.12 * 75.4
CH-53.83 81.6
CH2-6,6′3.81; 3.68 63.3
β-FructopyranoseCH2-1, 1′3.72; 3.56 64.8L, SL, S, F
CH-33.81 68.5
CH-43.90 70.6
CH-54.00 70.2
CH2-6,6′4.03; 3.71 64.4
Sucrose (Suc)CH-15.42 *d (3.8)93.2L, SL, S, F
CH-23.56 72.0
CH-33.77 73.5
CH-43.48 70.2
CH-53.85 73.4
CH2-63.82 61.2
CH2-1′3.69 62.4
C-2/ 104.8
CH-3′4.22 77.4
CH-4′4.06 75.0
CH-5′3.90 82.4
CH-6′3.82 63.4
RaffinoseCH-1 (Gal)5.00 *d (3.8)99.4 L, S
CH-1(Glc)5.44d (3.8)93.2
InulinCH-1 (Glc)5.44 * 93.5L, S
CH-3 (Fru)4.27 77.8
CH-4 (Fru)4.10 75.3
chiro-InositolCH-1,64.05 72.7L, S
CH-2,53.76 71.4
CH-3,43.59 * 73.8
myo-InositolCH-2,53.54 72.4L, SL, S, F
CH-14.08 73.2
CH-3,63.63 73.5
CH-43.29 * 75.3
scyllo-InositolCH-1,2,3,4,5,63.36 *s74.6L, S
Glucosinolates
GlucoiberinCH-1′ (Gluc)5.08 *d (9.8)82.7 L
CH-2′3.47 72.9
CH-3′3.58 78.1
CH-4′3.47 70.2
CH-5′3.60 81.2
CH2-6a′,6b′3.92; 3.73 61.7
S-CH32.74s37.7
α-CH23.05; 2.99 52.5
β-CH22.21 20.7
γ-CH22.95 31.9
C=N- 163.6
GlucobrassicinCH-1′ (Gluc)4.84 82.4 L
CH-2′3.31 72.8
CH-3′3.23 77.9
CH-4′3.38 69.6
CH-5′2.96 80.9
CH2-6′3.59 61.2
CH2-1a, 1b4.28; 4.22 30.4
CH-2″ (Ind)7.37 125.2
CH-4″7.76 *d (8.0)119.5
CH-5″7.21 120.8
CH-6″7.28 123.2
CH-7″7.56 113.1
GlucoraphaninCH-1′ (Gluc)5.05d (9.8) L
S-CH32.72s
SinigrinCH-1′ (Gluc)5.07d (9.8) L
Miscellaneous
Chlorogenic acid (5-caffeoylquinic acid)2,2′-CH22.19; 2.02 39.5L, S
6,6′-CH22.14; 2.06 38.4
CH-34.26 71.7
CH-43.88 73.9
CH-55.32 * 72.2
CH-2′7.18d (1.6)116.1
CH-5′6.94d (8.3)117.5
CH-6′7.09dd (8.3; 1.6)123.7
CH-7′7.60d (15.9)147.2
CH-8′6.37d (15.9)115.6
Neochlorogenic acid (3-caffeoylquinic acid)2,2′-CH22.21; 2.09 S
6,6′-CH22.11; 1.93
CH-35.40 74.0
CH-43.76
CH-54.17
CH-2′7.23 116.1
CH-5′6.97 117.5
CH-6′7.14 123.7
CH-7′7.66d (16.0)147.2
CH-8′6.44d (16.0)115.6
Glycine betaineN(CH3)33.27 * 54.4L
CH23.91 67.3
EthanolamineCH2-NH23.15 * 42.2LL, S, F
CH2OH3.83 58.6
CholineN(CH3)33.21 *s54.9L, SL, S, F
CH2OH4.06 56.6
CH2N3.52 68.4
PhosphorylcholineN(CH3)33.23 *s55.0L, SL, S, F
CH2OPO34.15 62.2
CH2N3.61 67.4
GlycerophosphorylcholineN(CH3)33.24 *s55.1LL, S, F
CH2N 3.68 67.0
CH2OP4.33 60.5
CH2OP3.94; 3.89 67.5
CHOH3.92 71.6
CH2OH3.67; 3.6 63.1
TrigonellineCH34.44s49.3L, SL, F
CH-69.12
CH-4,28.84 *
CH-38.09 128.8
UridineCH-67.87d (8.2)143.0L, SL, S, F
CH-55.92 *d (8.2)103.4
CH-1′ (rib)5.93 *d (4.6)90.3
CH-2′ (rib)4.36 74.6
CH-3′ (rib)4.24 70.5
CH-4′ (rib)4.14 85.3
* Asterisks indicate signals used for the integration and quantification of metabolites.
Table 2. 1H- and 13C NMR data of sesquiterpene lactones in globe artichoke byproducts [CDCl3/CD3OD 2:1 v/v, 1H 600 MHz, 13C 150 MHz, ppm (J = Hz)]. Multiplicity: d = doublet; dd = doublet of doublets; ddd = doublet of doublets of doublets; dt = doublet of triplets; q = quartet; t = triplet.
PositionCynaropicrinDehydrocynaropicrinGrosheimin
1H13C1H13C1H13C
12.99 ddd
(10.2; 9.8; 7.2)
45.43.3040.93.2140.3
2a2.17 dt
(12.9; 7.1)
39.12.64 dd
(18.6; 8.4)
43.72.5843.7
2b1.74 ddd
(12.8;11.6; 8.6)
39.12.5843.72.5243.7
34.52 ddt
(8.5; 7.3; 2.2)
73.3-205.2-220.8
4-152.3- 2.3447.5
52.8751.33.3549.42.3551.3
64.31 dd
(10.6; 9.0)
79.44.18 dd
(9.9; 8.9)
80.44.03 t (9.0)83.6
73.2547.73.5046.93.1149.6
85.14 dd
(5.1; 3.5)
74.55.1374.53.80 dd
(10.0; 6.1)
73.1
9a2.72 dd
(14.8; 5.2)
37.02.92 dd(
13.4; 5.7)
41.52.8548.5
9b2.41 dd
(14.8; 3.6)
37.02.3841.52.2948.5
10-142.2- -144.2
12-170.2-170.0-171.1
13a6.20 d
(3.5)
122.96.30 d
(3.3)
125.06.37 dd
(2.8; 1.2)
126.0
13b5.67 * d
(3.3)
122.95.85 * d
(3.0)
125.06.33 * dd
(3.3; 1.2)
126.0
14a5.16118.25.09115.25.07115.2
14b4.94 d
(1.5)
118.24.77115.24.78115.2
15a5.47 t
(1.8)
113.06.28 dd
(2.4; 0.6)
123.61.2614.9
15b5.38 t
(2.3)
113.05.89 dd
(2.2; 0.6)
123.6
1′-165.7-
2′-140.2-
3′a6.35 q
(1.2)
126.06.37126.3
3′b6.01 q
(1.6)
126.06.04126.3
4′4.35 t
(1.3)
61.04.3661.0
* Asterisks indicate signals used for integration and quantification of metabolites.
Table 3. Metabolites identified in chloroform extracts of cauliflower and globe artichoke byproducts. Relative assignments of 1H and 13C NMR signals are reported. L = leaves; S = stalks; F = florets; d = doublet; dd = doublet of doublets; s = singlet; t = triplet.
MetaboliteAssignmentδ 1H (ppm)Multiplicityδ 13C (ppm)Globe ArtichokeCauliflower
Pheophytin aCH-109.54s105.0LL
CH-59.39 *s97.8
CH-208.59s93.7
CH-318.01dd (17.7; 11.5)129.3
CH2-326.32; 6.22dd (17.7; 1.1) dd (11.5; 1.2)123.5
CH-P24.89 118.0
CH-184.48 50.5
CH-174.12 52.0
CH3-1343.91s53.1
CH2-813.70 19.7
CH3-1811.82d (7.6)23.4
CH3-821.71t (7.9)17.6
Pheophytin bCH-7111.19s LL
CH-59.98 *s
CH-109.65s
CH-317.93dd (17.8; 11.5)
CH2-326.24; 6.02
SqualeneCH3 -a1.69 25.3L, SL, F
CH3 -b1.61 16.2
CH -c5.12 * 124.6
CH2-d1.99 40.2
CH2-e2.07 26.8
Linolenic acid chainsCH2-22.32 34.6L, SL, S, F
CH2-31.63 25.3
CH2-4-71.32
CH2-82.06 27.5
CH-95.38 130.3
CH2-11,142.81 *t (6.1)25.9
CH-10, 12,135.36 128.5
CH-155.31 127.4
CH-165.39 132.2
CH2-172.09 20.9
CH3-180.98t (7.6)14.5
Linoleic acid chainsCH2-22.32 34.6L, SL, S, F
CH2-31.63 25.3
CH2-4–71.32
CH2-8,142.06 27.5
CH-9,135.37 130.5
CH-10,125.35 128.4
CH2-112.78 *t (6.7)25.8
CH3-180.90t (7.6)14.3
Phosphatidylcholine(CH3)3N3.23 54.5L, SL, F, S
CH2OP4.44 61.9
CH2 sn14.39; 4.17 63.1
CH sn25.26 70.8
CH2 sn34.14 65.4
PhosphatidylethanolamineCH2NH23.16 40.8 S, F
CH2OP4.10 62.1
DigalactosyldiacylglycerolCH-1′4.23 104.3L, SL, F, S
CH-2′3.53 71.7
CH-3′3.51 73.8
CH-4′3.92 68.5
CH-1″4.91 * 99.7
CH-3″,5″3.74 70.6
CH-4″3.96 70.2
CH2-6″3.82; 3.74 61.8
CH2 sn33.95; 3.72 68.5
CH2 sn14.39; 4.17 63.1
β-SitosterolCH2-11.85; 1.07 37.6L, SL, F, S
CH2-21.82 31.4
CH-33.54 71.6
CH2-42.25 42.1
CH-65.34 121.8
CH-81.47 32.2
CH-90.94 50.6
CH2-111.51 21.4
CH2-122.00; 1.17 40.0
CH-141.01 57.1
CH2-161.86 28.4
CH-171.13 56.4
CH3-180.70 * 12.1
CH3-191.02 19.5
CH-201.35 36.5
CH3-210.94 18.9
CH2-231.19 26.4
CH-240.95 46.1
CampesterolCH3-180.70 * 12.0L, SL, F, S
StigmasterolCH3-180.72 * 11.9L, S
* Asterisks indicate signals used for integration and quantification of metabolites.
Table 4. Metabolite content (in mg/g DW) in aqueous extracts of cauliflower and globe artichoke byproducts.
MetaboliteGlobe ArtichokeCauliflower
LSLSF
Mean ± SDMean ± SDMean ± SDMean ± SDMean ± SD
Amino acids
Alanine0.30 ± 0.017 a0.29 ± 0.015 a4.72 ± 0.22 a1.96 ± 0.02 b7.01 ± 0.05 c
Arginine 5.23 ± 0.22 3.90 ± 0.45
Asparagine14.48 ± 1.45 a2.59 ± 0.43 b4.04 ± 0.27 a2.78 ± 0.05 b6.83 ± 0.13 c
Aspartate1.11 ± 0.19 a0.28 ± 0.036 b2.41 ± 0.23 a2.66 ± 0.30 a6.03 ± 0.14 b
GABA 4.27 ± 0.14 a1.18 ± 0.12 b4.68 ± 0.20 c
Glutamate1.41 ± 0.12 a0.55 ± 0.058 b2.76 ± 0.09 a1.97 ± 0.17 b3.86 ± 0.07 c
Glutamine1.52 ± 0.065 a0.70 ± 0.264 b9.78 ± 0.64 a12.19 ± 0.45 b37.63 ± 0.54 c
Histidine0.27 ± 0.093 a0.039 ± 0.011 b1.06 ± 0.02 a0.21 ± 0.019 b1.09 ± 0.01 a
Isoleucine0.12 ± 0.013 a0.058 ± 0.0061 b1.23 ± 0.04 a0.32 ± 0.024 b1.17 ± 0.03 a
Leucine0.20 ± 0.009 a0.064 ± 0.0092 b1.46 ± 0.08 a0.19 ± 0.008 b0.58 ± 0.005 c
Lysine 1.41 ± 0.08 0.41 ± 0.013
Methiin 4.83 ± 0.04 a4.95 ± 0.27 a20.71 ± 0.24 b
Phenylalanine1.32 ± 0.071 a0.17 ± 0.013 b2.24 ± 0.10 a0.23 ± 0.012 b0.84 ± 0.016 c
Threonine0.49 ± 0.030 a0.14 ± 0.012 b2.37 ± 0.11 a1.19 ± 0.09 b1.76 ± 0.09 c
Tryptophan0.56 ± 0.028 0.66 ± 0.05 a0.12 ± 0.012 b0.26 ± 0.004 c
Tyrosine 1.20 ± 0.08 a0.14 ± 0.010 b0.37 ± 0.007 c
Valine0.50 ± 0.018 a0.15 ± 0.020 b3.09 ± 0.01 a1.01 ± 0.021 b3.94 ± 0.03 c
Organic acids
Acetic acid0.14 ± 0.049 a0.061 ± 0.011 a2.68 ± 0.209 a0.10 ± 0.031 b0.36 ± 0.032 b
Citric acid5.30 ± 0.192 a0.58 ± 0.026 b5.80 ± 0.03 a6.67 ± 0.06 b5.95 ± 0.27 a
Formic acid0.034 ± 0.009 a0.032 ± 0.006 a0.051 ± 0.006 a0.029 ± 0.011 b0.027 ± 0.001 b
Fumaric acid0.082 ± 0.011 a0.051 ± 0.010 b0.045 ± 0.002 a0.082 ± 0.024 b1.04 ± 0.005 c
Lactic acid 0.34 ± 0.0850.73 ± 0.086 a0.040 ± 0.009 b0.065 ± 0.011 b
Malic acid7.48 ± 0.54 a8.32 ± 0.77 a3.32 ± 0.24 a12.90 ± 0.18 b24.72 ± 0.14 c
Quinic acid6.51 ± 0.57 a7.61 ± 0.26 b
Succinic acid1.97 ± 0.05 a1.15 ± 0.12 b2.87 ± 0.3810.505 ± 0.014
Carbohydrates, polyols
Fructose5.15 ± 1.07 a30.2 ± 0.35 b37.90 ± 4.33 a83.08 ± 2.23 b68.33 ± 0.39 c
Glucose24.8 ± 5.00 a203.5 ± 4.02 b61.07 ± 1.66 a196.8 ± 6.88 b70.72 ± 0.43 a
Inulin0.44 ± 0.026 a4.14 ± 0.65 b
Raffinose 0.69 ± 0.0323.09 ± 0.27
Sucrose5.87 ± 1.56 a29.47 ± 3.10 b6.68 ± 0.62 a27.32 ± 0.47 b21.22 ± 0.44 c
chiro-Inositol10.07 ± 2.69 a5.05 ± 0.33 b
myo-Inositol0.27 ± 0.013 a1.95 ± 0.15 b3.06 ± 0.202.61 ± 0.38
scyllo-Inositol1.78 ± 0.05 a0.57 ± 0.034 b
Miscellaneous
Glucoiberin 2.09 ± 0.138
Glucobrassicin 1.43 ± 0.078
Chlorogenic acid7.53 ± 0.41 a2.32 ± 0.26 b
Glycine betaine0.30 ± 0.029 a
Choline1.01 ± 0.09 a0.35 ± 0.005 b1.57 ± 0.077 a0.73 ± 0.022 b4.73 ± 0.06 c
Ethanolamine0.066 ± 0.010 a0.11 ± 0.010 b0.31 ± 0.017 a0.22 ± 0.015 b0.79 ± 0.012 c
Glycerophosphorylcholine0.090 ± 0.007 a 0.42 ± 0.059
Phosphorylcholine0.28 ± 0.039 a0.12 ± 0.005 b0.11 ± 0.016 a0.25 ± 0.024 b0.58 ± 0.029 c
Trigonelline0.30 ± 0.012 a0.064 ± 0.003 b 0.063 ± 0.003
Uridine0.13 ± 0.010 a0.057 ± 0.010 b0.373 ± 0.040 a0.14 ± 0.005 b0.55 ± 0.006 c
a,b,c The different superscript letters indicate the significant difference between mean values (p < 0.05) according to ANOVA.
Table 5. Metabolite content (in µmol/g DW) in organic extracts of cauliflower and globe artichoke byproducts. Sesquiterpene lactones content is reported in mg/g DW.
MetaboliteGlobe ArtichokeCauliflower
LSLSF
Mean ± SDMean ± SDMean ± SDMean ± SDMean ± SD
Sterols
β-Sitosterol + Campesterol7.53 ± 0.68 b4.43 ± 0.27 a9.07 ± 1.26 a7.14 ± 1.91 a25.53 ± 2.13 b
Stigmasterol2.56 ± 0.25 b1.26 ± 0.10 a
Fatty acids
Saturated + monounsaturated fatty chains65.1 ± 14.8 a73.3 ± 11.2 a61.5 ± 15.5 a52.5 ± 21.8 a109.3 ± 1.8 b
Linoleic fatty chains18.9 ± 1.5 b12.9 ± 0.4 a22.2 ± 3.6 b8.0 ± 1.5 a29.3 ± 2.4 c
Linolenic fatty chains58.0 ± 4.3 b8.2 ± 0.5 a76.7 ± 10.8 b17.2 ± 0.6 a104.7 ± 8.1 c
Miscellaneous
Digalactosyldiacylglycerol7.55 ± 0.63 b1.52 ± 0.14 a5.41 ± 0.72 c0.80 ± 0.19 a2.36 ± 0.26 b
Squalene9.07 ± 2.24 b1.35 ± 0.27 a6.83 ± 0.93 1.61 ± 0.15
Pheophytin a4.76 ± 0.97 4.68 ± 1.53
Pheophytin b1.30 ± 0.24 0.86 ± 0.14
Sesquiterpene lactones
Cynaropicrin27.5 ± 2.7 b2.47 ± 0.21 a
Dehydrocynaropicrin7.22 ± 0.92
Grosheimin10.8 ± 1.7 b1.00 ± 0.10 a
a,b,c The different superscript letters indicate the significant difference between mean values (p < 0.05) according to ANOVA.
Disclaimer/Publisher’s Note: The statements, opinions and data contained in all publications are solely those of the individual author(s) and contributor(s) and not of MDPI and/or the editor(s). MDPI and/or the editor(s) disclaim responsibility for any injury to people or property resulting from any ideas, methods, instructions or products referred to in the content.

