

H2S Sensors: Synthesis, Optical Properties, and Selected Biomedical Applications under Visible and NIR Light


Abstract
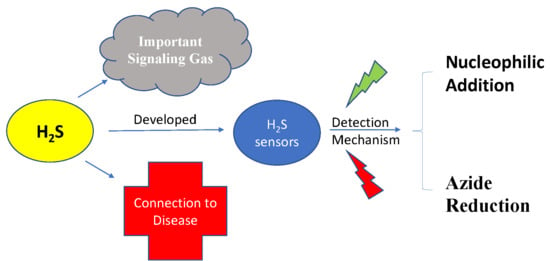
1. Introduction
2. Different Mechanisms of H2S Detection
2.1. Nucleophilic Addition to the Conjugated System for H2S Detection
2.1.1. Intramolecular Charge Transfer (ICT)
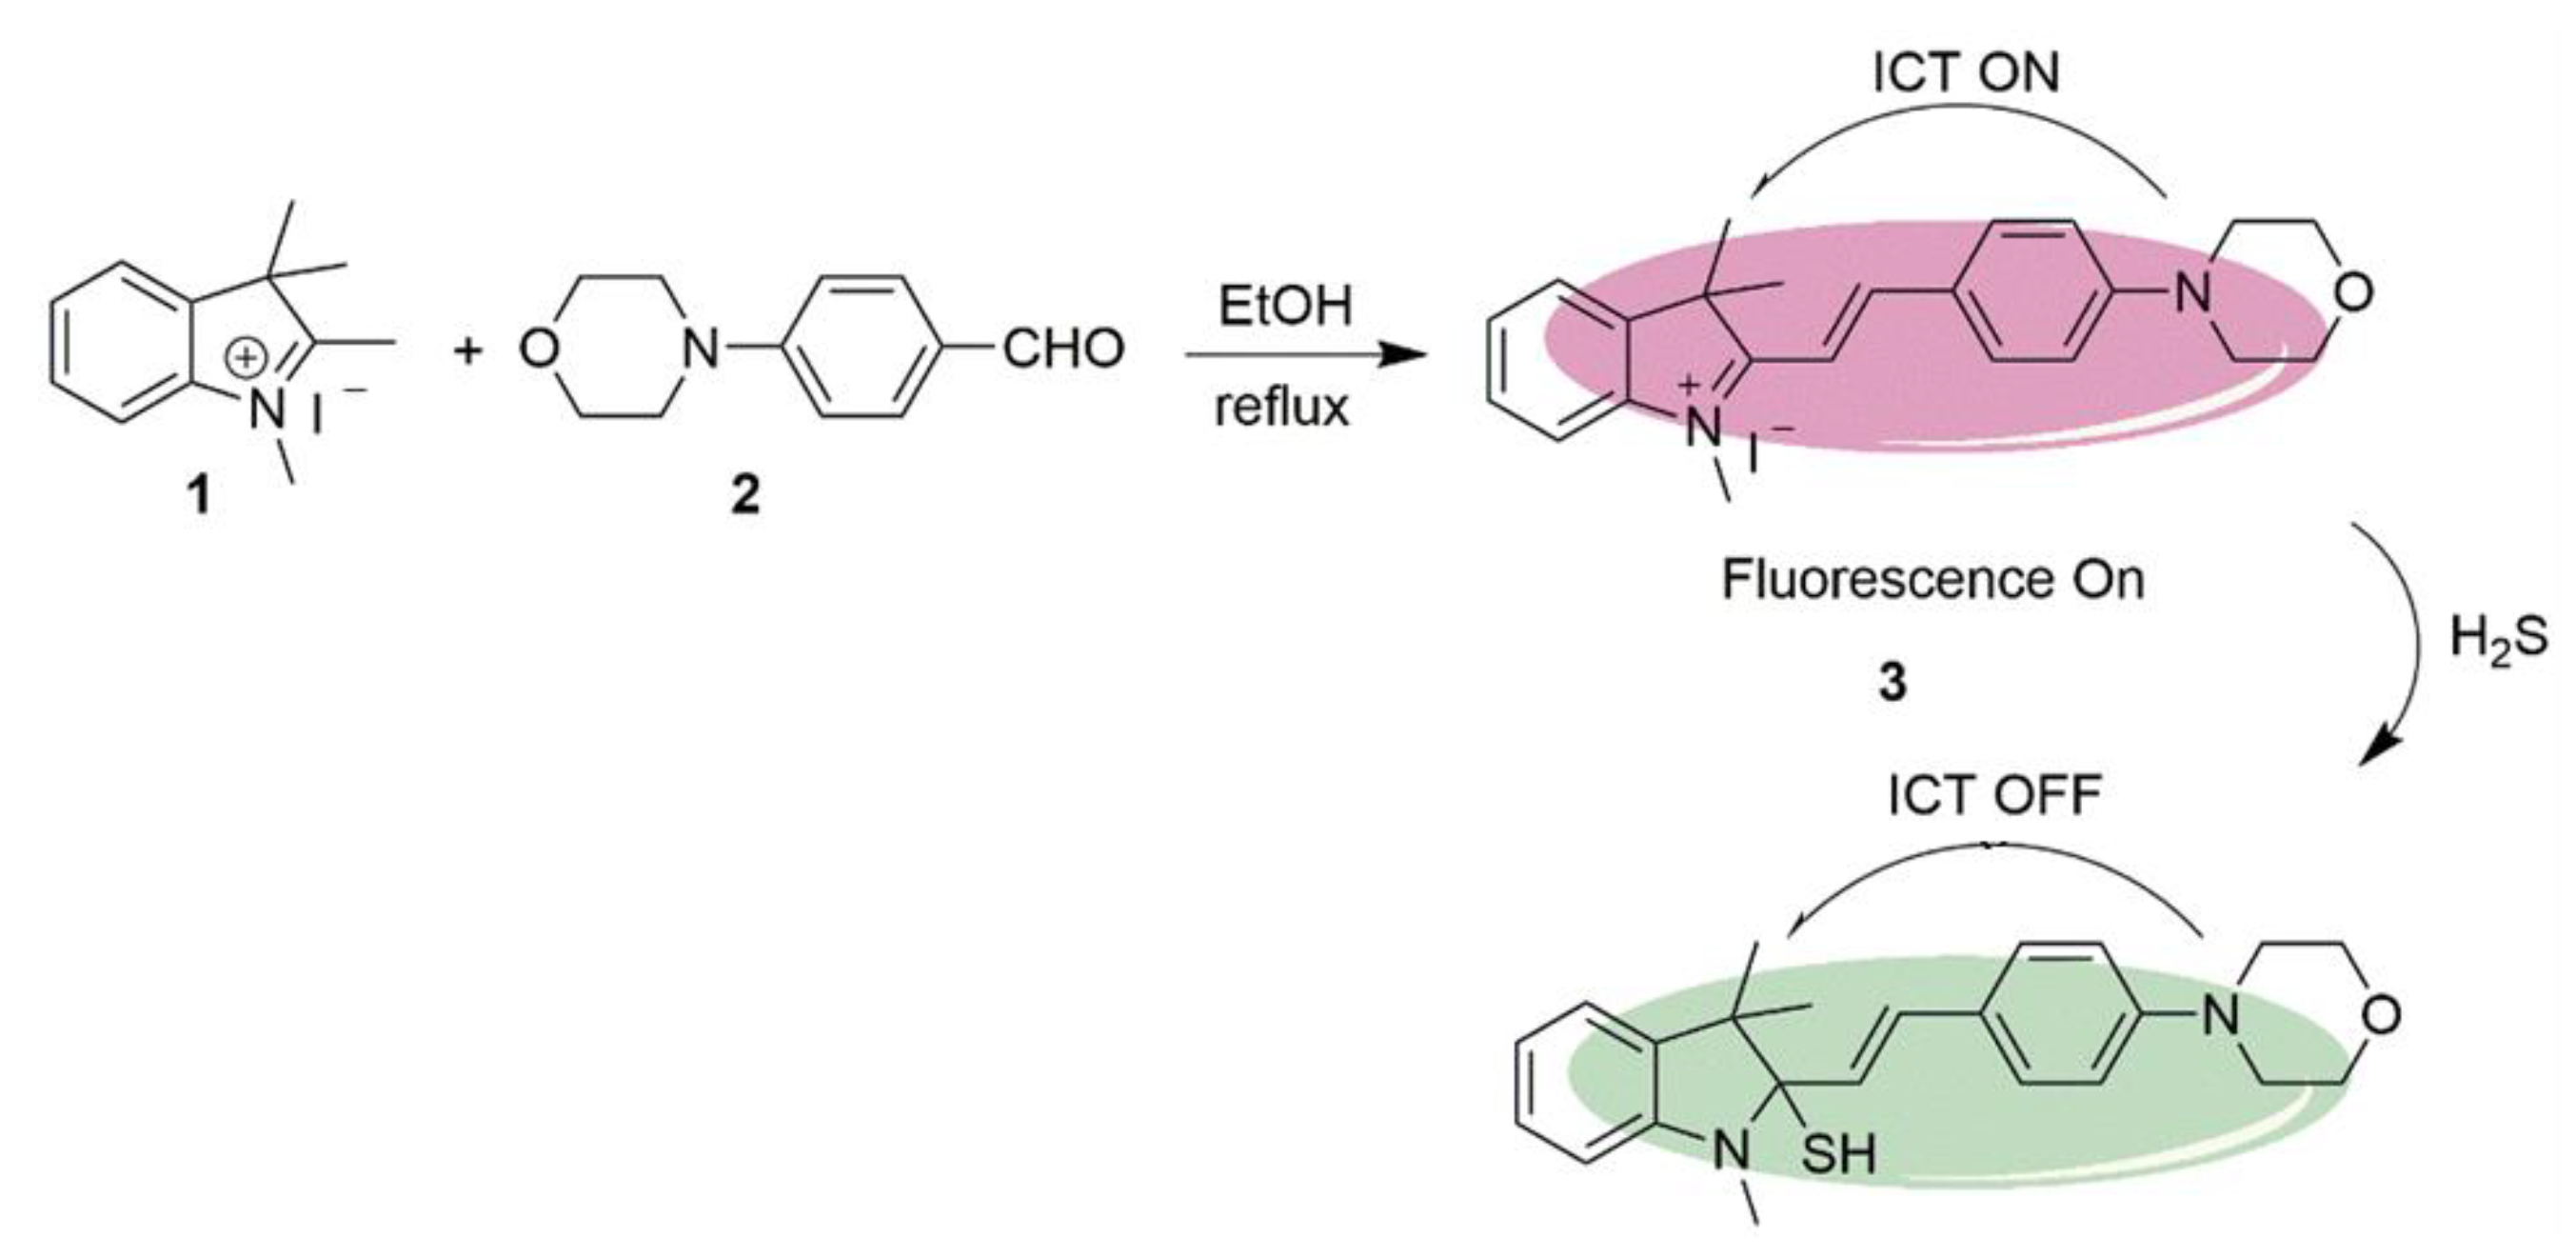
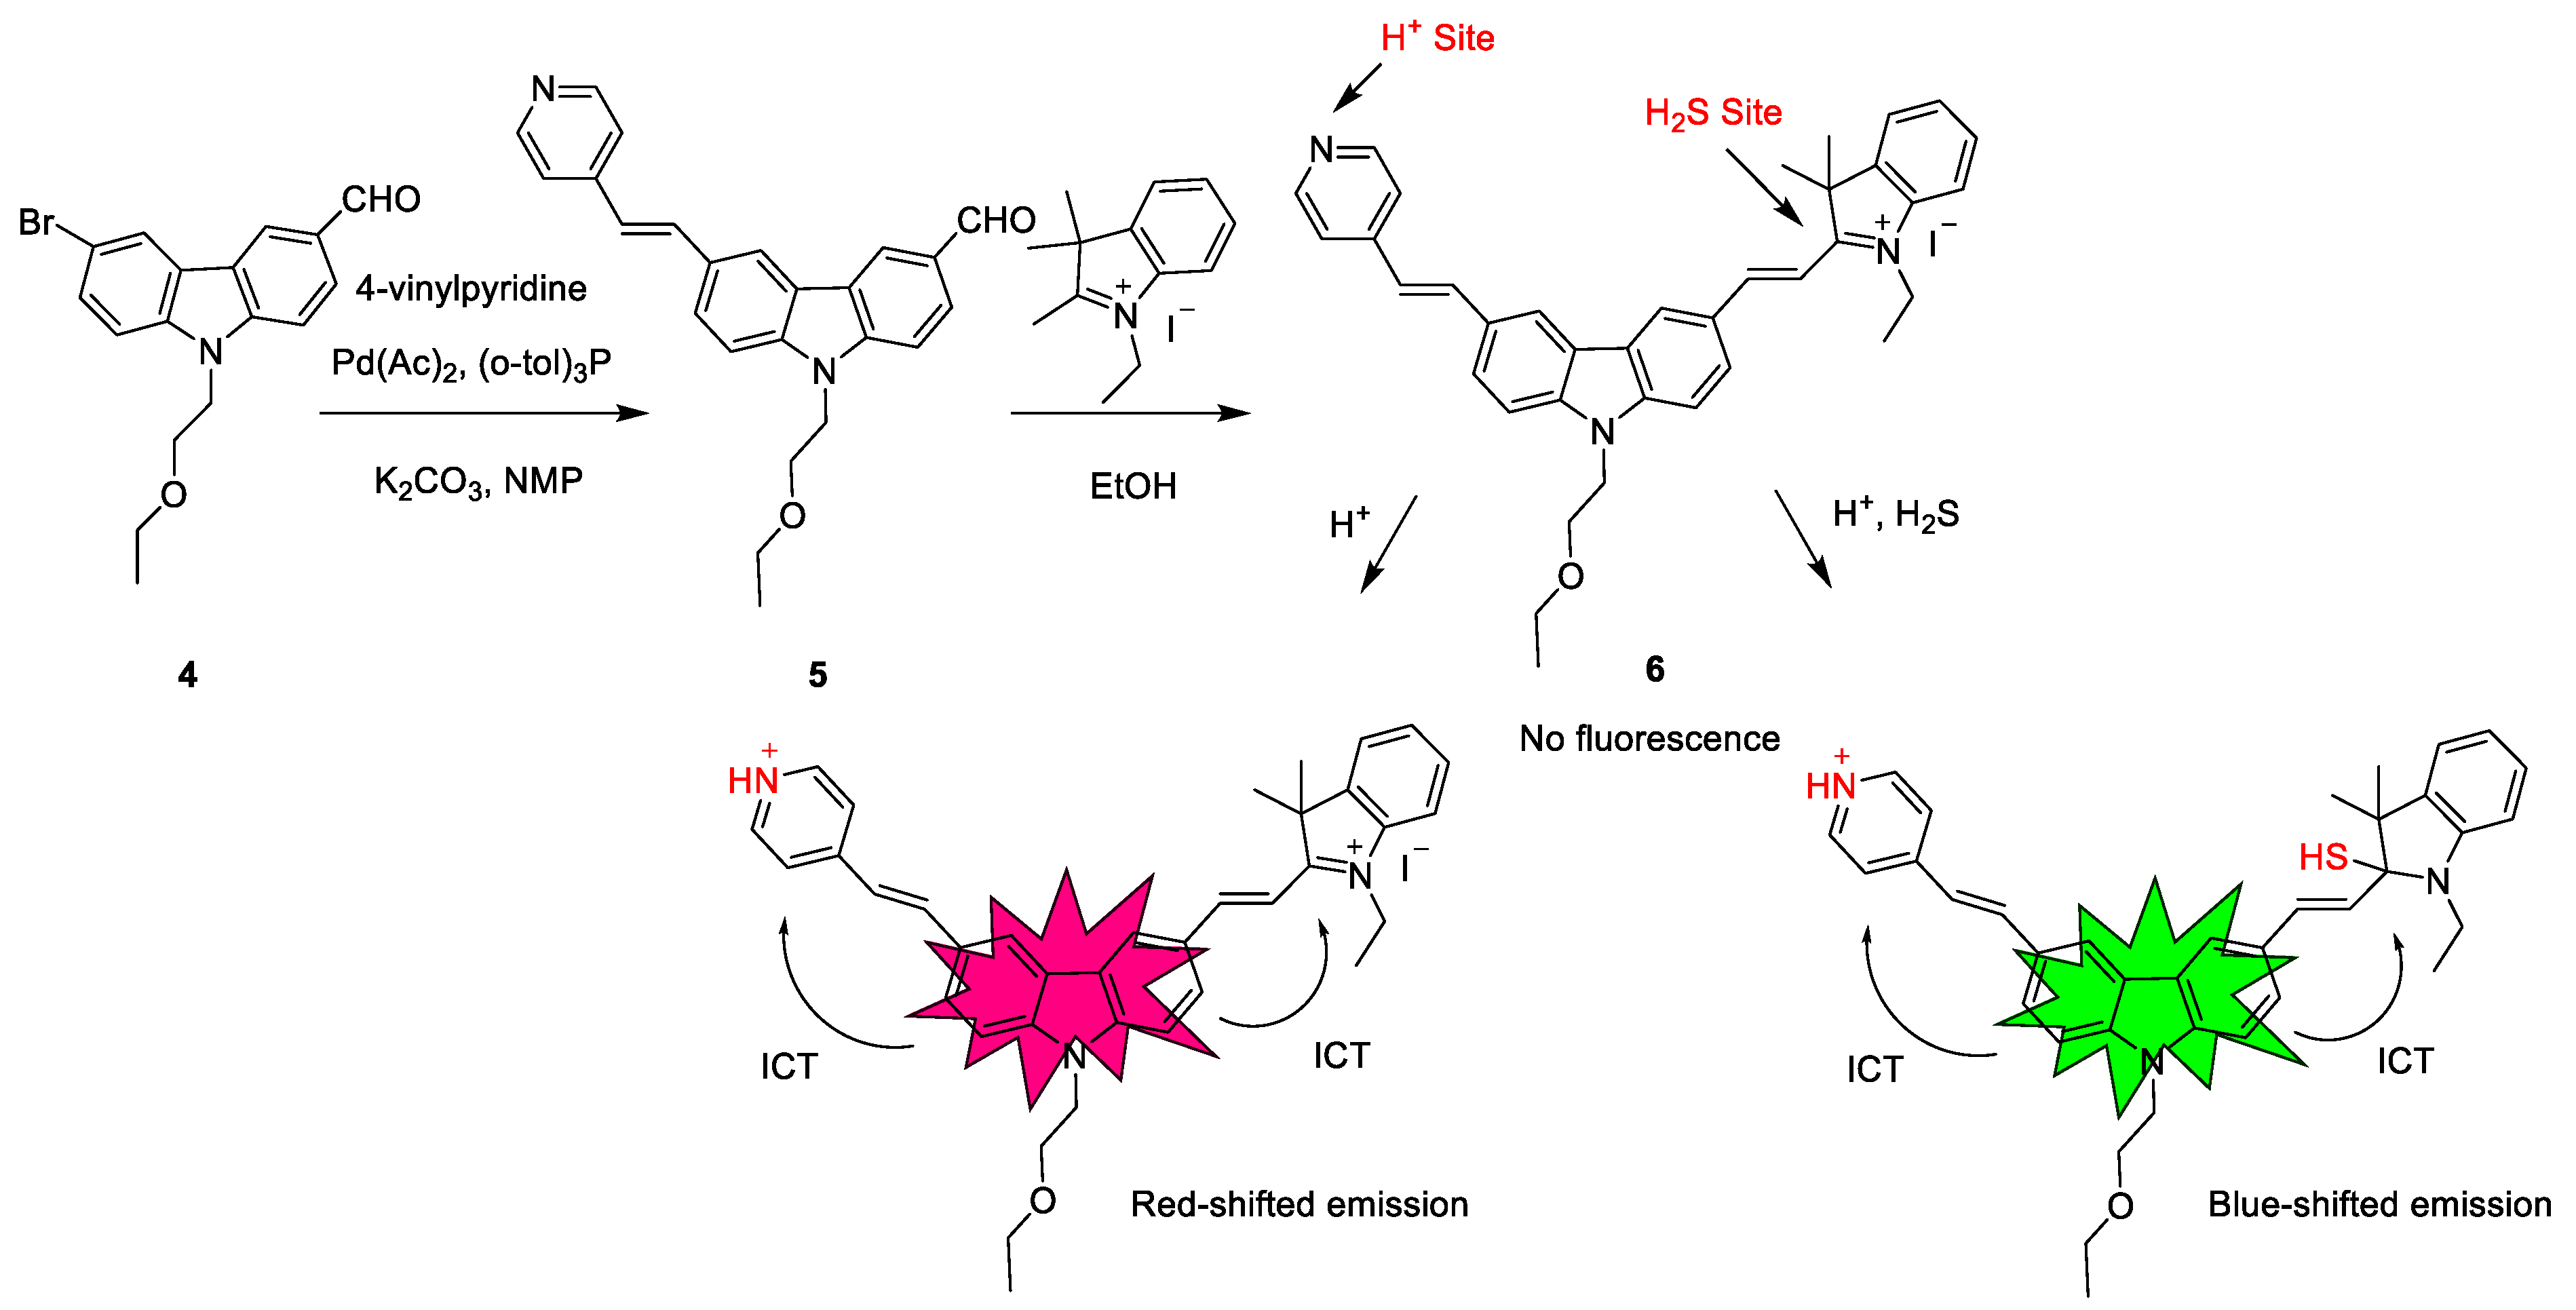
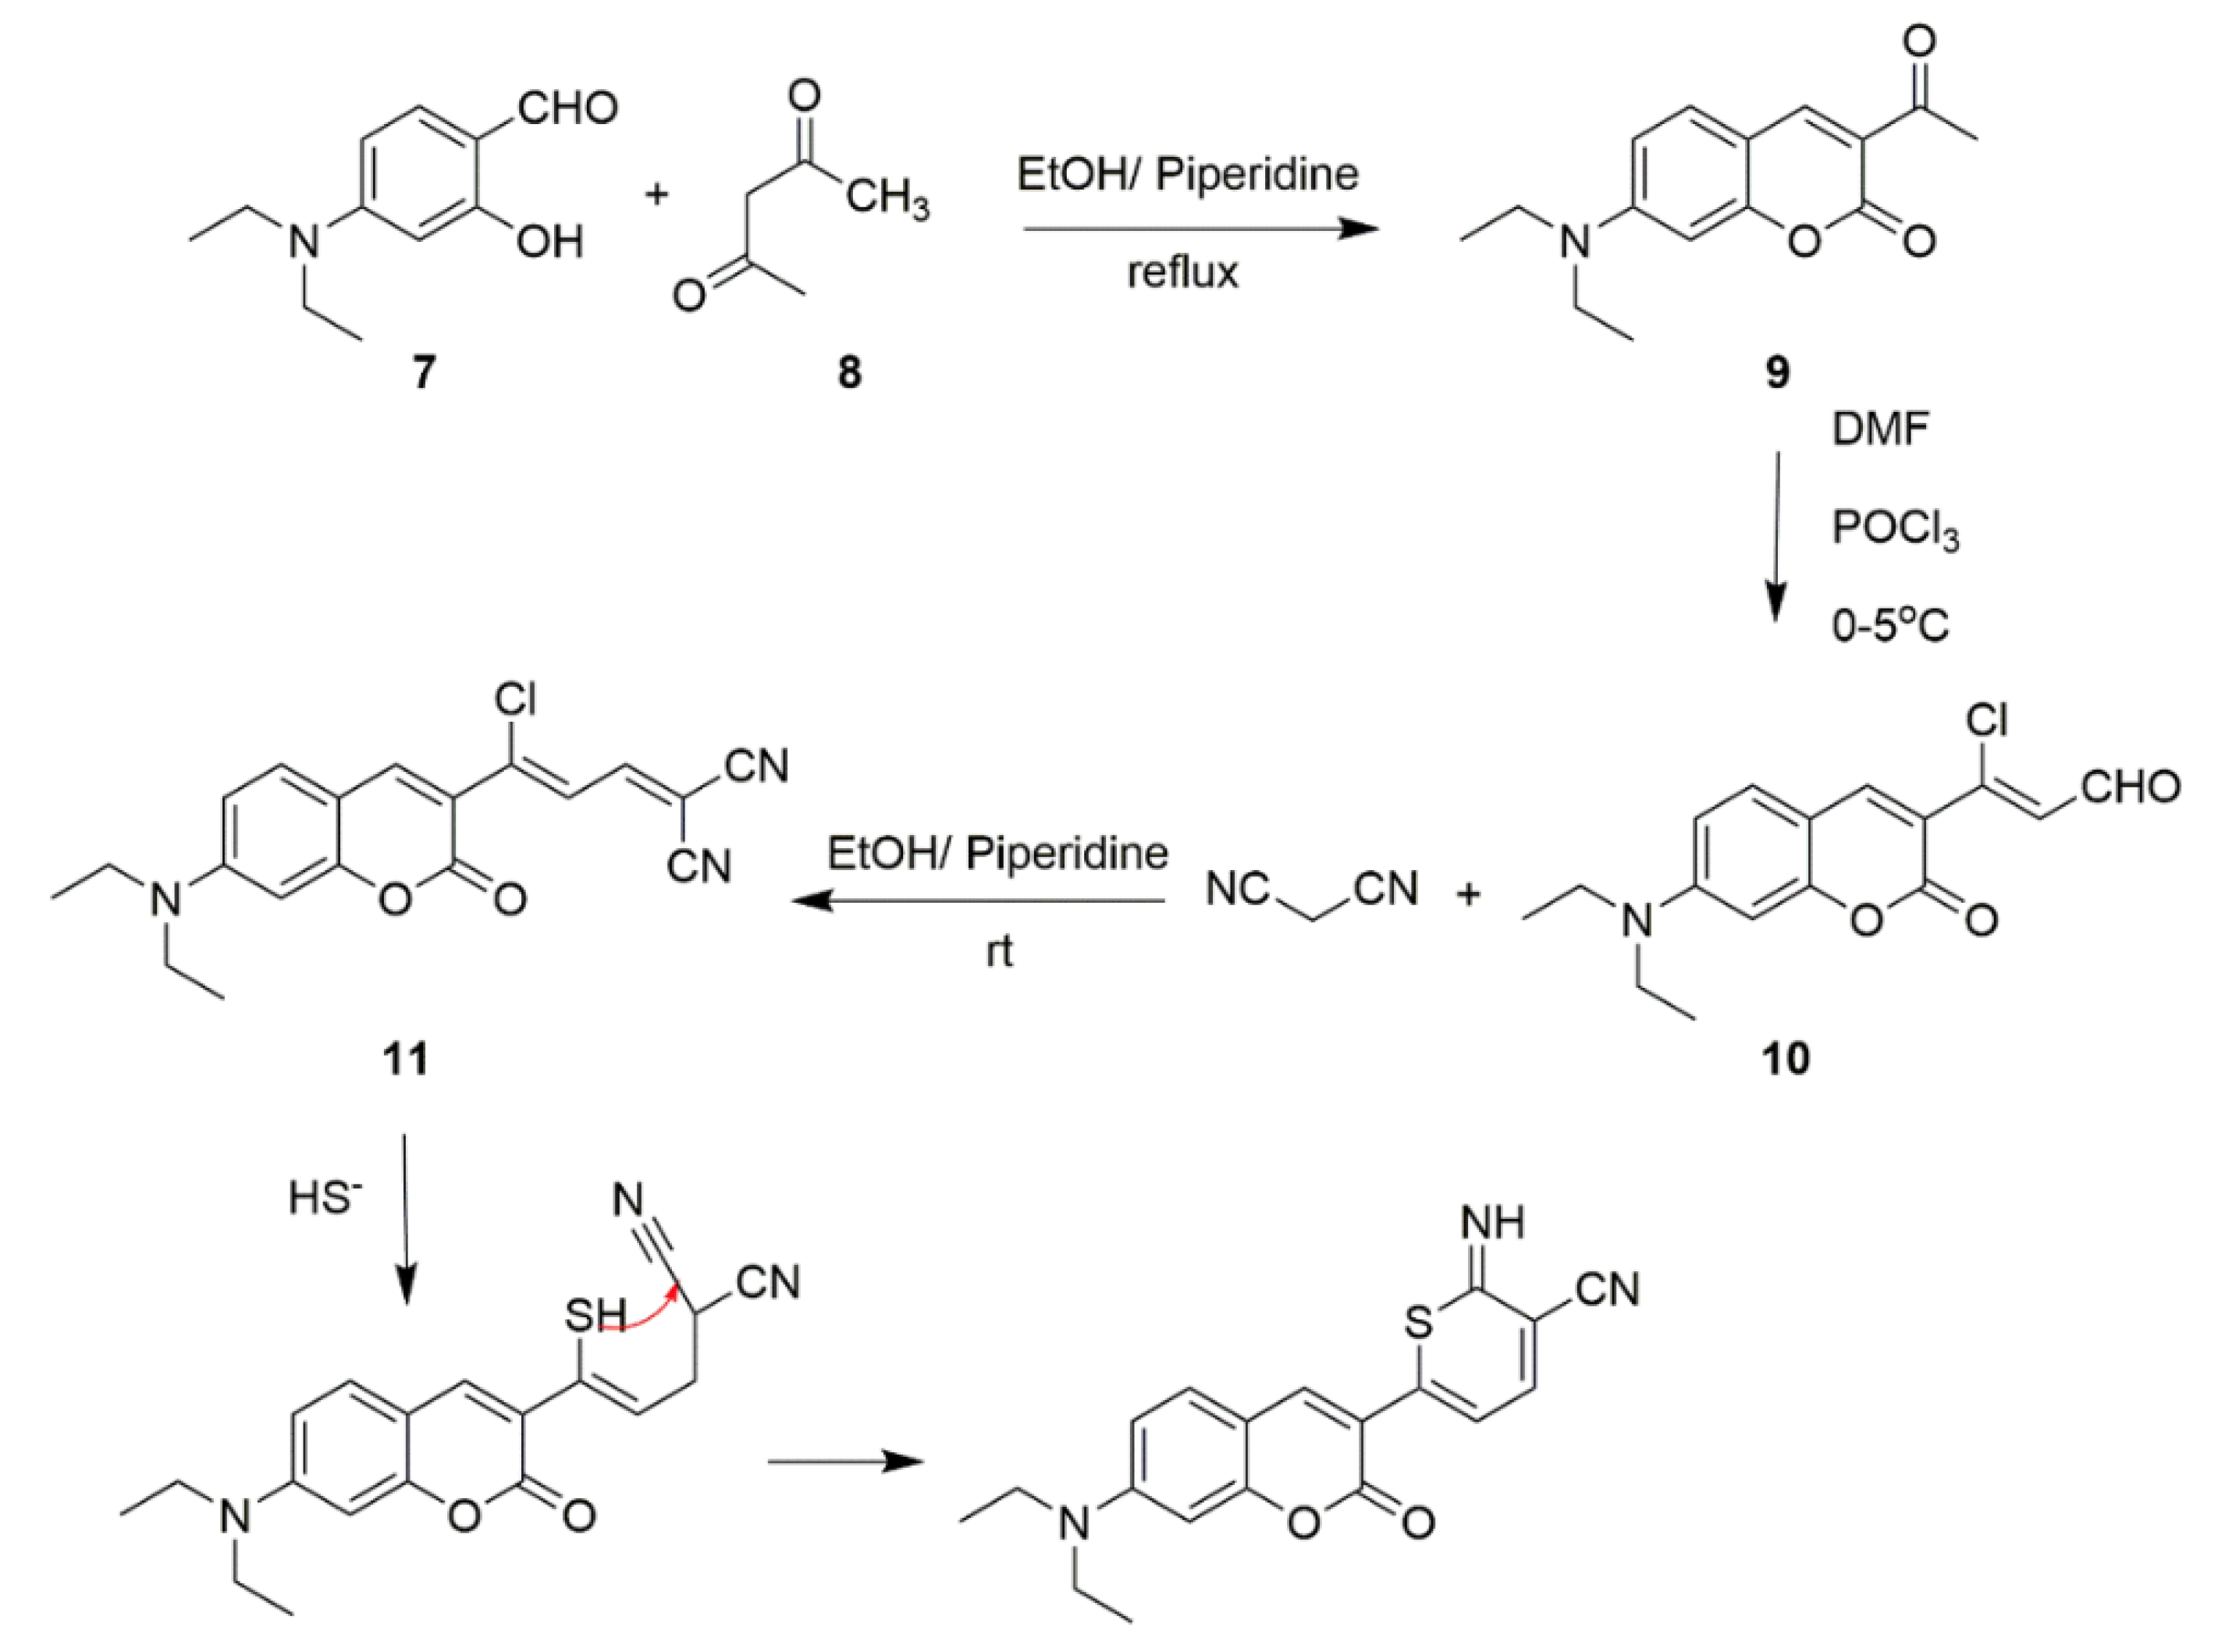
Synthesis and Mechanism of H2S Probes Based on ICT
Optical Properties of ICT H2S Probes
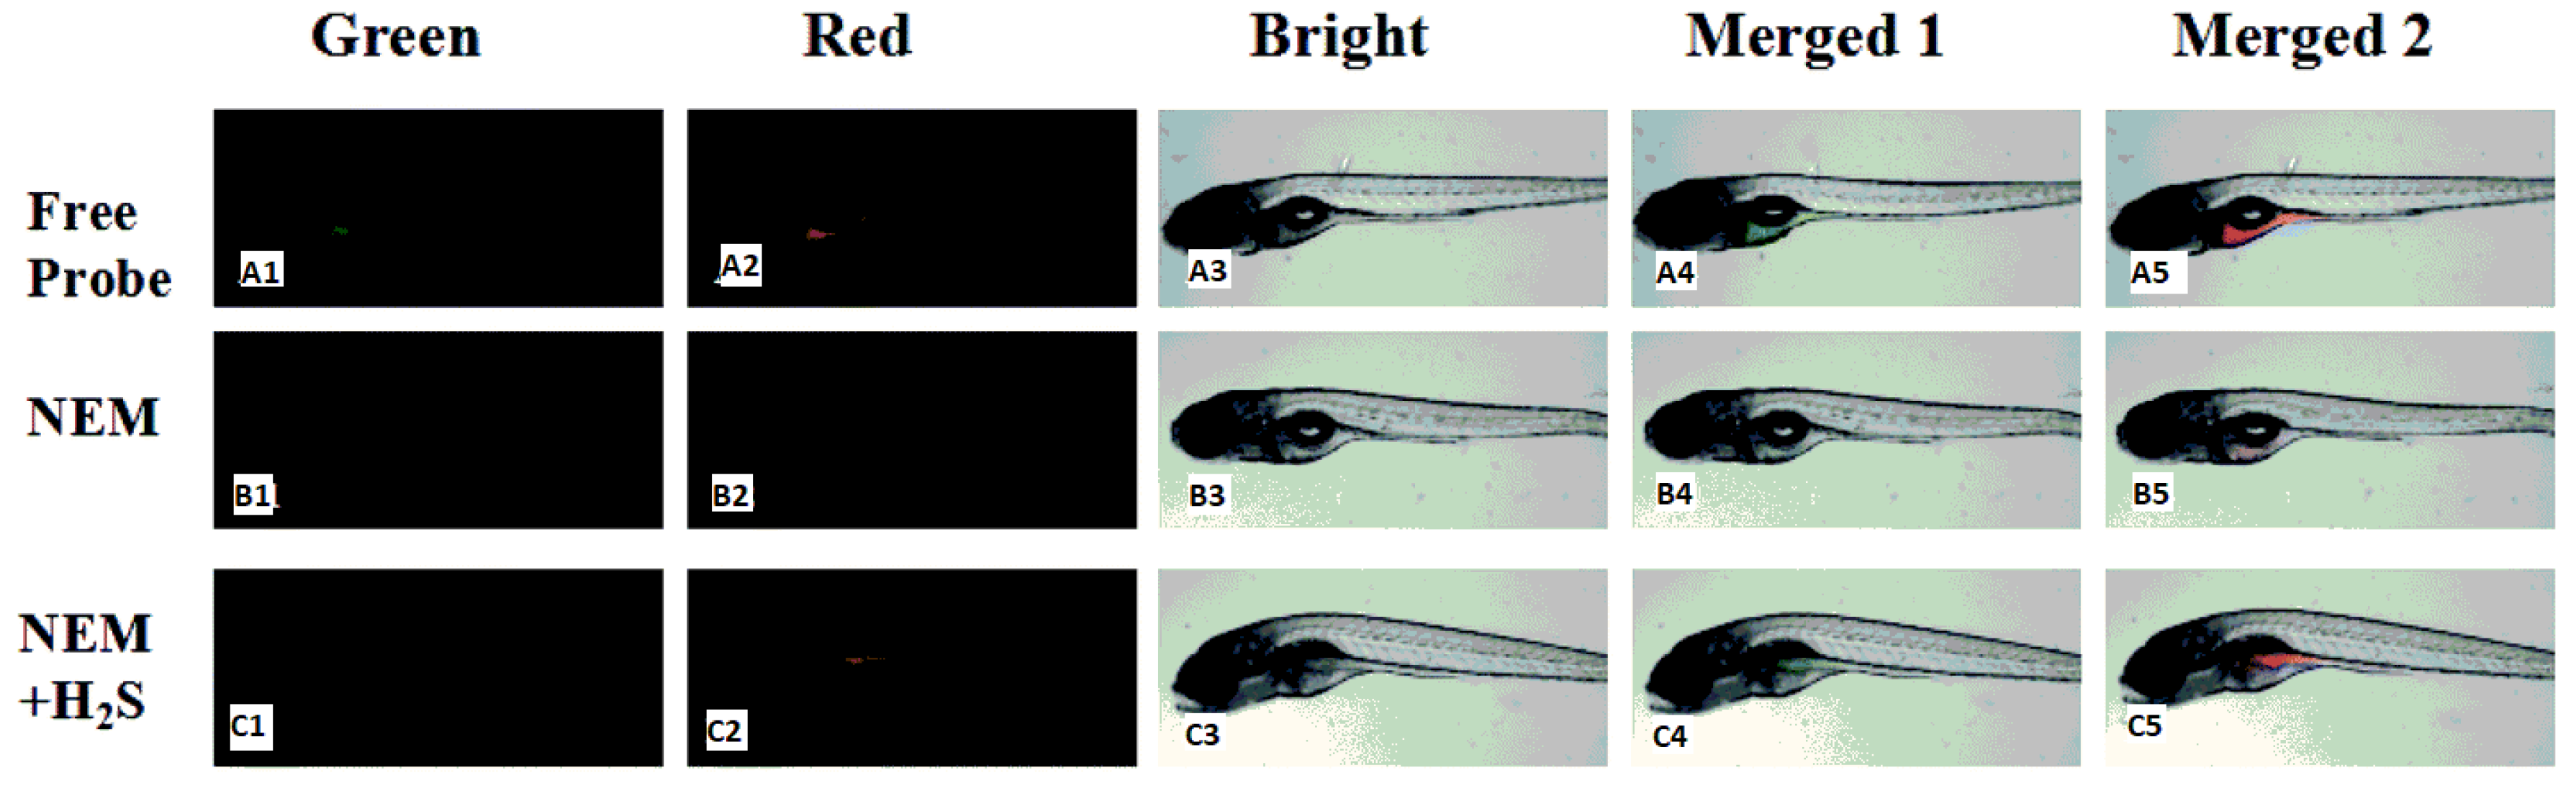
The Application of H2S Probes Based on ICT
2.1.2. Twisted Intramolecular Charge Transfer (TICT)
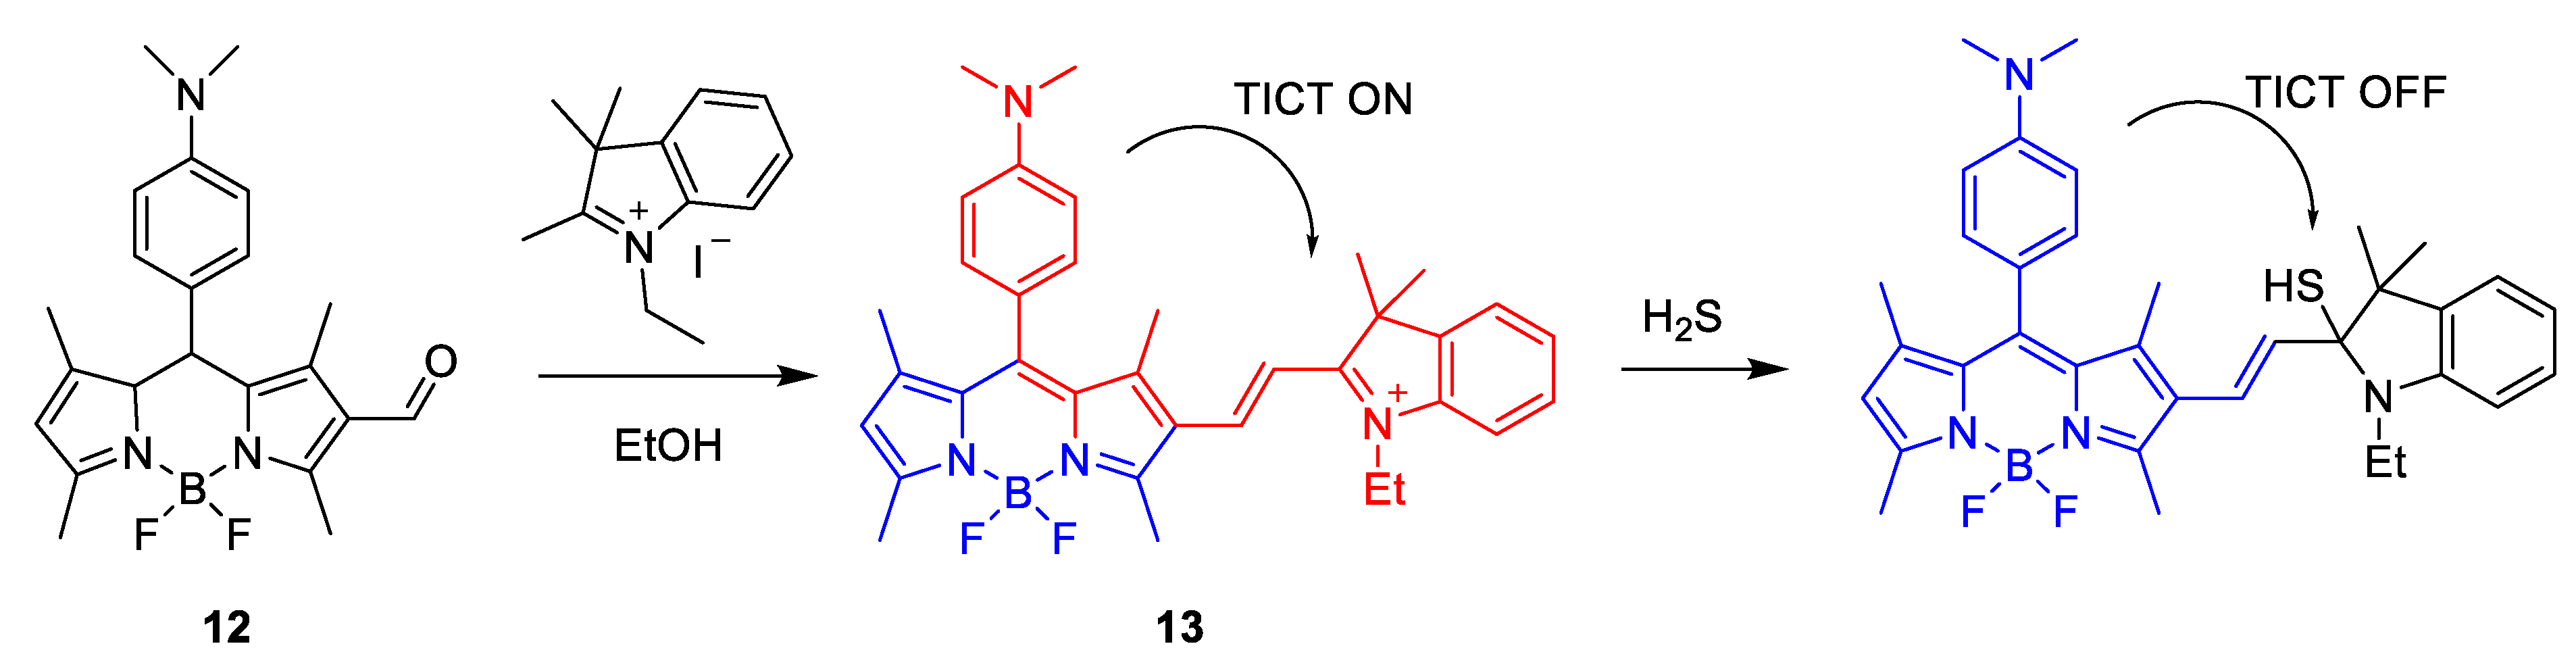
Synthesis and Mechanism of H2S Probes Based on TICT
Optical Properties of H2S Probes Based on TICT
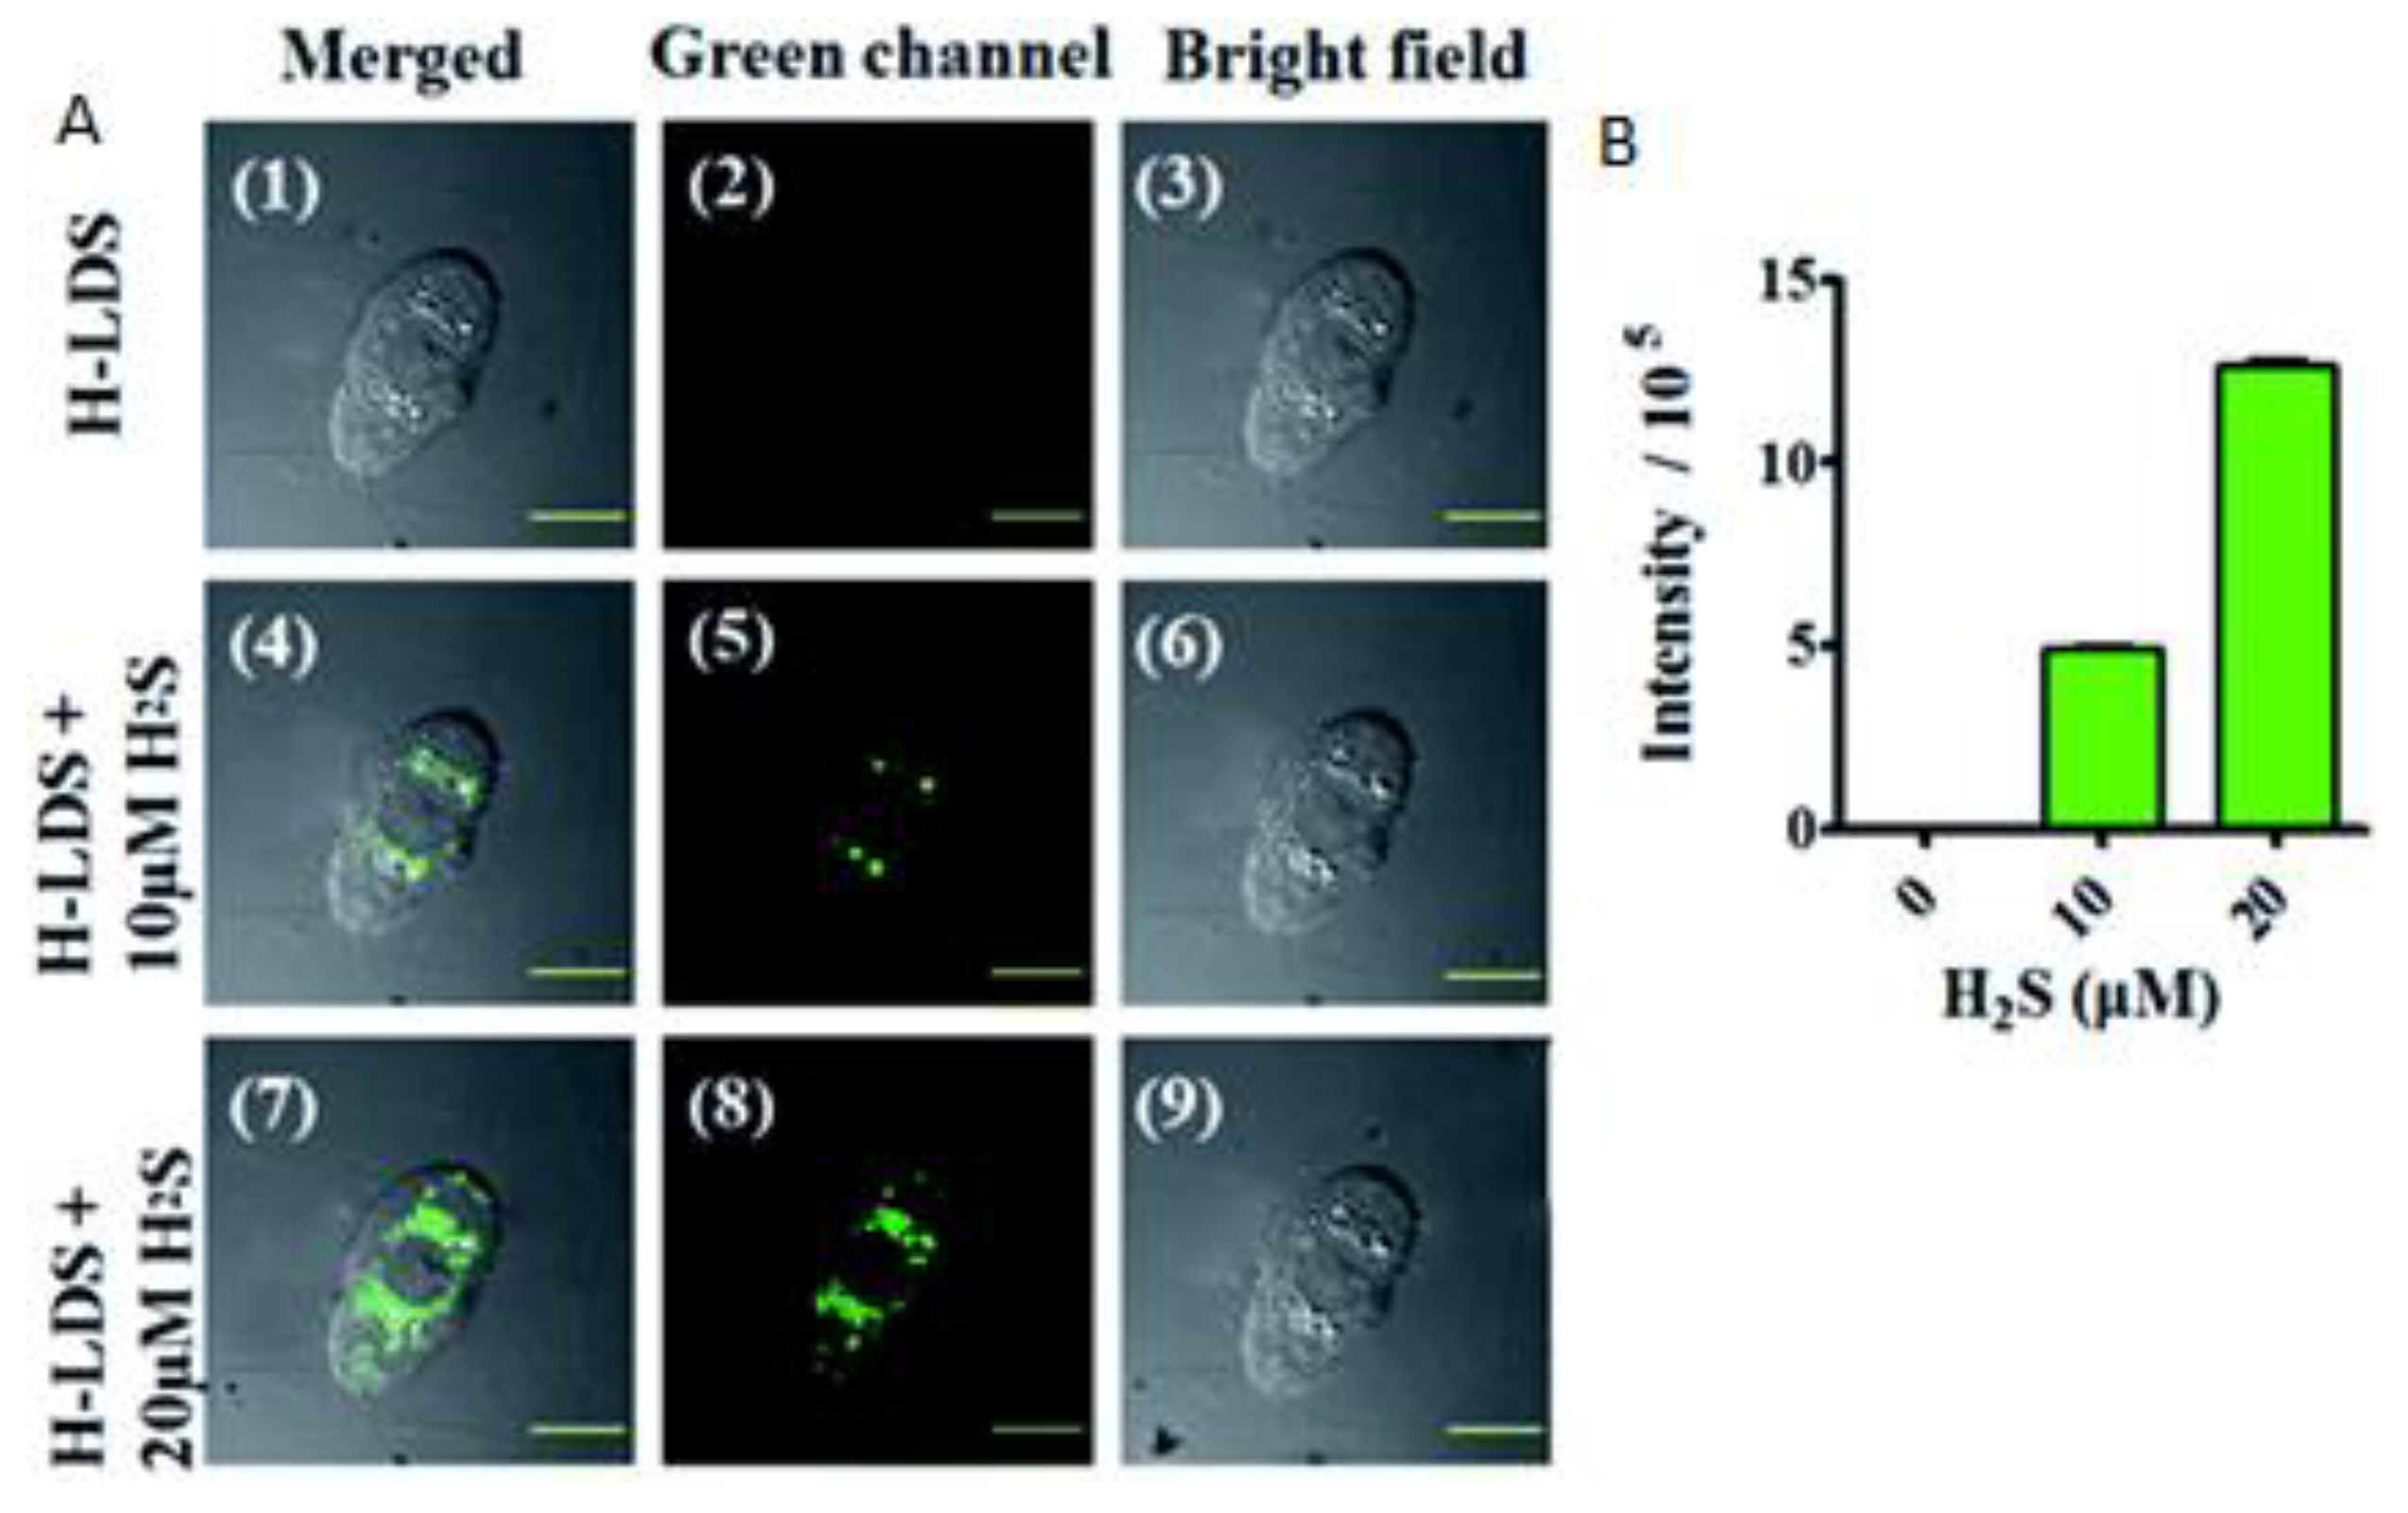
Applications of H2S Probes Based on TICT
2.1.3. Nucleophilic Addition Based on FRET
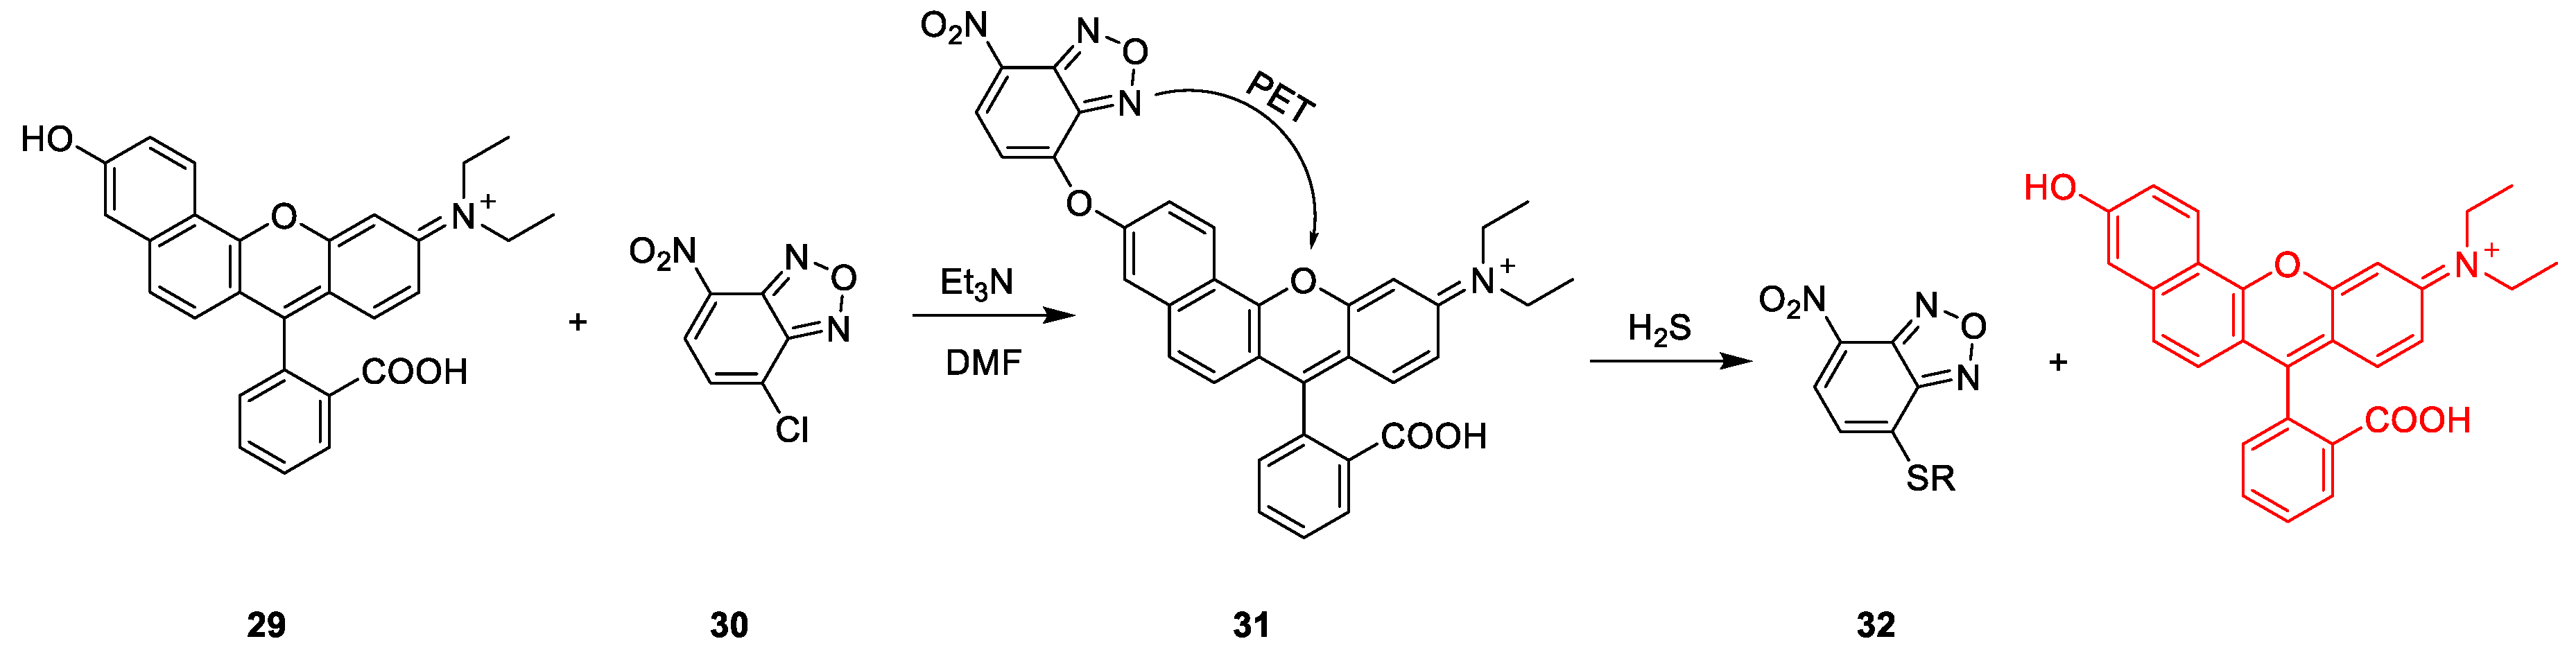
Synthesis of H2S Probes Based on FRET
Optical Properties of H2S Probes Based on FRET
The Application of H2S Based on FRET Probes
2.1.4. Photoinduced Electron Transfer (PET)
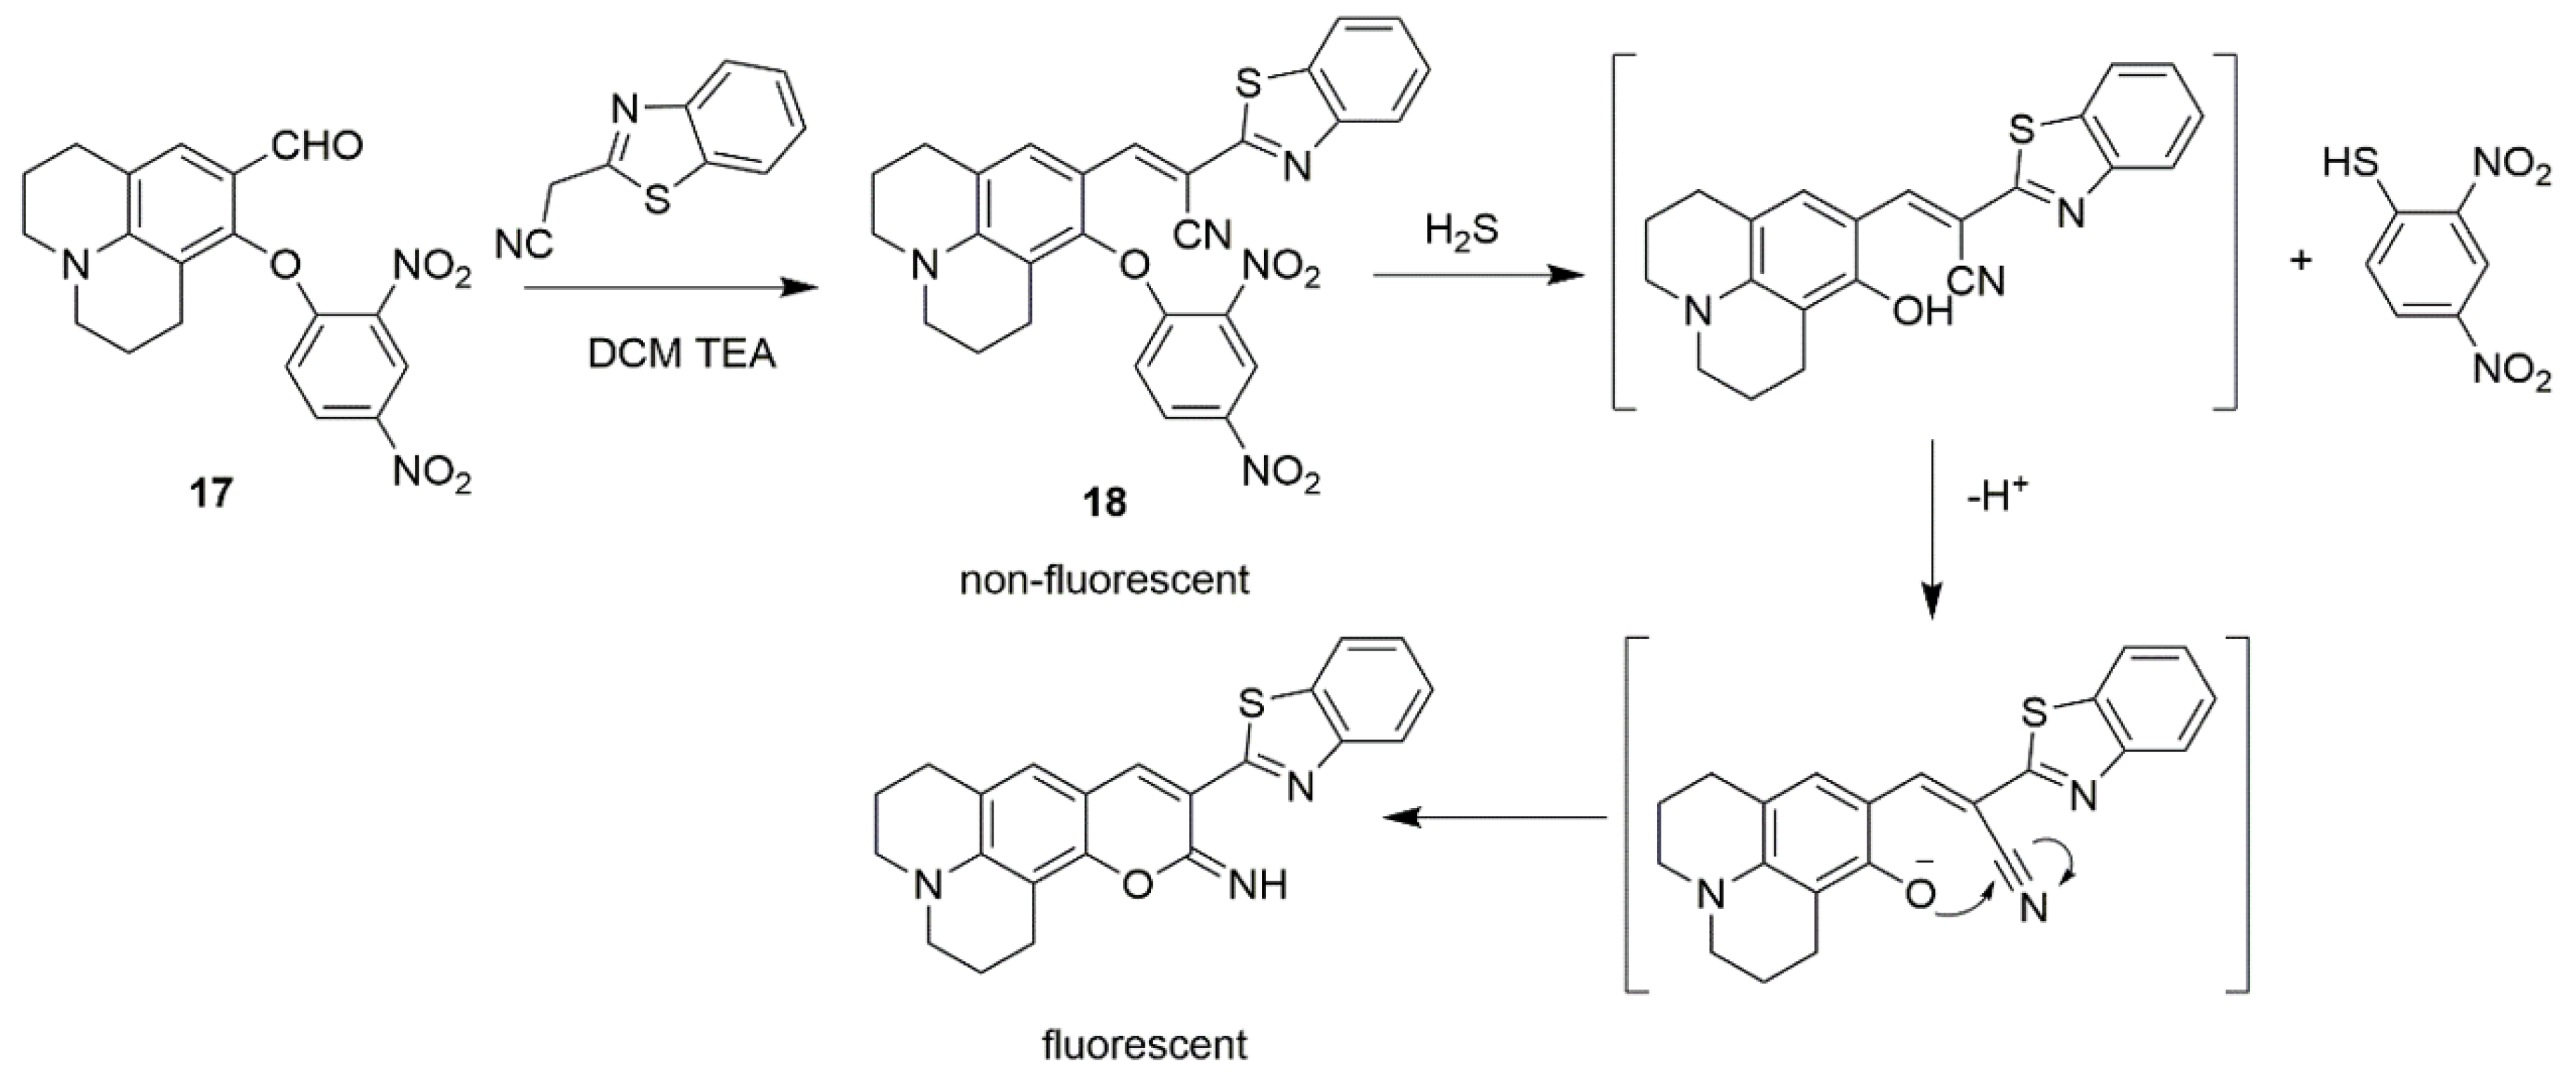
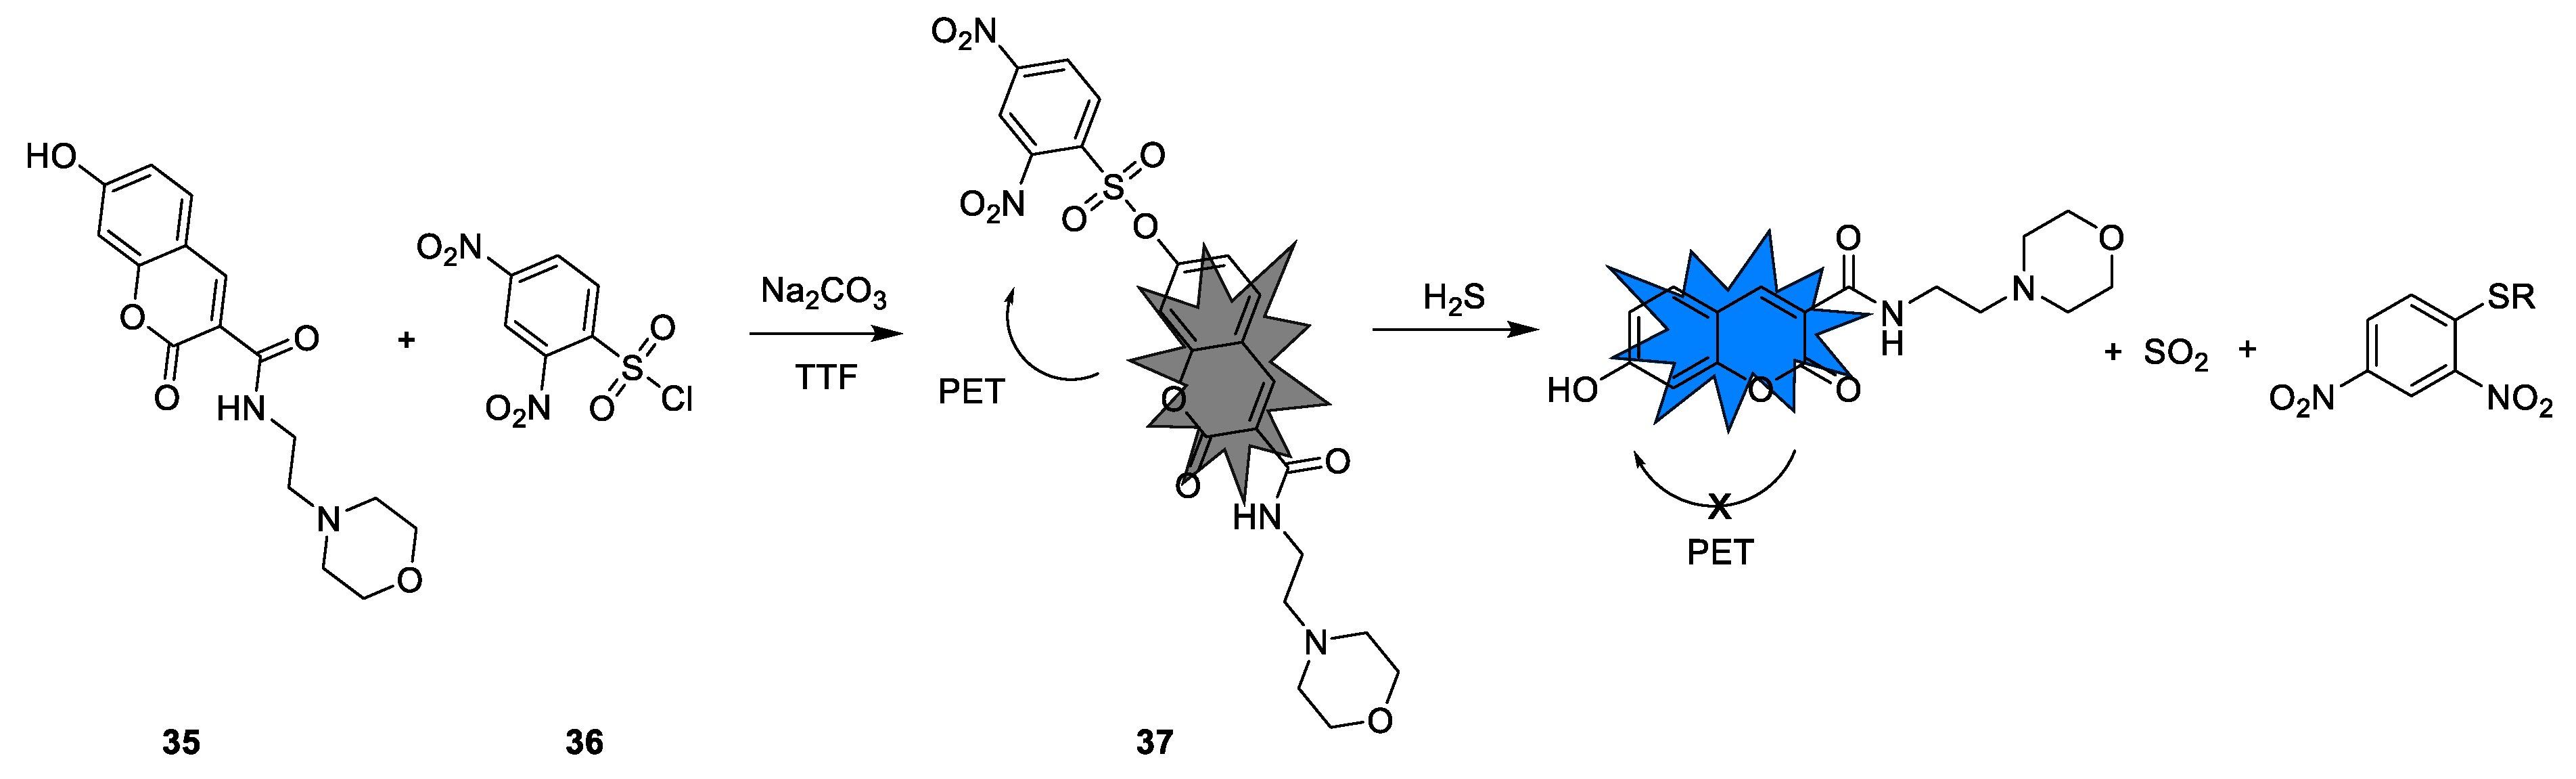
Synthesis and Mechanism of H2S Probes Based on PET
Optical Properties of H2S Based on PET Probes
Applications of H2S PET Probes
2.2. H2S Probes Based on Azide Group Reduction
2.2.1. Synthesis and Detection Mechanism of H2S Probes Based on Azide Group Reduction
2.2.2. Optical Properties of Probes Based on Azide Group Reduction
2.2.3. The Application of H2S Probe Based on Azide Group Reduction
3. Summary and Outlook
Author Contributions
Funding
Conflicts of Interest
References
- Wu, D.; Si, W.; Wang, M.; Lv, S.; Ji, A.; Li, Y. Hydrogen Sulfide in Cancer: Friend or Foe? Nitric Oxide-Chem. Biol. 2015, 50, 38–45. [Google Scholar] [CrossRef] [PubMed]
- Wang, B.; Wang, X.; Guo, Z.; Gai, S.; Li, Y.; Wu, Y. A Highly Sensitive Ppb-Level H2S Gas Sensor Based on Fluorophenoxy-Substituted Phthalocyanine Cobalt/RGO Hybrids at Room Temperature. RSC Adv. 2021, 11, 5993–6001. [Google Scholar] [CrossRef] [PubMed]
- Yuvaraja, S.; Bhyranalyar, V.N.; Bhat, S.A.; Surya, S.G.; Yelamaggad, C.V.; Salama, K.N. A Highly Selective Electron Affinity Facilitated H2S Sensor: The Marriage of Tris (Keto-Hydrazone) and an Organic Field-Effect Transistor. Mater. Horiz. 2021, 8, 525–537. [Google Scholar] [CrossRef] [PubMed]
- Abe, K.; Kimura, H. The Possible Role of Hydrogen Sulfide as an Endogenous Neuromodulator. J. Neurosci. 1996, 16, 1066–1071. [Google Scholar] [CrossRef]
- Filipovic, M.R.; Zivanovic, J.; Alvarez, B.; Banerjee, R. Chemical Biology of H2S Signaling through Persulfidation. Chem. Rev. 2018, 118, 1253–1337. [Google Scholar] [CrossRef]
- Chen, W.; Zhang, Y.; Li, X.; Chen, H.; Sun, J.; Feng, F. H2S Activated Drug Release from Protein Cages. ACS Appl. Mater. Interfaces 2017, 9, 33571–33575. [Google Scholar] [CrossRef]
- Zanardo, R.C.O.; Brancaleone, V.; Distrutti, E.; Fiorucci, S.; Cirino, G.; Wallace, J.L. Hydrogen Sulfide was an Endogenous Modulator of Leukocyte-Mediated Inflammation. Faseb J. 2006, 20, 2118–2120. [Google Scholar] [CrossRef]
- Jiao, X.; Li, Y.; Niu, J.; Xie, X.; Wang, X.; Tang, B. Small-Molecule Fluorescent Probes for Imaging and Detection of Reactive Oxygen, Nitrogen, and Sulfur Species in Biological Systems. Anal. Chem. 2018, 90, 533–555. [Google Scholar] [CrossRef]
- Kimura, H. Hydrogen Sulfide: Its Production and Functions. Exp. Physiol 2011, 96, 833–835. [Google Scholar] [CrossRef]
- Zhang, H.; Kong, X.; Tang, Y.; Lin, W. Hydrogen Sulfide Triggered Charge-Reversal Micelles for Cancer-Targeted Drug Delivery and Imaging. ACS Appl. Mater. Interfaces 2016, 8, 16227–16239. [Google Scholar] [CrossRef]
- Fu, M.; Zhang, W.; Wu, L.; Yang, G.; Li, H.; Wang, R. Hydrogen Sulfide (H2S) Metabolism in Mitochondria and Its Regulatory Role in Energy Production. Proc. Natl. Acad. Sci. USA 2012, 109, 2943–2948. [Google Scholar] [CrossRef] [PubMed]
- Blackstone, E.; Morrison, M.; Roth, M.B. H2S Induces a Suspended Animation-like State in Mice. Science 2005, 308, 518. [Google Scholar] [CrossRef] [PubMed]
- Zhao, X.; Ning, L.; Zhou, X.; Song, Z.; Zhang, J.; Guan, F.; Yang, X.-F. An Activatable Near-Infrared Fluorescence Hydrogen Sulfide (H2S) Donor for Imaging H2S Release and Inhibiting Inflammation in Cells. Anal. Chem. 2021, 93, 4894–4901. [Google Scholar] [CrossRef] [PubMed]
- Huang, C.W.; Moore, P.K. H2S Synthesizing Enzymes: Biochemistry and Molecular Aspects. In Chemistry, Biochemistry and Pharmacology of Hydrogen Sulfide; Moore, P.K., Whiteman, M., Eds.; Handbook of Experimental Pharmacology; Springer International Publishing: Cham, Switzerland, 2015; pp. 3–25. [Google Scholar]
- Caliendo, G.; Cirino, G.; Santagada, V.; Wallace, J.L. Synthesis and Biological Effects of Hydrogen Sulfide (H2S): Development of H2S-Releasing Drugs as Pharmaceuticals. J. Med. Chem. 2010, 53, 6275–6286. [Google Scholar] [CrossRef] [PubMed]
- Cai, W.-J.; Wang, M.-J.; Ju, L.-H.; Wang, C.; Zhu, Y.-C. Hydrogen Sulfide Induces Human Colon Cancer Cell Proliferation: Role of Akt, ERK and P21. Cell Bio. Int. 2010, 34, 565–572. [Google Scholar] [CrossRef] [PubMed]
- Liu, X.; Gong, X.; Yuan, J.; Fan, X.; Zhang, X.; Ren, T.; Yang, S.; Yang, R.; Yuan, L.; Zhang, X.-B. Dual-Stimulus Responsive Near-Infrared Reversible Ratiometric Fluorescent and Photoacoustic Probe for In Vivo Tumor Imaging. Anal. Chem. 2021, 93, 5420–5429. [Google Scholar] [CrossRef]
- Bailey, T.S.; Pluth, M.D. Chemiluminescent Detection of Enzymatically Produced Hydrogen Sulfide: Substrate Hydrogen Bonding Influences Selectivity for H2S over Biological Thiols. J. Am. Chem. Soc. 2013, 135, 16697–16704. [Google Scholar] [CrossRef]
- Tian, X.; Li, Z.; Lau, C.; Lu, J. Visualization of in Vivo Hydrogen Sulfide Production by a Bioluminescence Probe in Cancer Cells and Nude Mice. Anal. Chem. 2015, 87, 11325–11331. [Google Scholar] [CrossRef]
- Shi, B.; Yan, Q.; Tang, J.; Cin, K.; Zhang, J.; Zhu, Y.; Xu, G.; Wang, R.; Chen, J.; Gao, W.; et al. Hydrogen Sulfide-Activatable Second Near-Infrared Fluorescent Nanoassemblies for Targeted Photothermal Cancer Therapy. Nano Lett. 2018, 18, 6411–6416. [Google Scholar] [CrossRef]
- Hosoki, R.; Matsuki, N.; Kimura, H. The Possible Role of Hydrogen Sulfide as an Endogenous Smooth Muscle Relaxant in Synergy with Nitric Oxide. Biochem. Biophys. Res. Commun. 1997, 237, 527–531. [Google Scholar] [CrossRef]
- Jimenez, D.; Martinez-Manez, R.; Sancenon, F.; Ros-Lis, J.V.; Benito, A.; Soto, J. A New Chromo-Chemodosimeter Selective for Sulfide Anion. J. Am. Chem. Soc. 2003, 125, 9000–9001. [Google Scholar] [CrossRef]
- Furne, J.; Saeed, A.; Levitt, M.D. Whole Tissue Hydrogen Sulfide Concentrations were Orders of Magnitude Lower than Presently Accepted Values. Am. J. Physiol. Regul. Integr. Comp. Physiol. 2008, 295, R1479–R1485. [Google Scholar] [CrossRef]
- Wallace, J.L. Hydrogen Sulfide-Releasing Anti-Inflammatory Drugs. Trends Pharmacol. Sci. 2007, 28, 501–505. [Google Scholar] [CrossRef]
- Kaushik, R.; Ghosh, A.; Jose, D.A. Simple Terpyridine Based Cu(II)/Zn(II) Complexes for the Selective Fluorescent Detection of H2S in Aqueous Medium. J. Lumin. 2016, 171, 112–117. [Google Scholar] [CrossRef]
- Wang, S.; Zhang, L.; Zhao, J.; Hou, L.; Wen, C.; Liang, H.; Zhao, S. Hydrogen Sulfide Dual-Activated NIR-II Photoacoustic Probes for Accurate Imaging and Efficient Photothermal Therapy of Colon Cancer. ACS Appl. Bio. Mater. 2021, 4, 974–983. [Google Scholar] [CrossRef]
- Chen, Y.; Zhu, C.; Yang, Z.; Chen, J.; He, Y.; Jiao, Y.; He, W.; Qiu, L.; Cen, J.; Guo, Z. A Ratiometric Fluorescent Probe for Rapid Detection of Hydrogen Sulfide in Mitochondria. Angew. Chem. Int. Ed. 2013, 52, 1688–1691. [Google Scholar] [CrossRef]
- Hammers, M.D.; Taormina, M.J.; Cerda, M.M.; Montoya, L.A.; Seidenkranz, D.T.; Parthasarathy, R.; Pluth, M.D. A Bright Fluorescent Probe for H2S Enables Analyte-Responsive, 3D Imaging in Live Zebrafish Using Light Sheet Fluorescence Microscopy. J. Am. Chem. Soc. 2015, 137, 10216–10223. [Google Scholar] [CrossRef]
- Yang, X.; Lu, X.; Wang, J.; Zhang, Z.; Du, X.; Zhang, J.; Wang, J. Near-Infrared Fluorescent Probe with a Large Stokes Shift for Detection of Hydrogen Sulfide in Food Spoilage, Living Cells, and Zebrafish. J. Agric. Food Chem. 2022, 9, 3047–3055. [Google Scholar] [CrossRef]
- Peng, H.; Cheng, Y.; Dai, C.; King, A.L.; Predmore, B.L.; Lefer, D.J.; Wang, B. A Fluorescent Probe for Fast and Quantitative Detection of Hydrogen Sulfide in Blood. Angew. Chem. Int. Ed. 2011, 50, 9672–9675. [Google Scholar] [CrossRef]
- Deng, Z.; Bi, S.; Jiang, M.; Zeng, S. Endogenous H2S-Activated Orthogonal Second Near-Infrared Emissive Nanoprobe for In Situ Ratiometric Fluorescence Imaging of Metformin-Induced Liver Injury. ACS Nano 2021, 15, 3201–3211. [Google Scholar] [CrossRef]
- Zhang, L.; Wang, J.-L.; Ba, X.-X.; Hua, S.-Y.; Jiang, P.; Jiang, F.-L.; Liu, Y. Multifunction in One Molecule: Mitochondrial Imaging and Photothermal & Photodynamic Cytotoxicity of Fast-Response Near-Infrared Fluorescent Probes with Aggregation-Induced Emission Characteristics. ACS Appl. Mater. Interfaces 2021, 13, 7945–7954. [Google Scholar]
- Chuang, C.-H.; Chen, W.-Y.; Tseng, W.-B.; Lin, A.; Lu, C.-Y.; Tseng, W.-L. Microwave-Mediated Synthesis of Near-Infrared-Emitting Silver Ion-Modified Gold Nanoclusters for Ratiometric Sensing of Hydrosulfide in Environmental Water and Hydrogen Sulfide in Live Cells. ACS Sustain. Chem. Eng. 2022, 10, 2461–2472. [Google Scholar] [CrossRef]
- Liu, T.; Xu, Z.; Spring, D.R.; Cui, J. A Lysosome-Targetable Fluorescent Probe for Imaging Hydrogen Sulfide in Living Cells. Org. Lett. 2013, 15, 2310–2313. [Google Scholar] [CrossRef]
- Cao, X.; Lin, W.; Zheng, K.; He, L. A Near-Infrared Fluorescent Turn-on Probe for Fluorescence Imaging of Hydrogen Sulfide in Living Cells Based on Thiolysis of Dinitrophenyl Ether. Chem. Commun. 2012, 48, 10529–10531. [Google Scholar] [CrossRef]
- Gong, S.; Zheng, Z.; Guan, X.; Feng, S.; Feng, G. Near-Infrared Mitochondria-Targetable Fluorescent Probe for High-Contrast Bioimaging of H2S. Anal. Chem. 2021, 93, 5700–5708. [Google Scholar] [CrossRef]
- Bae, S.K.; Heo, C.H.; Choi, D.J.; Sen, D.; Joe, E.-H.; Cho, B.R.; Kim, H.M. A Ratiometric Two-Photon Fluorescent Probe Reveals Reduction in Mitochondrial H2S Production in Parkinson’s Disease Gene Knockout Astrocytes. J. Am. Chem. Soc. 2013, 135, 9915–9923. [Google Scholar] [CrossRef]
- Wu, M.-Y.; Li, K.; Hou, J.-T.; Huang, Z.; Yu, X.-Q. A Selective Colorimetric and Ratiometric Fluorescent Probe for Hydrogen Sulfide. Org. Biomol. Chem. 2012, 10, 8342–8347. [Google Scholar] [CrossRef]
- Jose, A.; Sakla, R.; Sharma, N. Sensing and Bioimaging of the Gaseous Signaling Molecule Hydrogen Sulfide by Near-Infrared Fluorescent Probes. ACS Sens. 2020, 5, 3365–3391. [Google Scholar] [CrossRef]
- Yang, Q.-Q.; Tian, Q.-Q.; Ji, N.; Duan, X.-H.; Zhu, X.-H.; Zhang, Y.-L.; He, W. A Novel Fluorescent Probe for the Detection of Sulfur Dioxide Derivatives and Its Application in Biological Imaging. New J. Chem. 2022, 46, 1483–1488. [Google Scholar] [CrossRef]
- Huang, X.; Liu, H.; Zhang, J.; Xiao, B.; Wu, F.; Zhang, Y.; Tan, Y.; Jiang, Y. A Novel Near-Infrared Fluorescent Hydrogen Sulfide Probe for Live Cell and Tissue Imaging. New J. Chem. 2019, 43, 6848–6855. [Google Scholar] [CrossRef]
- Kang, H.; Shamim, M.; Yin, X.; Adluru, E.; Fukuda, T.; Yokomizo, S.; Chang, H.; Park, S.H.; Cui, Y.; Moy, A.J. Tumor-Associated Immune Cell Mediated Tumor Targeting Mechanism with NIR-II Fluorescence Imaging. Adv. Mater. 2021, 34, 2106500. [Google Scholar] [CrossRef]
- Chang, M.J.; Kim, K.; Kang, C.; Lee, M.H. Enhanced Aggregability of AIE-Based Probe through H2S-Selective Triggered Dimerization and Its Applications to Biological Systems. Acs Omega 2019, 4, 7176–7181. [Google Scholar] [CrossRef]
- Dhivya, R.; Kavitha, V.; Gomathi, A.; Keerthana, P.; Santhalakshmi, N.; Viswanathamurthi, P.; Haribabu, J. Dinitrobenzene Ether Reactive Turn-on Fluorescence Probes for the Selective Detection of H2S. Anal. Methods 2021, 14, 58–66. [Google Scholar] [CrossRef]
- Cao, Y.; Wang, L.; Liu, Z.; Sun, C.; Li, Y. Theoretical Study on the Sensing Mechanism of Chalcone-Based Fluorescence Probe for Detecting Hydrogen Sulfide and Biothiols. New J. Chem. 2021, 45, 16906–16912. [Google Scholar] [CrossRef]
- Lin, V.S.; Lippert, A.R.; Chang, C.J. Azide-based fluorescent probes: Imaging hydrogen sulfide in living systems. Methods Enzymol. 2015, 554, 63–80. [Google Scholar]
- Lippert, A.R.; New, E.J.; Chang, C.J. Reaction-Based Fluorescent Probes for Selective Imaging of Hydrogen Sulfide in Living Cells. J. Am. Chem. Soc. 2011, 133, 10078–10080. [Google Scholar] [CrossRef]
- Essam, Z.M.; Ozmen, G.E.; Setiawan, D.; Hamid, R.R.; El-Aal, R.M.A.; Aneja, R.; Hamelberg, D.; Henary, M. Donor Acceptor Fluorophores: Synthesis, Optical Properties, TD-DFT and Cytotoxicity Studies. Org. Biomol. Chem. 2021, 19, 1835–1846. [Google Scholar] [CrossRef]
- Choi, H.S.; Gibbs, S.L.; Lee, J.H.; Kim, S.H.; Ashitate, Y.; Liu, F.; Hyun, H.; Park, G.; Xie, Y.; Bae, S.; et al. Targeted Zwitterionic Near-Infrared Fluorophores for Improved Optical Imaging. Nat. Biotechnol. 2013, 31, 148–153. [Google Scholar] [CrossRef]
- Cao, J.; Chi, J.; Xia, J.; Zhang, Y.; Han, S.; Sun, Y. Iodinated Cyanine Dyes for Fast Near-Infrared-Guided Deep Tissue Synergistic Phototherapy. ACS Appl. Mater. Interfaces 2019, 11, 25720–25729. [Google Scholar] [CrossRef]
- Lovett, W.R.; Al Hamd, A.; Casa, S.; Henary, M. Synthesis of PH-Sensitive Benzothiazole Cyanine Dye Derivatives Containing a Pyridine Moiety at the Meso Position. Dyes Pigments 2021, 190, 109268. [Google Scholar] [CrossRef]
- Chen, Z.; Mu, X.; Han, Z.; Yang, S.; Zhang, C.; Guo, Z.; Bai, Y.; He, W. An Optical/Photoacoustic Dual-Modality Probe: Ratiometric in/Ex Vivo Imaging for Stimulated H2S Upregulation in Mice. J. Am. Chem. Soc. 2019, 141, 17973–17977. [Google Scholar] [CrossRef] [PubMed]
- Li, W.; Shen, Y.; Gong, X.; Zhang, X.-B.; Yuan, L. Highly Selective Fluorescent Probe Design for Visualizing Hepatic Hydrogen Sulfide in the Pathological Progression of Nonalcoholic Fatty Liver. Anal. Chem. 2021, 93, 16673–16682. [Google Scholar] [CrossRef] [PubMed]
- Wang, J.; Xie, H.; Li, H.; Wang, R.; Zhang, B.; Ren, T.; Hua, J.; Chen, N. NIR Fluorescent Probe for In Situ Bioimaging of Endogenous H2S in Rice Roots under Al3+ and Flooding Stresses. J. Agric. Food Chem. 2021, 69, 14330–14339. [Google Scholar] [CrossRef] [PubMed]
- Wang, C.; Ding, Y.; Bi, X.; Luo, J.; Wang, G.; Lin, Y. Carbon Quantum Dots-Ag Nanoparticle Complex as a Highly Sensitive “Turn-on” Fluorescent Probe for Hydrogen Sulfide: A DFT/TD-DFT Study of Electronic Transitions and Mechanism of Sensing. Sens. Actuators B Chem. 2018, 264, 404–409. [Google Scholar] [CrossRef]
- Yu, C.; Li, X.; Zeng, F.; Zheng, F.; Wu, S. Carbon-Dot-Based Ratiometric Fluorescent Sensor for Detecting Hydrogen Sulfide in Aqueous Media and inside Live Cells. Chem. Commun. 2013, 49, 403–405. [Google Scholar] [CrossRef]
- Fortibui, M.M.; Yoon, D.W.; Lim, J.-Y.; Lee, S.; Choi, M.; Heo, J.S.; Kim, J.; Kim, J. A Cancer Cell-Specific Benzoxadiazole-Based Fluorescent Probe for Hydrogen Sulfide Detection in Mitochondria. Dalton Trans. 2021, 50, 2545–2554. [Google Scholar] [CrossRef]
- Liu, W.; Bu, D.; Zhang, H.; Zhang, M.; Ren, H.; Li, Z.; Yu, M. A Mitochondrial and Lysosomal Targeted Ratiometric Probe for Detecting Intracellular H2S. Anal. Methods 2022, 14, 101–105. [Google Scholar] [CrossRef]
- Singh, N.; Sharma, S.; Singh, R.; Rajput, S.; Chattopadhyay, N.; Tewari, D.; Joshi, K.B.; Verma, S. A Naphthalimide-Based Peptide Conjugate for Concurrent Imaging and Apoptosis Induction in Cancer Cells by Utilizing Endogenous Hydrogen Sulfide. Chem. Sci. 2021, 12, 16085–16091. [Google Scholar] [CrossRef]
- Dong, B.; Song, X.; Wang, C.; Kong, X.; Tang, Y.; Lin, W. Dual Site-Controlled and Lysosome-Targeted Intramolecular Charge Transfer-Photoinduced Electron Transfer-Fluorescence Resonance Energy Transfer Fluorescent Probe for Monitoring PH Changes in Living Cells. Anal. Chem. 2016, 88, 4085–4091. [Google Scholar] [CrossRef]
- Li, Y.; Gu, B.; Su, W.; Duan, X.; Xu, H.; Huang, Z.; Li, H.; Yao, S. A Simple and Efficient Fluorescent Probe for the Rapid Detection of H2S in Living Cells and on Agar Gels. Anal. Methods 2017, 9, 3290–3295. [Google Scholar] [CrossRef]
- Liu, Y.; Meng, F.; He, L.; Liu, K.; Lin, W. A Dual-Site Two-Photon Fluorescent Probe for Visualizing Lysosomes and Tracking Lysosomal Hydrogen Sulfide with Two Different Sets of Fluorescence Signals in the Living Cells and Mouse Liver Tissues. Chem. Commun. 2016, 52, 7016–7019. [Google Scholar] [CrossRef] [PubMed]
- Chen, F.; Han, D.; Liu, H.; Wang, S.; Li, K.-B.; Zhang, S.; Shi, W. A Tri-Site Fluorescent Probe for Simultaneous Sensing of Hydrogen Sulfide and Glutathione and Its Bioimaging Applications. Analyst 2018, 143, 440–448. [Google Scholar] [CrossRef] [PubMed]
- Ren, M.; Deng, B.; Kong, X.; Zhou, K.; Liu, K.; Xu, G.; Lin, W. A TICT-Based Fluorescent Probe for Rapid and Specific Detection of Hydrogen Sulfide and Its Bio-Imaging Applications. Chem. Commun. 2016, 52, 6415–6418. [Google Scholar] [CrossRef] [PubMed]
- Li, S.-J.; Li, Y.-F.; Liu, H.-W.; Zhou, D.-Y.; Jiang, W.-L.; Ou-Yang, J.; Li, C.-Y. A Dual-Response Fluorescent Probe for the Detection of Viscosity and H2S and Its Application in Studying Their Crosstalk Influence in Mitochondria. Anal. Chem. 2018, 90, 9418–9425. [Google Scholar] [CrossRef]
- Zhang, Y.; Zhang, B.; Li, Z.; Wang, L.; Ren, X.; Ye, Y. Endoplasmic Reticulum Targeted Fluorescent Probe for the Detection of Hydrogen Sulfide Based on a Twist-Blockage Strategy. Org. Biomol. Chem. 2019, 17, 8778–8783. [Google Scholar] [CrossRef]
- Feng, X.; Zhang, T.; Liu, J.-T.; Miao, J.-Y.; Zhao, B.-X. A New Ratiometric Fluorescent Probe for Rapid, Sensitive and Selective Detection of Endogenous Hydrogen Sulfide in Mitochondria. Chem. Commun. 2016, 52, 3131–3134. [Google Scholar] [CrossRef]
- Yang, Y.; He, L.; Xu, K.; Lin, W. A Ratiometric Fluorescent Chemosensor for the Convenient Monitoring of Hydrogen Sulfide Concentration by the Dual Fluorescence Fluctuation Mode of Two Distinct Emission Bands in Living Cells and Zebrafish. New J. Chem. 2019, 43, 10926–10931. [Google Scholar] [CrossRef]
- Zhang, Y.; Chen, Y.; Yang, B.; Xue, X.; He, W.; Guo, Z. FRET Based Fluorescent Ratiometric Probes for Rapid Detection of Endogenous Hydrogen Sulphide in Living Cells. Analyst 2020, 145, 4233–4238. [Google Scholar] [CrossRef]
- Ye, H.; Sun, L.; Pang, Z.; Ji, X.; Tu, X.; Huang, H.; Tang, X.; Xi, X.; Yi, L. Cell-Trappable BODIPY-NBD Dyad for Imaging of Basal and Stress-Induced H2S in Live Biosystems Anal. Chem. 2022, 94, 1733–1741. [Google Scholar]
- Wu, R.; Chen, Z.; Huo, H.; Chen, L.; Su, L.; Zhang, X.; Wu, Y.; Yao, Z.; Xiao, S.; Du, W.; et al. Ratiometric Detection of H2S in Liver Injury by Activated Two-Wavelength Photoacoustic Imaging. Anal. Chem. 2022, 94, 10797–10804. [Google Scholar] [CrossRef]
- Zhu, H.; Liu, C.; Yuan, R.; Wang, R.; Zhang, H.; Li, Z.; Jia, P.; Zhu, B.; Sheng, W. A Simple Highly Specific Fluorescent Probe for Simultaneous Discrimination of Cysteine/Homocysteine and Glutathione/Hydrogen Sulfide in Living Cells and Zebrafish Using Two Separated Fluorescence Channels under Single Wavelength Excitation. Analyst 2019, 144, 4258–4265. [Google Scholar] [CrossRef] [PubMed]
- Lan, J.-S.; Zeng, R.-F.; Liu, Y.; Xiang, Y.-W.; Jiang, X.; Liu, L.; Xie, S.-S.; Ding, Y.; Zhang, T. A Near-Infrared Nile Red Fluorescent Probe for the Discrimination of Biothiols by Dual-Channel Response and Its Bioimaging Applications in Living Cells and Animals. Analyst 2019, 144, 3676–3684. [Google Scholar] [CrossRef] [PubMed]
- Jing, X.; Yu, F.; Lin, W. A PET-Based Lysosome-Targeted Turn-on Fluorescent Probe for the Detection of H2S and Its Bioimaging Application in Living Cells and Zebrafish. New J. Chem. 2019, 43, 16796–16800. [Google Scholar] [CrossRef]
- Fang, Q.; Xiong, H.; Yang, L.; Wang, B.; Song, X. An Instantaneous Fluorescent Probe for Detecting Hydrogen Sulfide in Biological Systems. New J. Chem. 2019, 43, 13594–13599. [Google Scholar] [CrossRef]
- Velusamy, N.; Binoy, A.; Bobba, K.N.; Nedungadi, D.; Mishra, N.; Bhuniya, S. A Bioorthogonal Fluorescent Probe for Mitochondrial Hydrogen Sulfide: New Strategy for Cancer Cell Labeling. Chem. Commun. 2017, 53, 8802–8805. [Google Scholar] [CrossRef] [PubMed]
- Wang, X.; Zuo, Y.; Zhang, Y.; Yang, T.; Lin, W. An ICT-Based Fluorescent Probe with Bridging Si–O–Si Bonds for Visualizing Hydrogen Sulfide in Lipid Droplets and Its Application. Anal. Methods 2020, 12, 1064–1069. [Google Scholar] [CrossRef]
- Dou, Y.; Gu, X.; Ying, S.; Zhu, S.; Yu, S.; Shen, W.; Zhu, Q. A Novel Lysosome-Targeted Fluorogenic Probe Based on 5-Triazole-Quinoline for the Rapid Detection of Hydrogen Sulfide in Living Cells. Org. Biomol. Chem. 2018, 16, 712–716. [Google Scholar] [CrossRef]
- Ren, M.; Li, Z.; Deng, B.; Wang, L.; Lin, W. Single Fluorescent Probe Separately and Continuously Visualize H2S and HClO in Lysosomes with Different Fluorescence Signals. Anal. Chem. 2019, 91, 2932–2938. [Google Scholar] [CrossRef]
- Wu, Z.; Liang, D.; Tang, X. Visualizing Hydrogen Sulfide in Mitochondria and Lysosome of Living Cells and in Tumors of Living Mice with Positively Charged Fluorescent Chemosensors. Anal. Chem. 2016, 88, 9213–9218. [Google Scholar] [CrossRef]
- Zhang, Y.; Tang, Z.; Ren, Z.; Qu, S.; Liu, M.; Liu, L.; Jiang, Z. Hydrogen Sulfide, the Next Potent Preventive and Therapeutic Agent in Aging and Age-Associated Diseases. Mol. And Cell. Biol. 2013. Published Ahead of Print. [Google Scholar] [CrossRef]
- Szabo, C. Hydrogen sulphide and its therapeutic potential. Nat. Rev. Drug Discov. 2007, 6, 917–935. [Google Scholar] [CrossRef] [PubMed]
- Whiteman, M.; Le Trionnaire, S.; Chopra, M.; Fox, B.; Whatmore, J. Emerging role of hydrogen sulfide in health and disease: Critical appraisal of biomarkers and pharmacological tools. Clin. Sci. 2011, 121, 459–488. [Google Scholar] [CrossRef] [PubMed]
- Zhang, S.; Yang, G.; Guan, W.; Li, B.; Feng, X.; Fan, H. Autophagy Plays a Protective Role in Sodium Hydrosulfide-Induced Acute Lung Injury by Attenuating Oxidative Stress and Inflammation in Rats. Chem. Res. Toxicol. 2021, 34, 857–864. [Google Scholar] [CrossRef] [PubMed]


| Properties | Data |
|---|---|
| Dipole moment | 0.97 D |
| Solubility (in H2O) | 110 mM/atm, 25 °C |
| 210 mM/atm, 0 °C | |
| Boiling temperature | −60.2 °C |
| Density (25 °C, 1 atm) | 1.36 kg/m3 |
| IR | ν1 2525, 2536 cm−1 |
| ν2 1169, 1184, 1189 cm−1 | |
| ν3 2548 cm−1 | |
| 1H-NMR | 0.52 ppm |
| pK1 | 6.98 |
| pK2 | >17 at 25 °C |
| λmax (HS−) | 230 nm |
| ε | 8 × 10³ M−1·cm−1 |
| Henry’s law coefficient (298 K) | 0.087135 mol solute/mol water atom |
| Detection threshold by human nose | 0.02–0.03 ppm |
| Lethal dose | >500 ppm |
| ΔfG° (H2S) | −28 kJ/mol |
| ΔfG° (HS−) | +12 kJ/mol |
| ΔfG° (S2−) | +86 kJ/mol |
| E°′ (S•−, H+/HS−) | +0.91 V |
| E°′ (HS2−, H+/2HS−) | −0.23 V |
| Probe Number | Detection Mechanism | Fluorescence Emission | LOD | Bioapplication | Ref. |
|---|---|---|---|---|---|
| 3 | ICT | 600 nm | 15 nM | HeLa Cells | [61] |
| 6 | ICT | 625 nm | 3.2 μM | A549 cells and liver tissue | [62] |
| 11 | ICT | 490 nm | 75 nM | MCF-7 cells | [63] |
| 13 | TICT | 535 nm | 1.7 μM | HeLa Cells | [64] |
| 16 | TICT | 510 nm | 0.17 μM | HeLa cells | [65] |
| 18 | TICT | 537 nm | 0.15 μM | Ec1 cells | [66] |
| 20 | FRET | 587 nm | 40 nM | HeLa cells | [67] |
| 23 | FRET | 650 nm | 0.2 μM | HeLa cells and zebrafish | [68] |
| 26 | FRET | 665 nm | 0.5 μM | HepG-2 cells | [69] |
| 31 | PET | 643 nm | 62 nM | RAW 264.7 cells and zebrafish | [72] |
| 34 | PET | 650 nm | 40 nM | HepG2 and L02 cells | [73] |
| 37 | PET | 460 nm | 0.2 μM | HeLa cells and zebrafish | [74] |
| 40 | Azide reduction | 422 nm | 3.5 nM | HeLa cells and zebrafish | [75] |
| 43 | Azide reduction | 450 nm | 24.3 nM | HeLa cells | [76] |
| 47 | Azide reduction | 550 nm | 0.57 μM | HeLa cells | [77] |
Disclaimer/Publisher’s Note: The statements, opinions and data contained in all publications are solely those of the individual author(s) and contributor(s) and not of MDPI and/or the editor(s). MDPI and/or the editor(s) disclaim responsibility for any injury to people or property resulting from any ideas, methods, instructions or products referred to in the content. |
© 2023 by the authors. Licensee MDPI, Basel, Switzerland. This article is an open access article distributed under the terms and conditions of the Creative Commons Attribution (CC BY) license (https://creativecommons.org/licenses/by/4.0/).
Share and Cite
Liu, D.; Hessler, W.; Henary, M. H2S Sensors: Synthesis, Optical Properties, and Selected Biomedical Applications under Visible and NIR Light. Molecules 2023, 28, 1295. https://doi.org/10.3390/molecules28031295
Liu D, Hessler W, Henary M. H2S Sensors: Synthesis, Optical Properties, and Selected Biomedical Applications under Visible and NIR Light. Molecules. 2023; 28(3):1295. https://doi.org/10.3390/molecules28031295
Chicago/Turabian StyleLiu, Dongning, Winston Hessler, and Maged Henary. 2023. "H2S Sensors: Synthesis, Optical Properties, and Selected Biomedical Applications under Visible and NIR Light" Molecules 28, no. 3: 1295. https://doi.org/10.3390/molecules28031295
APA StyleLiu, D., Hessler, W., & Henary, M. (2023). H2S Sensors: Synthesis, Optical Properties, and Selected Biomedical Applications under Visible and NIR Light. Molecules, 28(3), 1295. https://doi.org/10.3390/molecules28031295