
The Application of Handheld Near-Infrared Spectroscopy and Raman Spectroscopic Imaging for the Identification and Quality Control of Food Products

 , and
, and
Abstract
:1. Introduction
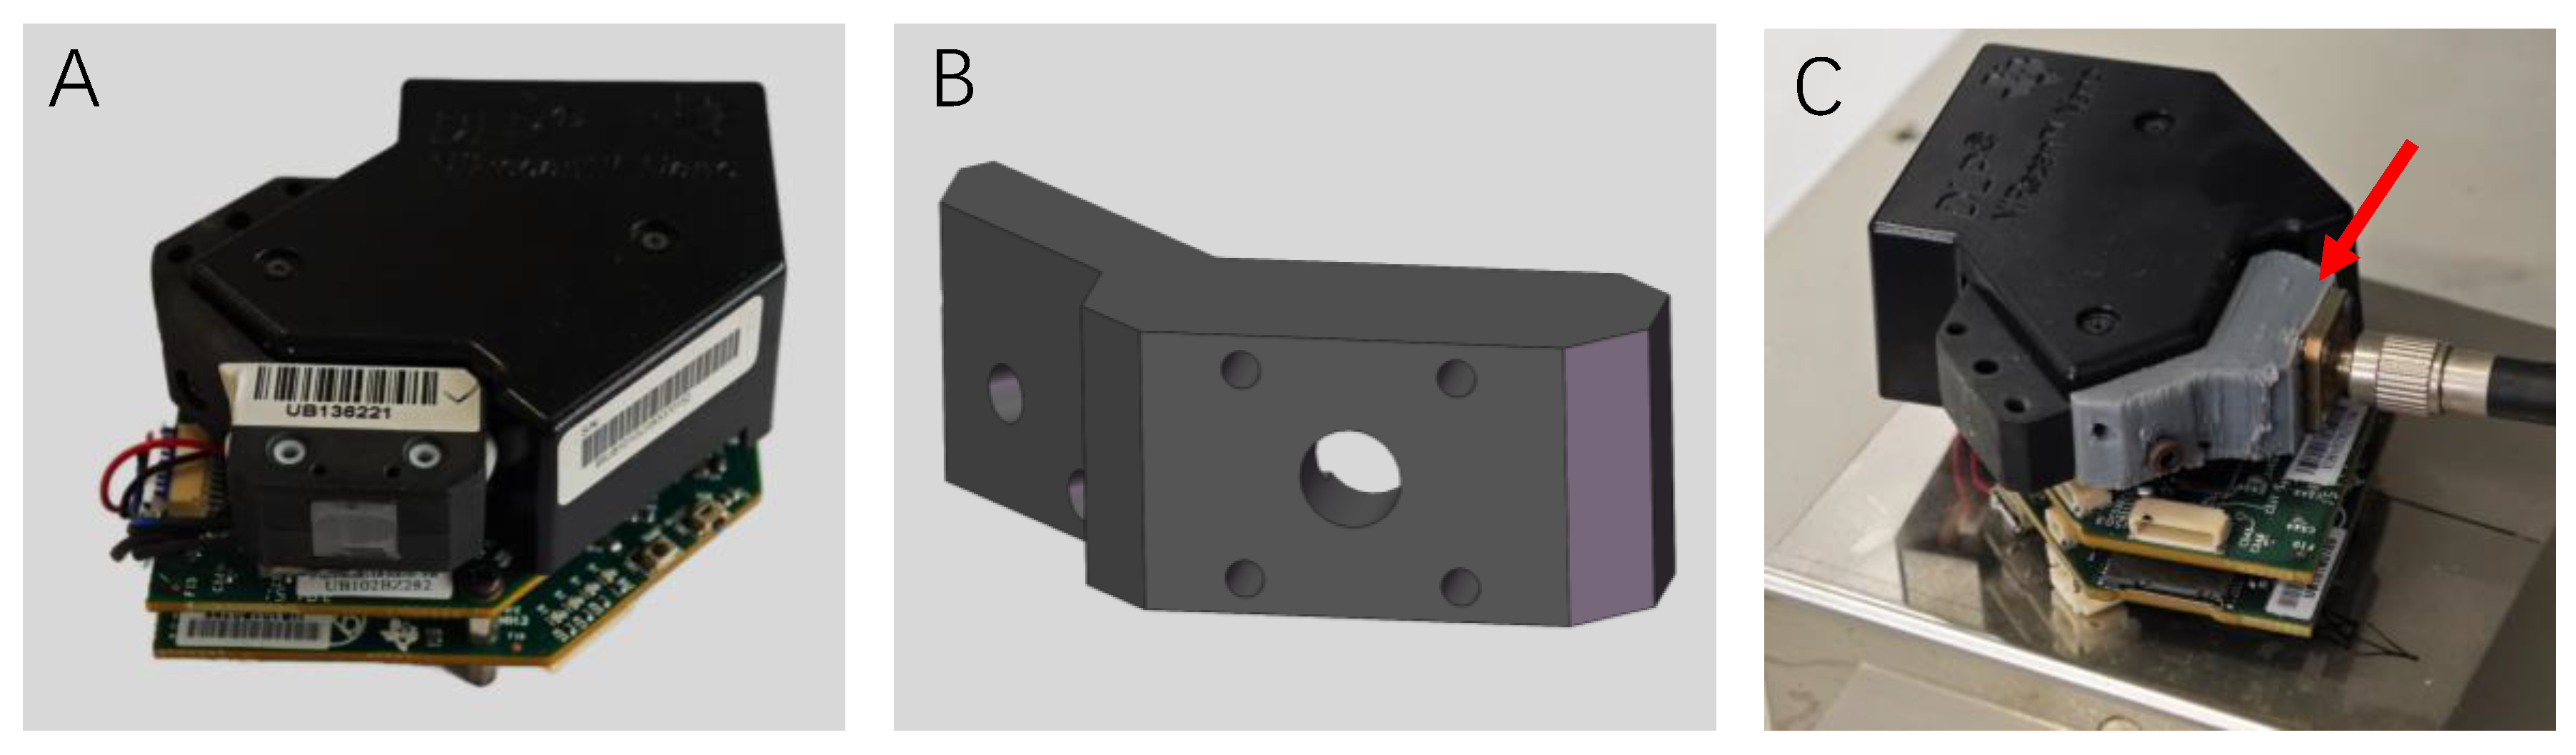
2. Applications of Handheld NIR Spectroscopy in Food Products
2.1. Monitoring Food Extraction Processes
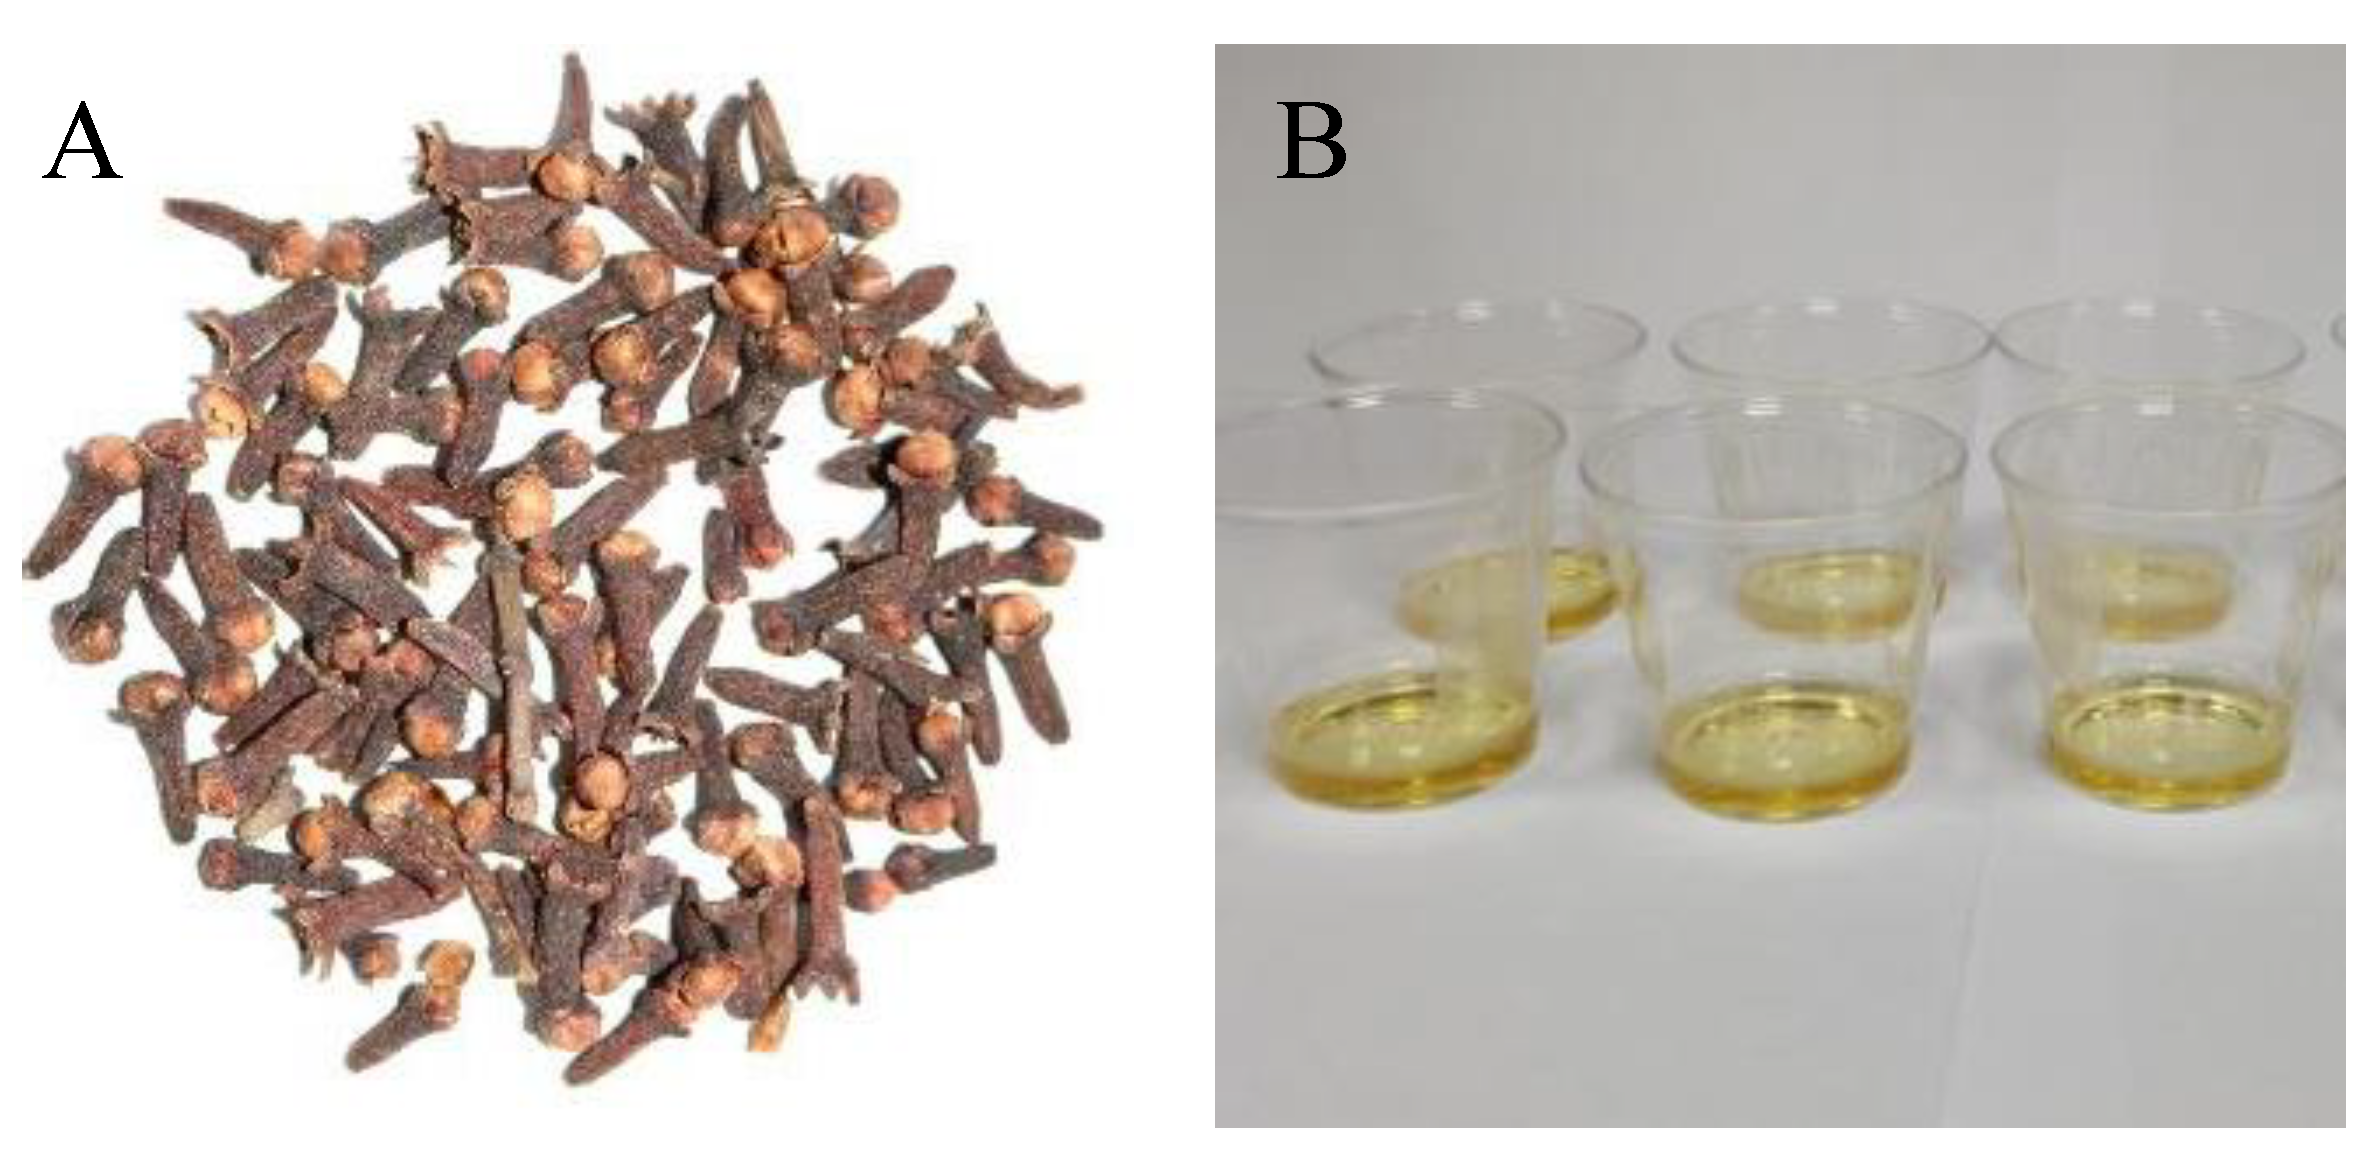
2.1.1. Ethanol Extraction of Clove
Materials and Methods
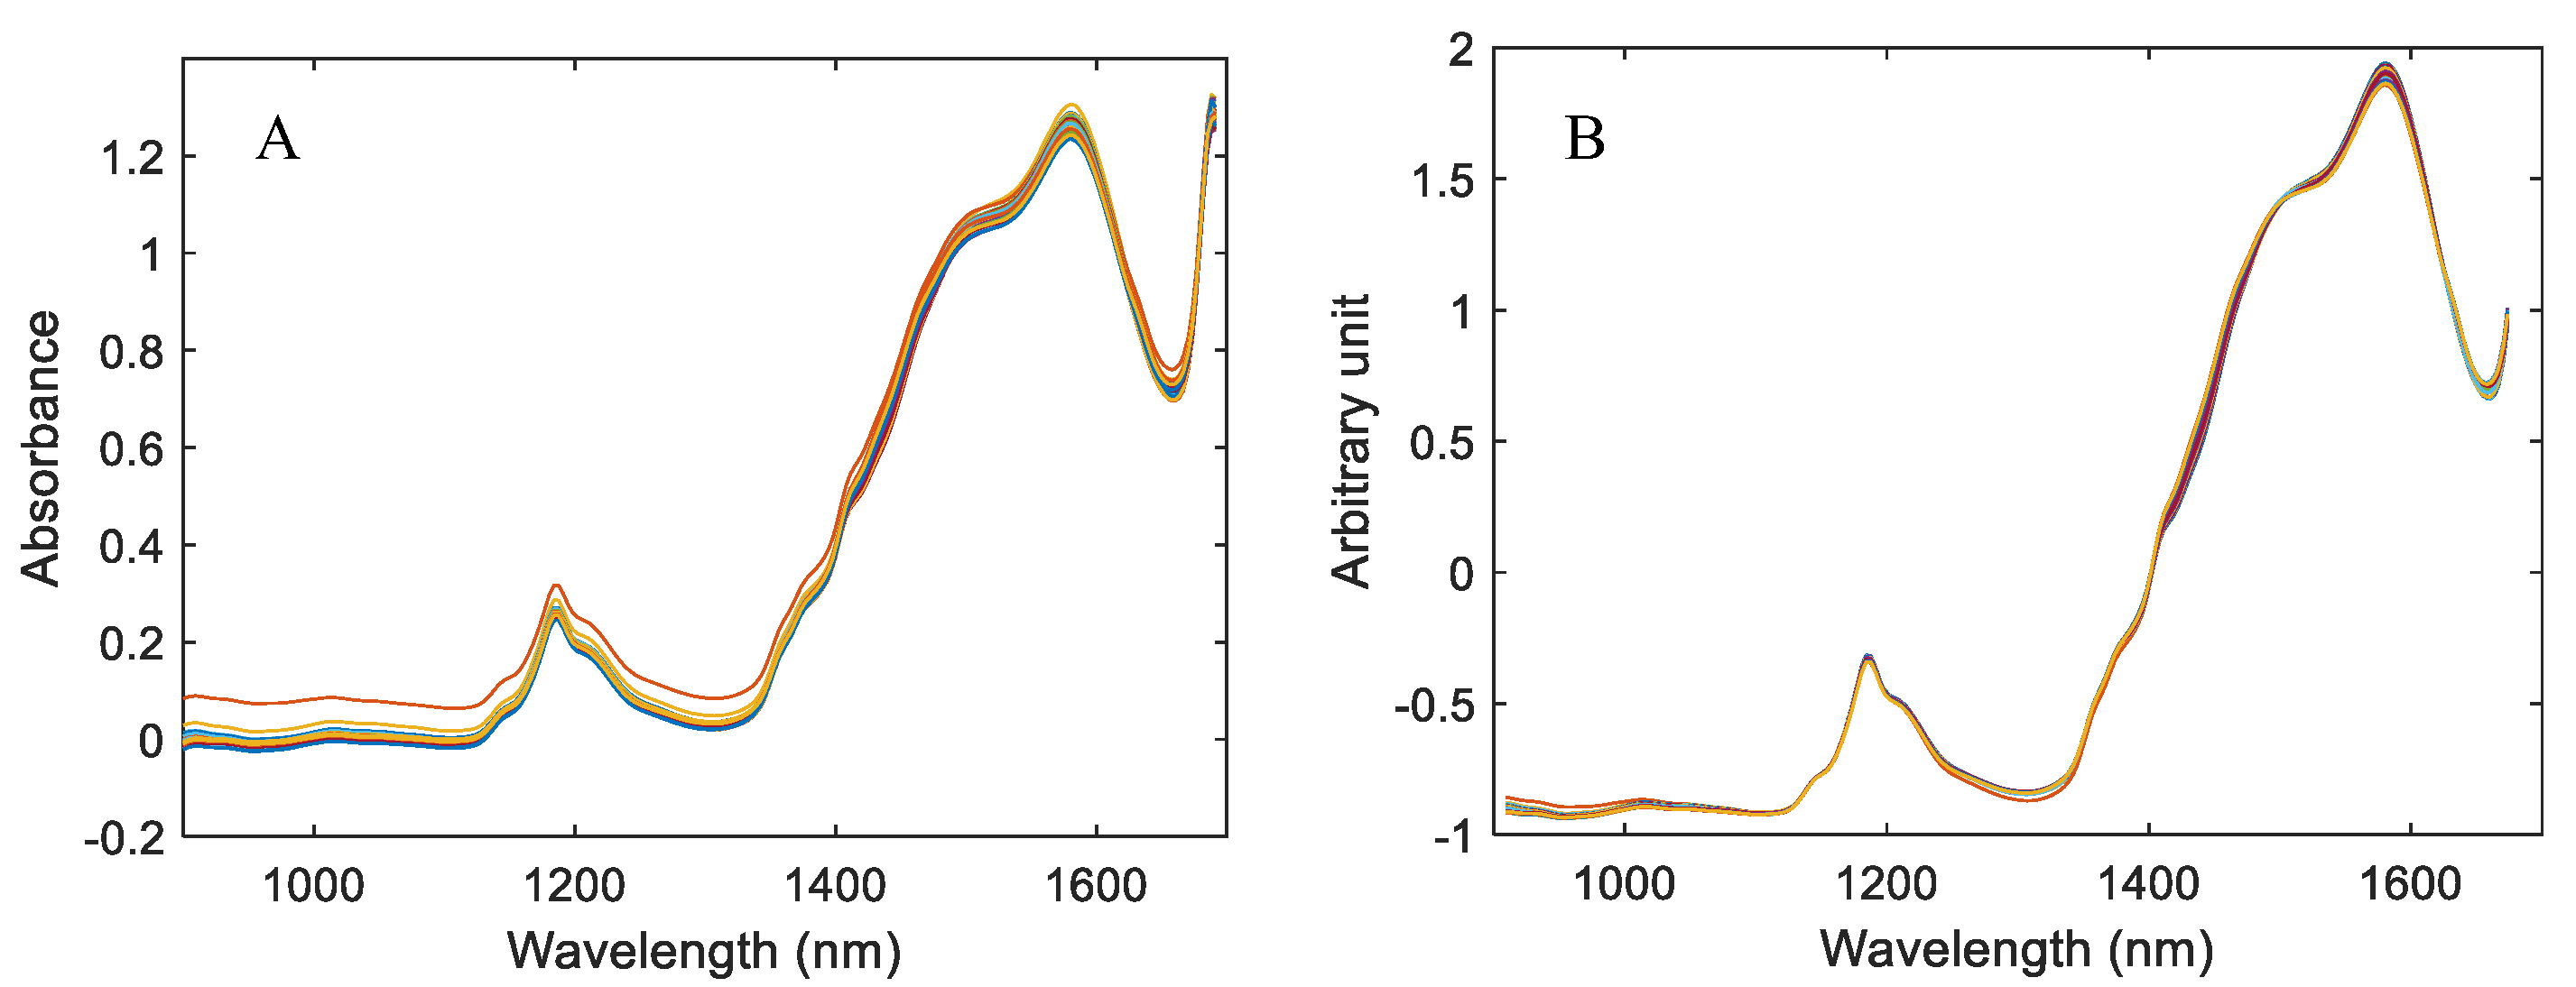
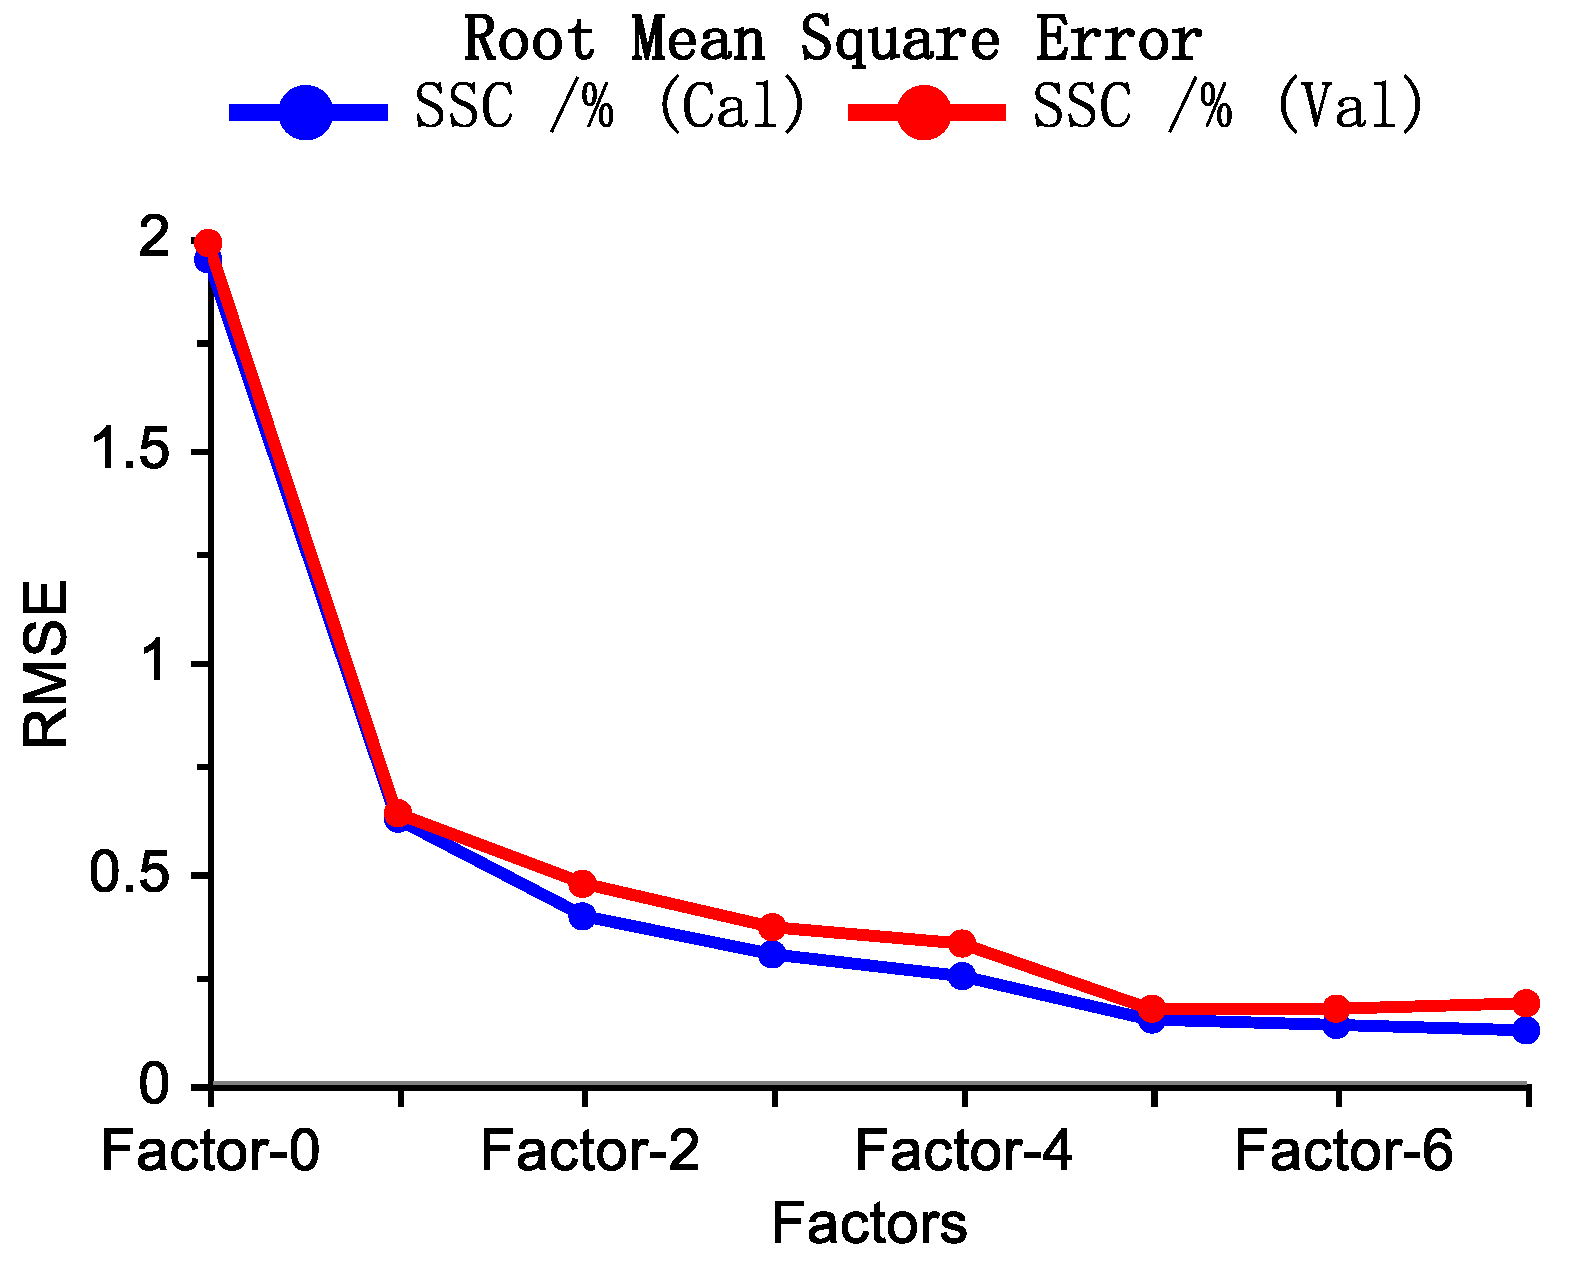
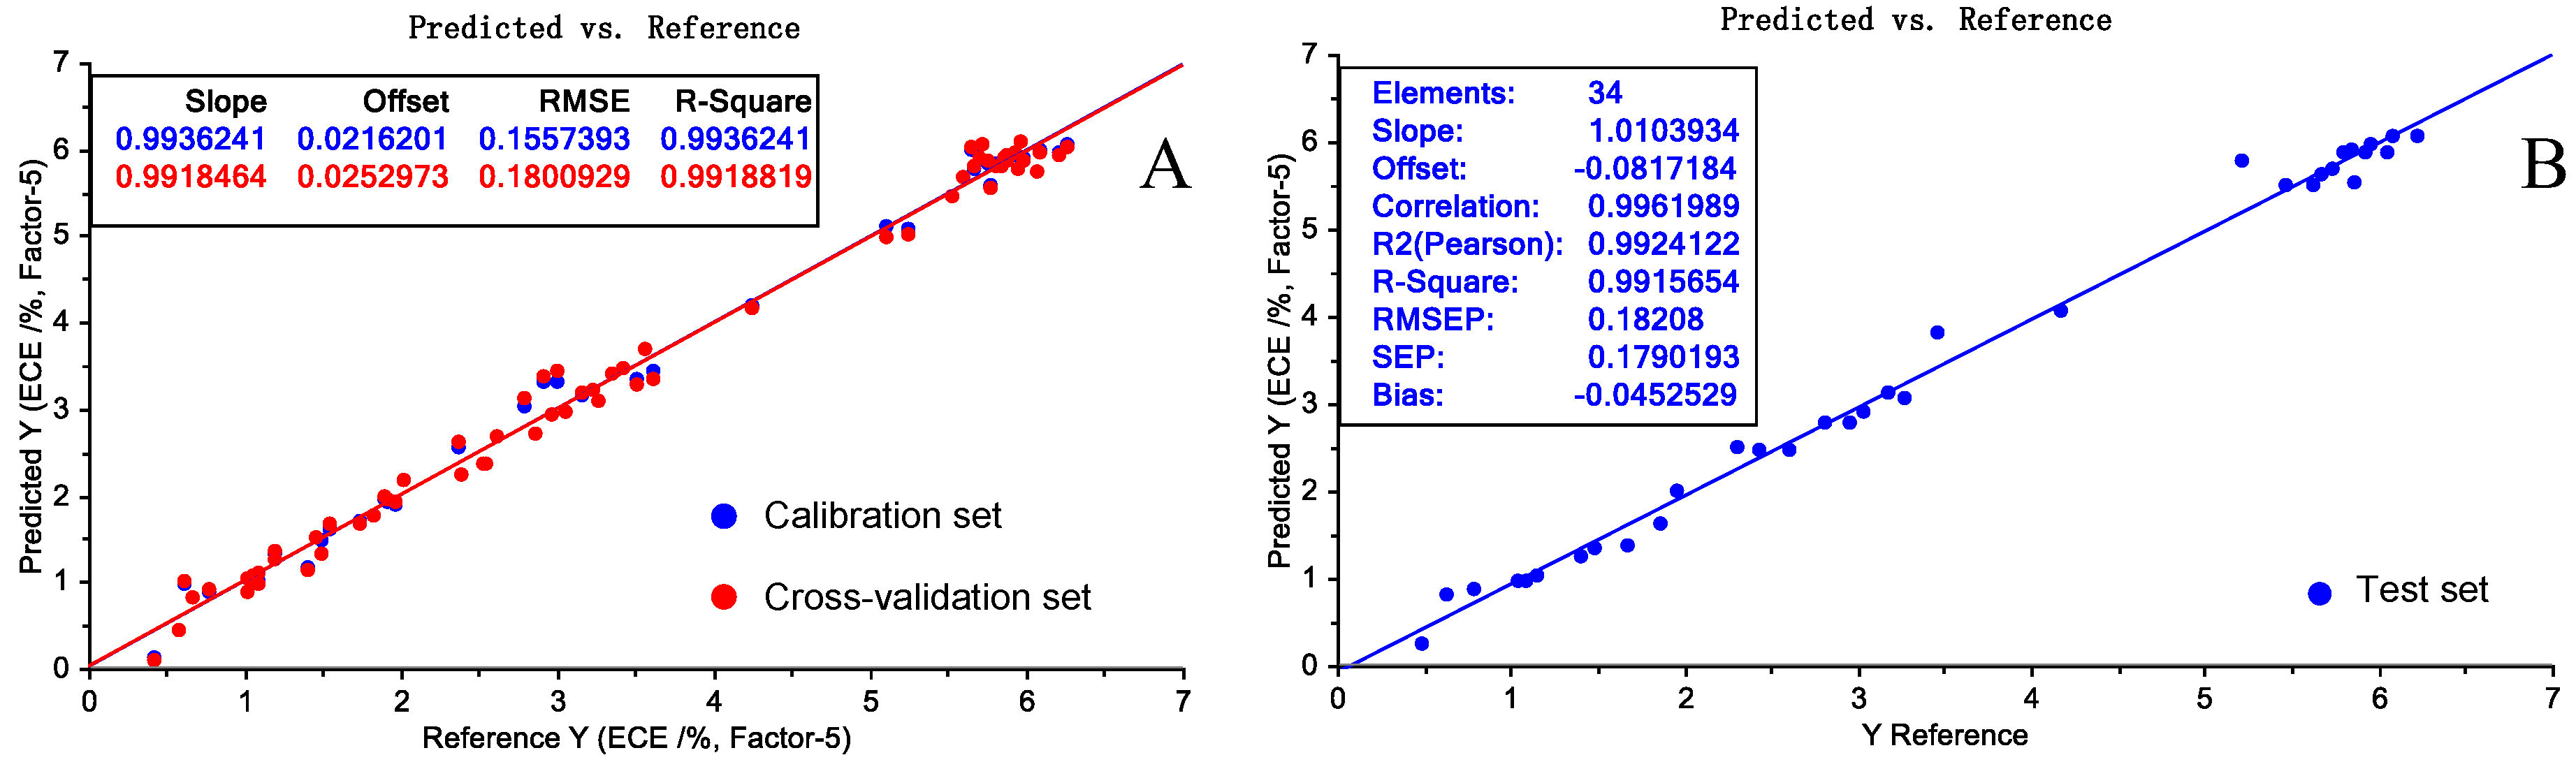
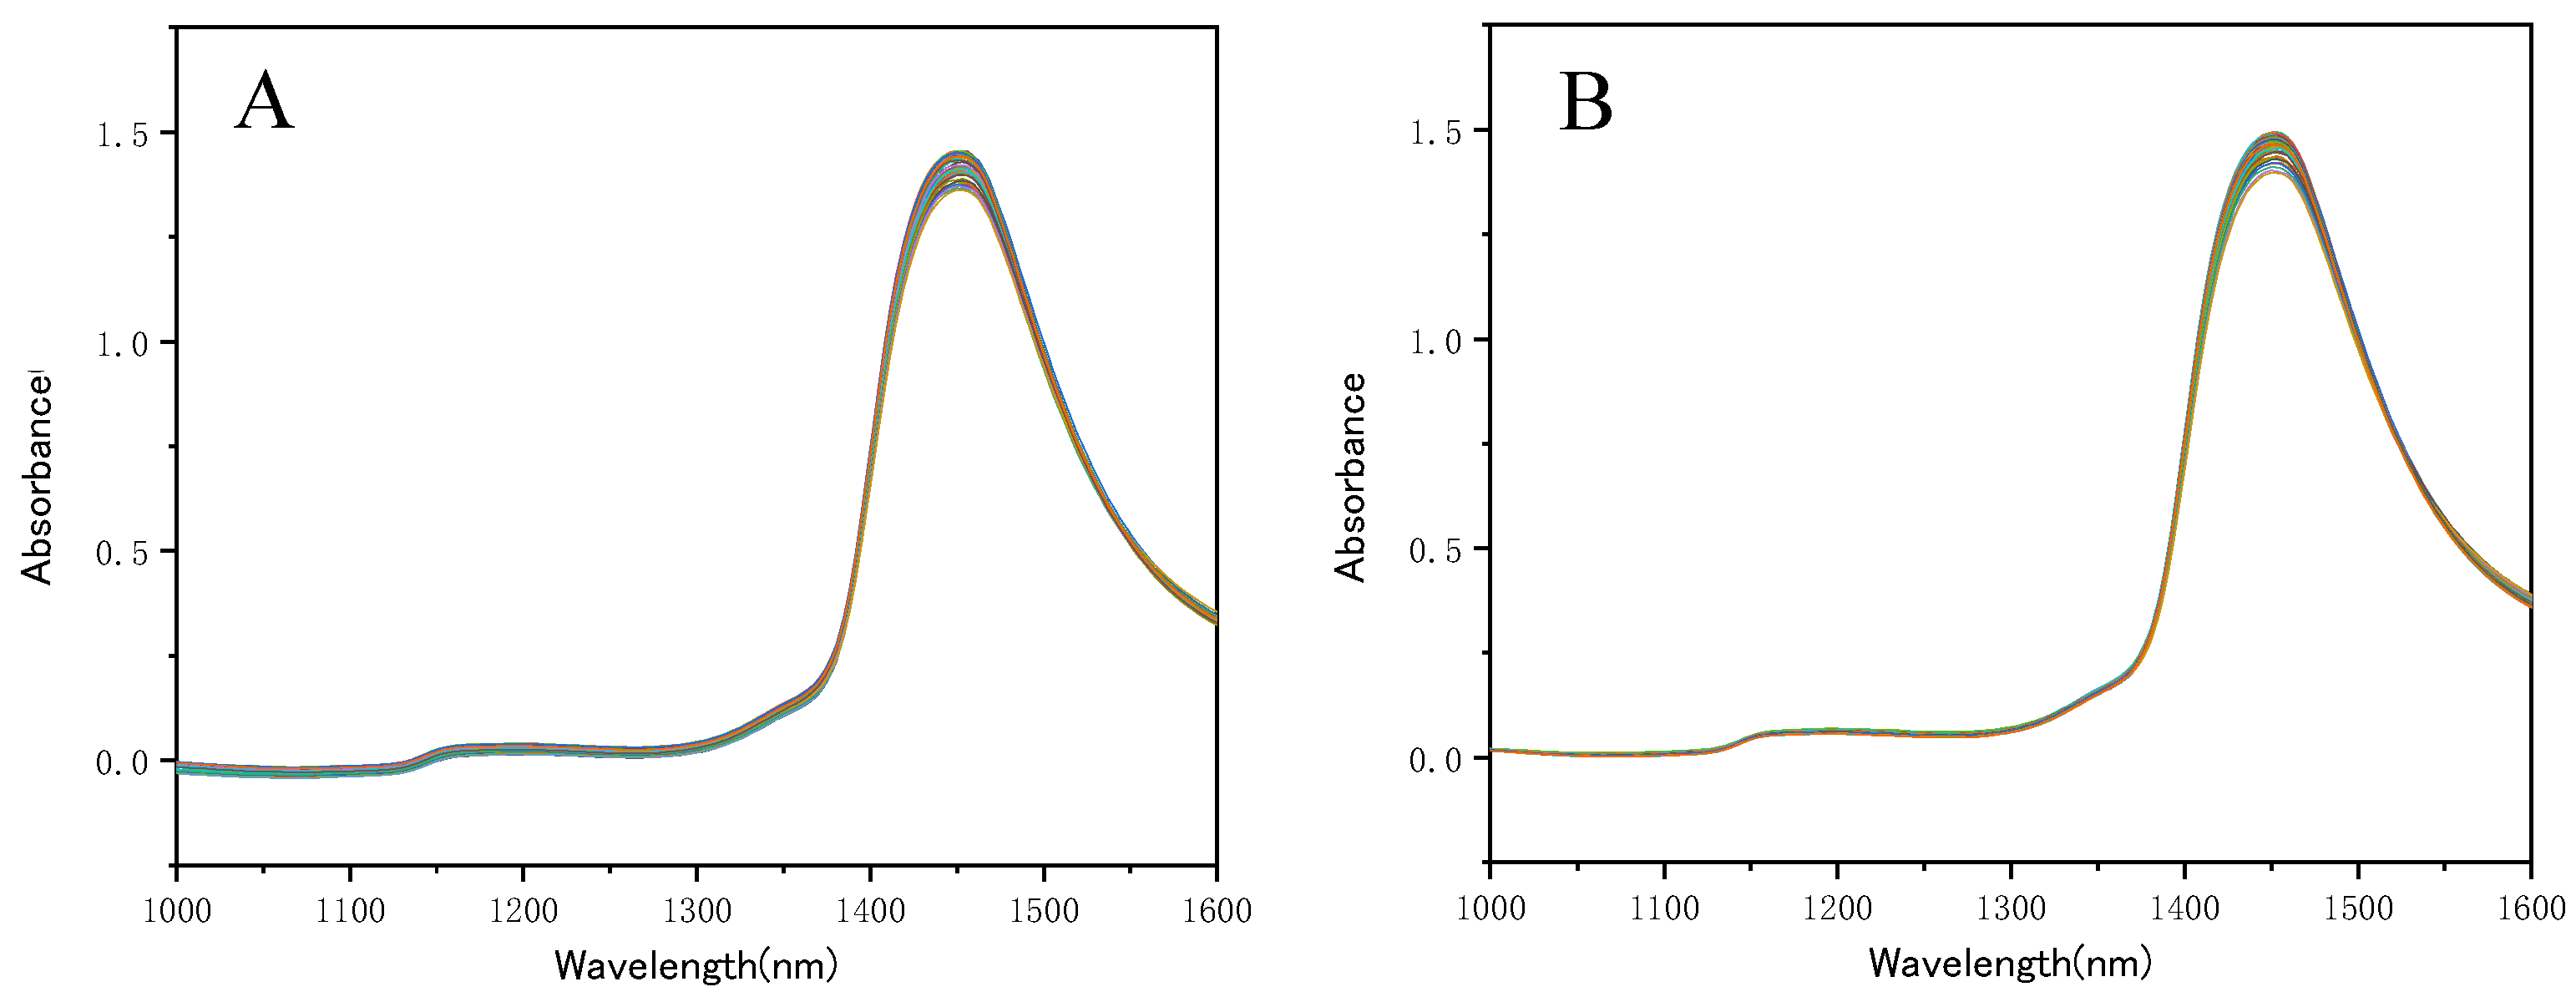
Results and Discussion
2.1.2. Water Extraction of Wolfberry
Materials and Methods
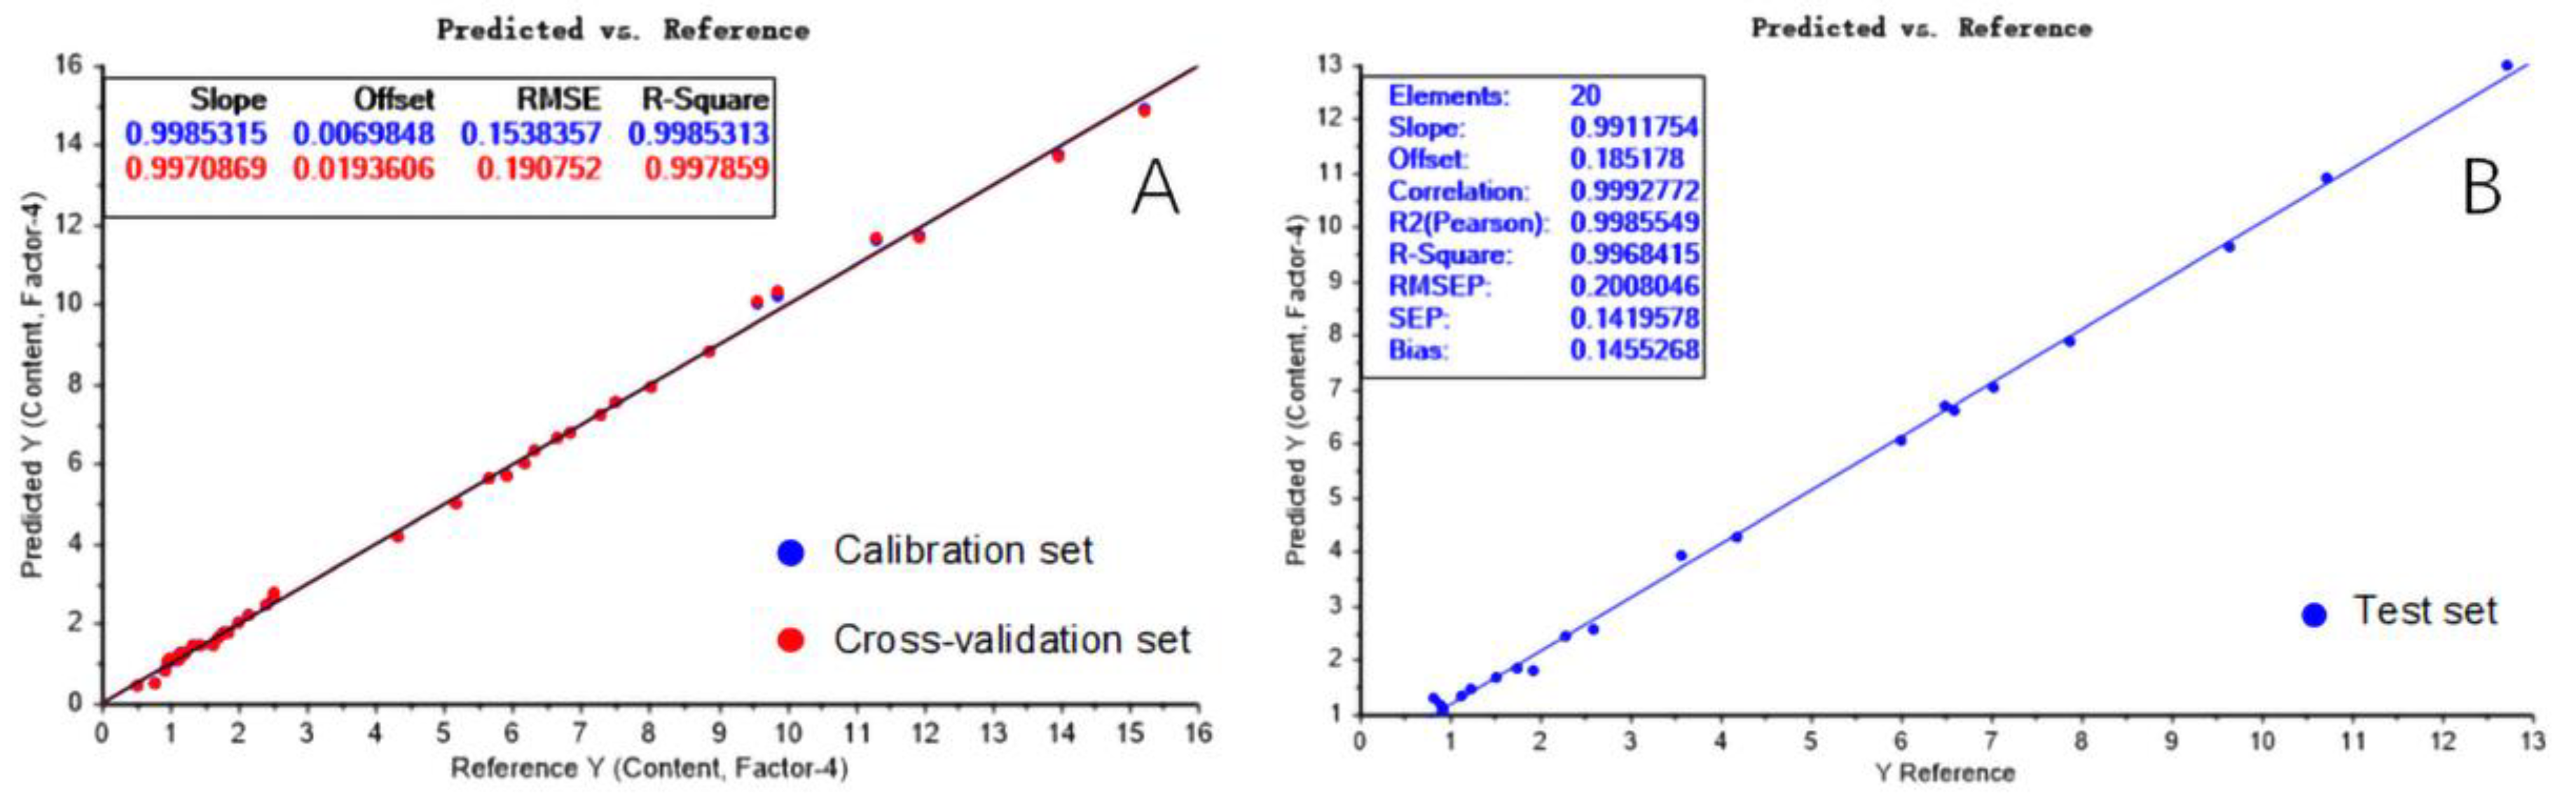
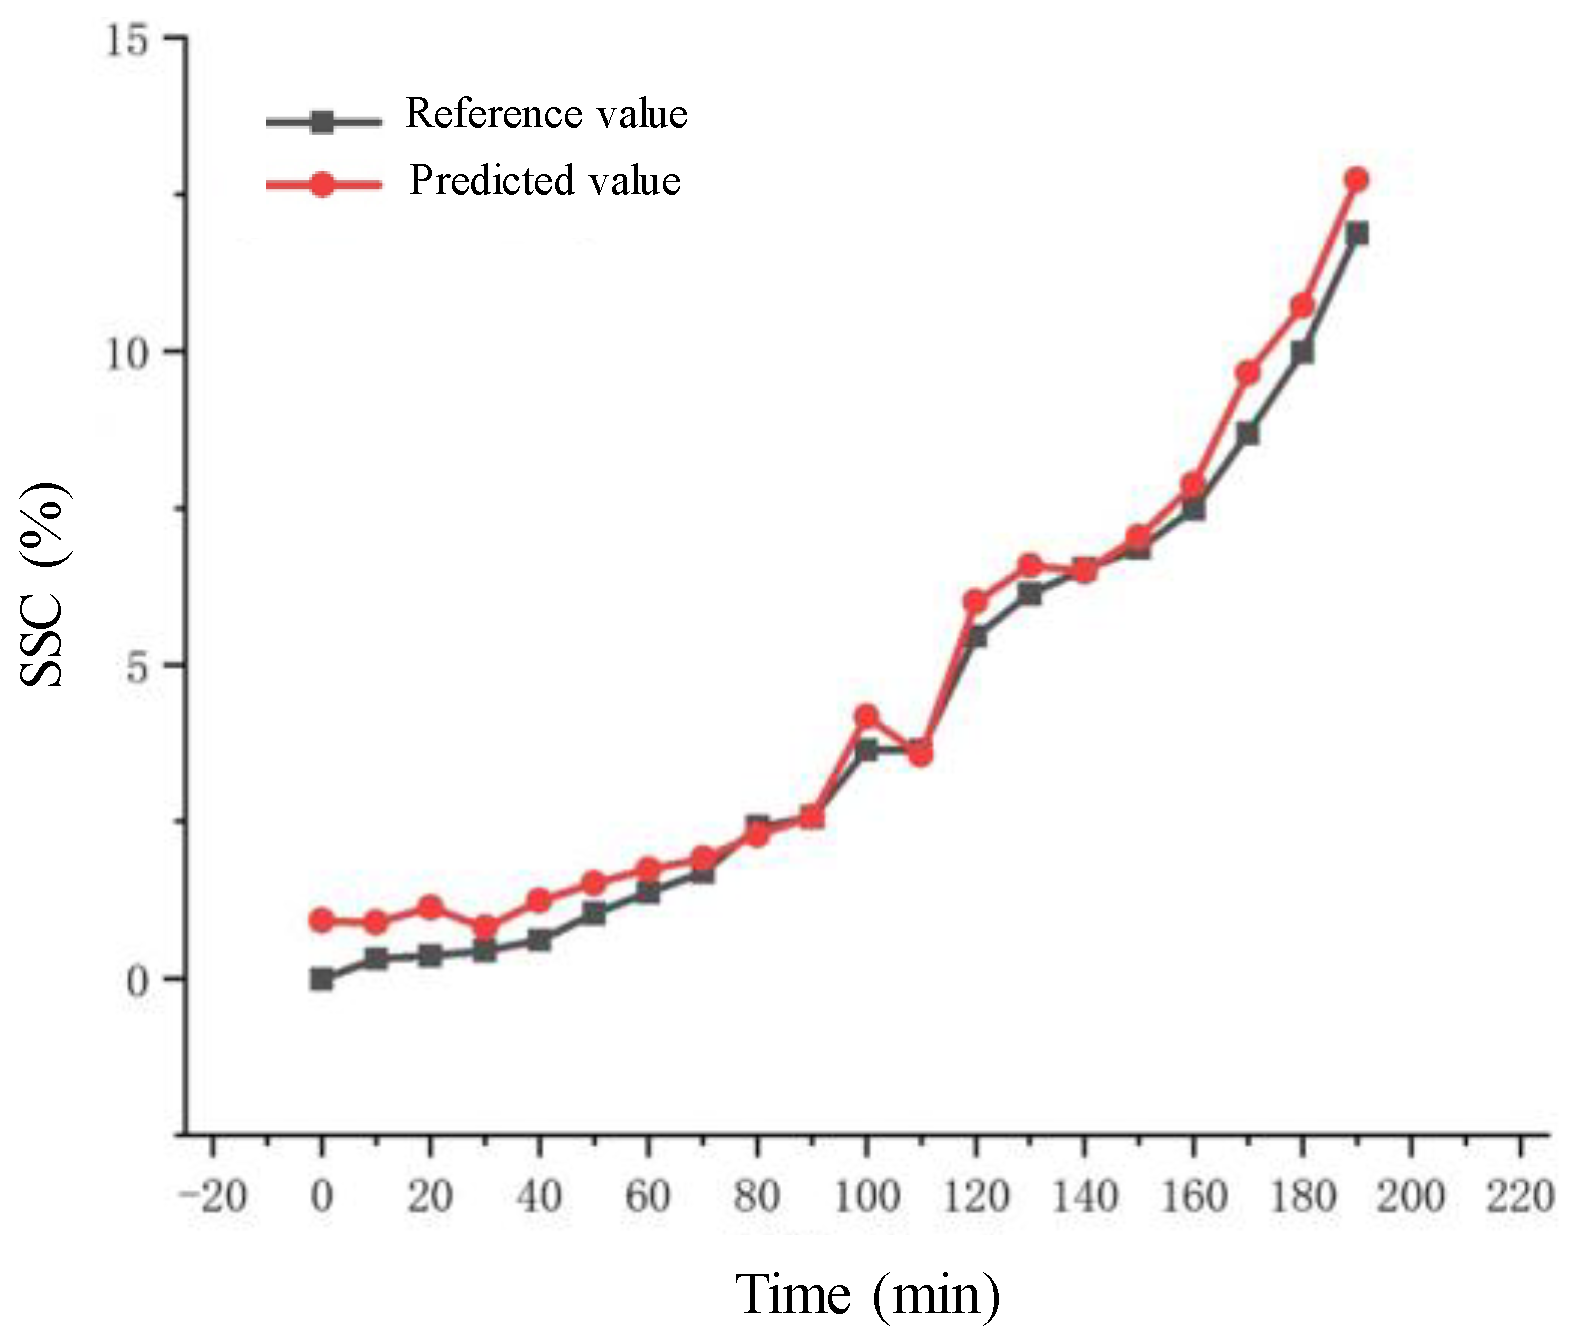
Results and Discussion
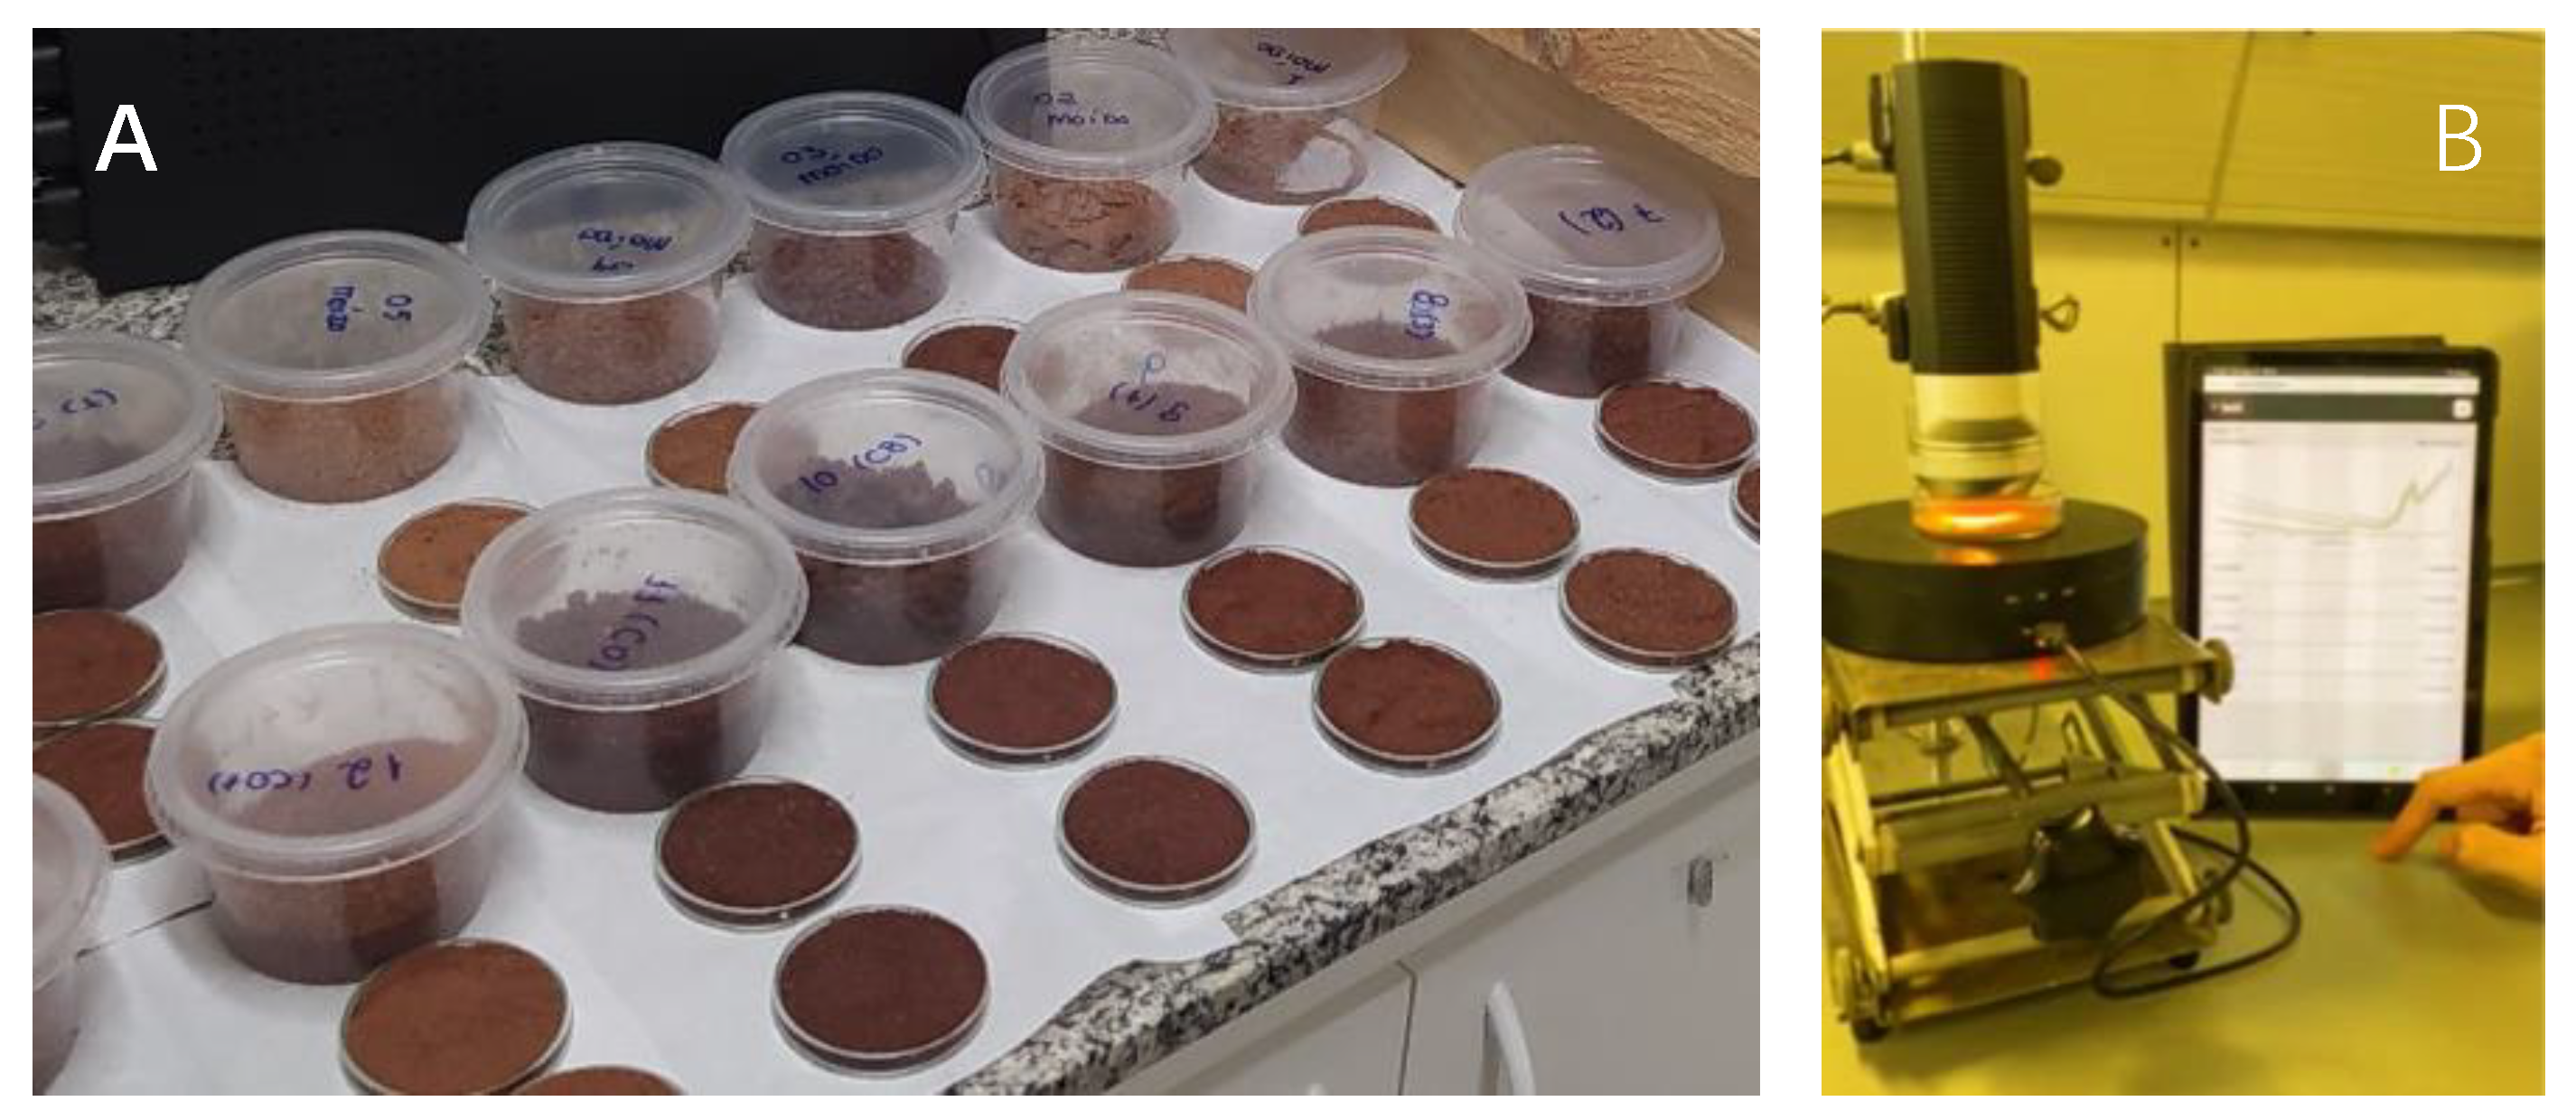
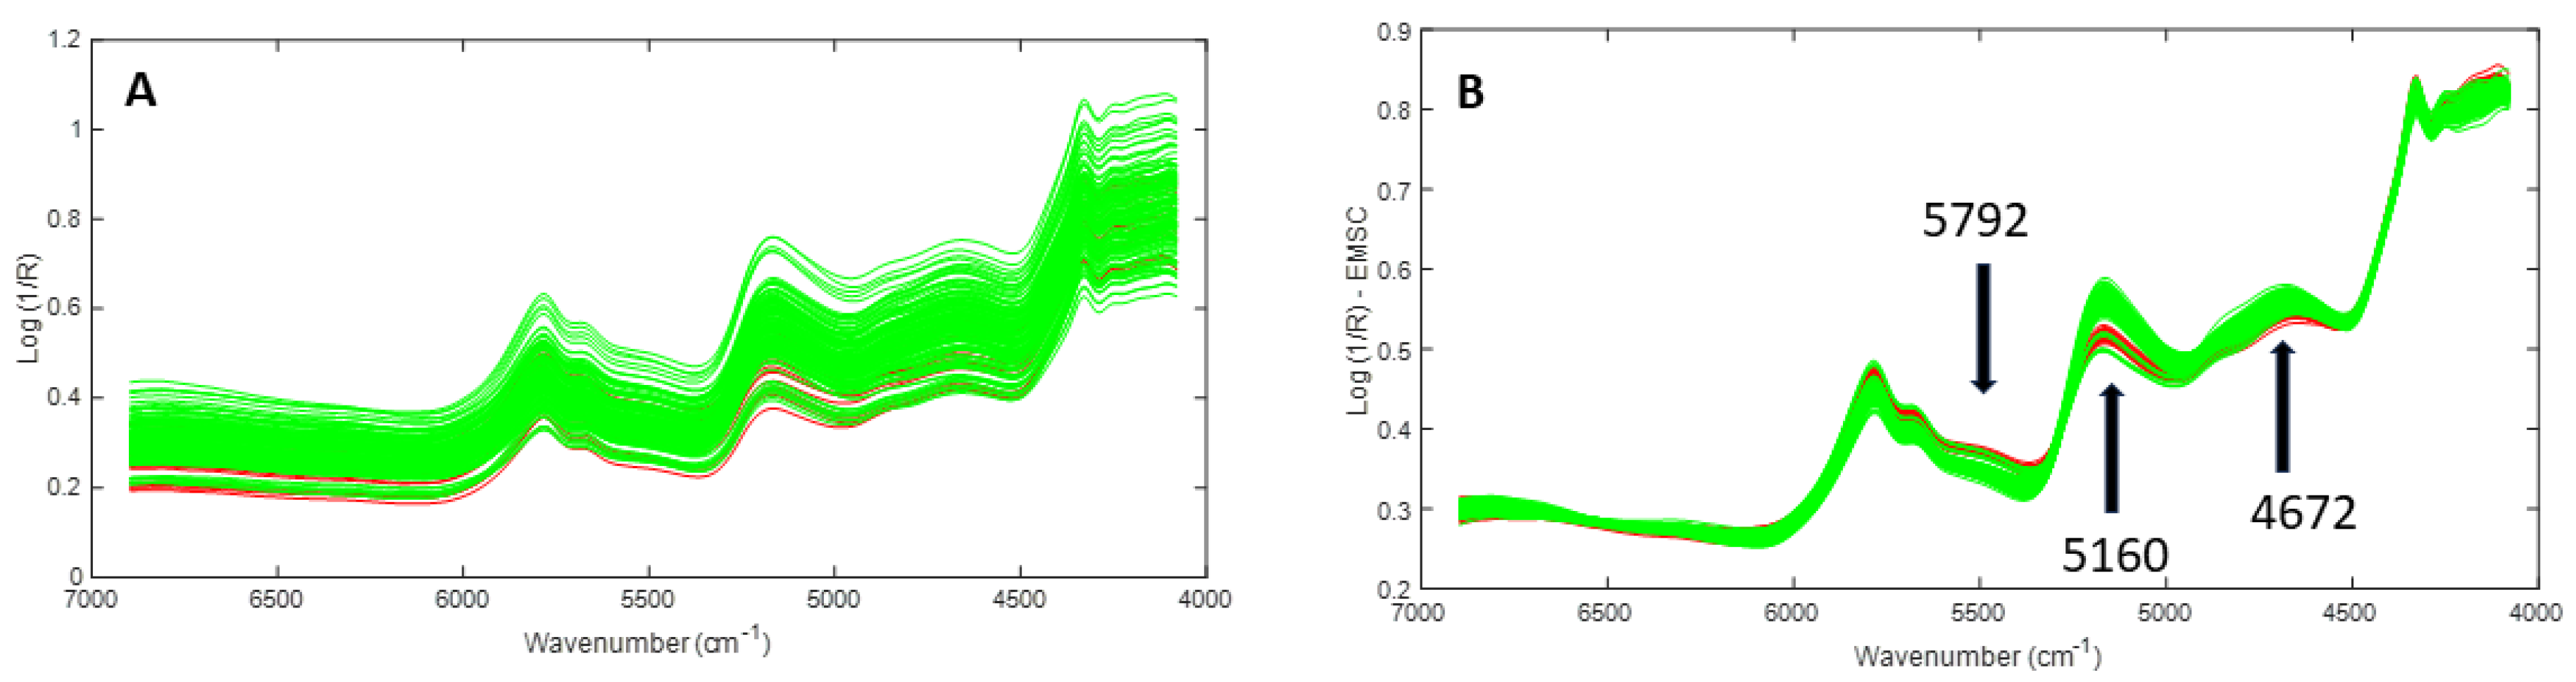
2.2. Differentiation of Cocoa Nibs and Cocoa Beans
2.2.1. Materials and Methods
2.2.2. Results and Discussion
3. Application of Raman Spectroscopic Imaging
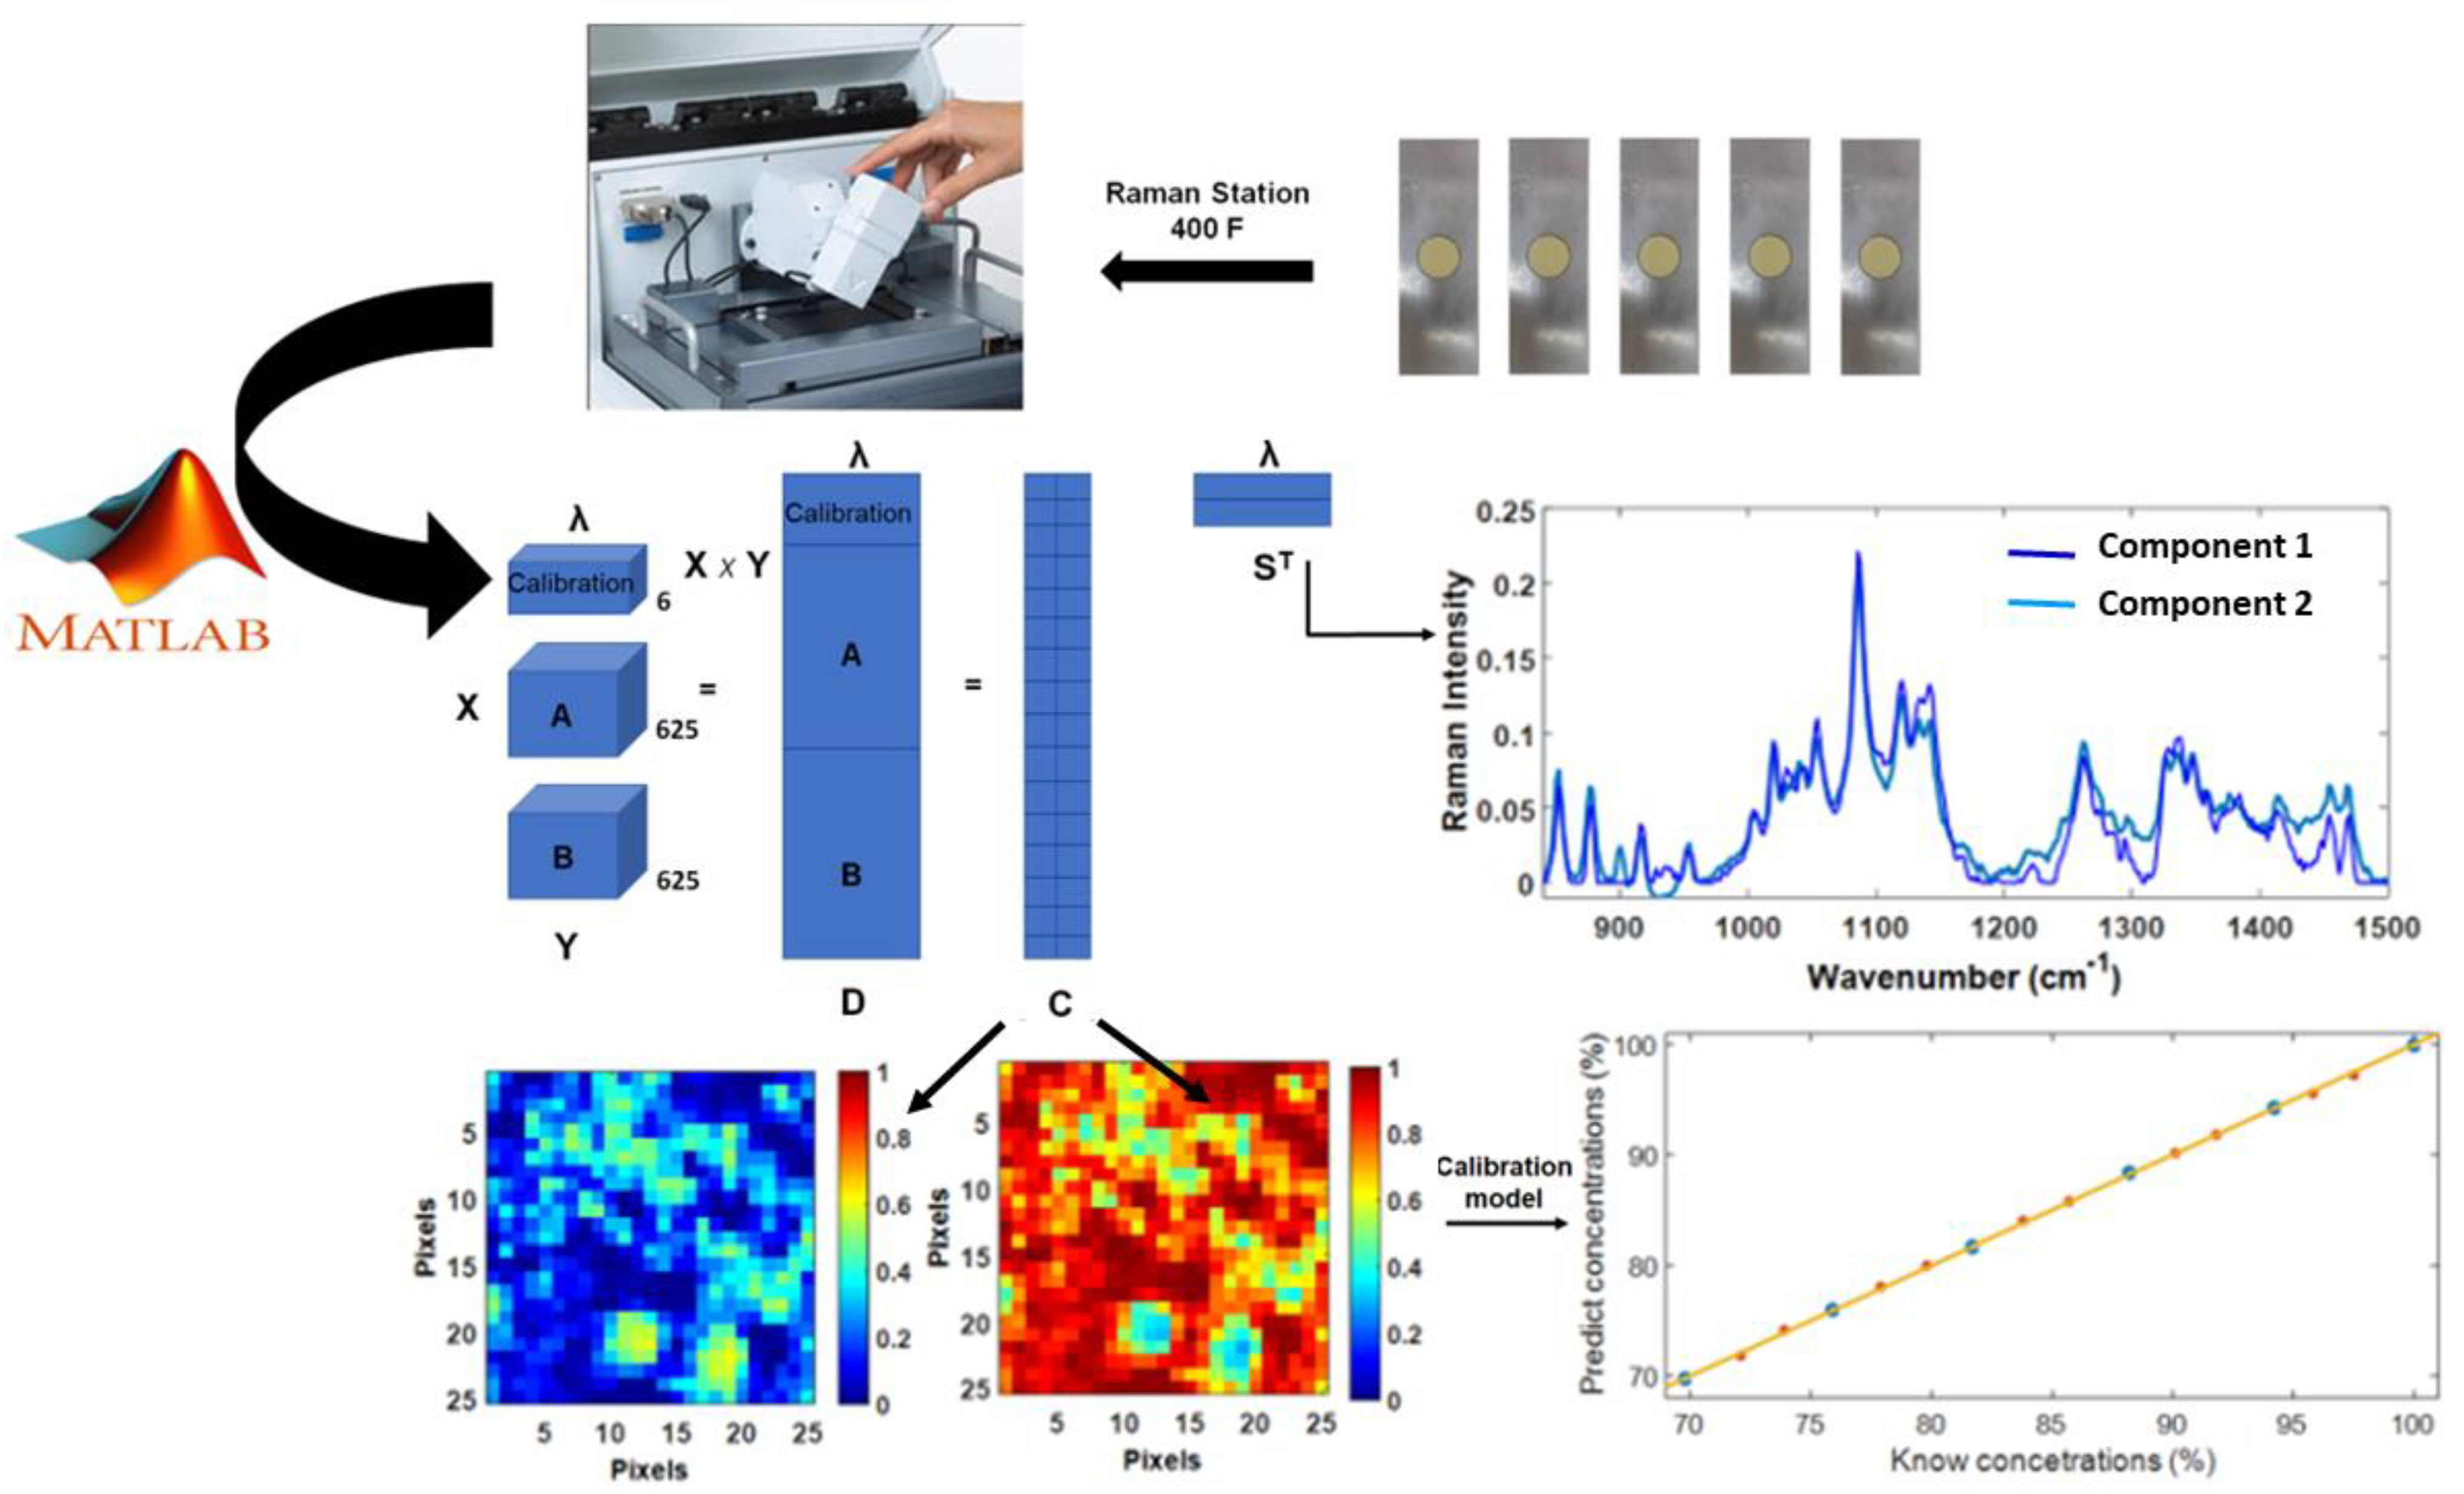
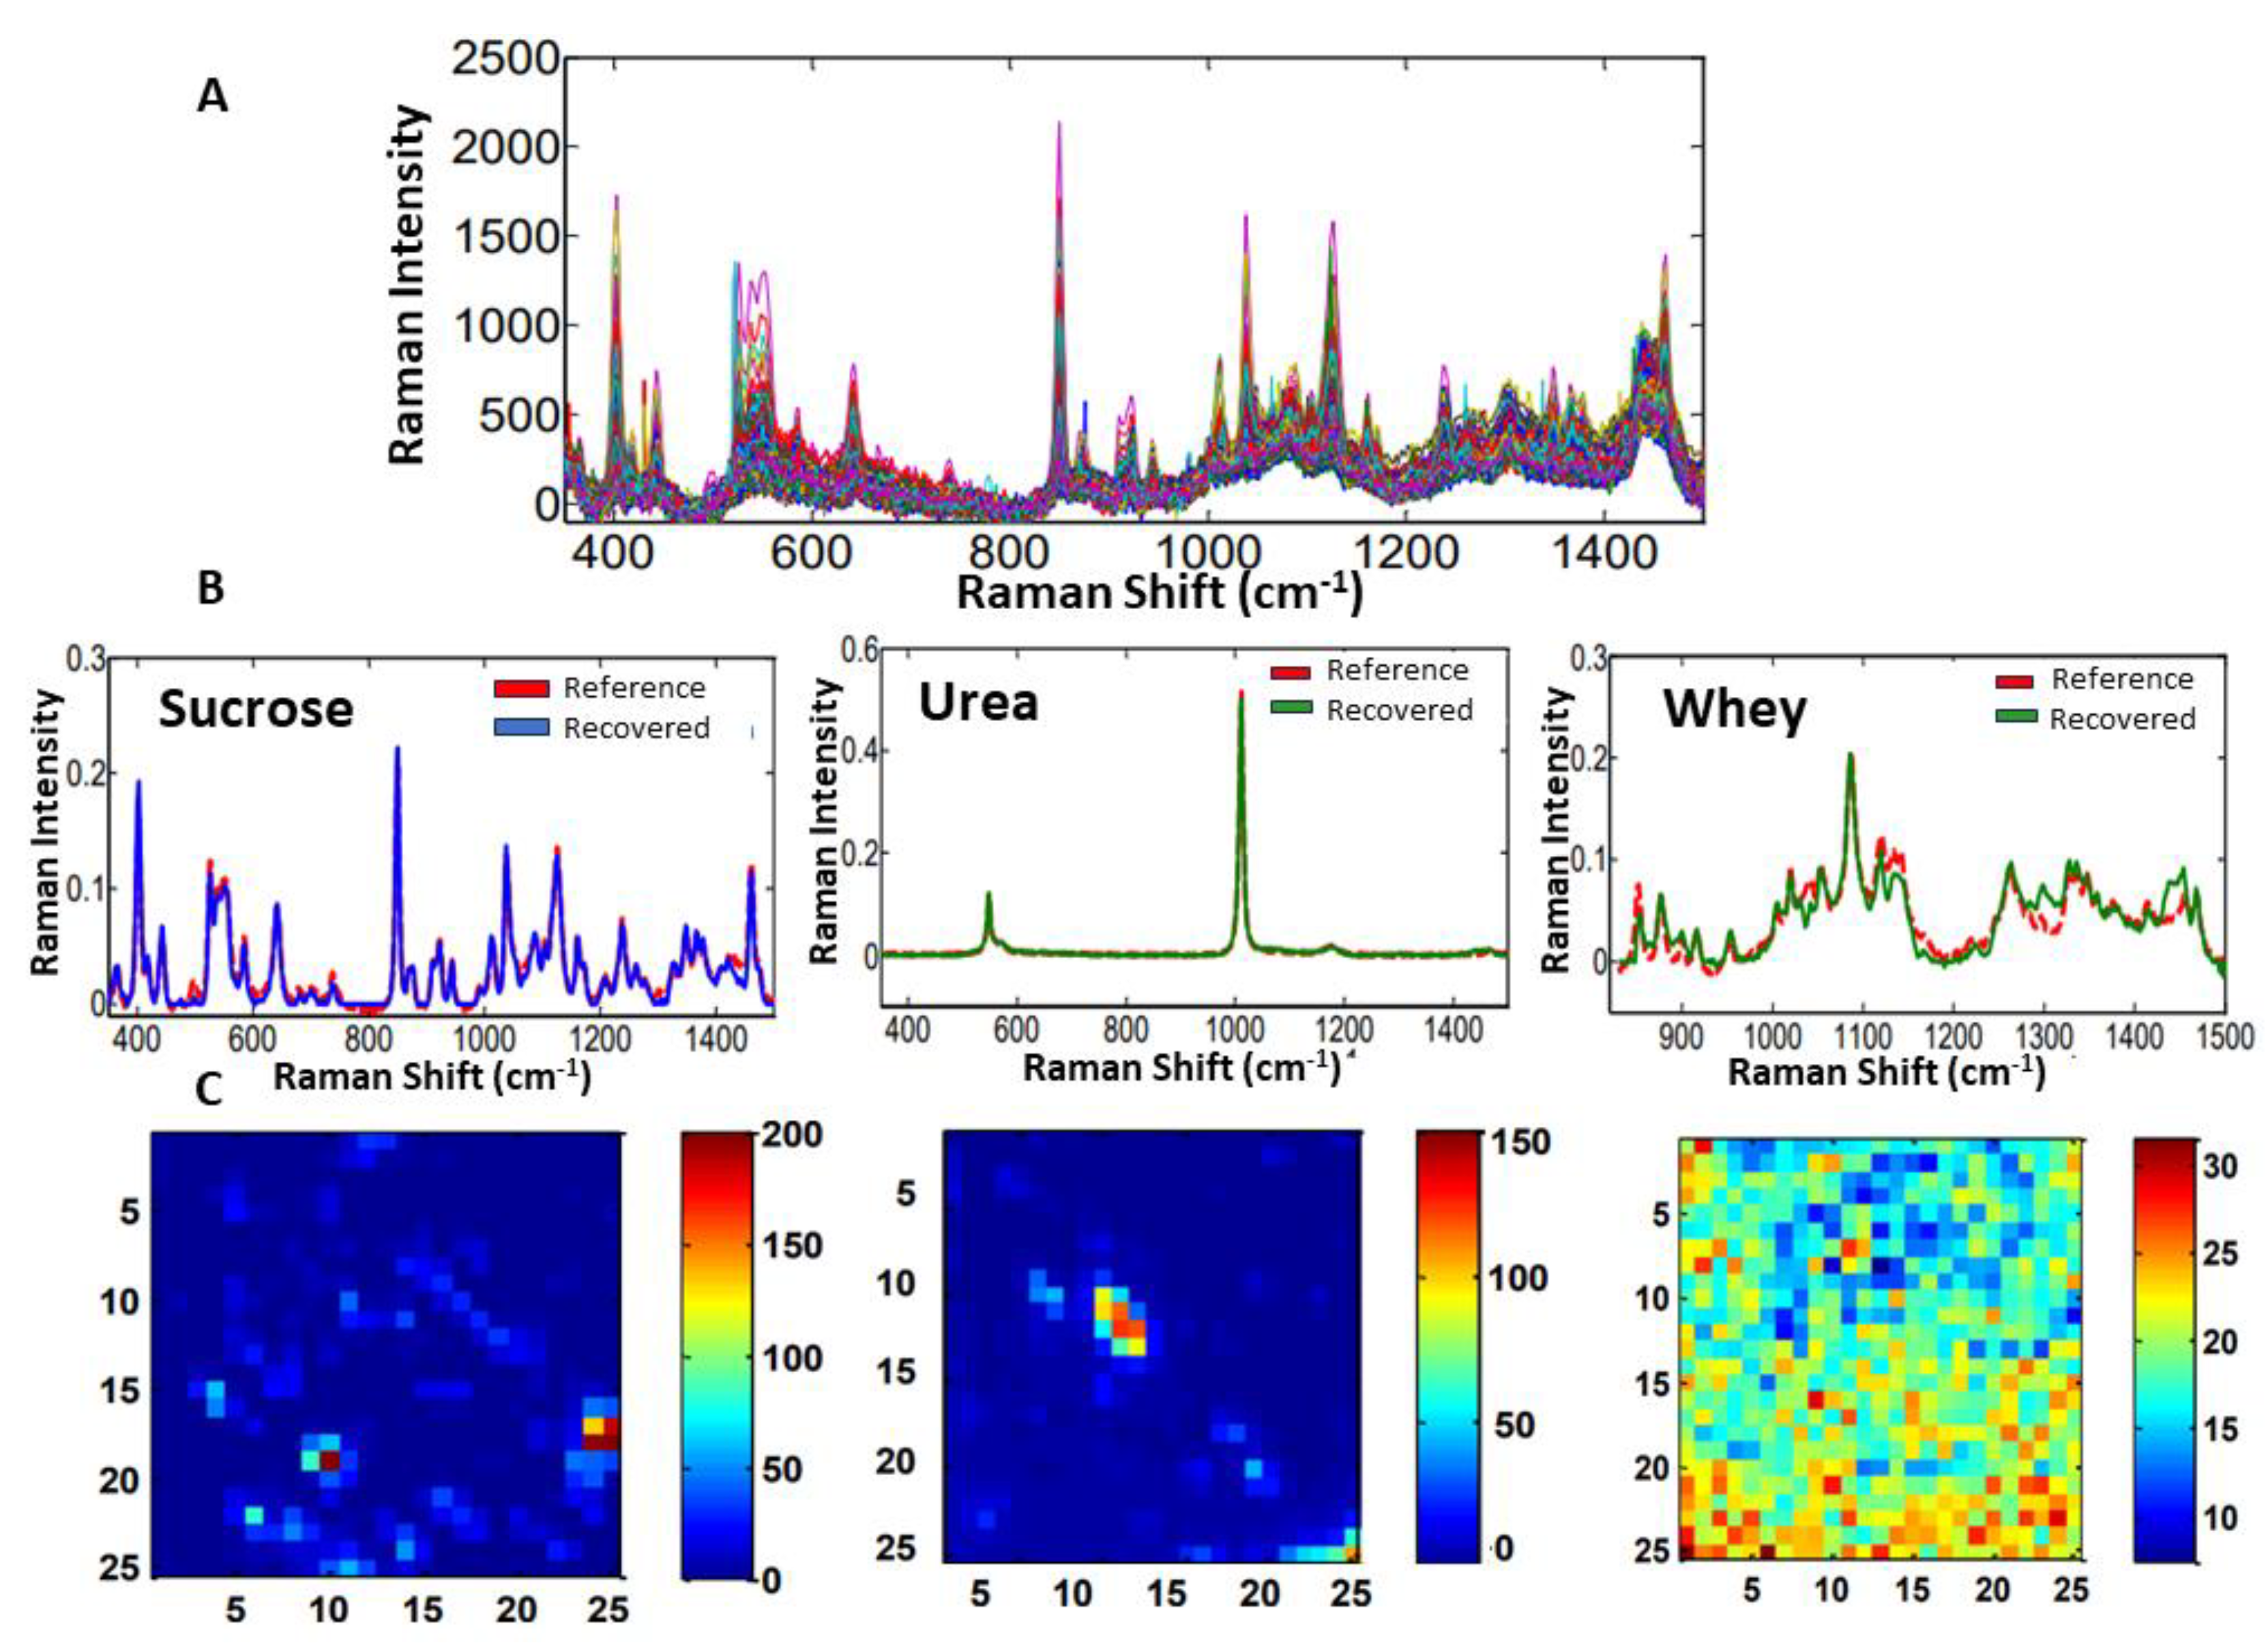
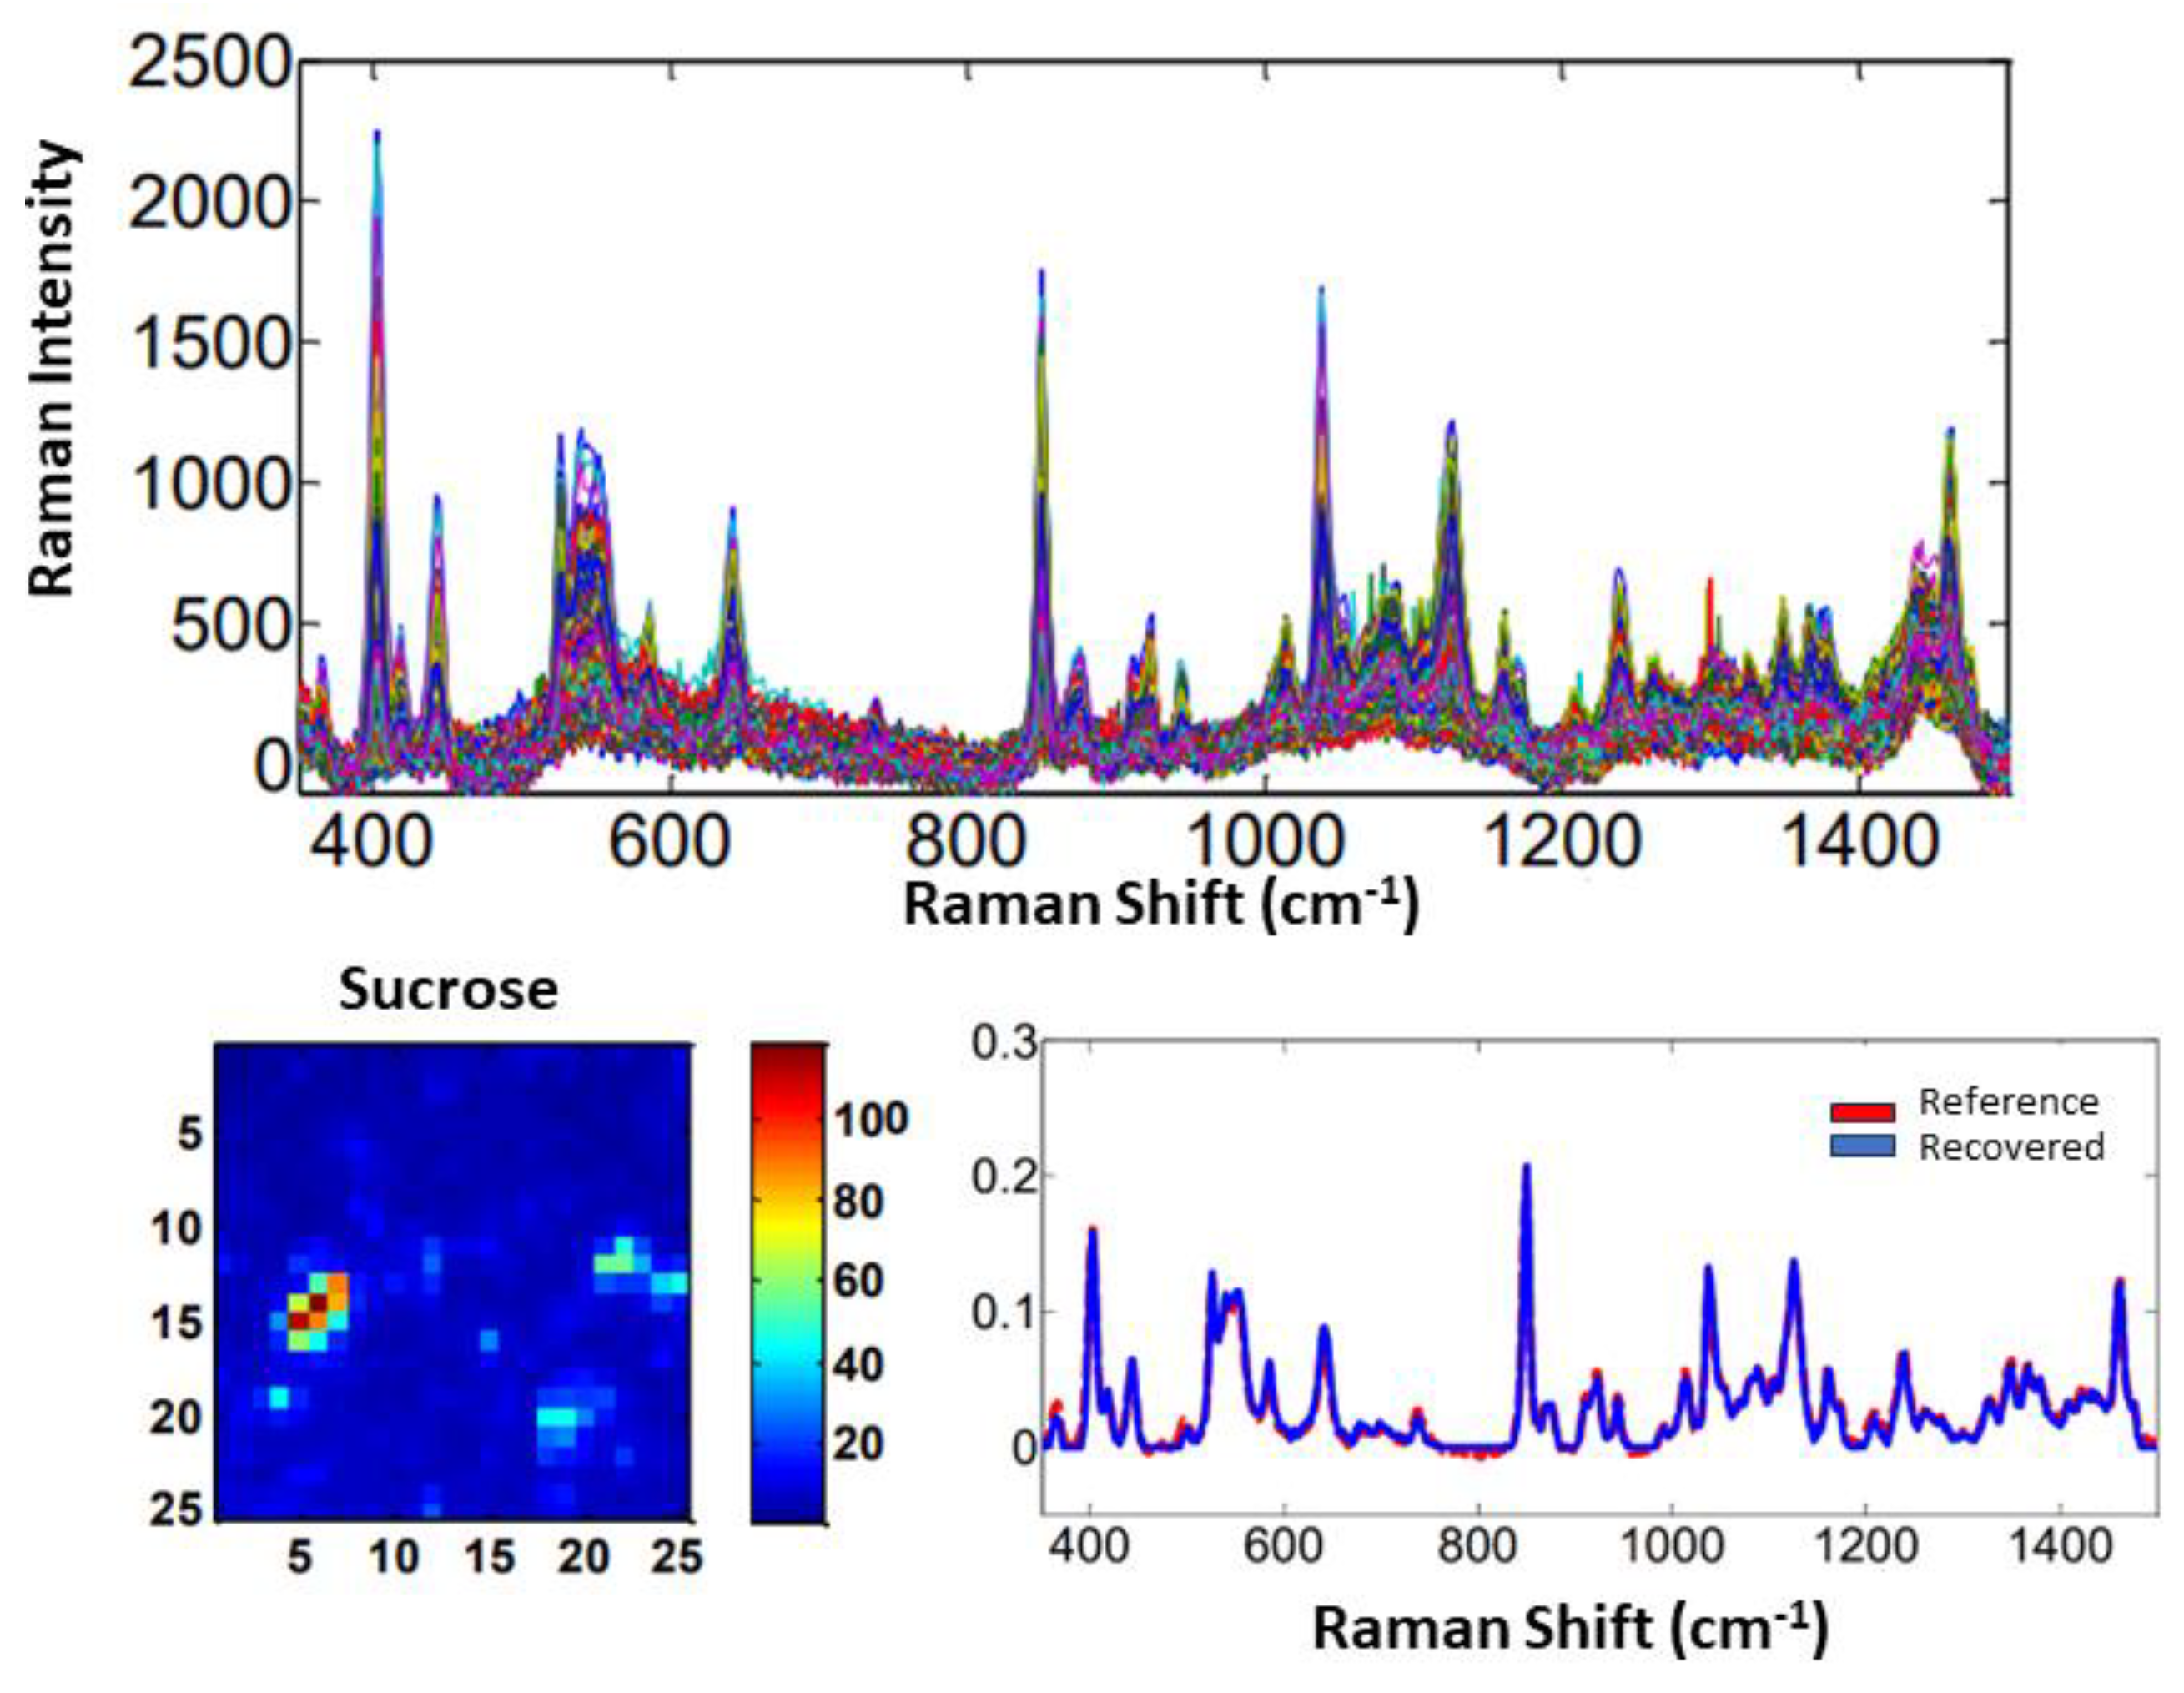
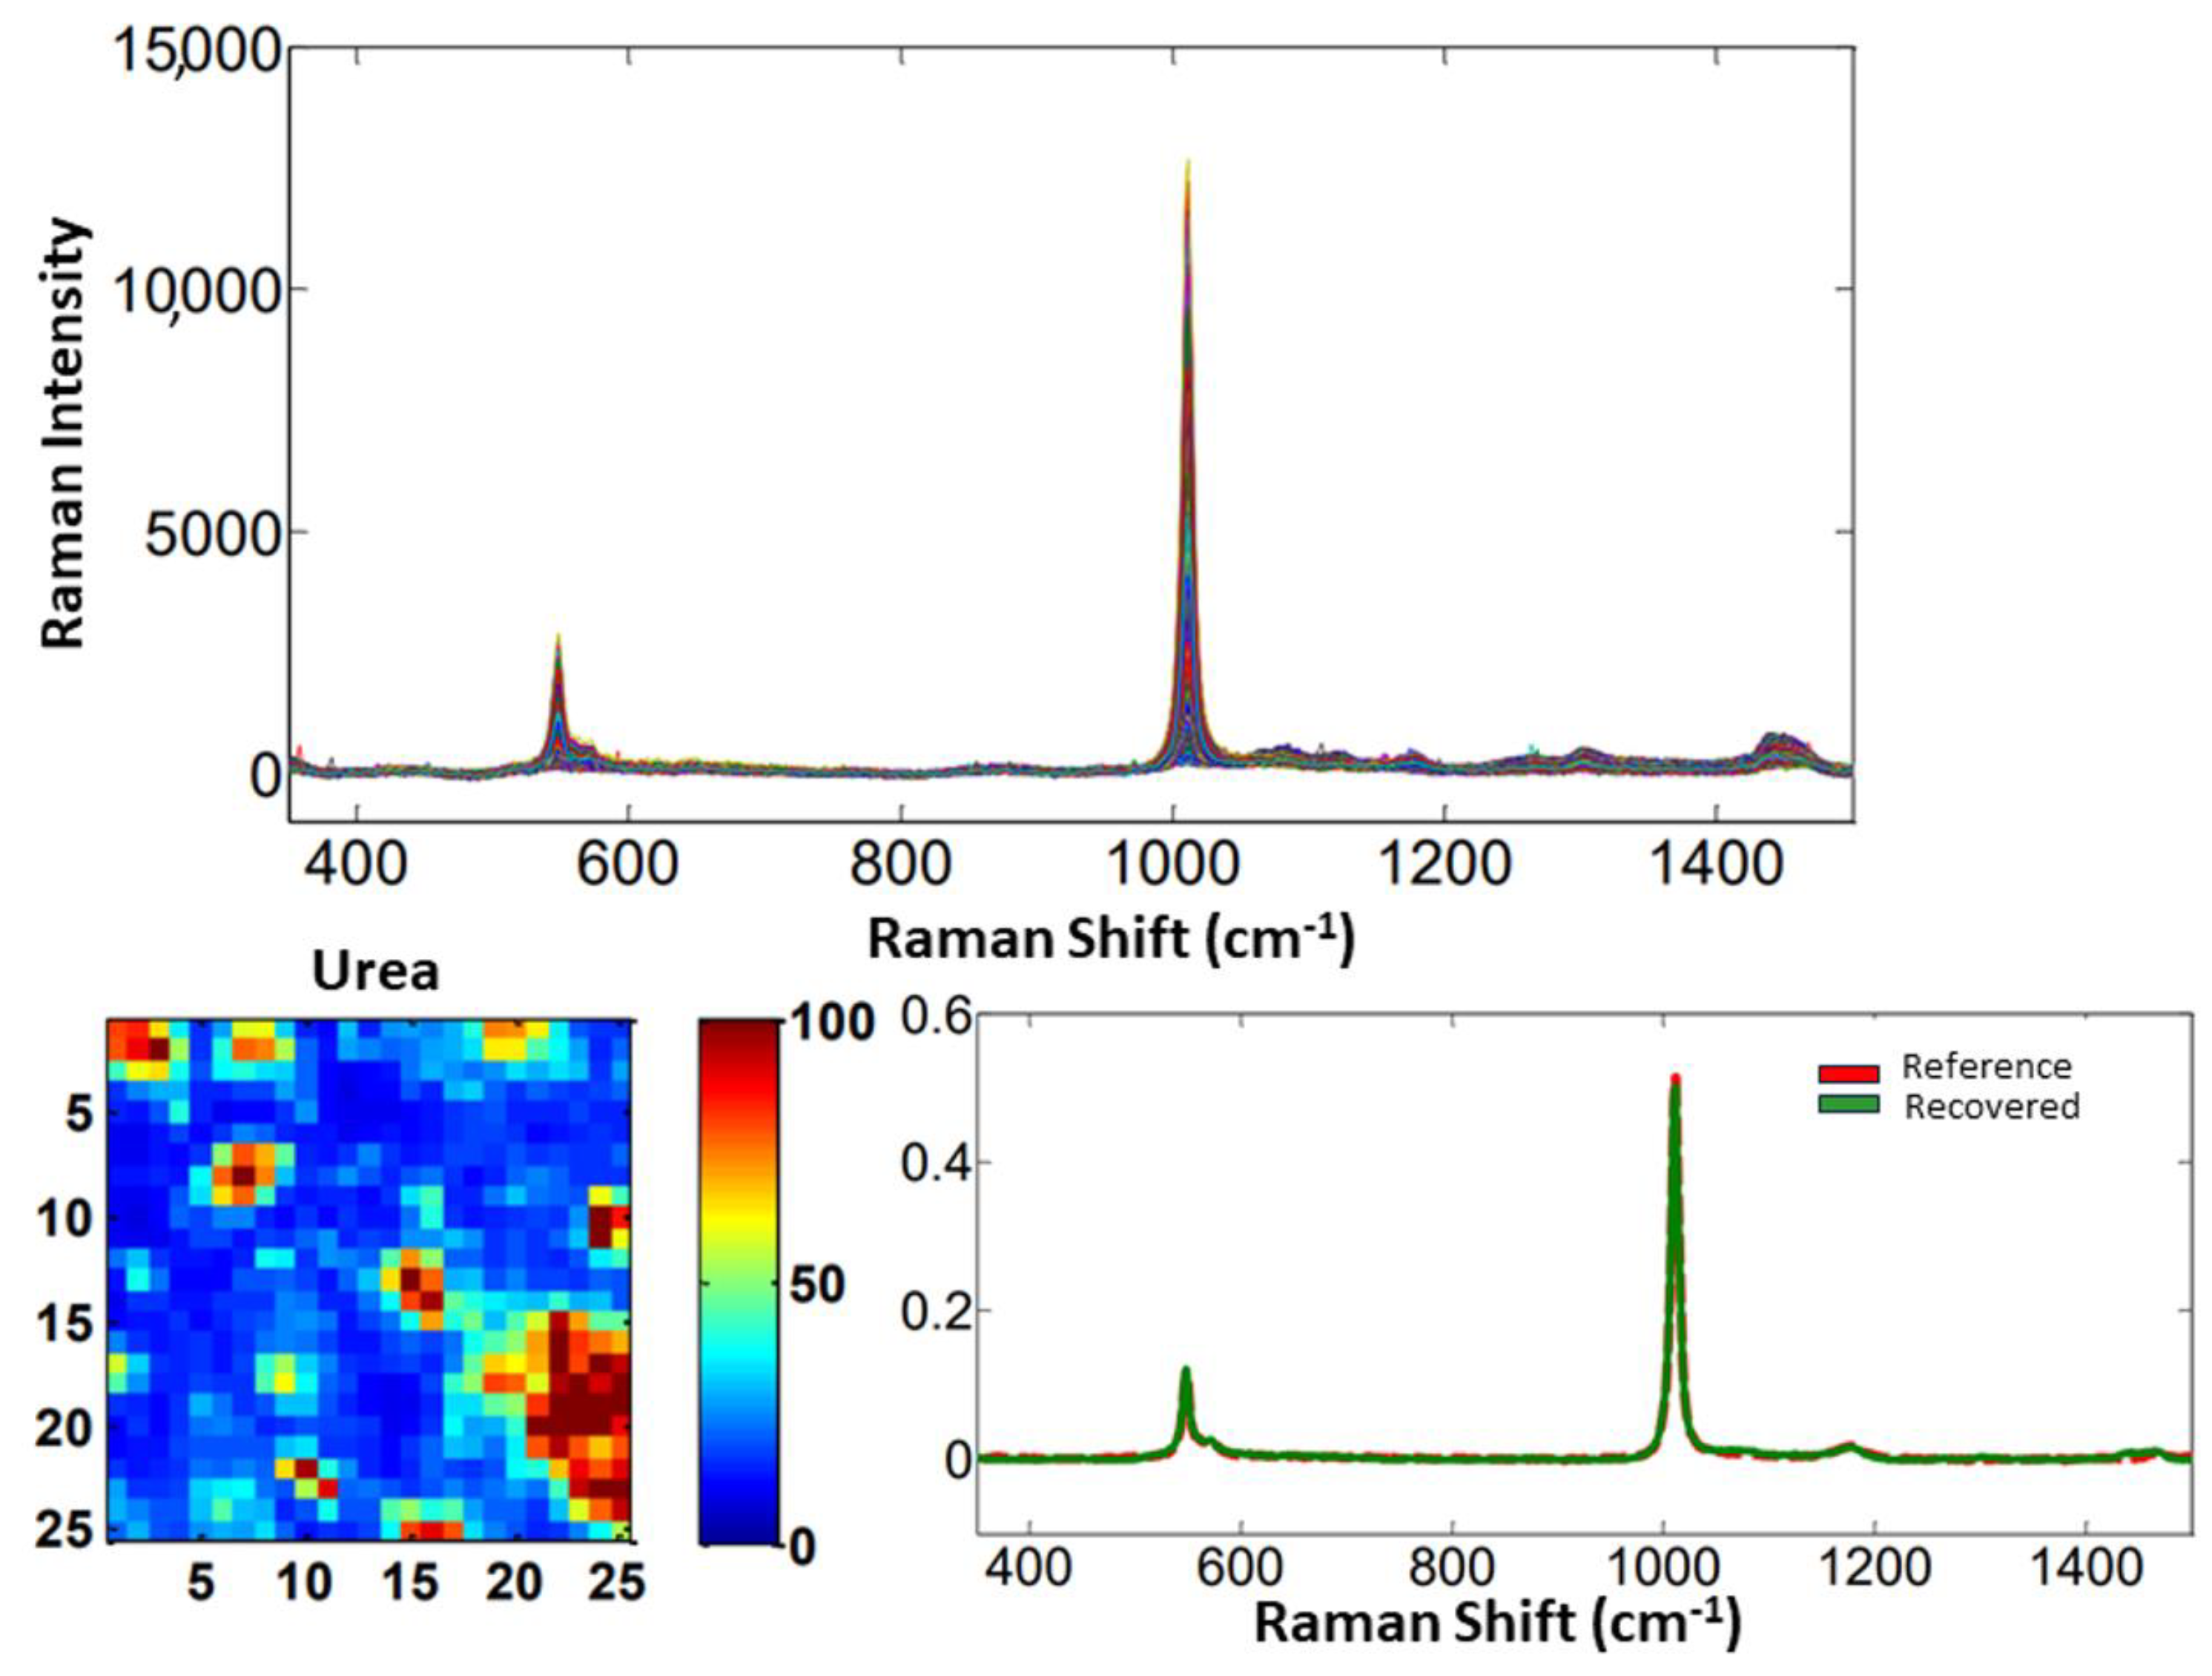
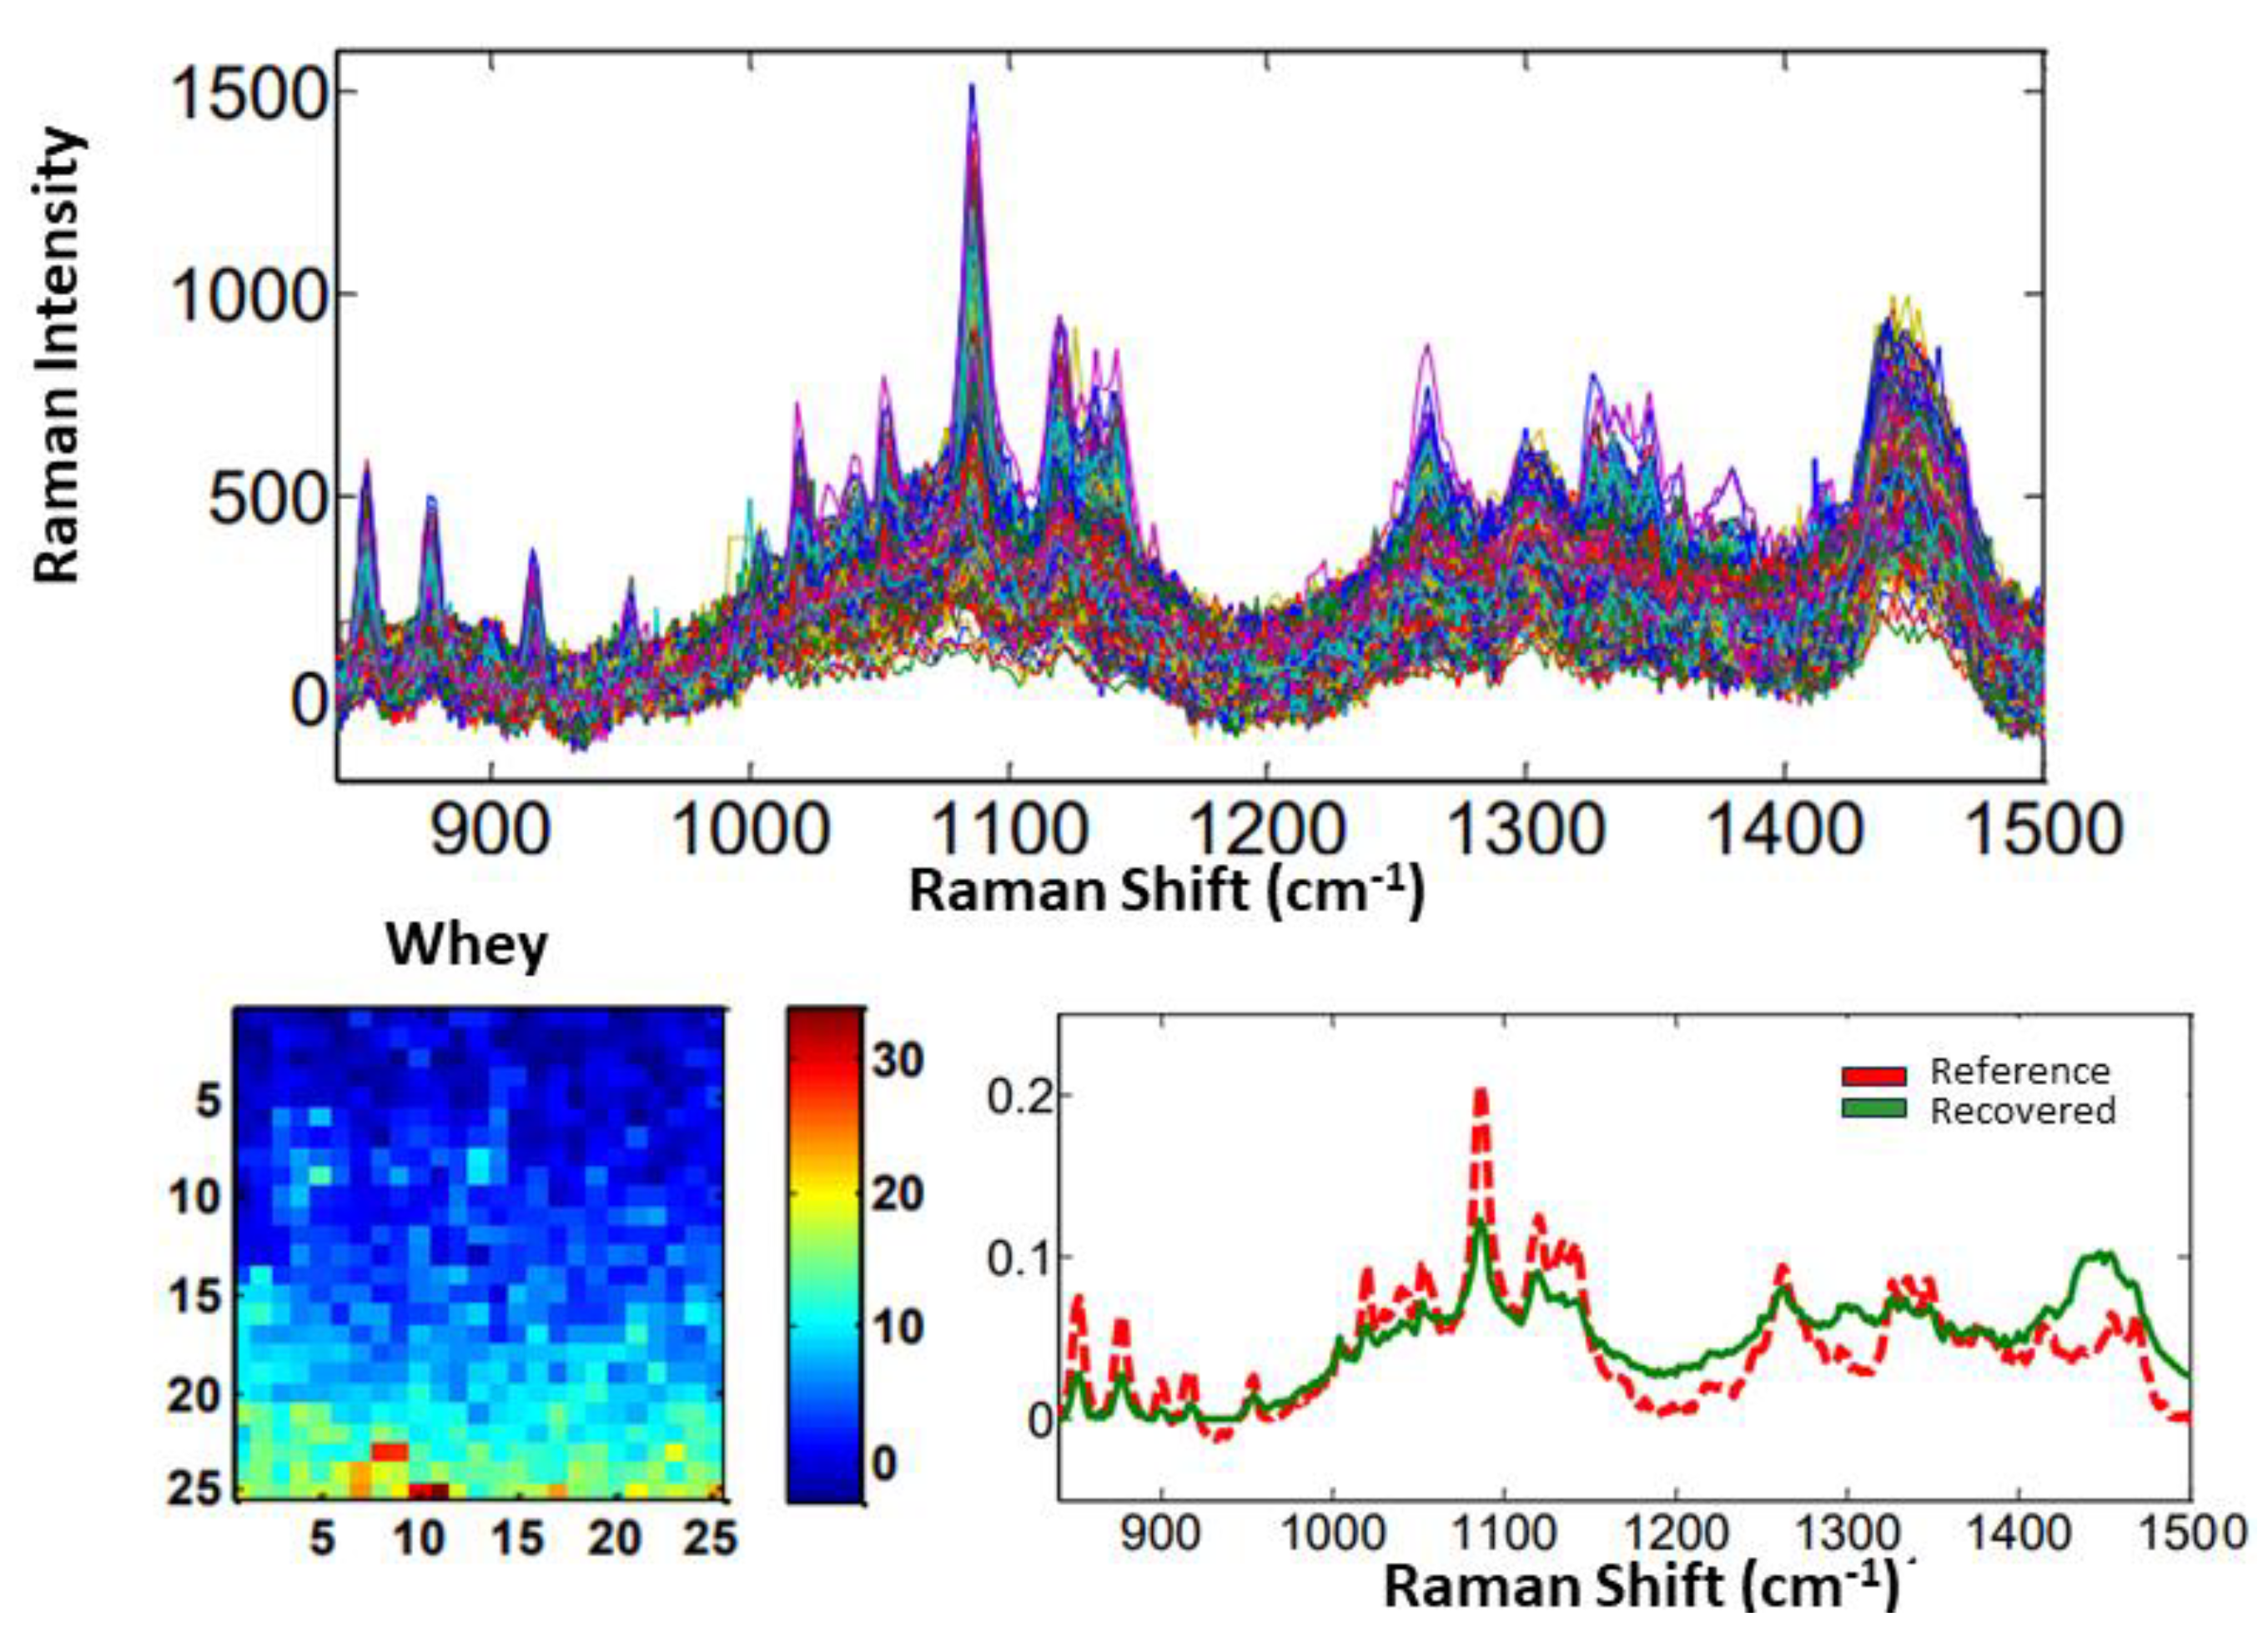
3.1. Identification and Quantification of Adulterations in Powdered Dairy Products
3.1.1. Materials and Methods
3.1.2. Results and Discussion
4. Conclusions
Author Contributions
Funding
Institutional Review Board Statement
Informed Consent Statement
Data Availability Statement
Conflicts of Interest
References
- Siesler, H.W.; Kawata, S.; Heise, H.M.; Ozaki, Y. Near-Infrared Spectroscopy: Principles, Instruments, Applications; John Wiley & Sons: Hoboken, NJ, USA, 2008. [Google Scholar]
- Burgess, C.; Hammond, J. Exploring the “forgotten” region—An update on NIR spectrometry. Spectrosc. Eur. 2009, 21, 28–31. [Google Scholar]
- Bellamy, L. The Infra-Red Spectra of Complex Molecules; Springer Science & Business Media: Berlin/Heidelberg, Germany, 2013. [Google Scholar]
- Beć, K.B.; Grabska, J.; Huck, C.W. Principles and applications of miniaturized near-infrared (NIR) spectrometers. Chem. Eur. J. 2021, 27, 1514–1532. [Google Scholar] [CrossRef] [PubMed]
- Huang, J.; Wen, Q.; Nie, Q.; Chang, F.; Zhou, Y.; Wen, Z. Miniaturized NIR spectrometer based on novel MOEMS scanning tilted grating. Micromachines 2018, 9, 478. [Google Scholar] [CrossRef] [PubMed]
- O’Brien, N.A.; Hulse, C.A.; Friedrich, D.M.; Van Milligen, F.J.; von Gunten, M.K.; Pfeifer, F.; Siesler, H.W. Miniature near-infrared (NIR) spectrometer engine for handheld applications. In Proceedings of the Next-Generation Spectroscopic Technologies V, Baltimore, MD, USA, 23–24 April 2012; pp. 31–38. [Google Scholar]
- Kumar, S.; McGlone, A.; Whitworth, C.; Volz, R. Postharvest performance of apple phenotypes predicted by near-infrared (NIR) spectral analysis. Postharvest Biol. Technol. 2015, 100, 16–22. [Google Scholar] [CrossRef]
- Wan, M.; Jin, X.; Han, Y.; Wang, L.; Li, S.; Rao, Y.; Zhang, X.; Gao, Q. A Stacking-Based Ensemble Learning Method for Available Nitrogen Soil Prediction with a Handheld Micronear-Infrared Spectrometer. J. Appl. Spectrosc. 2023, 89, 1241–1253. [Google Scholar] [CrossRef]
- Szuvandzsiev, P.; Helyes, L.; Lugasi, A.; Szántó, C.; Baranowski, P.; Pék, Z. Estimation of antioxidant components of tomato using VIS-NIR reflectance data by handheld portable spectrometer. Int. Agrophys. 2014, 28, 521–527. [Google Scholar] [CrossRef]
- Olarewaju, O.O.; Bertling, I.; Magwaza, L.S. Non-destructive evaluation of avocado fruit maturity using near infrared spectroscopy and PLS regression models. Sci. Hortic. 2016, 199, 229–236. [Google Scholar] [CrossRef]
- Langeron, Y.; Doussot, M.; Hewson, D.J.; Duchêne, J. Classifying NIR spectra of textile products with kernel methods. Eng. Appl. Artif. Intell. 2007, 20, 415–427. [Google Scholar] [CrossRef]
- Balabin, R.M.; Safieva, R.Z. Gasoline classification by source and type based on near infrared (NIR) spectroscopy data. Fuel 2008, 87, 1096–1101. [Google Scholar] [CrossRef]
- Yan, H.; Siesler, H.W. Identification Performance of Different Types of Handheld Near-Infrared (NIR) Spectrometers for the Recycling of Polymer Commodities. Appl. Spectrosc. 2018, 72, 1362–1370. [Google Scholar] [CrossRef]
- Eady, M.; Caison, J.; Jinnah, M.; Jenkins, D. A Rapid Qualitative Screening Method for Isoniazid Tablets Using Handheld NIR Spectrometers in Two Countries. Molecules 2023, 28, 4758. [Google Scholar] [CrossRef]
- Dou, Y.; Sun, Y.; Ren, Y.; Ju, P.; Ren, Y. Simultaneous non-destructive determination of two components of combined paracetamol and amantadine hydrochloride in tablets and powder by NIR spectroscopy and artificial neural networks. J. Pharm. Biomed. Anal. 2005, 37, 543–549. [Google Scholar] [CrossRef] [PubMed]
- Yan, H.; De Gea Neves, M.; Noda, I.; Guedes, G.M.; Silva Ferreira, A.C.; Pfeifer, F.; Chen, X.; Siesler, H.W. Handheld Near-Infrared Spectroscopy: State-of-the-Art Instrumentation and Applications in Material Identification, Food Authentication, and Environmental Investigations. Chemosensors 2023, 11, 272. [Google Scholar] [CrossRef]
- Miao, T.; Sihota, N.; Pfeifer, F.; McDaniel, C.; De Gea Neves, M.; Siesler, H.W. Rapid determination of the total petroleum hydrocarbon content of soils by handheld Fourier transform near-infrared spectroscopy. Anal. Chem. 2023, 95, 6888–6893. [Google Scholar] [CrossRef] [PubMed]
- De Juan, A.; Jaumot, J.; Tauler, R. Multivariate Curve Resolution (MCR). Solving the mixture analysis problem. Anal. Methods 2014, 6, 4964–4976. [Google Scholar] [CrossRef]
- Lohumi, S.; Lee, H.; Kim, M.S.; Qin, J.; Cho, B.-K. Raman hyperspectral imaging and spectral similarity analysis for quantitative detection of multiple adulterants in wheat flour. Biosyst. Eng. 2019, 181, 103–113. [Google Scholar] [CrossRef]
- Wang, K.; Li, Z.; Li, J.; Lin, H. Raman spectroscopic techniques for nondestructive analysis of agri-foods: A state-of-the-art review. Trends Food Sci. Technol. 2021, 118, 490–504. [Google Scholar] [CrossRef]
- Eksi-Kocak, H.; Mentes-Yilmaz, O.; Boyaci, I.H. Detection of green pea adulteration in pistachio nut granules by using Raman hyperspectral imaging. Eur. Food Res. Technol. 2016, 242, 271–277. [Google Scholar] [CrossRef]
- Jiang, H.; Wang, W.; Zhuang, H.; Yoon, S.-C.; Yang, Y.; Zhao, X. Hyperspectral imaging for a rapid detection and visualization of duck meat adulteration in beef. Food Anal. Methods 2019, 12, 2205–2215. [Google Scholar] [CrossRef]
- Song, S.; Liu, Z.; Huang, M.; Zhu, Q.; Qin, J.; Kim, M.S. Detection of fish bones in fillets by Raman hyperspectral imaging technology. J. Food Eng. 2020, 272, 109808. [Google Scholar] [CrossRef]
- Pu, H.; Lin, L.; Sun, D.W. Principles of hyperspectral microscope imaging techniques and their applications in food quality and safety detection: A review. Compr. Rev. Food Sci. Food Saf. 2019, 18, 853–866. [Google Scholar] [CrossRef] [PubMed]
- Pathmanaban, P.; Gnanavel, B.; Anandan, S.S. Recent application of imaging techniques for fruit quality assessment. Trends Food Sci. Technol. 2019, 94, 32–42. [Google Scholar] [CrossRef]
- Petersen, M.; Yu, Z.; Lu, X. Application of Raman spectroscopic methods in food safety: A review. Biosensors 2021, 11, 187. [Google Scholar] [CrossRef]
- Martins, F.C.; Sentanin, M.A.; De Souza, D. Analytical methods in food additives determination: Compounds with functional applications. Food Chem. 2019, 272, 732–750. [Google Scholar] [CrossRef] [PubMed]
- Singh, M.; Mohan, R.; Mishra, S.; Goyal, N.; Shanker, K.; Gupta, N.; Kumar, B. Ultra performance liquid chromatography coupled with principal component and cluster analysis of Swertia chirayita for adulteration check. J. Pharm. Biomed. Anal. 2019, 164, 302–308. [Google Scholar] [CrossRef]
- Wang, T.; Chen, J.; Fan, Y.; Qiu, Z.; He, Y. SeeFruits: Design and evaluation of a cloud-based ultra-portable NIRS system for sweet cherry quality detection. Comput. Electron. Agric. 2018, 152, 302–313. [Google Scholar] [CrossRef]
- Prieto, N.; Pawluczyk, O.; Dugan, M.E.R.; Aalhus, J.L. A Review of the Principles and Applications of Near-Infrared Spectroscopy to Characterize Meat, Fat, and Meat Products. Appl. Spectrosc. 2017, 71, 1403–1426. [Google Scholar] [CrossRef]
- Basri, K.N.; Hussain, M.N.; Bakar, J.; Sharif, Z.; Khir, M.F.A.; Zoolfakar, A.S. Classification and quantification of palm oil adulteration via portable NIR spectroscopy. Spectrochim. Acta Part A 2017, 173, 335–342. [Google Scholar] [CrossRef]
- Nascimento Marques, E.J.; de Freitas, S.T.; Pimentel, M.F.; Pasquini, C. Rapid and non-destructive determination of quality parameters in the ‘Tommy Atkins’ mango using a novel handheld near infrared spectrometer. Food Chem. 2016, 197, 1207–1214. [Google Scholar] [CrossRef]
- Sedjoah, R.-C.A.-A.; Ma, Y.; Xiong, M.; Yan, H. Fast monitoring total acids and total polyphenol contents in fermentation broth of mulberry vinegar using MEMS and optical fiber near-infrared spectrometers. Spectrochim. Acta Part A 2021, 260, 119938. [Google Scholar] [CrossRef]
- Dos Santos, C.A.T.; Lopo, M.; Páscoa, R.N.; Lopes, J.A. A review on the applications of portable near-infrared spectrometers in the agro-food industry. Appl. Spectrosc. 2013, 67, 1215–1233. [Google Scholar] [CrossRef] [PubMed]
- Chen, X.; Siesler, H.W.; Yan, H. Rapid analysis of wheat flour by different handheld near-infrared spectrometers: A discussion of calibration model maintenance and performance comparison. Spectrochim. Acta Part A 2021, 252, 119504. [Google Scholar] [CrossRef] [PubMed]
- Neves, M.D.G.; Noda, I.; Siesler, H.W. Investigation of bread staling by handheld NIR spectroscopy in tandem with 2D-COS and MCR-ALS analysis. Microchem. J. 2023, 190, 108578. [Google Scholar] [CrossRef]
- Rodgers, J.; Zumba, J.; Fortier, C. Measurement comparison of cotton fiber micronaire and its components by portable near infrared spectroscopy instruments. Text. Res. J. 2017, 87, 57–69. [Google Scholar] [CrossRef]
- Yan, H.; Siesler, H.W. Identification of textiles by handheld near infrared spectroscopy: Protecting customers against product counterfeiting. J. Near Infrared Spectrosc. 2018, 26, 311–321. [Google Scholar] [CrossRef]
- Wang, F.; Jia, B.; Dai, J.; Song, X.; Li, X.; Gao, H.; Yan, H.; Han, B. Qualitative classification of Dendrobium huoshanense (Feng dou) using fast non-destructive hand-held near infrared spectroscopy. J. Near Infrared Spectrosc. 2022, 30, 147–153. [Google Scholar] [CrossRef]
- Oliveira, V.d.S.; Honorato, R.S.; Honorato, F.A.; Pereira, C.F. Authenticity assessment of banknotes using portable near infrared spectrometer and chemometrics. Forensic Sci. Int. 2018, 286, 121–127. [Google Scholar] [CrossRef]
- Pereira, J.F.Q.; Silva, C.S.; Vieira, M.J.L.; Pimentel, M.F.; Braz, A.; Honorato, R.S. Evaluation and identification of blood stains with handheld NIR spectrometer. Microchem. J. 2017, 133, 561–566. [Google Scholar] [CrossRef]
- Bec, K.B.; Grabska, J.; Huck, C.W. Miniaturized NIR Spectroscopy in Food Analysis and Quality Control: Promises, Challenges, and Perspectives. Foods 2022, 11, 1465. [Google Scholar] [CrossRef]
- Fu, Y.; Chen, L.; Zu, Y.; Liu, Z.; Liu, X.; Liu, Y.; Yao, L.; Efferth, T. The antibacterial activity of clove essential oil against Propionibacterium acnes and its mechanism of action. Arch. Dermatol. 2009, 145, 86–88. [Google Scholar] [CrossRef]
- Siddiqua, S.; Anusha, B.A.; Ashwini, L.S.; Negi, P.S. Antibacterial activity of cinnamaldehyde and clove oil: Effect on selected foodborne pathogens in model food systems and watermelon juice. J. Food Sci. Technol. 2015, 52, 5834–5841. [Google Scholar] [CrossRef] [PubMed]
- Emir Çoban, Ö.; Patir, B. Antimicrobial and antioxidant effects of clove oil on sliced smoked Oncorhynchus mykiss. J. Verbraucherschutz Lebensmittelsicherh 2013, 8, 195–199. [Google Scholar] [CrossRef]
- Kiralan, M.; Ketenoglu, O. Food applications of clove (Syzygium aromaticum) extracts. In Clove (Syzygium aromaticum); Elsevier: Amsterdam, The Netherlands, 2022; pp. 607–617. [Google Scholar]
- Xu, J.-G.; Liu, T.; Hu, Q.-P.; Cao, X.-M. Chemical composition, antibacterial properties and mechanism of action of essential oil from clove buds against Staphylococcus aureus. Molecules 2016, 21, 1194. [Google Scholar] [CrossRef]
- Gonelimali, F.D.; Lin, J.; Miao, W.; Xuan, J.; Charles, F.; Chen, M.; Hatab, S.R. Antimicrobial properties and mechanism of action of some plant extracts against food pathogens and spoilage microorganisms. Front. Microbiol. 2018, 9, 1639. [Google Scholar] [CrossRef] [PubMed]
- Nikousaleh, A.; Prakash, J. Antioxidant components and properties of dry heat treated clove in different extraction solvents. J. Fish. Sci. Technol. 2016, 53, 1993–2000. [Google Scholar] [CrossRef] [PubMed]
- Duque-Soto, C.; Ruiz-Vargas, A.; Rueda-Robles, A.; Quirantes-Piné, R.; Borrás-Linares, I.; Lozano-Sánchez, J. Bioactive Potential of Aqueous Phenolic Extracts of Spices for Their Use in the Food Industry—A Systematic Review. Foods 2023, 12, 3031. [Google Scholar] [CrossRef]
- Zhang, P.; Zhang, E.; Xiao, M.; Chen, C.; Xu, W. Enhanced chemical and biological activities of a newly biosynthesized eugenol glycoconjugate, eugenol alpha-D-glucopyranoside. Appl. Microbiol. Biotechnol. 2013, 97, 1043–1050. [Google Scholar] [CrossRef] [PubMed]
- Park, S.H.; Sim, Y.B.; Lee, J.K.; Kim, S.M.; Kang, Y.J.; Jung, J.S.; Suh, H.W. The analgesic effects and mechanisms of orally administered eugenol. Arch. Pharmacal. Res. 2011, 34, 501–507. [Google Scholar] [CrossRef]
- Esmaeili, F.; Rajabnejhad, S.; Partoazar, A.R.; Mehr, S.E.; Faridi-Majidi, R.; Sahebgharani, M.; Syedmoradi, L.; Rajabnejhad, M.R.; Amani, A. Anti-inflammatory effects of eugenol nanoemulsion as a topical delivery system. Pharm. Dev. Technol. 2016, 21, 887–893. [Google Scholar] [CrossRef]
- Mnafgui, K.; Hajji, R.; Derbali, F.; Gammoudi, A.; Khabbabi, G.; Ellefi, H.; Allouche, N.; Kadri, A.; Gharsallah, N. Anti-inflammatory, Antithrombotic and Cardiac Remodeling Preventive Effects of Eugenol in Isoproterenol-Induced Myocardial Infarction in Wistar Rat. Cardiovasc. Toxicol. 2016, 16, 336–344. [Google Scholar] [CrossRef]
- Liu, Q.; Meng, X.; Li, Y.; Zhao, C.-N.; Tang, G.-Y.; Li, H.-B. Antibacterial and antifungal activities of spices. Int. J. Mol. Sci. 2017, 18, 1283. [Google Scholar] [CrossRef]
- Xu, J.-S.; Li, Y.; Cao, X.; Cui, Y. The effect of eugenol on the cariogenic properties of Streptococcus mutans and dental caries development in rats. Exp. Ther. Med. 2013, 5, 1667–1670. [Google Scholar] [CrossRef]
- Kubatka, P.; Uramova, S.; Kello, M.; Kajo, K.; Kruzliak, P.; Mojzis, J.; Vybohova, D.; Adamkov, M.; Jasek, K.; Lasabova, Z. Antineoplastic effects of clove buds (Syzygium aromaticum L.) in the model of breast carcinoma. J. Cell. Mol. Med. 2017, 21, 2837–2851. [Google Scholar] [CrossRef] [PubMed]
- Tsai, T.-H.; Huang, W.-C.; Lien, T.-J.; Huang, Y.-H.; Chang, H.; Yu, C.-H.; Tsai, P.-J. Clove extract and eugenol suppress inflammatory responses elicited by Propionibacterium acnes in vitro and in vivo. Food Agric. Immunol. 2017, 28, 916–931. [Google Scholar] [CrossRef]
- El-Maati, M.F.A.; Mahgoub, S.A.; Labib, S.M.; Al-Gaby, A.M.; Ramadan, M.F. Phenolic extracts of clove (Syzygium aromaticum) with novel antioxidant and antibacterial activities. Eur. J. Intergr. Med. 2016, 8, 494–504. [Google Scholar] [CrossRef]
- Mohdaly, A.A.A.; Roby, M.H.; Sultan, S.A.R.; Groß, E.; Smetanska, I. Potential of low cost agro-industrial wastes as a natural antioxidant on carcinogenic acrylamide formation in potato fried chips. Molecules 2022, 27, 7516. [Google Scholar] [CrossRef]
- Singh, T.P.; Chauhan, G.; Mendiratta, S.K.; Agrawal, R.K.; Arora, S.; Verma, A.K.; Rajkumar, V. In vitro antioxidant and antimicrobial activities of clove extract and its effectiveness in bio-composite film on storage stability of goat meat balls. J. Food Sci. 2022, 87, 2083–2095. [Google Scholar] [CrossRef] [PubMed]
- Chen, Q.; Zhao, J.; Zhang, H.; Wang, X. Feasibility study on qualitative and quantitative analysis in tea by near infrared spectroscopy with multivariate calibration. Anal. Chim. Acta 2006, 572, 77–84. [Google Scholar] [CrossRef]
- Fan, S.X.; Zhang, B.H.; Li, J.B.; Huang, W.Q.; Wang, C.P. Effect of spectrum measurement position variation on the robustness of NIR spectroscopy models for soluble solids content of apple. Biosyst. Eng. 2016, 143, 9–19. [Google Scholar] [CrossRef]
- Fearn, T. Assessing calibrations: SEP, RPD, RER and R2. NIR News 2002, 13, 12–13. [Google Scholar] [CrossRef]
- Zhou, Z.-Q.; Xiao, J.; Fan, H.-X.; Yu, Y.; He, R.-R.; Feng, X.-L.; Kurihara, H.; So, K.-F.; Yao, X.-S.; Gao, H. Polyphenols from wolfberry and their bioactivities. Food Chem. 2017, 214, 644–654. [Google Scholar] [CrossRef] [PubMed]
- Lee, H.W.; Kim, Y.H.; Kim, Y.H.; Lee, G.H.; Lee, M.Y. Discrimination of Lycium chinense and Lycium barbarum by taste pattern and betaine analysis. Int. J. Clin. Exp. Med. 2014, 7, 2053. [Google Scholar] [PubMed]
- Cheng, J.; Zhou, Z.-W.; Sheng, H.-P.; He, L.-J.; Fan, X.-W.; He, Z.-X.; Sun, T.; Zhang, X.; Zhao, R.J.; Gu, L. An evidence-based update on the pharmacological activities and possible molecular targets of Lycium barbarum polysaccharides. Drug Des. Dev. Ther. 2014, 33–78. [Google Scholar]
- Qi, J.; Huang, H.; Wang, J.; Liu, N.; Chen, X.; Jiang, T.; Xu, H.; Lei, H. Insights into the improvement of bioactive phytochemicals, antioxidant activities and flavor profiles in Chinese wolfberry juice by select lactic acid bacteria. Food Biosci. 2021, 43, 101264. [Google Scholar] [CrossRef]
- Zhang, J.; Tian, L.; Xie, B. Bleeding due to a probable interaction between warfarin and Gouqizi (Lycium barbarum L.). Toxicol. Rep. 2015, 2, 1209–1212. [Google Scholar] [CrossRef]
- Bertoldi, D.; Cossignani, L.; Blasi, F.; Perini, M.; Barbero, A.; Pianezze, S.; Montesano, D. Characterisation and geographical traceability of Italian goji berries. Food Chem. 2019, 275, 585–593. [Google Scholar] [CrossRef]
- Zhao, D.; Wei, J.; Hao, J.; Han, X.; Ding, S.; Yang, L.; Zhang, Z. Effect of sodium carbonate solution pretreatment on drying kinetics, antioxidant capacity changes, and final quality of wolfberry (Lycium barbarum) during drying. LWT Food Sci. Technol. 2019, 99, 254–261. [Google Scholar] [CrossRef]
- Shahrajabian, M.H.; Sun, W.; Cheng, Q. A review of goji berry (Lycium barbarum) in traditional Chinese medicine as a promising organic superfood and superfruit in modern industry. Acad. J. Med. Plants 2018, 6, 437–445. [Google Scholar]
- Magiera, S.; Zaręba, M. Chromatographic determination of phenolic acids and flavonoids in Lycium barbarum L. and evaluation of antioxidant activity. Food Anal. Methods 2015, 8, 2665–2674. [Google Scholar] [CrossRef]
- Jin, M.; Huang, Q.; Zhao, K.; Shang, P. Biological activities and potential health benefit effects of polysaccharides isolated from Lycium barbarum L. Int. J. Biol. Macromol. 2013, 54, 16–23. [Google Scholar] [CrossRef]
- Teye, E.; Anyidoho, E.; Agbemafle, R.; Sam-Amoah, L.K.; Elliott, C. Cocoa bean and cocoa bean products quality evaluation by NIR spectroscopy and chemometrics: A review. Infrared Phys. Technol. 2020, 104, 103127. [Google Scholar] [CrossRef]
- Anyidoho, E.K.; Teye, E.; Agbemafle, R. Nondestructive authentication of the regional and geographical origin of cocoa beans by using a handheld NIR spectrometer and multivariate algorithm. Anal. Methods 2020, 12, 4150–4158. [Google Scholar] [CrossRef] [PubMed]
- Hashimoto, J.C.; Lima, J.C.; Celeghini, R.M.S.; Nogueira, A.B.; Efraim, P.; Poppi, R.J.; Pallone, J.A.L. Quality Control of Commercial Cocoa Beans (Theobroma cacao L.). Food Anal. Methods 2018, 11, 1510–1517. [Google Scholar] [CrossRef]
- Quelal-Vásconez, M.A.; Lerma-García, M.J.; Pérez-Esteve, É.; Talens, P.; Barat, J.M. Roadmap of cocoa quality and authenticity control in theindustry: A review of conventional and alternative methods. Compr. Rev. Food Sci. Food Saf. 2020, 19, 448–478. [Google Scholar] [CrossRef]
- Man, Y.B.C.; Syahariza, Z.A.; Mirghani, M.E.S.; Jinap, S.; Bakar, J. Analysis of potential lard adulteration in chocolate and chocolate products using Fourier transform infrared spectroscopy. Food Chem. 2005, 90, 815–819. [Google Scholar]
- Santos, I.A.; Conceiçao, D.G.; Viana, M.B.; Silva, G.d.J.; Santos, L.S.; Ferrao, S.P.B. NIR and MIR spectroscopy for quick detection of the adulteration of cocoa content in chocolates. Food Chem. 2021, 349, 129095. [Google Scholar] [CrossRef]
- Okiyama, D.C.G.; Navarro, S.L.B.; Rodrigues, C.E.C. Cocoa shell and its compounds: Applications in the food industry. Trends Food Sci. Technol. 2017, 63, 103–112. [Google Scholar] [CrossRef]
- Beć, K.B.; Grabska, J.; Siesler, H.W.; Huck, C.W. Handheld near-infrared spectrometers:Where are we heading? NIR News 2020, 31, 28–35. [Google Scholar] [CrossRef]
- Workman, J., Jr.; Weyer, L. Practical Guide and Spectral Atlas for Interpretive Near-Infrared Spectroscopy; CRC Press: Boca Raton, FL, USA, 2012. [Google Scholar]
- Almeida, M.R.; Oliveira, K.d.S.; Stephani, R.; Oliveira, L.F.C.d. Fourier-transform Raman analysis of milk powder: A potential method for rapid quality screening. J. Raman Spectrosc. 2011, 42, 1548–1552. [Google Scholar] [CrossRef]
- Gossner, C.M.-E.; Schlundt, J.; Embarek, P.B.; Hird, S.; Lo-Fo-Wong, D. The Melamine Incident: Implications for International Food and Feed Safety. Environ. Health Perspect. 2009, 117, 1803–1808. [Google Scholar] [CrossRef]
- Francis, A.; Dhiman, T.; Mounya, K.S. Adulteration of milk: A review. J. Mater. Sci. Technol. 2020, 5, 37–41. [Google Scholar]
- Jaumot, J.; Juan, A.D.; Tauler, R.A. MCR-ALS GUI 2.0: New features and applications. Chemom. Intell. Lab. Syst. 2015, 140, 1–12. [Google Scholar] [CrossRef]
- Jaumot, J.; Gargallo, R.; Juan, A.D.; Tauler, R. A graphical user-friendly interface for MCR-ALS: A new tool for multivariate curve resolution in MATLAB. Chemom. Intell. Lab. Syst. 2005, 46, 101–110. [Google Scholar] [CrossRef]
- Chan, T.F. An Improved Algorithm for Computing the Singular Value Decomposition. ACM Trans. Math. Softw. 1982, 8, 72–83. [Google Scholar] [CrossRef]
- Windig, W.; Guilment, J. Interactive self-modeling mixture analysis. Anal. Chem. 1991, 63, 1425–1432. [Google Scholar] [CrossRef]
- Neves, M.D.G. Detection and Quantification of Adulterants in Milk Powder and Derivatives Using Raman Spectroscopy Image and Chemometric; University of Campinas: Campinas, Brazil, 2016. [Google Scholar]


| Sample Set | Mean % (w/w) | Max. % (w/w) | Min. % (w/w) | Range % (w/w) | Std. % (w/w) | CV (%) |
|---|---|---|---|---|---|---|
| Calibration | 3.39 | 6.27 | 0.42 | 5.85 | 1.97 | 58.1 |
| Test | 3.46 | 6.27 | 0.49 | 5.78 | 2.05 | 59.2 |
| Wavenumber (cm−1) | Functional Group | Material Type |
|---|---|---|
| 5792 | C-H (2ν(CH2) overtone) | Hydrocarbons and aliphatic |
| 5672 | C-H (2ν(CH2) overtone) | Hydrocarbons and aliphatic |
| 5176 | v(OH) + δ(OH) combination | Polysaccharides and water |
| 4880 | N-H in-plane bending + ν(C-N) combination | Amides/proteins |
| 4672 | ν(CH) + ν(C=O) + δ(CH2) combination | Lipids |
| 4328 | C-H (3δ(CH2) overtone) | Lipids |
| 4264 | C-H (2ν(CH2) + δ(CH2) combination) | Hydrocarbons and aliphatic |
| Sample | Sucrose (%) | Urea (%) | Whey (%) | Milk (%) |
|---|---|---|---|---|
| #1 | 10 | 5 | 15 | 70 |
| #2 | 10 | - | - | 90 |
| #3 | - | 30 | - | 70 |
| #4 | - | - | 5 | 95 |
| Sample | Sucrose | Urea | Whey | |||
|---|---|---|---|---|---|---|
| Pred | Abs Error | Pred | Abs Error | Pred | Abs Error | |
| #1 | 9.1 | −0.9 | 6.3 | 1.3 | 17.8 | 2.8 |
| #2 | 9.2 | −0.8 | - | - | - | - |
| #3 | - | - | 30.9 | 0.9 | - | - |
| #4 | - | - | - | - | 4.5 | −0.5 |
| Average | 0.85 | 1.10 | 1.65 | |||
Disclaimer/Publisher’s Note: The statements, opinions and data contained in all publications are solely those of the individual author(s) and contributor(s) and not of MDPI and/or the editor(s). MDPI and/or the editor(s) disclaim responsibility for any injury to people or property resulting from any ideas, methods, instructions or products referred to in the content. |
© 2023 by the authors. Licensee MDPI, Basel, Switzerland. This article is an open access article distributed under the terms and conditions of the Creative Commons Attribution (CC BY) license (https://creativecommons.org/licenses/by/4.0/).
Share and Cite
Yan, H.; Neves, M.D.G.; Wise, B.M.; Moraes, I.A.; Barbin, D.F.; Siesler, H.W. The Application of Handheld Near-Infrared Spectroscopy and Raman Spectroscopic Imaging for the Identification and Quality Control of Food Products. Molecules 2023, 28, 7891. https://doi.org/10.3390/molecules28237891
Yan H, Neves MDG, Wise BM, Moraes IA, Barbin DF, Siesler HW. The Application of Handheld Near-Infrared Spectroscopy and Raman Spectroscopic Imaging for the Identification and Quality Control of Food Products. Molecules. 2023; 28(23):7891. https://doi.org/10.3390/molecules28237891
Chicago/Turabian StyleYan, Hui, Marina D. G. Neves, Barry M. Wise, Ingrid A. Moraes, Douglas F. Barbin, and Heinz W. Siesler. 2023. "The Application of Handheld Near-Infrared Spectroscopy and Raman Spectroscopic Imaging for the Identification and Quality Control of Food Products" Molecules 28, no. 23: 7891. https://doi.org/10.3390/molecules28237891
APA StyleYan, H., Neves, M. D. G., Wise, B. M., Moraes, I. A., Barbin, D. F., & Siesler, H. W. (2023). The Application of Handheld Near-Infrared Spectroscopy and Raman Spectroscopic Imaging for the Identification and Quality Control of Food Products. Molecules, 28(23), 7891. https://doi.org/10.3390/molecules28237891