

A pH-Sensitive Fluorescent Chemosensor Turn-On Based in a Salen Iron (III) Complex: Synthesis, Photophysical Properties, and Live-Cell Imaging Application

 , , , , , , , and
Abstract
:
1. Introduction
2. Results
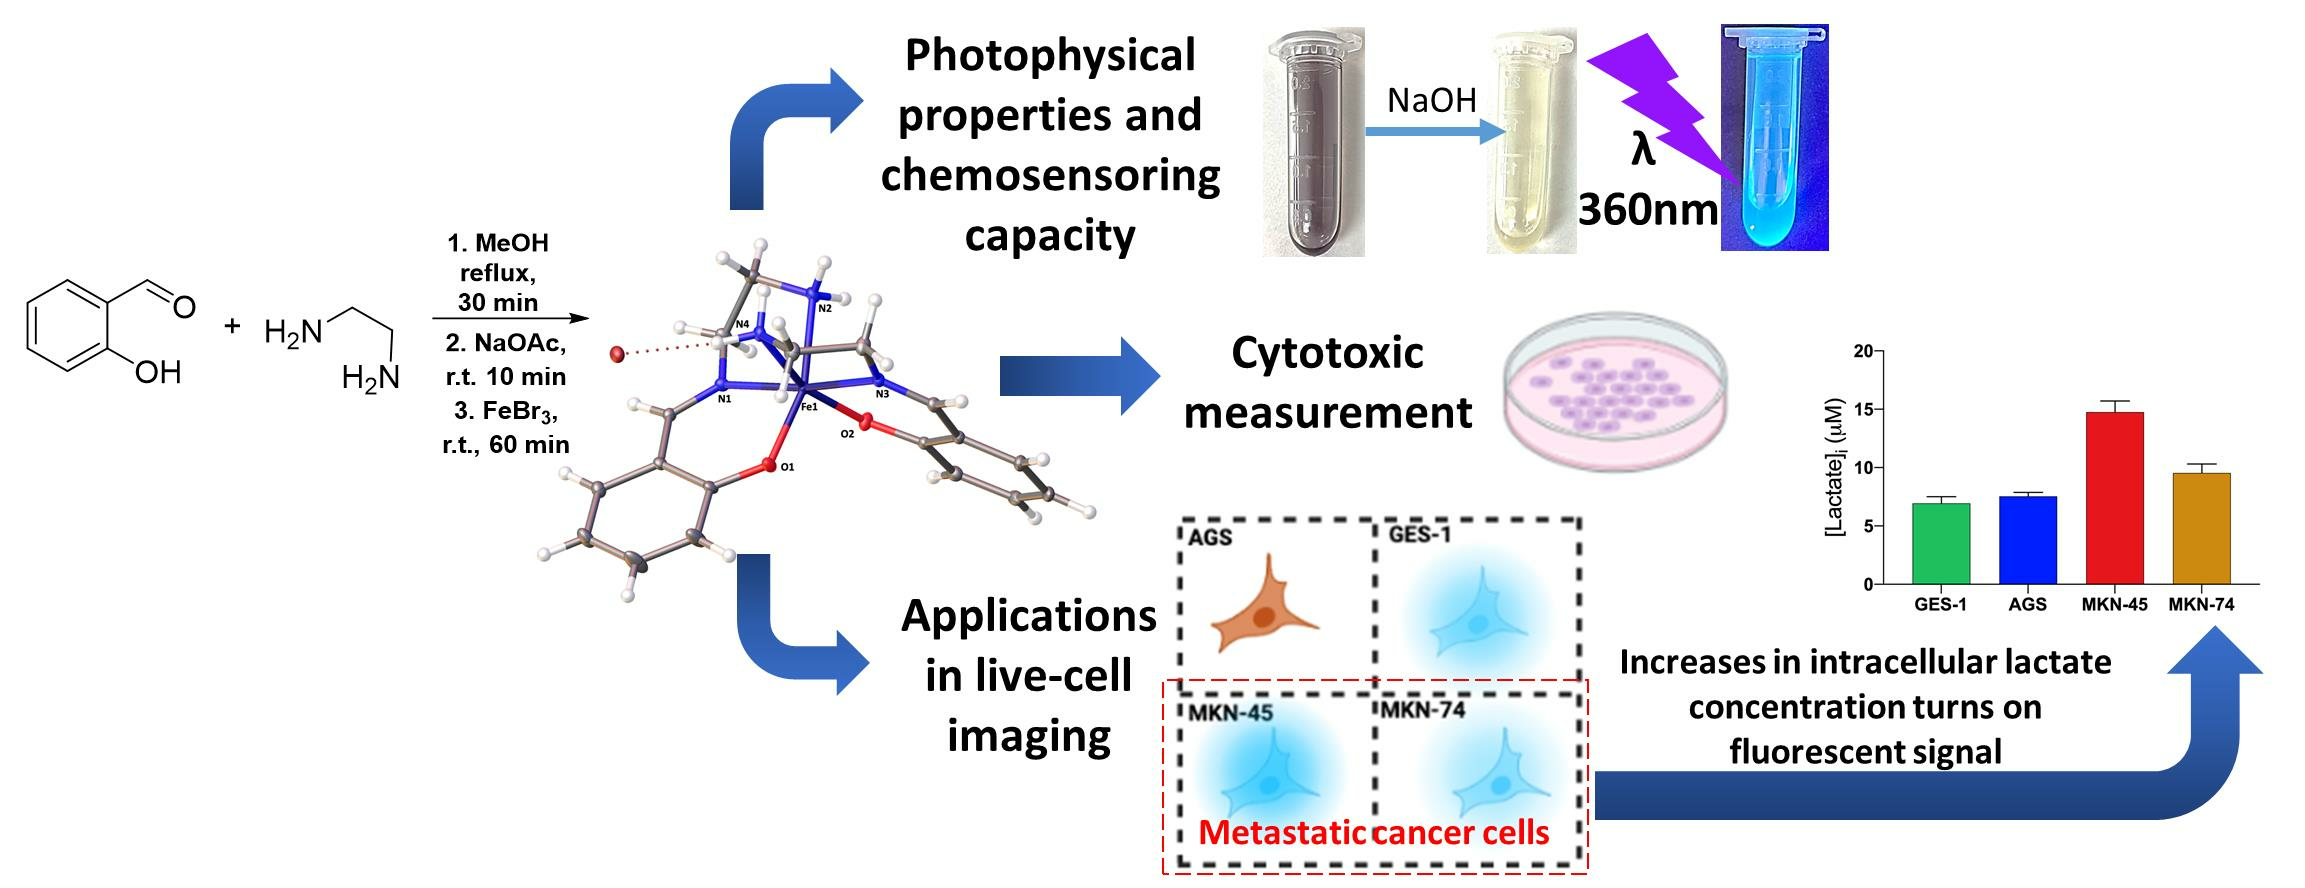
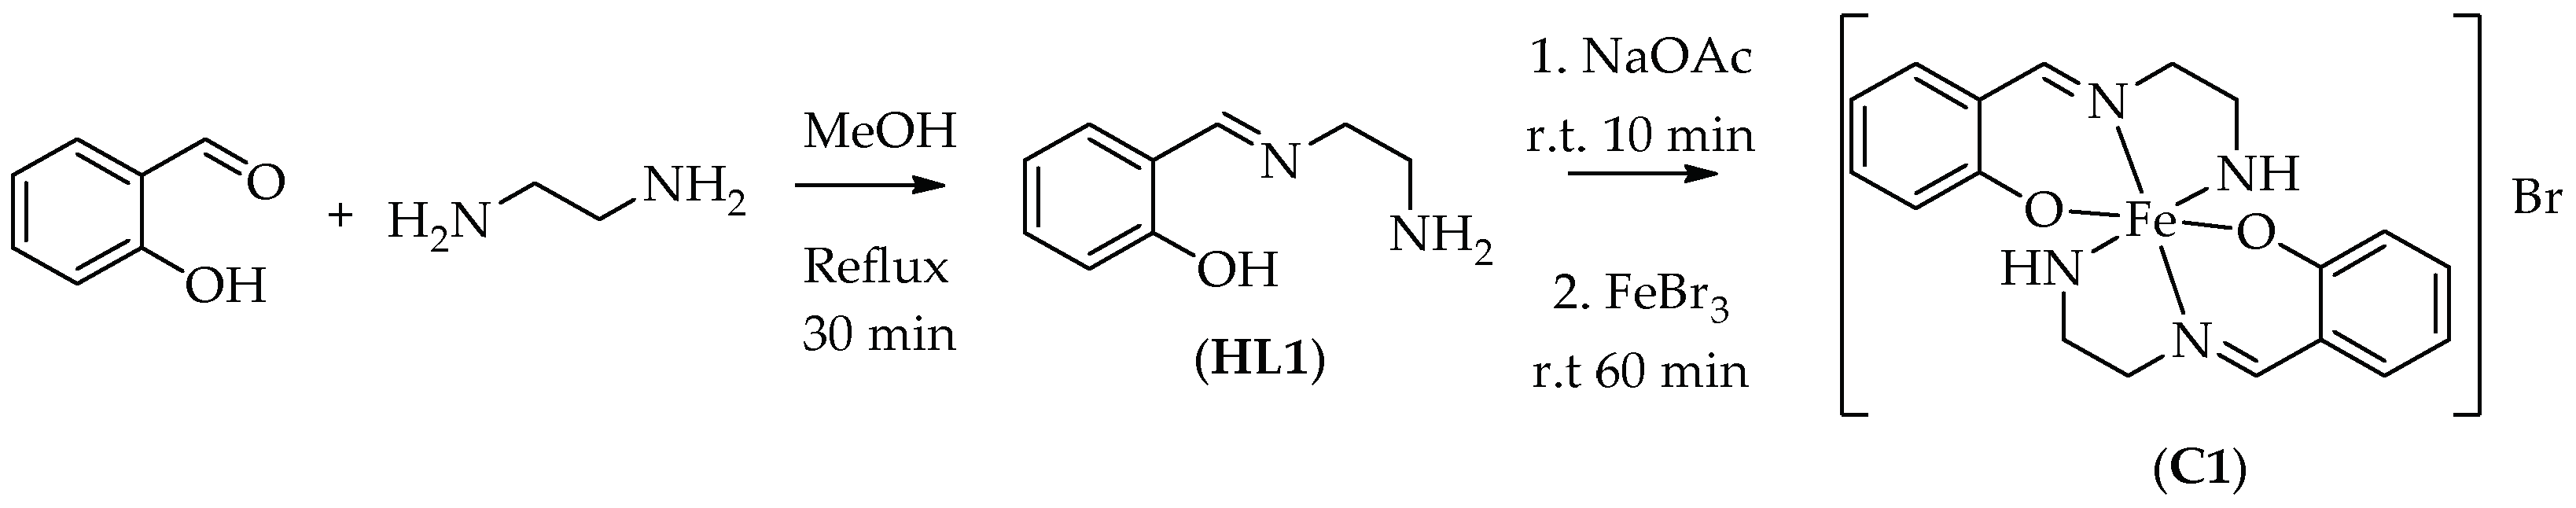
2.1. Chemistry
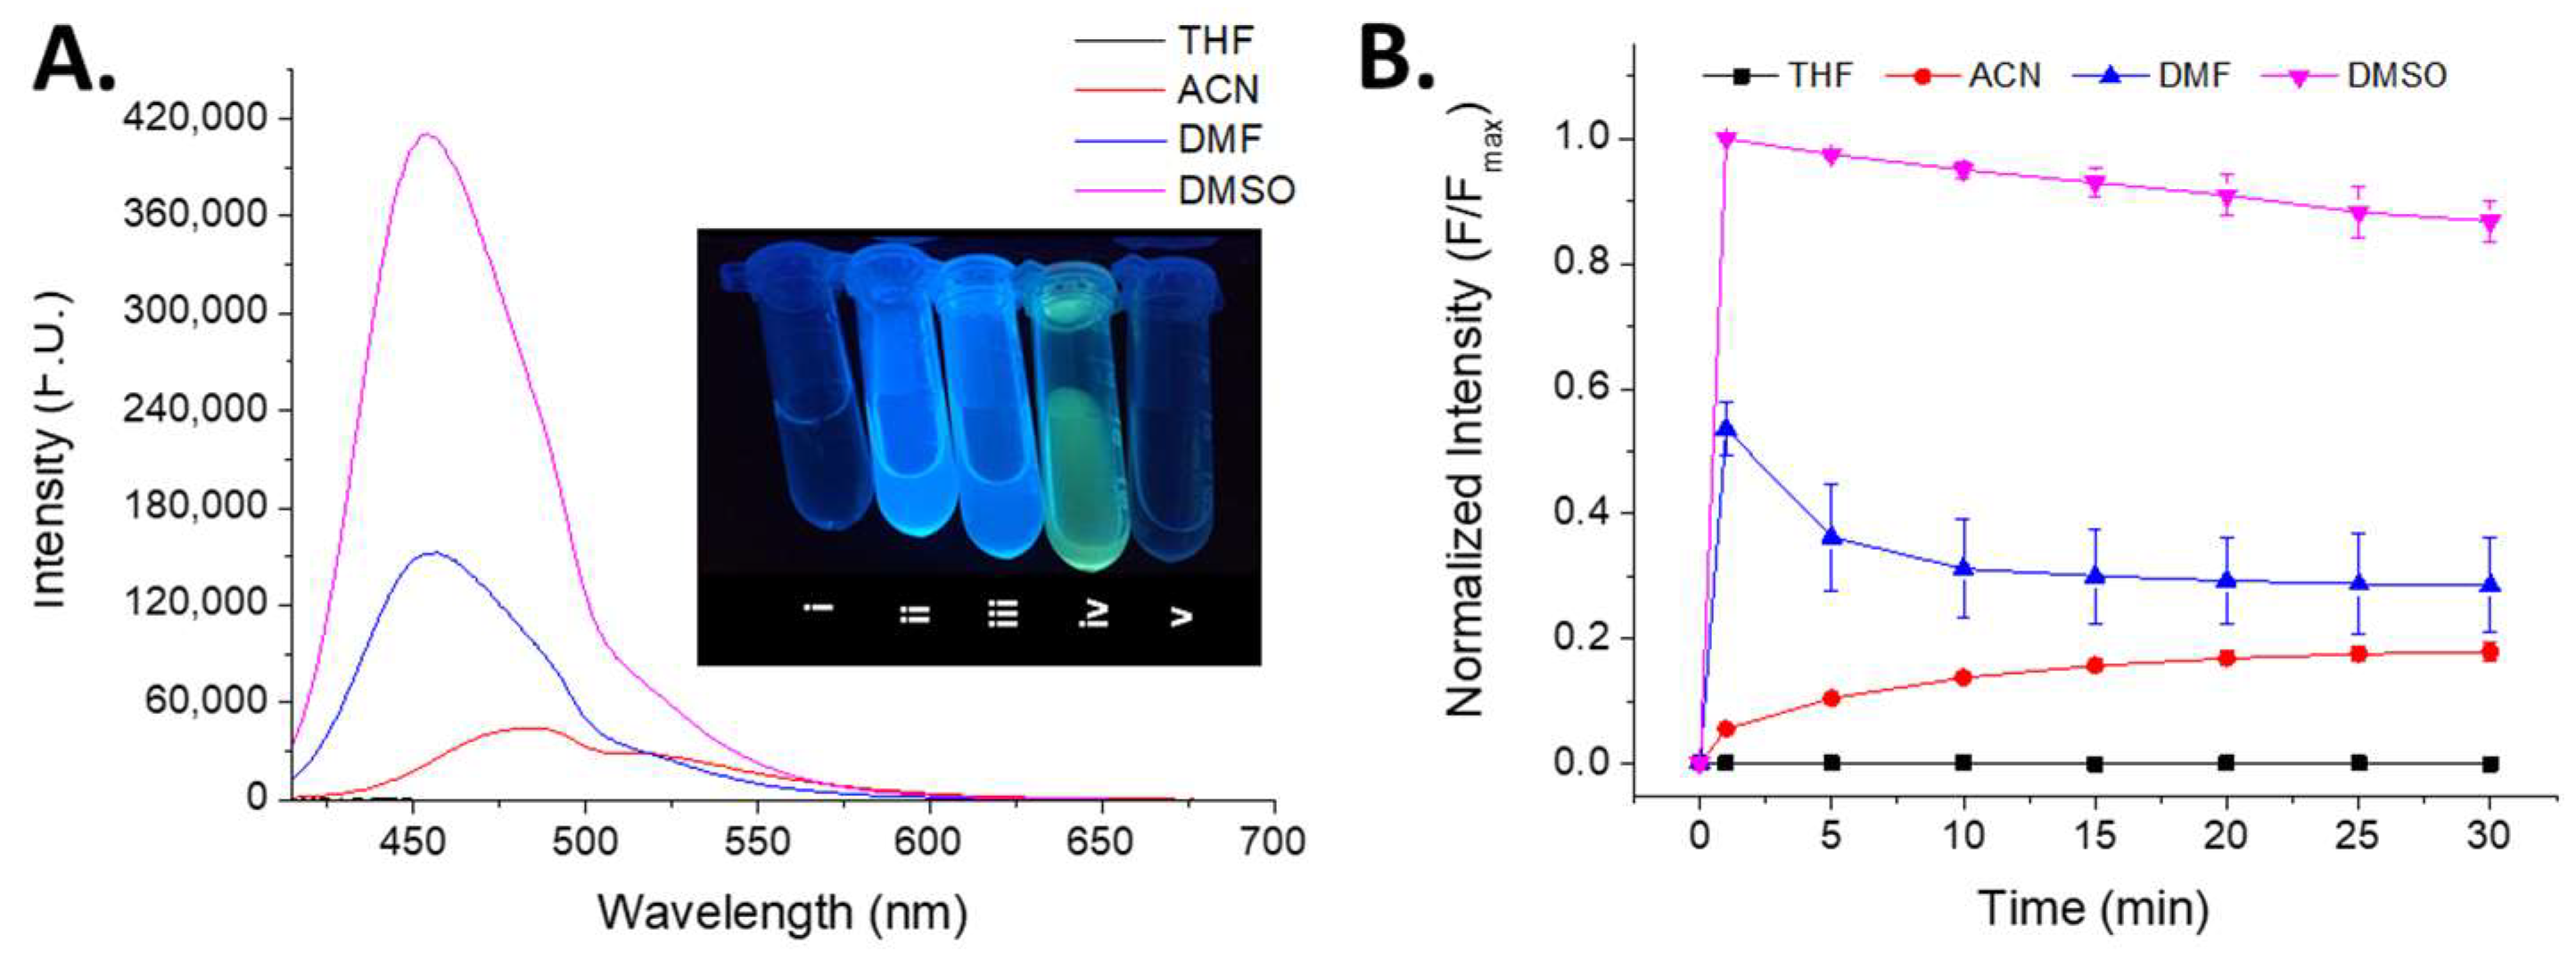
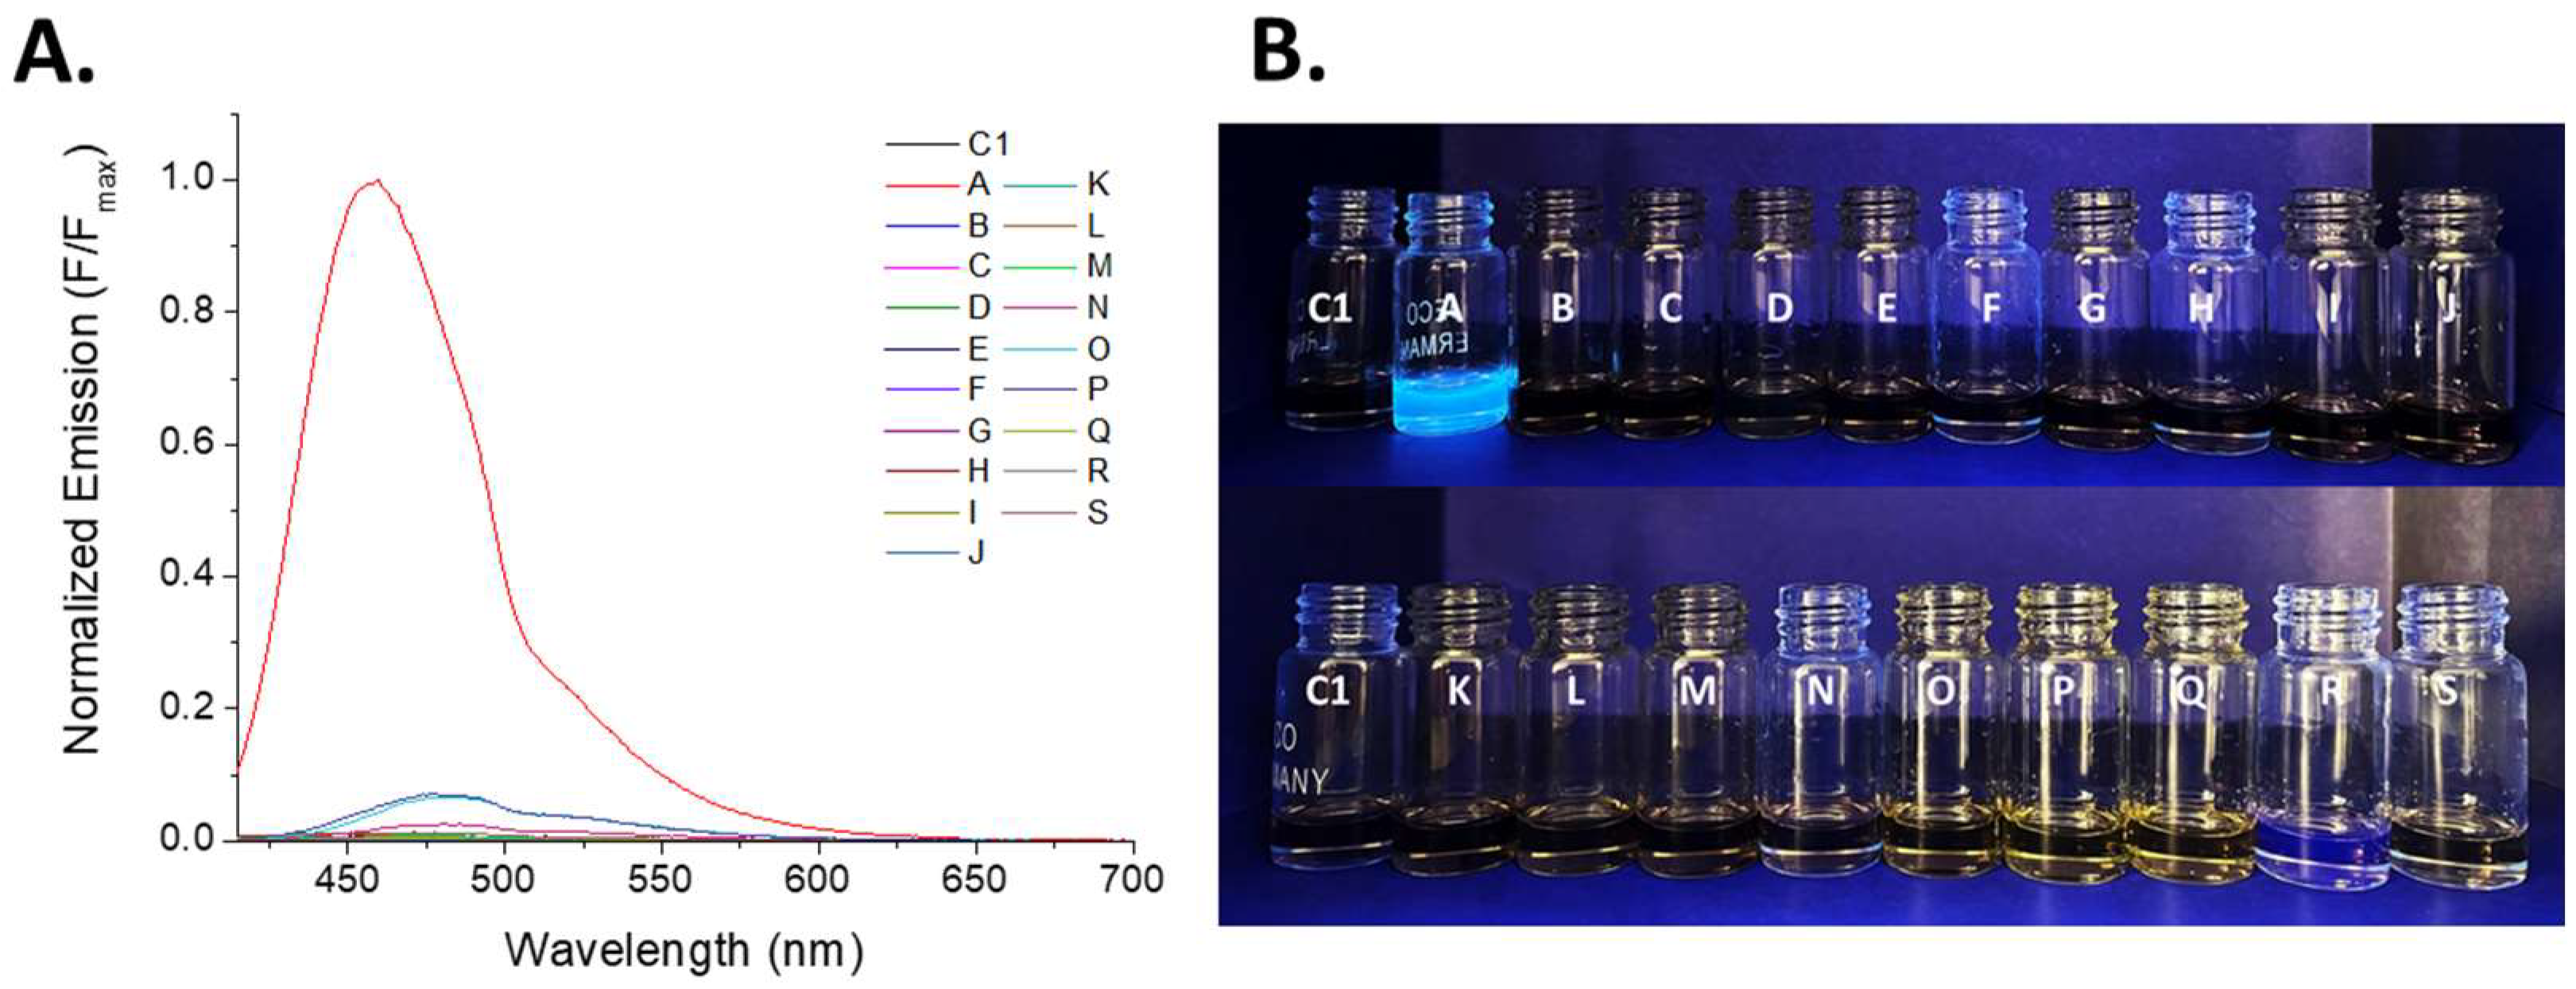
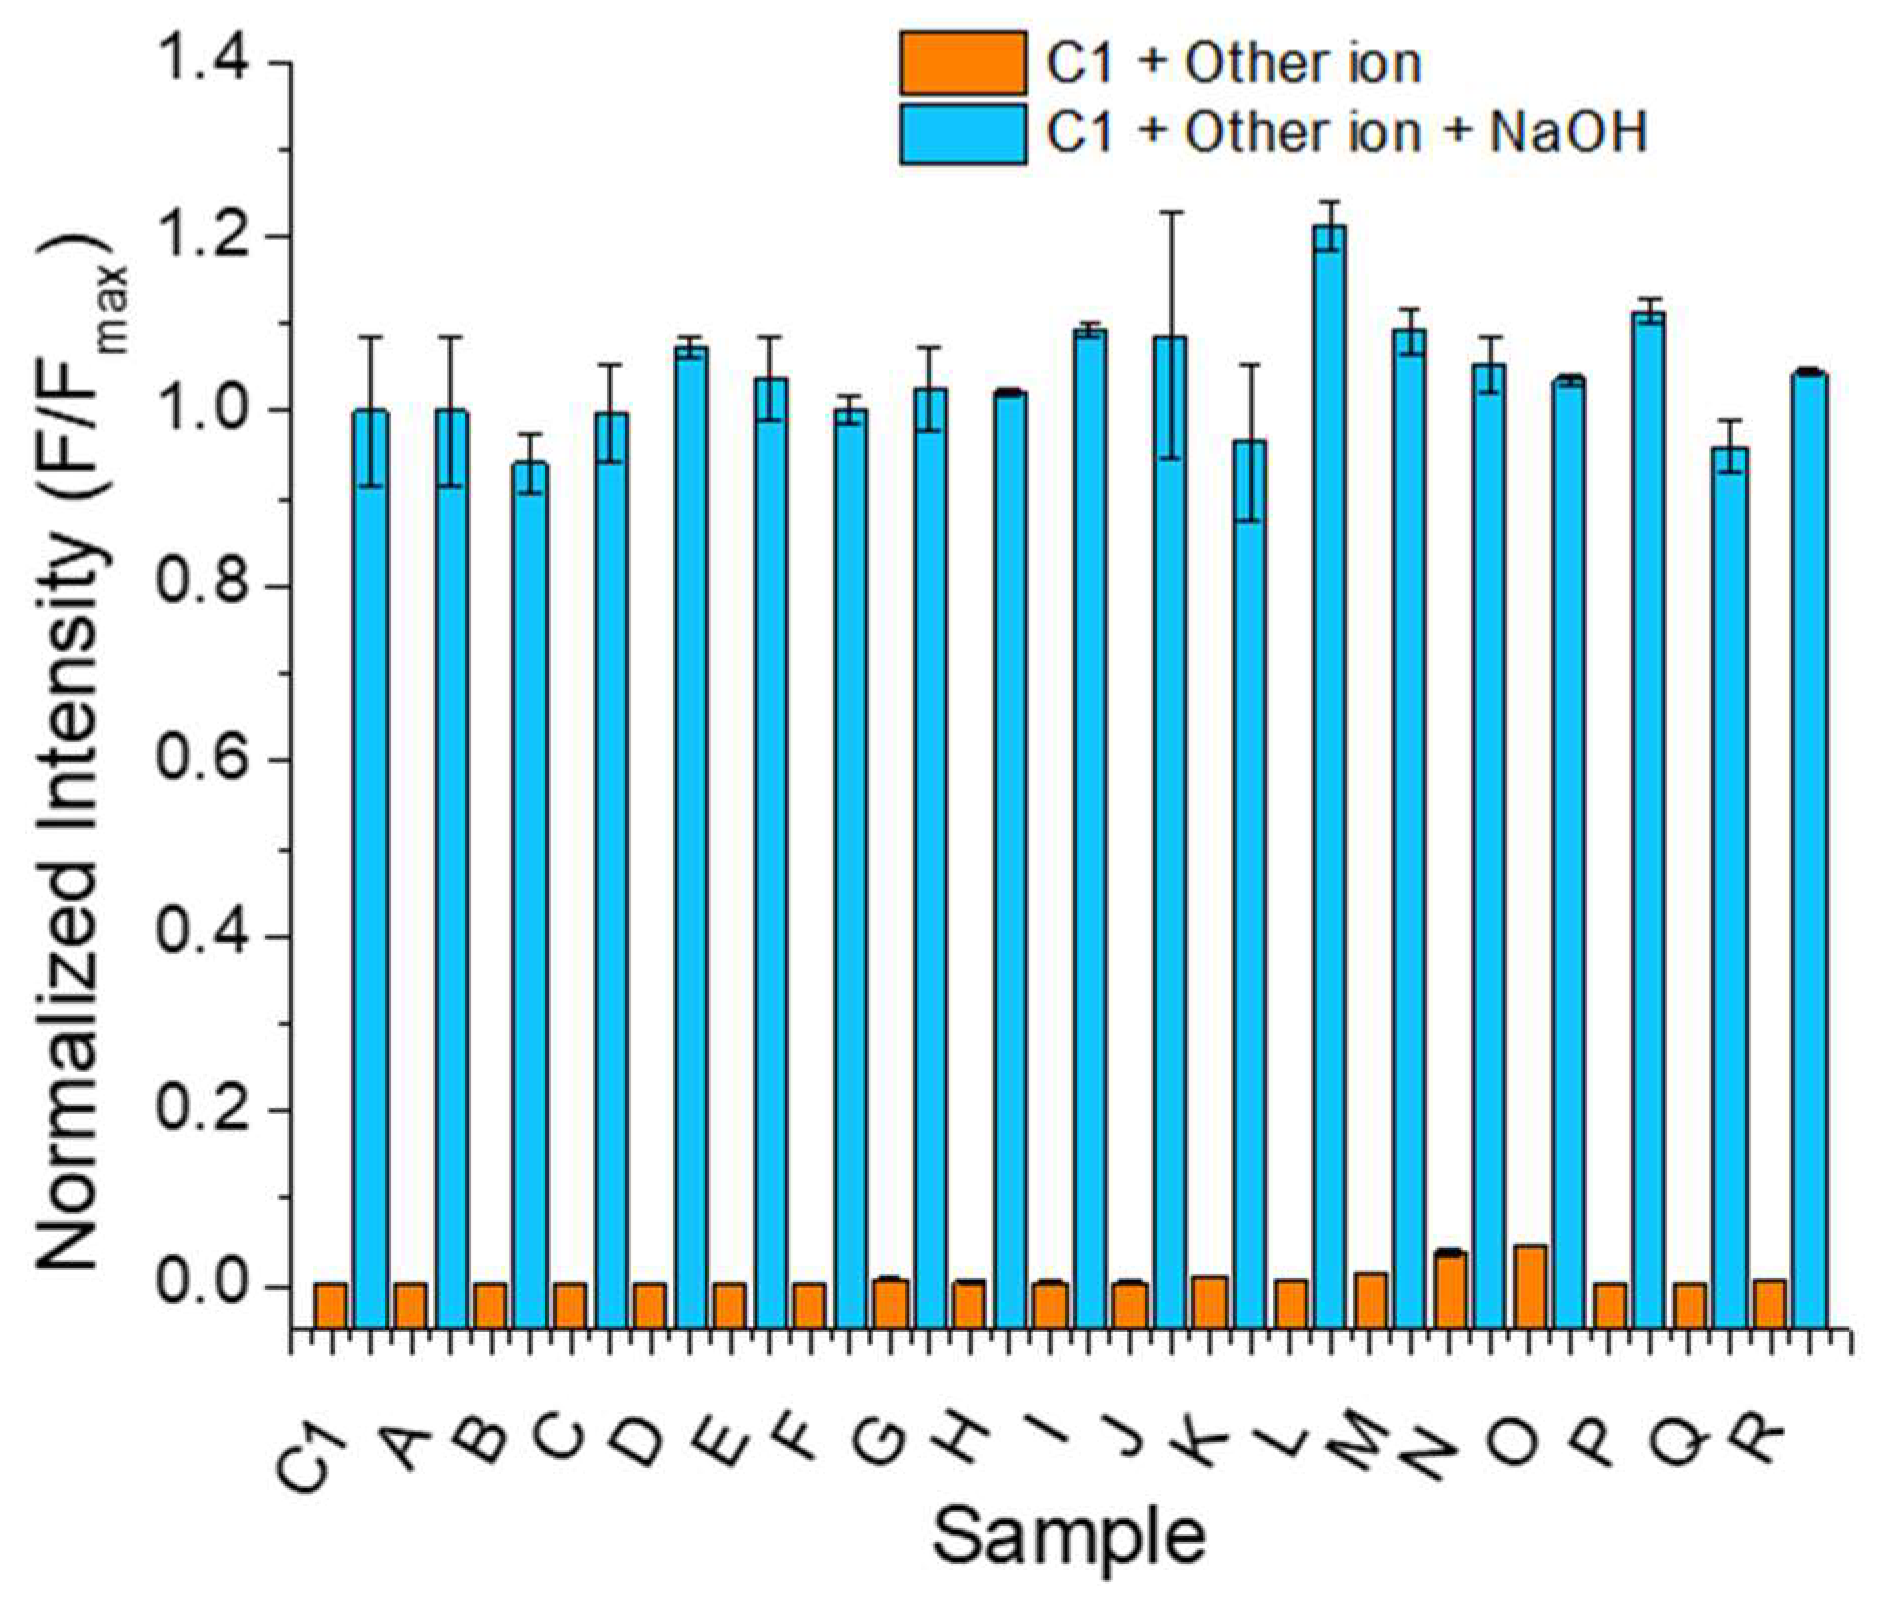
2.2. Photophysical Characterization and Chemosensing Capacity Assessment
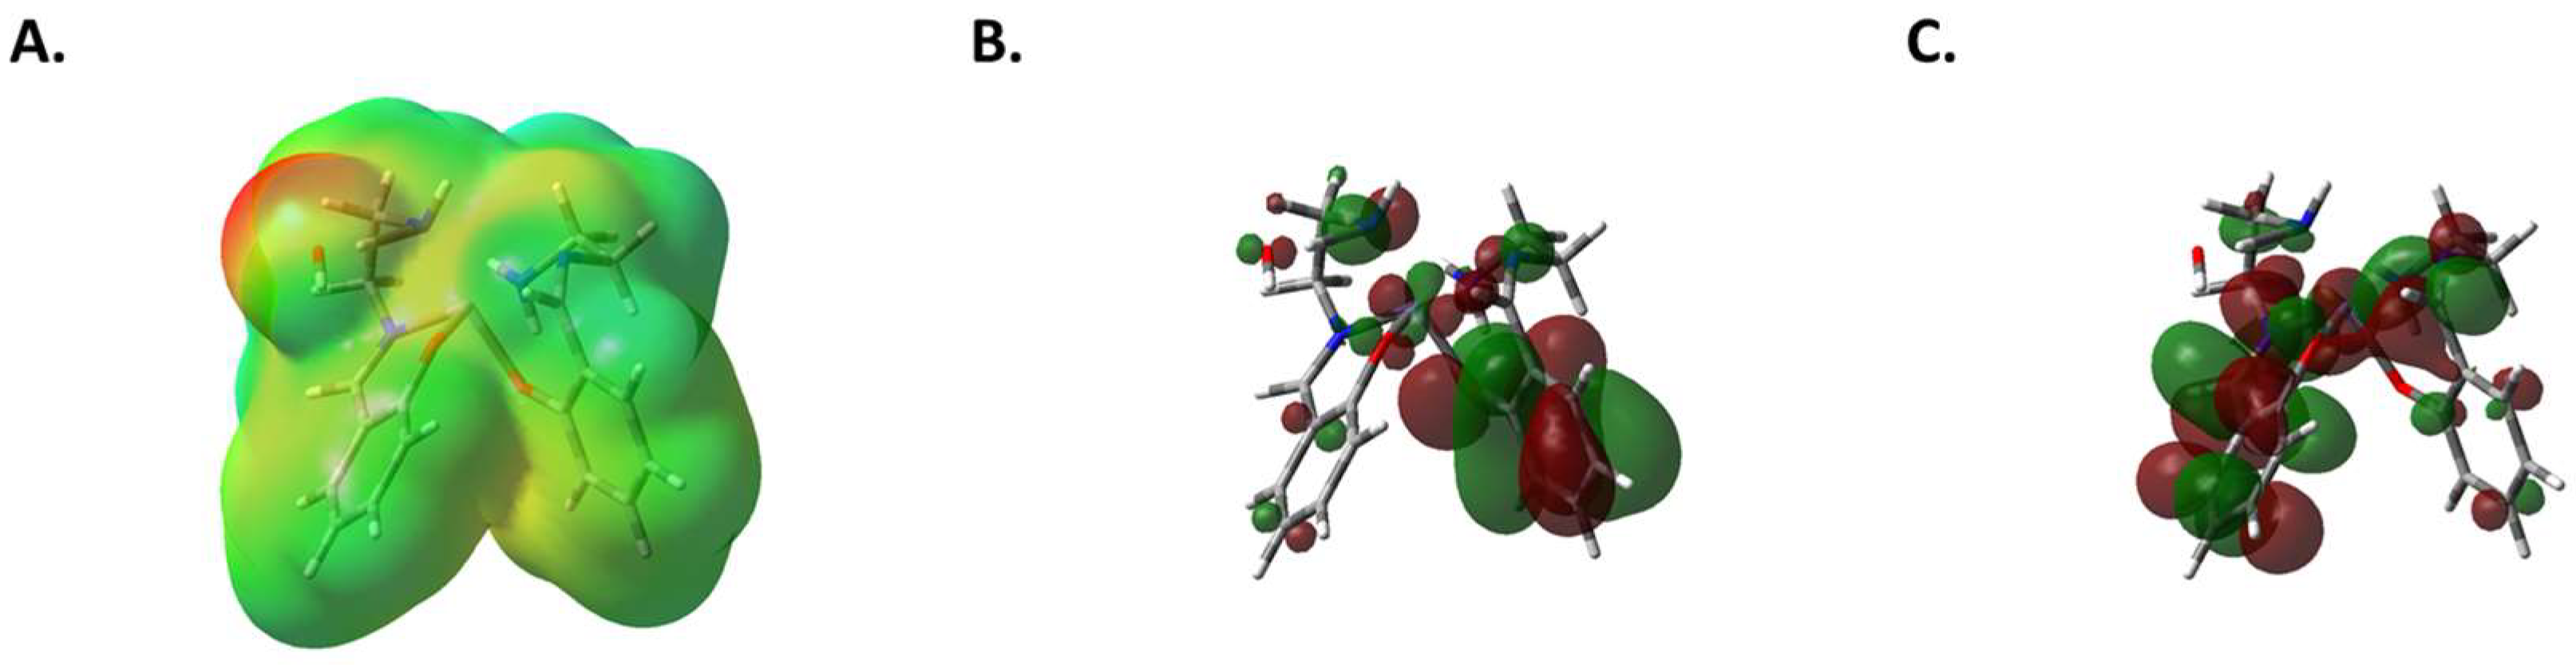
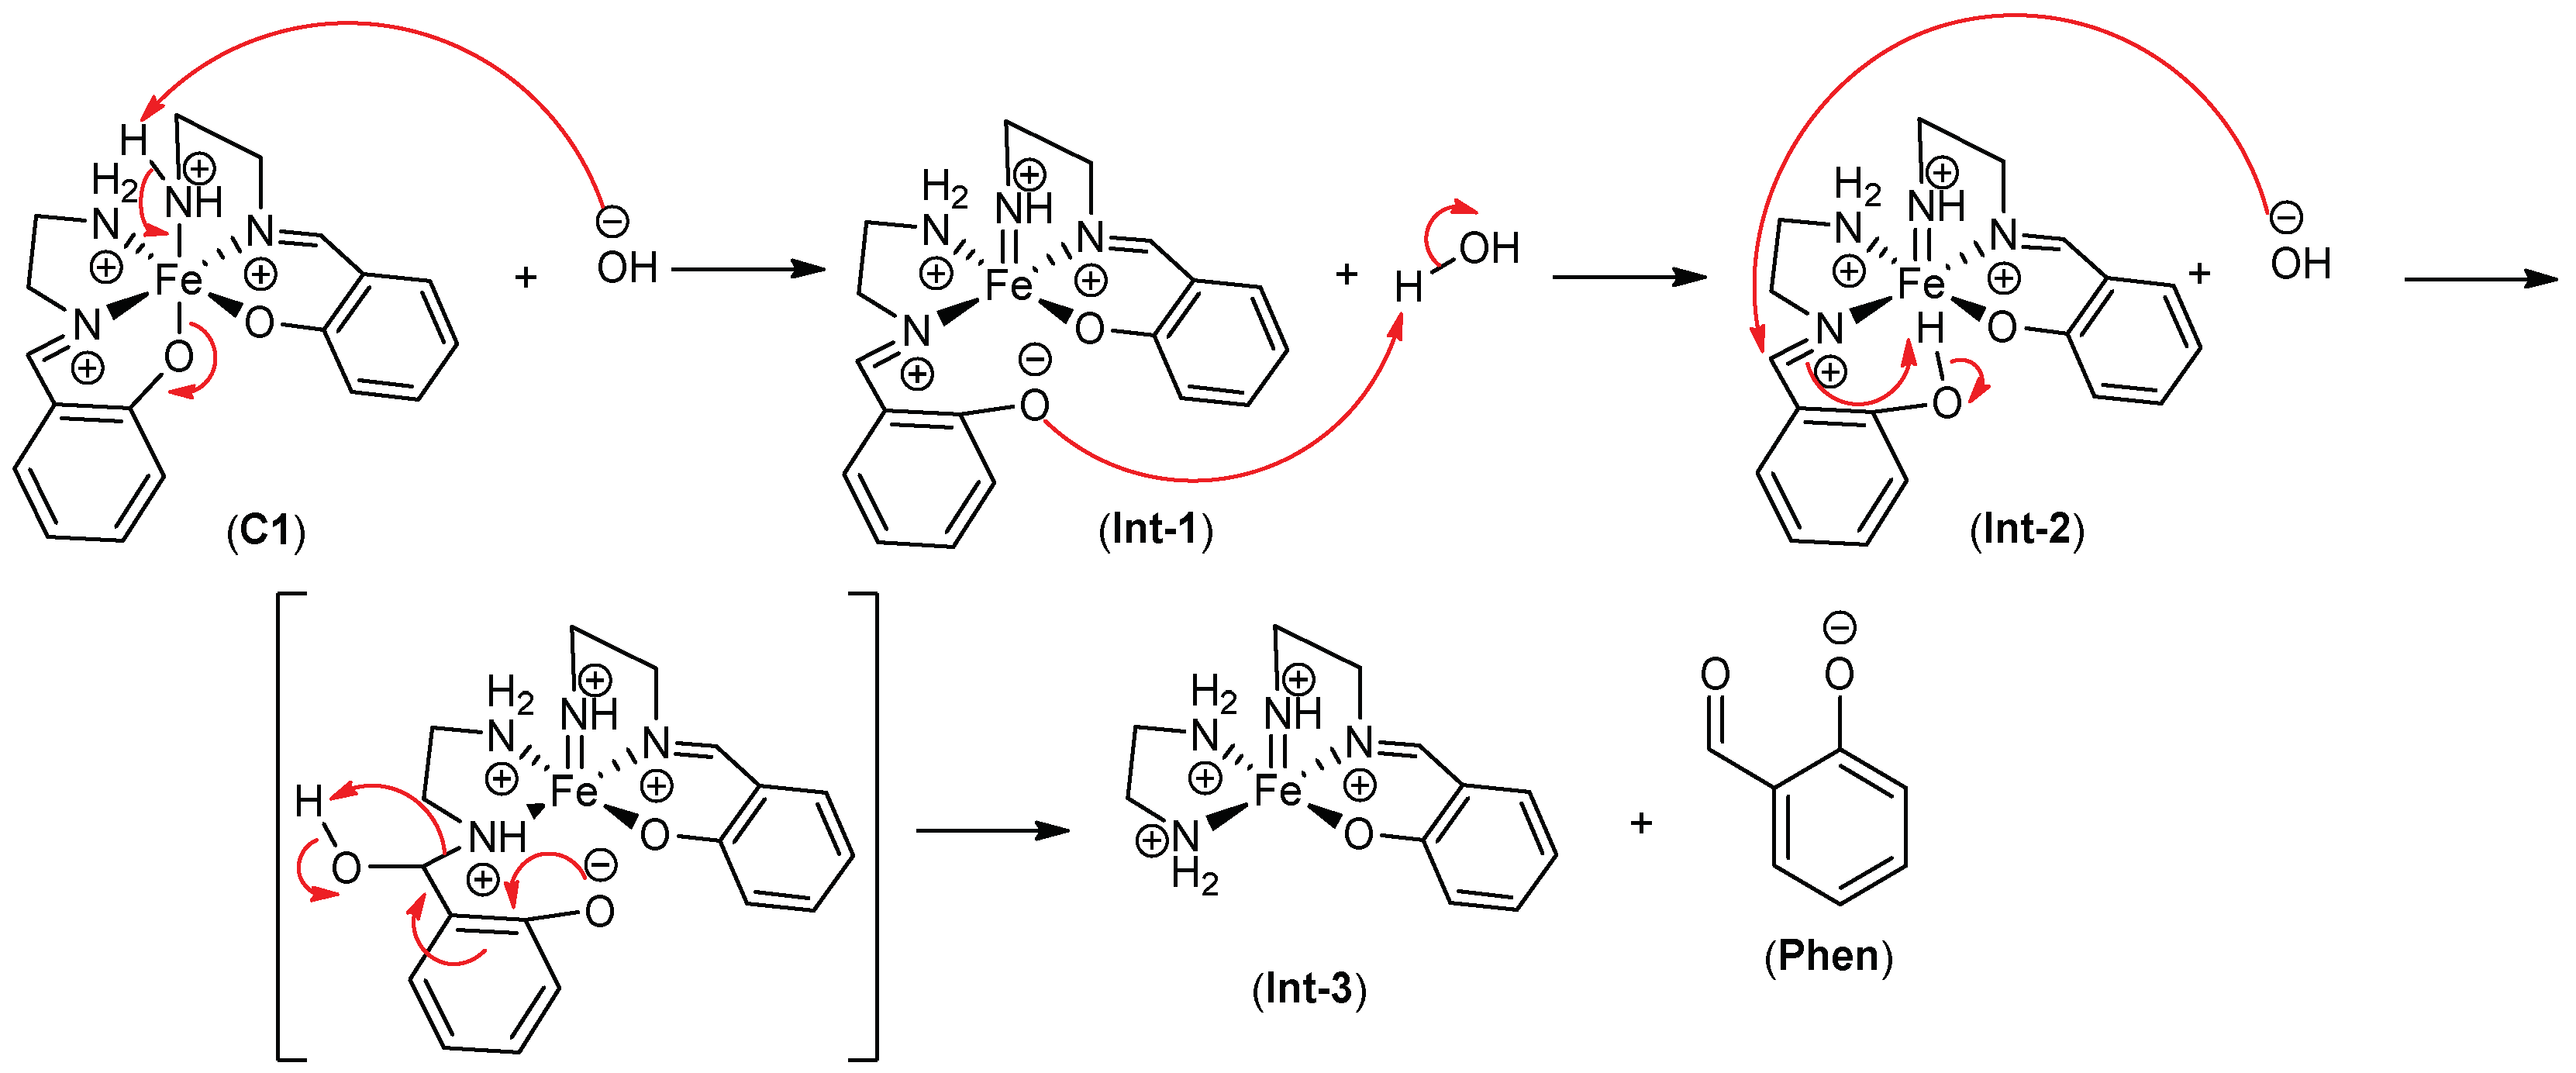
2.3. Computational Approach
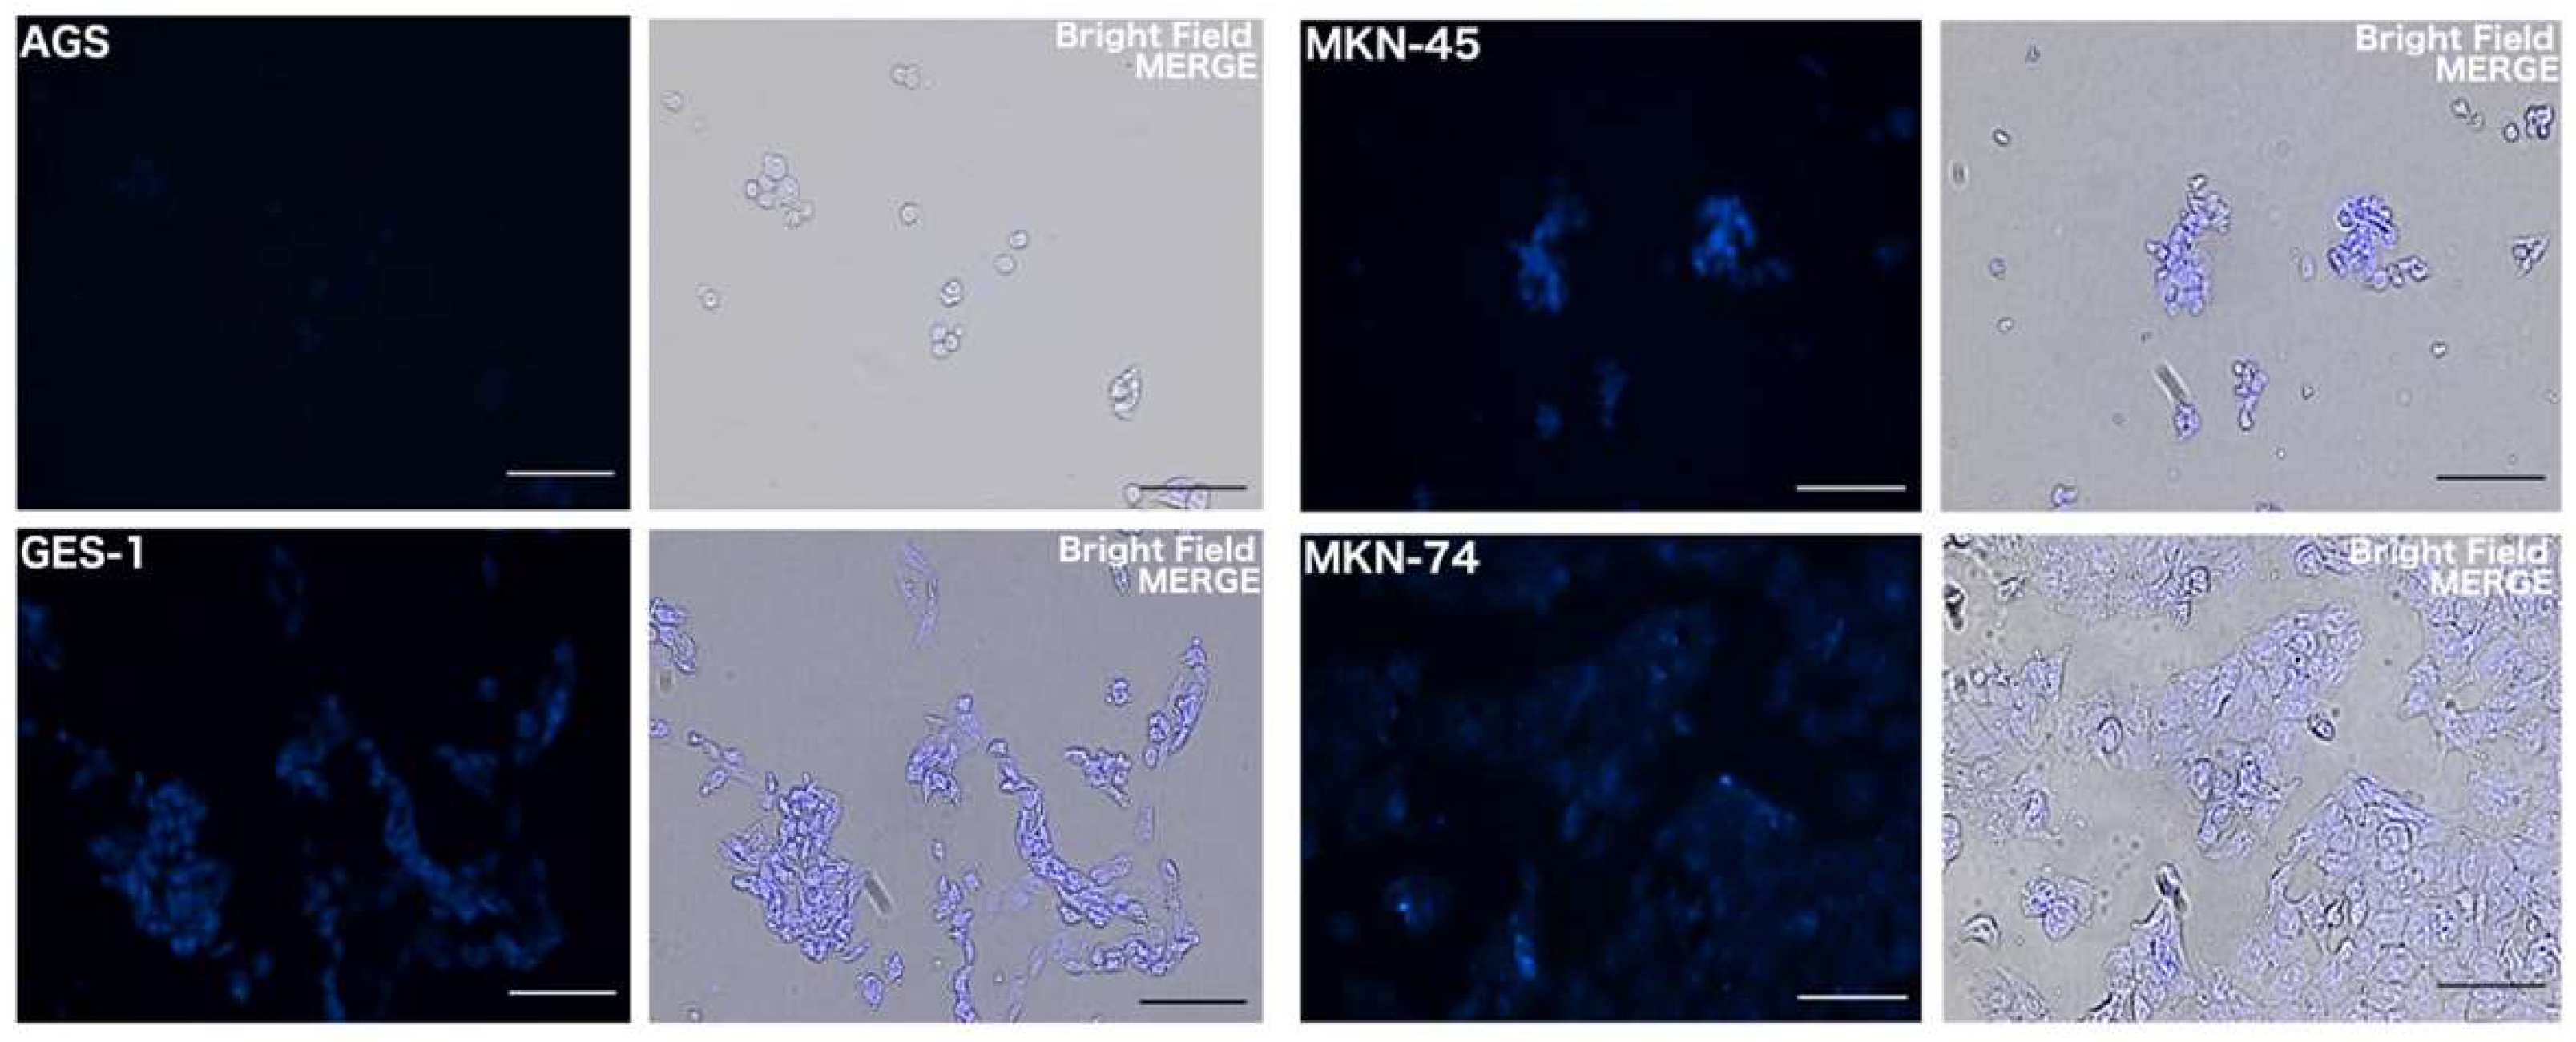
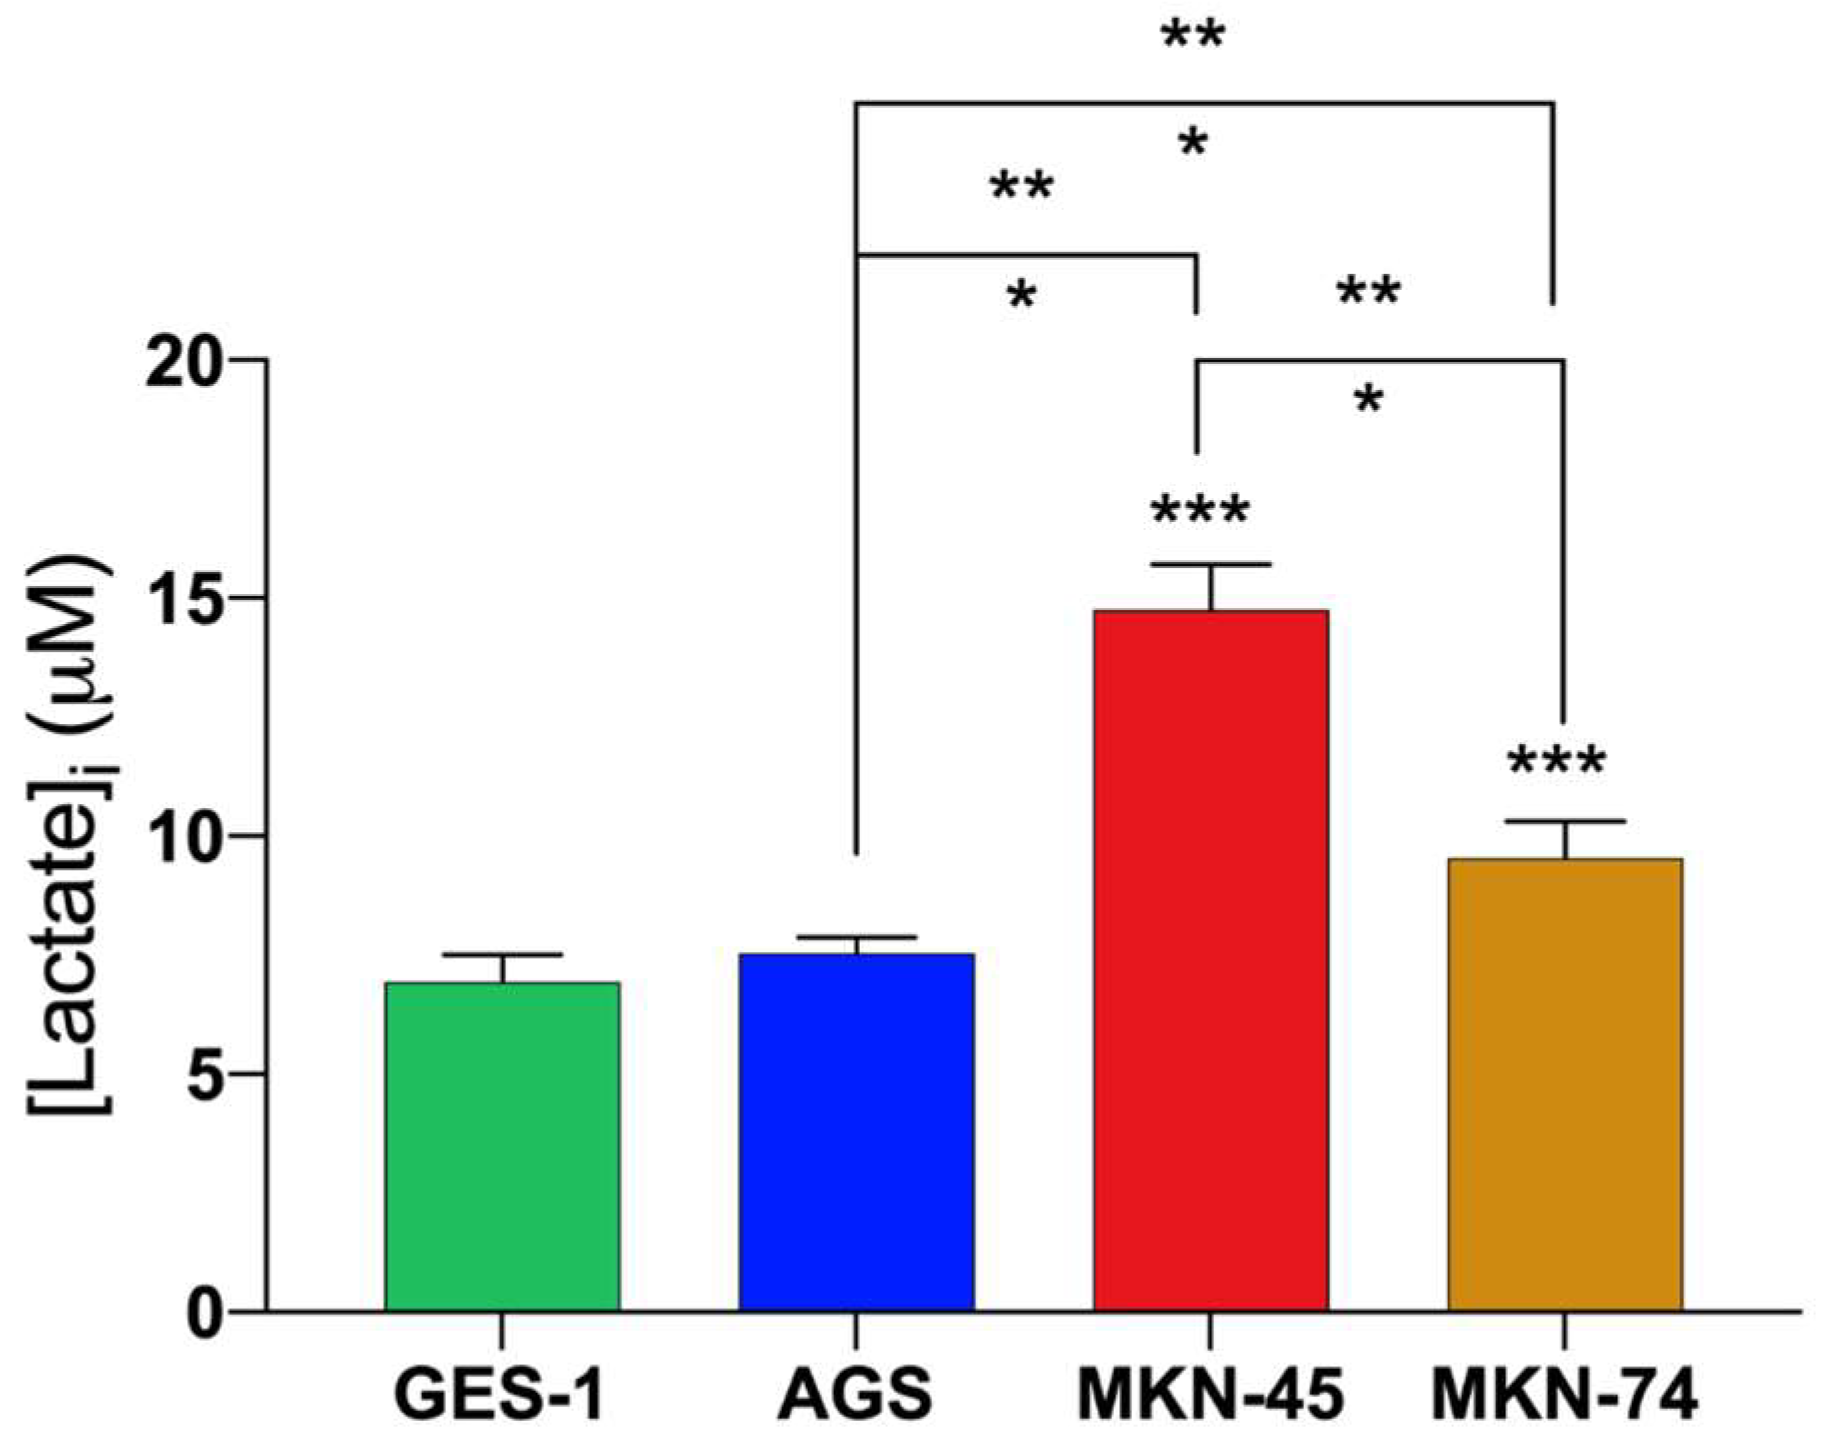
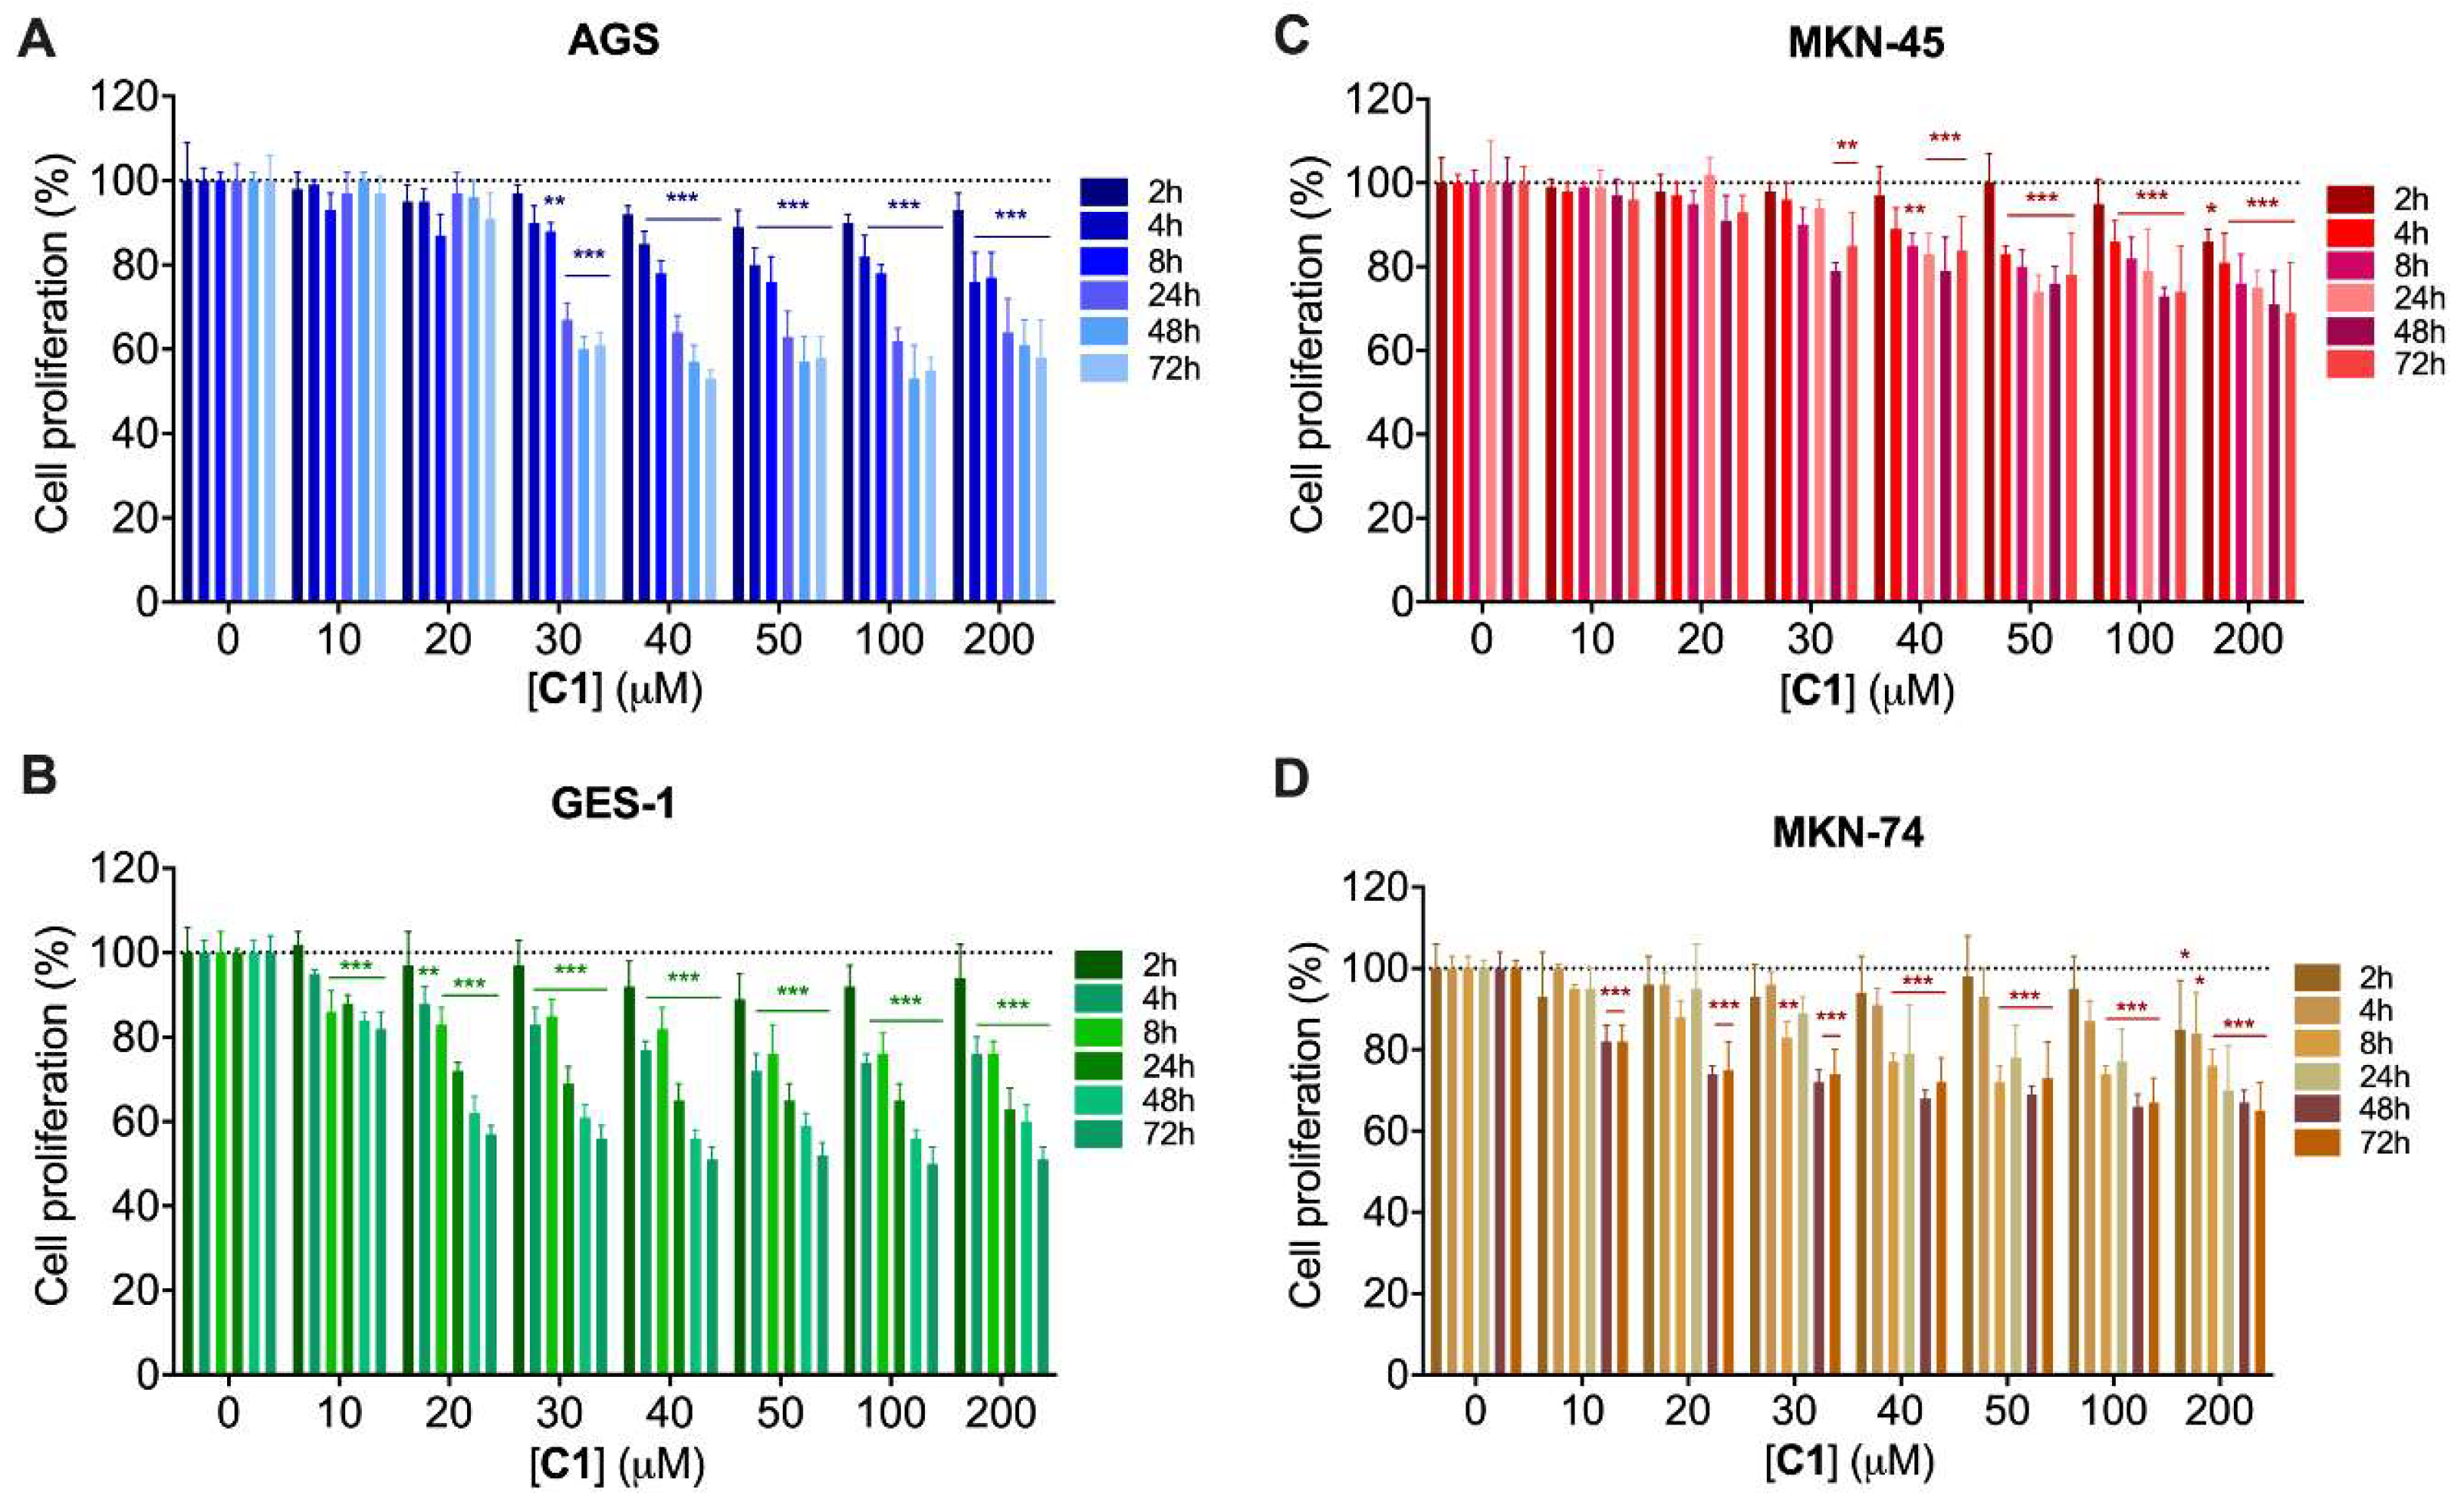
2.4. Biological Application
3. Materials and Methods
3.1. Instrumentation
3.2. Chemical
3.3. Synthetic Procedure
3.3.1. Synthesis of 2-(((2-aminoethyl)imino)methyl)phenol (HL1)
3.3.2. Synthesis of bis-2-(((2-aminoethyl)imino)methyl)phenol Iron (III) Complex [Fe(L1)2]Br (C1)
3.4. Crystal Structure
3.5. Photophysical Properties
3.6. Computational Approach
3.7. Biology
3.7.1. Cell Culture
3.7.2. Cytotoxic Assay
3.7.3. Living Cell Imaging
3.7.4. Intracellular Lactate Measurements
4. Conclusions
Supplementary Materials
Author Contributions
Funding
Institutional Review Board Statement
Informed Consent Statement
Data Availability Statement
Acknowledgments
Conflicts of Interest
Sample Availability
Appendix A
References
- Flinck, M.; Kramer, S.H.; Pedersen, S.F. Roles of PH in Control of Cell Proliferation. Acta Physiol. 2018, 223, e13068. [Google Scholar] [CrossRef] [PubMed]
- Jang, M.; Kim, S.S.; Lee, J. Cancer Cell Metabolism: Implications for Therapeutic Targets. Exp. Mol. Med. 2013, 45, e45. [Google Scholar] [CrossRef] [PubMed]
- Lee, S.; Shanti, A. Effect of Exogenous PH on Cell Growth of Breast Cancer Cells. Int. J. Mol. Sci. 2021, 22, 9910. [Google Scholar] [CrossRef]
- Warburg, O. On Respiratory Impairment in Cancer Cells. Science 1956, 124, 269–270. [Google Scholar] [CrossRef]
- Wang, Q.; Lv, H.; Ding, F.; Jin, Z.; Liu, Y.; Sun, X.; Ye, L.; Xu, W.; Mu, C.; Shen, J.; et al. Multifunctional Chemosensor for Tracing Ga(III), Hypochlorite and PH Change with Bioimaging in Living Cells, Pseudomonas Aeruginosa and Zebrafish. Sens. Actuator B-Chem. 2021, 345, 130346. [Google Scholar] [CrossRef]
- Pooja; Pandey, H.; Aggarwal, S.; Vats, M.; Rawat, V.; Pathak, S.R. Coumarin-Based Chemosensors for Metal Ions Detection. Asian J. Org. Chem. 2022, 11, e202200455. [Google Scholar] [CrossRef]
- Fernandes, R.S.; Shetty, N.S.; Mahesha, P.; Gaonkar, S.L. A Comprehensive Review on Thiophene Based Chemosensors. J. Fluoresc. 2022, 32, 19–56. [Google Scholar] [CrossRef]
- Ren, H.; Li, F.; Yu, S.; Wu, P. The Detection of Multiple Analytes by Using Visual Colorimetric and Fluorometric Multimodal Chemosensor Based on the Azo Dye. Heliyon 2022, 8, e10216. [Google Scholar] [CrossRef]
- Khan, S.A.; Alam, M.Z.; Mohasin, M.; Ahmad, S.; Salma, U.; Parveen, H.; Mukhtar, S.; Al-Anazi, M.; Alotaibi, F.A.; Abdelaziz, M.A. Ultrasound-Assisted Synthesis of Chalcone: A Highly Sensitive and Selective Fluorescent Chemosensor for the Detection of Fe3+ in Aqueous Media. J. Fluoresc. 2023. online ahead of print. [Google Scholar] [CrossRef]
- Alam, M.Z.; Khan, S.A.A. A Review on Rhodamine-Based Schiff Base Derivatives: Synthesis and Fluorescent Chemo-Sensors Behaviour for Detection of Fe3+ and Cu2+ Ions. J. Coord. Chem. 2023, 76, 371–402. [Google Scholar] [CrossRef]
- Wu, J.; Pan, J.; Ye, Z.; Zeng, L.; Su, D. A Smart Fluorescent Probe for Discriminative Detection of Hydrazine and Bisulfite from Different Emission Channels. Sens. Actuator B-Chem. 2018, 274, 274–284. [Google Scholar] [CrossRef]
- Luo, M.; Li, Q.; Shen, P.; Hu, S.; Wang, J.; Wu, Z.; Su, Z. Coumarin 1,4-Enedione for Selective Detection of Hydrazine in Aqueous Solution and Fluorescence Imaging in Living Cells. Anal. Bioanal. Chem. 2021, 413, 7541–7548. [Google Scholar] [CrossRef] [PubMed]
- Sultana, T.; Mahato, M.; Tohora, N.; Das, A.; Datta, P.; Das, S.K. Phthalimide-Based Off-On-Off Fluorosensor for Cascade Detection of Cyanide Ions and Picric Acid. ChemistrySelect 2023, 8, e202204388. [Google Scholar] [CrossRef]
- Bouhadir, K.H.; Elaridi, J.; Sonji, G. Selective and Sensitive Turn on Fluorescence Cyanide Recognition in Aqueous Medium Based on Zn(II)–Hydrazone Metal Complex Chemosensor. Luminescence 2021, 36, 1608–1620. [Google Scholar] [CrossRef] [PubMed]
- Zhang, Y.; Su, J.; Li, Q.; Li, W.; Liang, G.; Li, H.; Ma, H.; Lin, Q.; Yao, H.; Wei, T. Novel Fluorescent Chemosensor for Detection of F- Anions Based on a Single Functionalized Pillar[5]Arene Iron(III) Complex. Chin. J. Chem. 2016, 34, 1263–1267. [Google Scholar] [CrossRef]
- Deng, W.-T.; Qu, H.; Huang, Z.-Y. Magnesium(II) Complexes with High Emission: The Distinct Charge-Transfer Process from Transition Metal. Z. Anorg. Allg. Chem. 2018, 644, 865–868. [Google Scholar] [CrossRef]
- Gul, Z.; Khan, S.; Ullah, S.; Ullah, H.; Khan, M.U.; Ullah, M.; Altaf, A.A. Recent Development in Coordination Compounds as a Sensor for Cyanide Ions in Biological and Environmental Segments. Crit. Rev. Anal. Chem. 2022. online ahead of print. [Google Scholar] [CrossRef]
- Mohan, N.; Sreejith, S.S.; Begum, P.M.S.; Kurup, M.R.P. A Modern Approach for the Sensing of Aqueous Al(III) Ion by Ni(II) Salen-Type Schiff Base Complexes. Appl. Organomet. Chem. 2019, 33, e5064. [Google Scholar] [CrossRef]
- Yu, J.; Zhang, H.; Tam, C.F.; Wong, W.-L. Synthesis of Pyridyl-Imine Complex of Iron(III) as a Fluorescent Sensor for Hydrazine Detection Based on Redox Chemistry. ChemistrySelect 2022, 7, e202202530. [Google Scholar] [CrossRef]
- Kumari, N.; Huang, H.; Chao, H.; Gasser, G.; Zelder, F. A Disassembly Strategy for Imaging Endogenous Pyrophosphate in Mitochondria by Using an FeIII–Salen Complex. ChemBioChem 2016, 17, 1211–1215. [Google Scholar] [CrossRef]
- Heinonen, J.K. Biological Role of Inorganic Pyrophosphate; Springer Science & Business Media: Berlin/Heidelberg, Germany, 2001; ISBN 978-0-7923-7441-1. [Google Scholar]
- Demirelli, H.; Tuemer, M.; Goelcue, A. Synthesis and Characterization of Polydentate Schiff-Base Ligands and Their Complexes. Bull. Chem. Soc. Jpn. 2006, 79, 867–875. [Google Scholar] [CrossRef]
- Halcrow, M.A. Structure:Function Relationships in Molecular Spin-Crossover Complexes. Chem. Soc. Rev. 2011, 40, 4119–4142. [Google Scholar] [CrossRef]
- Gonzalez-Vergara, A.; Sanchez-Gonzalez, R.; Bravo, M.A.; Aguilar, L.F.; Espinoza, L.; Mellado, M. Assessment of Chalcone-Vanillin as a Selective Chemosensor of As(III) in Aqueous Solution. J. Mol. Struct. 2022, 1266, 133558. [Google Scholar] [CrossRef]
- Mellado, M.; Sariego-Kluge, R.; Valdes-Navarro, F.; Sanchez-Gonzalez, R.; Fuentealba, M.; Bravo, M.A.; Aguilar, L.F. Synthesis, Crystal Structure, and Photophysical Properties of 4-(4-(Dimethylamino)Phenyl)-6-Phenylpyrimidin-2-Amine. J. Mol. Struct. 2021, 1226, 129340. [Google Scholar] [CrossRef]
- Mellado, M.; Sariego-Kluge, R.; Gonzalez, C.; Diaz, K.; Aguilar, L.F.; Bravo, M.A. Systematic Study of the Fluorescent Properties of Cinnamaldehyde Phenylhydrazone and Its Interactions with Metals: Synthesis and Photophysical Evaluation. J. Mol. Struct. 2020, 1217, 128430. [Google Scholar] [CrossRef]
- Zawadiak, J.; Mrzyczek, M. Influence of Substituent on UV Absorption and Keto-Enol Tautomerism Equilibrium of Dibenzoylmethane Derivatives. Spectrochim. Acta Part A Mol. Biomol. Spectrosc. 2012, 96, 815–819. [Google Scholar] [CrossRef]
- Yang, W.; Cheng, Z.; Xu, Y.; Shao, J.; Zhou, W.; Xie, J.; Li, M. A Highly Selective Fluorescent Chemosensor for Cyanide Anions Based on a Chalcone Derivative in the Presence of Iron(III) Ions, and Its Capacity for Living Cell Imaging in Mixed Aqueous Systems. New J. Chem. 2015, 39, 7488–7494. [Google Scholar] [CrossRef]
- Mellado, M.; Roldan, N.; Miranda, R.; Aguilar, L.F.; Bravo, M.A.; Quiroz, W. Sensitive Fluorescent Chemosensor for Hg(II) in Aqueous Solution Using 4’-Dimethylaminochalcone. J. Fluoresc. 2022, 32, 1449–1456. [Google Scholar] [CrossRef]
- Wang, Y.; Gwon, S.-Y.; Wang, S.; Kim, S.-H. The Synthesis and Spectral Properties of a Stimuli-Responsive D-Pi-A Charge Transfer Dye Based on Indole Donor and Dicyanomethylene Acceptor Moiety. Spectrochim. Acta Part A Mol. Biomol. Spectrosc. 2012, 86, 294–298. [Google Scholar] [CrossRef]
- Khattab, T.A.; Rehan, M.; Aly, S.A.; Hamouda, T.; Haggag, K.M.; Klapoetke, T.M. Fabrication of PAN-TCF-Hydrazone Nanofibers by Solution Blowing Spinning Technique: Naked-Eye Colorimetric Sensor. J. Environ. Chem. Eng. 2017, 5, 2515–2523. [Google Scholar] [CrossRef]
- Son, Y.-A.; Gwon, S.-Y.; Kim, S.-H. Chromene and Imidazole Based D-Pi-A Chemosensor Preparation and Its Anion Responsive Effects. Mol. Cryst. Liquid Cryst. 2014, 599, 16–22. [Google Scholar] [CrossRef]
- Uahengo, V.; Naimhwaka, J.; Daniel, L.S.; Rahman, A.; Elzagheid, M.I.; Rhyman, L.; Ramasami, P.; Cai, P. A Colorimetric Probe for the Real-Time Naked Eye Detection of Cyanide and Hydroxide Ions in Tap Water: Experimental and Theoretical Studies. Analyst 2019, 144, 6422–6431. [Google Scholar] [CrossRef]
- Sharma, P.R.; Soni, V.K.; Pandey, S.; Choudhary, G.; Plappally, A.K.; Sharma, R.K. Dipicrylhydrazine: A Versatile Visual Anions Sensor. J. Environ. Chem. Eng. 2017, 5, 2232–2239. [Google Scholar] [CrossRef]
- Wang, Y.; Tang, B.; Zhang, S. A Visible Colorimetric PH Sensitive Chemosensor Based on Azo Dye of Benzophenone. Dyes Pigment. 2011, 91, 294–297. [Google Scholar] [CrossRef]
- Chen, H.; Luo, J.; Chen, S.; Qi, Y.; Zhou, T.; Tian, X.; Ding, F. Sensing Hypochlorite or PH Variations in Live Cells and Zebrafish with a Novel Dual-Functional Ratiometric and Colorimetric Chemosensor. Spectrochim. Acta Part A Mol. Biomol. Spectrosc. 2022, 271, 120915. [Google Scholar] [CrossRef]
- Mellado, M.; Sariego-Kluge, R.; Valdés-Navarro, F.; González, C.; Sánchez-González, R.; Pizarro, N.; Villena, J.; Jara-Gutierrez, C.; Cordova, C.; Bravo, M.A.; et al. Synthesis of Fluorescent Chalcones, Photophysical Properties, Quantitative Structure-Activity Relationship and Their Biological Application. Spectrochim. Acta Part A Mol. Biomol. Spectrosc. 2023, 291, 122332. [Google Scholar] [CrossRef]
- Hou, H.; Zhao, Y.; Li, C.; Wang, M.; Xu, X.; Jin, Y. Single-Cell PH Imaging and Detection for PH Profiling and Label-Free Rapid Identification of Cancer-Cells. Sci. Rep. 2017, 7, 1759. [Google Scholar] [CrossRef] [PubMed]
- Haldar, U.; Chaudhury, S.S.; Sharma, R.; Ruidas, B.; Patra, S.G.; Das Mukhopadhyay, C.; Lee, H. A Fluorimetric Water-Soluble Polymeric PH Chemosensor for Extremely Acidic Conditions: Live-Cell and Bacterial Imaging Application. Sens. Actuator B-Chem. 2020, 320, 128379. [Google Scholar] [CrossRef]
- Gharami, S.; Aich, K.; Ghosh, P.; Patra, L.; Murmu, N.; Mondal, T.K. A Simple Coumarin Based “Fluorescent On” Probe for the Selective Detection of Al3+ along with Its Application in Live Cell Imaging via AGS Cell Line. J. Photochem. Photobiol. A-Chem. 2020, 390, 112294. [Google Scholar] [CrossRef]
- Nagata, H.; Che, X.-F.; Miyazawa, K.; Tomoda, A.; Konishi, M.; Ubukata, H.; Tabuchi, T. Rapid Decrease of Intracellular PH Associated with Inhibition of Na+/H+ Exchanger Precedes Apoptotic Events in the MNK45 and MNK74 Gastric Cancer Cell Lines Treated with 2-Aminophenoxazine-3-One. Oncol. Rep. 2011, 25, 341–346. [Google Scholar] [CrossRef]
- Kim, S.Y.; Podder, A.; Lee, H.; Cho, Y.-J.; Han, E.H.; Khatun, S.; Sessler, J.L.; Hong, K.S.; Bhuniya, S. Self-Assembled Amphiphilic Fluorescent Probe: Detecting PH-Fluctuations within Cancer Cells and Tumour Tissues. Chem. Sci. 2020, 11, 9875–9883. [Google Scholar] [CrossRef]
- Yeo, M.; Kim, D.K.; Kim, Y.B.; Oh, T.Y.; Lee, J.E.; Cho, S.W.; Kim, H.C.; Hahm, K.B. Selective Induction of Apoptosis with Proton Pump Inhibitor in Gastric Cancer Cells. Clin. Cancer Res. 2004, 10, 8687–8696. [Google Scholar] [CrossRef]
- Hong, R.; Han, S.I. Extracellular Acidity Enhances Tumor Necrosis Factor-Related Apoptosis-Inducing Ligand (TRAIL)-Mediated Apoptosis via DR5 in Gastric Cancer Cells. Korean J. Physiol. Pharmacol. 2018, 22, 513–523. [Google Scholar] [CrossRef] [PubMed]
- Ngo, D.C.; Ververis, K.; Tortorella, S.M.; Karagiannis, T.C. Introduction to the Molecular Basis of Cancer Metabolism and the Warburg Effect. Mol. Biol. Rep. 2015, 42, 819–823. [Google Scholar] [CrossRef] [PubMed]
- Heiden, M.G.V.; Cantley, L.C.; Thompson, C.B. Understanding the Warburg Effect: The Metabolic Requirements of Cell Proliferation. Science 2009, 324, 1029–1033. [Google Scholar] [CrossRef] [PubMed]
- Yuan, L.-W.; Yamashita, H.; Seto, Y. Glucose Metabolism in Gastric Cancer: The Cutting-Edge. World J. Gastroenterol. 2016, 22, 2046–2059. [Google Scholar] [CrossRef] [PubMed]
- Hanahan, D. Hallmarks of Cancer: New Dimensions. Cancer Discov. 2022, 12, 31–46. [Google Scholar] [CrossRef]
- Harguindey, S.; Arranz, J.L.; Orozco, J.D.P.; Rauch, C.; Fais, S.; Cardone, R.A.; Reshkin, S.J. Cariporide and Other New and Powerful NHE1 Inhibitors as Potentially Selective Anticancer Drugs—An Integral Molecular/Biochemical/Metabolic/Clinical Approach after One Hundred Years of Cancer Research. J. Transl. Med. 2013, 11, 282. [Google Scholar] [CrossRef]
- Dolomanov, O.V.; Bourhis, L.J.; Gildea, R.J.; Howard, J.A.K.; Puschmann, H. OLEX2: A Complete Structure Solution, Refinement and Analysis Program. J. Appl. Crystallogr. 2009, 42, 339–341. [Google Scholar] [CrossRef]
- Sheldrick, G.M. A Short History of SHELX. Acta Crystallogr. Sect. A 2008, 64, 112–122. [Google Scholar] [CrossRef]
- Frisch, M.J.; Trucks, G.W.; Schlegel, H.B.; Scuseria, G.E.; Robb, M.A.; Cheeseman, J.R.; Scalmani, G.; Barone, V.; Petersson, G.A.; Nakatsuji, H.; et al. Gaussian 09, Revision A.02 2016; ScienceOpen, Inc.: Boston, MA, USA, 2009. [Google Scholar]
- Koley, D.; Bard, A.J. Triton X-100 Concentration Effects on Membrane Permeability of a Single HeLa Cell by Scanning Electrochemical Microscopy (SECM). Proc. Natl. Acad. Sci. USA 2010, 107, 16783–16787. [Google Scholar] [CrossRef]


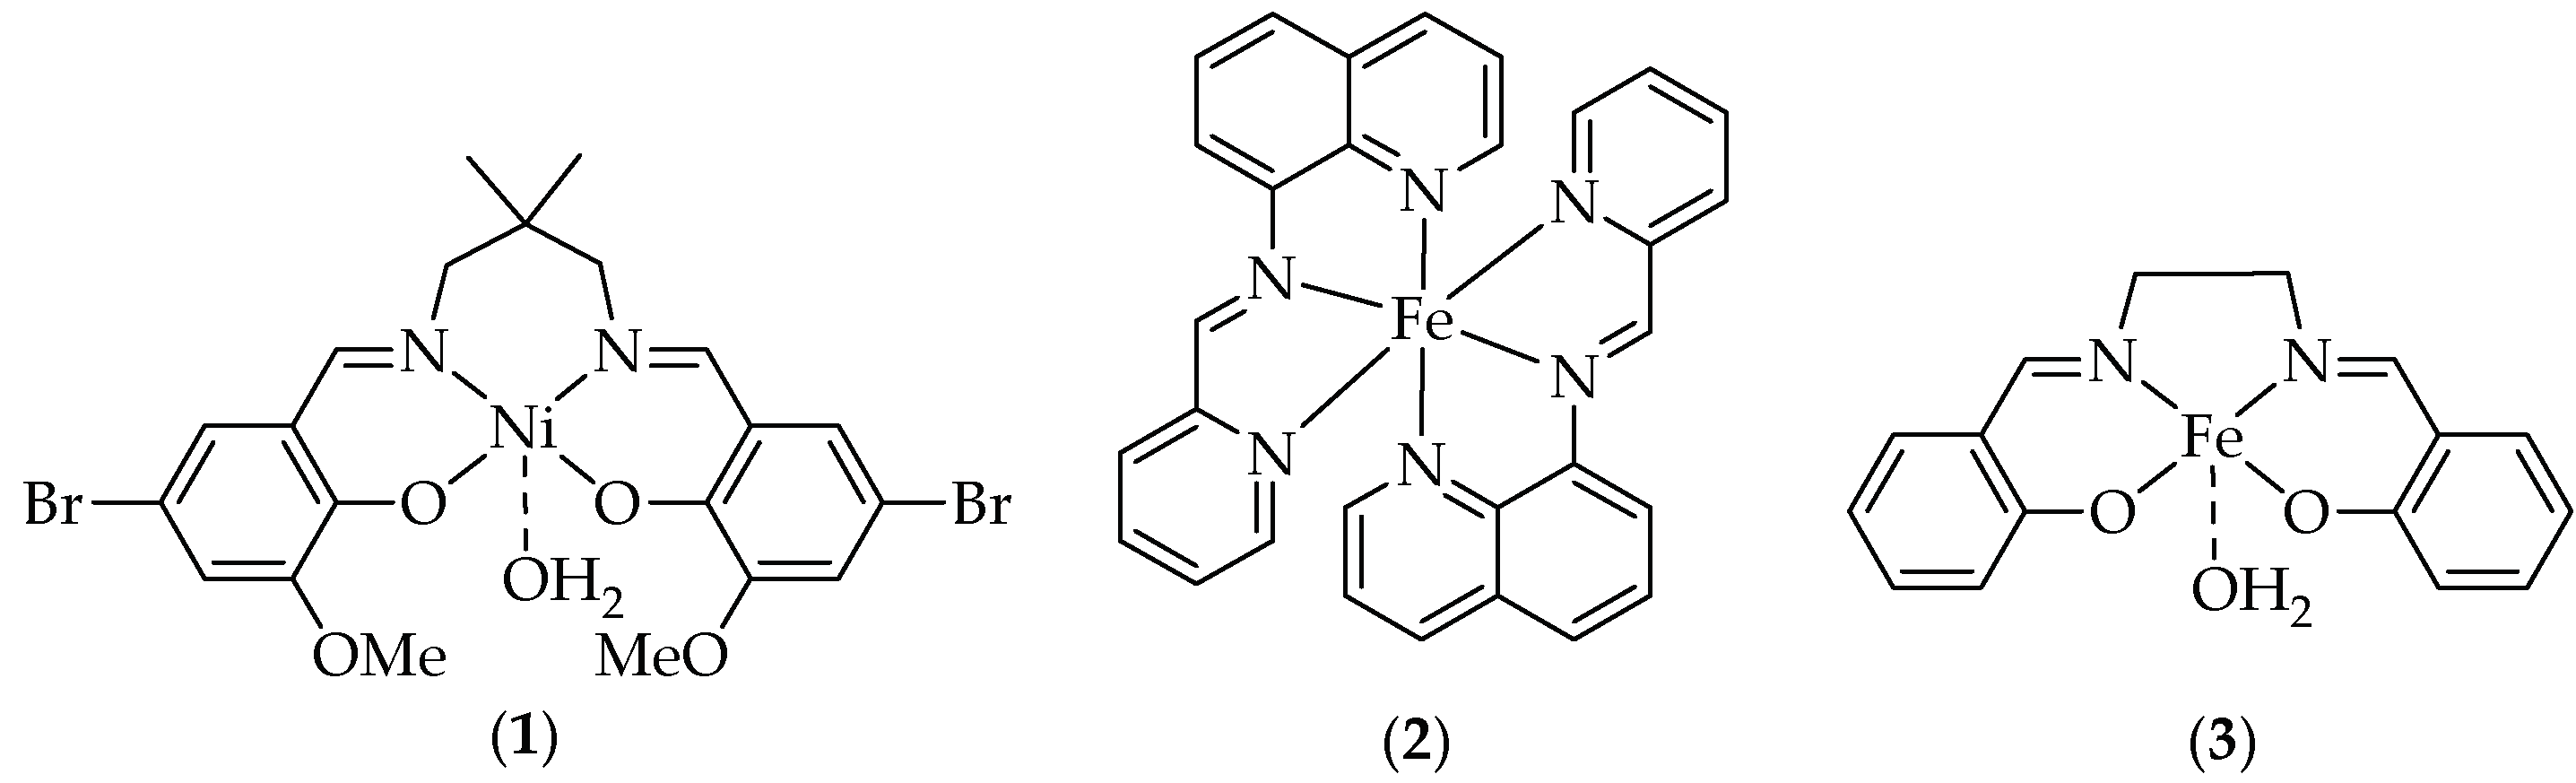
| Entry | Compound | Media a | Method b | LOD c | Kas d | Ref. |
|---|---|---|---|---|---|---|
| 1 |  | ACN:H2O | Colorimetric | N.R. e | 2.39 × 10⁴ | [33] |
| 2 | 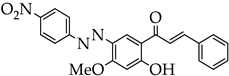 | DMSO:H2O 9:1 | Colorimetric | N.R. e | N.R. e | [35] |
| 3 | 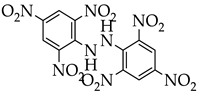 | ACN | Colorimetric | N.R. e | 24.41 × 10⁴ | [34] |
| 4 | 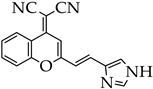 | DMSO | Colorimetric | N.R. e | N.R. e | [32] |
| 5 | 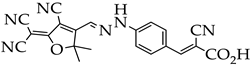 | ACN | Colorimetric | 4.08 ppb | N.R. e | [31] |
| 6 |  | PBS:DMSO 99:1 | Fluorometric | N.R. e | N.R. e | [5] |
| 7 |  | PBS:EtOH 99:1 | Fluorometric | N.R. e | N.R. e | [36] |
| 8 | 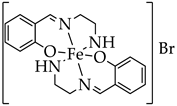 Iron (III) complex (C1) | DMSO | Fluorometric | 0.159 ppb | 5.86 × 10³ | Our study |
Disclaimer/Publisher’s Note: The statements, opinions and data contained in all publications are solely those of the individual author(s) and contributor(s) and not of MDPI and/or the editor(s). MDPI and/or the editor(s) disclaim responsibility for any injury to people or property resulting from any ideas, methods, instructions or products referred to in the content. |
© 2023 by the authors. Licensee MDPI, Basel, Switzerland. This article is an open access article distributed under the terms and conditions of the Creative Commons Attribution (CC BY) license (https://creativecommons.org/licenses/by/4.0/).
Share and Cite
Nilo, N.; Reyna-Jeldes, M.; Covarrubias, A.A.; Coddou, C.; Artigas, V.; Fuentealba, M.; Aguilar, L.F.; Saldías, M.; Mellado, M. A pH-Sensitive Fluorescent Chemosensor Turn-On Based in a Salen Iron (III) Complex: Synthesis, Photophysical Properties, and Live-Cell Imaging Application. Molecules 2023, 28, 7237. https://doi.org/10.3390/molecules28217237
Nilo N, Reyna-Jeldes M, Covarrubias AA, Coddou C, Artigas V, Fuentealba M, Aguilar LF, Saldías M, Mellado M. A pH-Sensitive Fluorescent Chemosensor Turn-On Based in a Salen Iron (III) Complex: Synthesis, Photophysical Properties, and Live-Cell Imaging Application. Molecules. 2023; 28(21):7237. https://doi.org/10.3390/molecules28217237
Chicago/Turabian StyleNilo, Nicole, Mauricio Reyna-Jeldes, Alejandra A. Covarrubias, Claudio Coddou, Vania Artigas, Mauricio Fuentealba, Luis F. Aguilar, Marianela Saldías, and Marco Mellado. 2023. "A pH-Sensitive Fluorescent Chemosensor Turn-On Based in a Salen Iron (III) Complex: Synthesis, Photophysical Properties, and Live-Cell Imaging Application" Molecules 28, no. 21: 7237. https://doi.org/10.3390/molecules28217237
APA StyleNilo, N., Reyna-Jeldes, M., Covarrubias, A. A., Coddou, C., Artigas, V., Fuentealba, M., Aguilar, L. F., Saldías, M., & Mellado, M. (2023). A pH-Sensitive Fluorescent Chemosensor Turn-On Based in a Salen Iron (III) Complex: Synthesis, Photophysical Properties, and Live-Cell Imaging Application. Molecules, 28(21), 7237. https://doi.org/10.3390/molecules28217237