Abstract
Reactive oxygen species (ROS) are pivotal signaling molecules that control a variety of physiological functions. As a member of the ROS family, peroxynitrite (ONOO−) possesses strong oxidation and nitrification abilities. Abnormally elevated levels of ONOO− can lead to cellular oxidative stress, which may cause several diseases. In this work, based on the rhodamine fluorophore, we designed and synthesized a novel small-molecule fluorescent probe (DH-1) for ONOO−. Upon reaction with ONOO−, DH-1 exhibited a significant fluorescence signal enhancement (approximately 34-fold). Moreover, DH-1 showed an excellent mitochondria-targeting capability. Confocal fluorescence imaging validated its ability to detect ONOO− changes in HeLa and RAW264.7 cells. Notably, we observed the ONOO− generation during the ferroptosis process by taking advantage of the probe. DH-1 displayed good biocompatibility, facile synthesis, and high selectivity, and may have potential applications in the study of ONOO−-associated diseases in biosystems.
1. Introduction
Reactive oxygen species (ROS) and reactive nitrogen species (RNS), e.g., peroxynitrite (ONOO−), nitric oxide (NO), hypochlorous acid (HOCl), and superoxide anion (O2•−), are a class of substances with extremely high reactivity [1,2,3]. Among them, ONOO−, which is formed through the reaction of NO with O2•−, has a low concentration and short life span [4,5]. On the one hand, the high reactivity of ONOO− is due to its intrinsic strong oxidizing and nitrifying abilities, which can directly react with the target molecules. On the other hand, ONOO− can be converted to secondary radical species, such as decomposition to •OH, or reaction with CO2 to produce CO3•−, which then reacts with the target molecules [6,7,8]. Therefore, ONOO− can destroy many important biomolecules (such as nucleic acids, proteins, and lipids) [9,10,11,12,13]. These biochemical properties make ONOO− an important predisposing factor for many diseases, including cardiovascular diseases, neurodegenerative diseases, inflammatory diseases, and cancer [14,15,16,17,18,19]. However, the high reactivity of ONOO− also plays a critical role in cell signaling processes, such as the nitrification of key proteins to regulate signaling pathways. In addition, ONOO− has an antibacterial effect and can be produced in large quantities during the process of deploying macrophages to fight against invading pathogens, such as bacteria, thereby helping to kill such pathogens. Hence, monitoring the ONOO− changes in biosystems is highly important.
Currently, small-molecule fluorescent probes have gained widespread interest and have become an effective means of detecting specific analytes, due to their high sensitivity, rapid response ability, unparalleled selectivity, and real-time measurement capability [20,21,22,23,24,25,26,27,28,29,30,31,32,33,34,35]. In addition, fluorescent probes, combined with cellular confocal imaging, have been useful tools for elucidating the biological functions of the analyte of interest. Among the commonly used fluorophores (e.g., coumarin, naphthalimide, BODIPY, cyanine), rhodamine dyes possess the advantages of good photostability, improved signal-to-background ratio, easy preparation, and high fluorescence brightness [36,37,38,39]. Nowadays, many rhodamine-based derivatives have been developed for the in vivo specific measurement of ONOO− [40,41,42,43,44].
Herein, we developed a new ONOO−-responsive molecular fluorescence probe (DH-1) by introducing a ferrocene moiety into the rhodamine framework. The probe itself is non-fluorescent; upon reaction with ONOO−, a remarkable fluorescence increase in the probe is observed in the in vitro tests and the fluorescence intensity shows good linearity. DH-1 exhibits higher selectivity and responsiveness towards ONOO− compared to other ROS/RNS. Notably, DH-1 can specifically target mitochondria with good biocompatibility. In addition, DH-1 has been successfully utilized for the fluorescence confocal imaging of ONOO− after exogenous and endogenous drug stimulations in living cells. More importantly, we employed DH-1 to detect ONOO− fluctuations in the ferroptosis process.
2. Results and Discussion
2.1. Design and Synthesis of the Probe DH-1
The probe DH-1 was designed based on a rhodamine fluorophore. The introduction of a ferrocene unit into the probe structure could quench the fluorescence of DH-1, and no fluorescence emission was noted. By contrast, after reaction with ONOO−, the C=C bond of DH-1 was oxidized and cleaved to form Rho-keto, which emitted a significant fluorescence signal (Scheme 1), thereby realizing the detection of ONOO−.
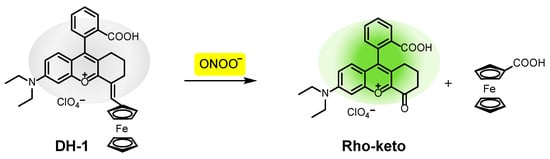
Scheme 1.
Mechanism of the probe DH-1 for sensing ONOO−.
DH-1 was synthesized in two steps, as shown in Scheme 2. First, cyclohexanone was condensed with compound 1 to gain intermediate Rho. Next, DH-1 was obtained through the aldol condensation reaction between Rho and ferrocenecarboxaldehyde with a 79% yield. It is worth noting that the alpha carbon of the carbonyl group is highly reactive, so ferrocene aldehyde is added at exactly the position of the alpha carbon in the cyclohexane fragment of rhodamine (Scheme 2). DH-1 was characterized using NMR spectra and HRMS. The characterization data are provided in the Supporting Information (Figures S1–S3).
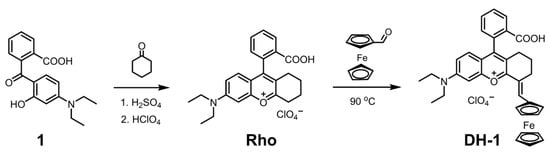
Scheme 2.
Synthesis of the probe DH-1.
2.2. Spectral Response of the Probe DH-1 to ONOO−
Initially, the spectroscopic properties of the probe DH-1 were studied. It can be seen from Figure 1 that the probe showed a clear absorption peak at about 500 nm without ONOO−. After the addition of 4 equivalent (eq.) ONOO−, the absorbance of the probe was significantly reduced. Such absorption changes may be attributed to the reaction of probe DH-1 with ONOO−, which caused the cleavage of the double bond by oxidation, and the destruction of the conjugated system. In addition, the proposed mechanism was further verified via MS, as shown in Figure S4. After reaction with ONOO−, probe DH-1 indeed converted to Rho-keto with a mass peak at m/z = 390.1 [M]+ [12,13]. The results indicated that our probe design and sensing mechanism for ONOO− detection was rational.
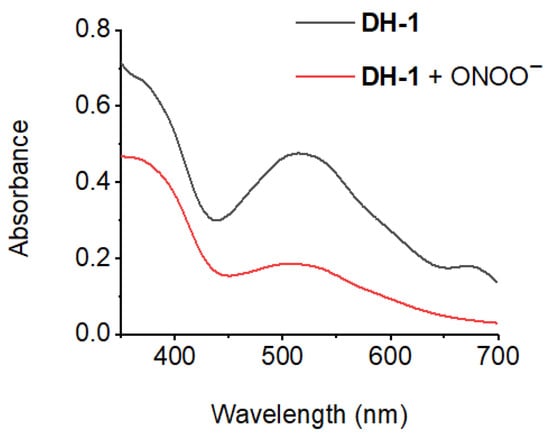
Figure 1.
Absorption spectra of DH-1 in the solution before (black) and after (red) the addition of ONOO−.
In addition, the excitation spectra of the probe before and after reaction with ONOO− were investigated. As shown in Figure S5, the excitation intensity was almost undetectable, since the probe itself was non-fluorescent (quantum yield < 0.04). Once ONOO− was added to the solution, the excitation intensity of the probe showed a maximum of approximately 400 nm. Therefore, we chose 400 nm as the excitation wavelength for the subsequent fluorescence property study.
We then explored the emission spectra of the probe upon the addition of various concentrations of ONOO−. The results shown in Figure 2 indicate that the fluorescence emission was remarkably enhanced, along with the titration of ONOO−. Moreover, there was a good linearity (R2 = 0.9994) between the fluorescence intensity of DH-1 and the ONOO− concentration (0~135 μM). Also, the detection limit was calculated to be 0.74 μM, which was lower than that of the previously reported ONOO− probes listed in Table S1. This indicated that probe DH-1 was rather sensitive to ONOO−, which would be favorable for intracellular ONOO− detection with high sensitivity.
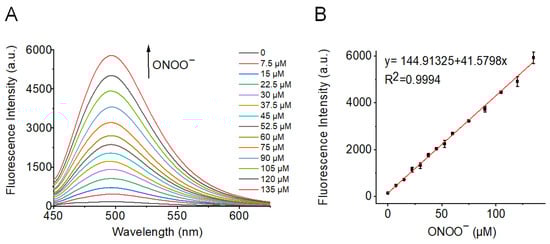
Figure 2.
Fluorescence titration study. (A) Fluorescence spectra changes in DH-1 after the addition of different concentrations of ONOO−. (B) Linear plot of the fluorescence emission of DH-1 versus ONOO−. λex = 400 nm; λem = 496 nm. The data were expressed as the mean ± standard deviation (SD) (n = 3).
Since many species in the biological system may potentially affect the detection performance of the probe; therefore, we assessed the selectivity of the probe DH-1. In this experiment, various biological components (e.g., amino acids, anions, metal cations) were added to the probe solution to compare the fluorescence signal. It can be seen in Figure 3A that, except for ONOO−, the addition of analytes had little effect on the fluorescence emission, whereas ONOO− could result in a significant fluorescence increase. It should be pointed out that reactive oxygen/nitrogen species, such as H2O2, HOCl, t-BuOOH, •OH, NO, as well as O2•−, did not cause significant fluorescence interference for ONOO− detection. The response performance of DH-1 will not be affected by reactive oxygen/nitrogen species. Thus, the probe DH-1 showed high selectivity to ONOO− in the complex biological samples.
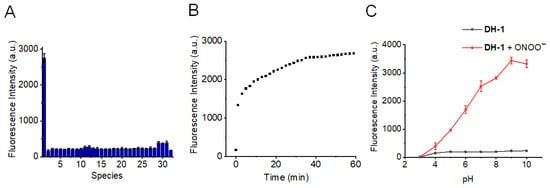
Figure 3.
(A) Fluorescence responses of DH-1 to various biologically relevant species. 1. ONOO− (60 μM); 2. blank (i.e., probe only); 3. arginine (1 mM); 4. cysteine (1 mM); 5. glutamic acid (1 mM); 6. glutathione (1 mM); 7. homocysteine (1 mM); 8. histidine (1 mM); 9. serine (1 mM); 10. alanine (1 mM); 11. H2O2 (100 μM); 12. HOCl (100 μM); 13. Ag+ (100 μM); 14. Ca2+ (100 μM); 15. Fe2+ (100 μM); 16. K+ (100 μM); 17. Mg2+ (100 μM); 18. Na+ (100 μM); 19. Zn2+ (100 μM); 20. Al3+ (100 μM); 21. CO32− (100 μM); 22. NO2− (100 μM); 23. NO3− (100 μM); 24. S2− (100 μM); 25. SO32− (100 μM); 26. S2O32− (100 μM); 27. SO42− (100 μM); 28. HSO3− (100 μM); 29. t-BuOOH (100 μM); 30. •OH (100 μM); 31. NO (100 μM); 32. O2•− (100 μM). (B) Dynamic fluorescence changes in DH-1 after the addition of ONOO− within 1 h. (C) pH effects on the fluorescence intensity of DH-1 with (red) and without (black) ONOO−. λex = 400 nm; λem = 496 nm. The data were expressed as the mean ± standard deviation (SD) (n = 3).
We further investigated the fluorescence kinetic properties of the probe. From Figure 3B, it can be noticed that the fluorescence of DH-1 increased rapidly in the presence of ONOO−. Also, the fluorescence signal reached its maximum in approximately 0.5 h. The time-course study indicated a rapid reaction of DH-1 with ONOO−. In addition, considering that pH is a critical factor for molecular probes, we tested the fluorescence signal variations of DH-1 within a pH range from 3 to 10. It can be noted in Figure 3C that the probe alone was almost unaffected by pH. After the addition of ONOO−, the fluorescence intensity of the probe DH-1 enhanced greatly in terms of physiological pH, demonstrating its good responsiveness to ONOO− in the detecting system. Moreover, we observed an interesting phenomenon: the fluorescence intensity of probe DH-1 with ONOO− in an acidic environment was lower than in a neutral or alkaline environment. The possible reaction mechanism of the probe with ONOO− followed two steps. The first step was the nucleophilic addition of ONOO−, which attacked the C=C bond; the second step was the unstable intermediate transformation into the Rho-keto form. The alkaline environment was beneficial to the nucleophilic addition reaction, thereby causing higher fluorescence at an alkaline pH than at an acidic pH. The same phenomenon could also be found in other reported papers about ONOO− probes [34,35].
2.3. Mitochondrial Targeting Ability of the Probe DH-1
Prior to cellular imaging, we carried out an MTT test to explore the probe DH-1’s cytotoxicity. It can be noted in Figure S6 that cell survival was hardly influenced after the cells were incubated with various doses of DH-1. This indicated that DH-1 had good biocompatibility.
For the purpose of probing DH-1’s ability to localize in different organelles, co-localization assays were carried out using the commercially available mitochondrial dye (Mito Red) or lysosomal dye (Lyso Red). Before the co-localization experiment, cells were incubated with the endogenous drugs lipopolysaccharide (LPS, 100 ng/mL) and murine recombinant interferon-γ (IFN-γ, 100 ng/mL) to generate endogenous ONOO−. It can be seen in Figure 4A,C that, in HeLa cells, the green fluorescence of DH-1 overlapped well with the red fluorescence of Mito Red, and a rather high Pearson’s coefficient of 0.97 was determined. Meanwhile, we employed Lyso Red for comparison. It can be observed in Figure 4B,D that the overlap between DH-1 and Lyso Red was small, whereas the corresponding Pearson’s coefficient was only 0.37. The results indicated that DH-1 was able to effectively and selectively localize in mitochondria. Furthermore, we next conducted the co-localizing assay in RAW264.7 cells, and similar phenomena were observed, as shown in Figure 5. Hence, it could be concluded that DH-1 was capable of targeting the mitochondria in cells.
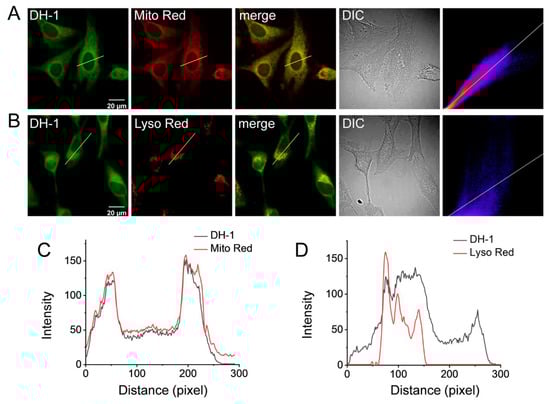
Figure 4.
Co-localization fluorescence imaging of 5 μM DH-1 and 100 nM Mito Red (A) or Lyso Red (B) in HeLa cells. (C) Intensity profiles within the ROI (region of interest; yellow line in the merge image in panel A). (D) Intensity profiles within the ROI (yellow line in the merge image in panel B). Pearson’s coefficient of Mito Red and DH-1 was 0.97; Pearson’s coefficient of Lyso Red and DH-1 was 0.37. DH-1: λex = 405 nm, λem = 500–540 nm; Mito Red: λex = 561 nm, λem = 570–620 nm; Lyso Red: λex = 561 nm, λem = 570–620 nm.

Figure 5.
Co-localization fluorescence imaging of 5 μM DH-1 and 100 nM Mito Red (A) or Lyso Red (B) in RAW264.7 cells. (C) Intensity profiles within the ROI (yellow line in the merge image in panel A). (D) Intensity profiles within the ROI (yellow line in the merge image in panel B). Pearson’s coefficient of Mito Red and DH-1 was 0.92; Pearson’s coefficient of Lyso Red and DH-1 was 0.41. DH-1: λex = 405 nm, λem = 500–540 nm; Mito Red: λex = 561 nm, λem = 570–620 nm; Lyso Red: λex = 561 nm, λem = 570–620 nm.
2.4. Imaging of ONOO− by the Probe DH-1 in Cells
Encouraged by the outstanding spectroscopic responses and specific mitochondria-targeting ability, we subsequently attempted to verify the reactivity of DH-1 towards intracellular ONOO−. It can be seen in Figure 6A that when HeLa cells were cultivated with DH-1 alone (control), we only observed very weak fluorescence. However, if cells were first stimulated with 200 μM of SIN-1, which was a kind of exogenous ONOO− donor, the fluorescence became brighter. In addition, after treatment with the endogenous drugs LPS and IFN-γ, more pronounced fluorescence could be noted than that observed in control cells. Moreover, a subsequent incubation with phorbol-12-myristate-13-acetate (PMA) also produced strong fluorescence. Furthermore, in order to confirm that the increase in intracellular signal was ascribed to the production of endogenous ONOO−, a contrast group with aminoguanidine (AG, an inhibitor of nitric oxide synthase) was compared at the same time. It can be noted in image e in Figure 6A that the fluorescence intensity was remarkably diminished once the cells were incubated with LPS, IFN-γ, and PMA in the presence of AG. The above data well proved that DH-1 was specifically responsive to intracellular ONOO−. The corresponding quantitative intensity statistics explicitly demonstrated these fluorescence changes (Figure 6B). The results suggested that the probe DH-1 could track the intracellular ONOO− fluctuations in response to the stimulation of exogenous and endogenous drugs. More importantly, these responses were not only observed in HeLa cells, but we also observed similar experiment phenomena in RAW264.7 cells (Figure 7), further indicating the desirable fluorescence responses of DH-1 in living cells.
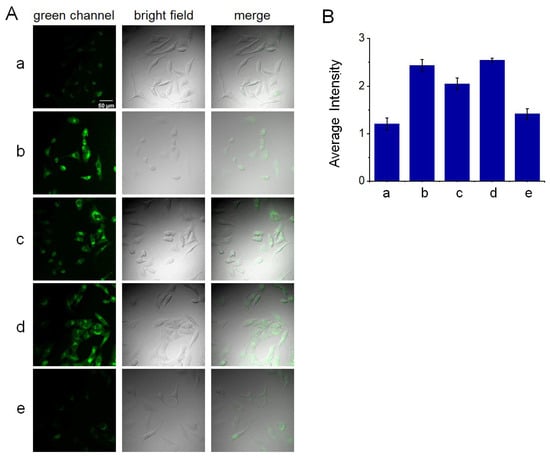
Figure 6.
Cellular imaging of ONOO− using DH-1 in HeLa cells. (A) Confocal imaging of HeLa cells incubated at various conditions: (a) HeLa cells were incubated with 5 μM DH-1 for 10 min. (b) HeLa cells were pretreated with 200 μM of 3-morpholinosydnonimine hydrochloride (SIN-1) for 2.5 h, then incubated with DH-1. (c) HeLa cells were pretreated with 100 ng/mL of LPS and 100 ng/mL of IFN-γ for 9 h, then incubated with DH-1. (d) HeLa cells were pretreated with LPS and IFN-γ for 9 h, then cultivated with 10 nM of PMA for 30 min, followed by incubation with DH-1. (e) HeLa cells were pretreated with LPS and IFN-γ for 9 h, then cultivated with 10 nM of PMA for 30 min, followed by incubation with 1 mM of AG for 30 min; finally, the cells were incubated with DH-1. (B) Cellular fluorescence intensity quantitation in panel A. All the cells in the field of vision were used for statistical quantitation, and the cell number was >10 in one separate experiment. The data were expressed as the mean ± standard deviation (SD) of three separate measurements.
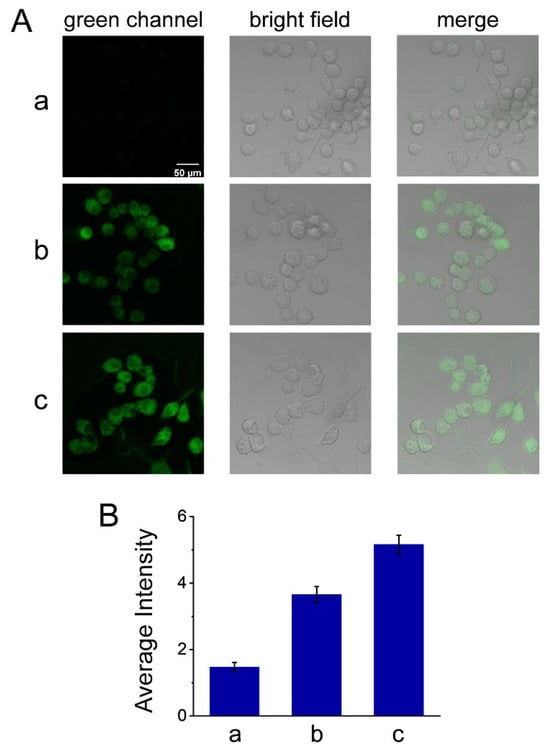
Figure 7.
Cellular imaging of ONOO− using DH-1 in RAW264.7 cells. (A) Confocal imaging of RAW264.7 cells cultivated at various conditions: (a) RAW264.7 cells were incubated with 5 μM DH-1 for 10 min. (b) RAW264.7 cells were first stimulated with 100 ng/mL of LPS and 100 ng/mL of IFN-γ for 10 h, followed by incubation with DH-1. (c) RAW264.7 cells were first stimulated with LPS and IFN-γ, and then cultivated with 10 nM of PMA for 30 min, followed by incubation with DH-1. (B) Cellular fluorescence intensity quantitation in panel A. All the cells in the field of vision were used for statistical quantitation, and the cell number was >10 in one separate experiment. The data were expressed as the mean ± standard deviation (SD) of three separate measurements.
2.5. Fluorescence Imaging of ONOO− during Ferroptosis
According to the previous literature, ferroptosis is one kind of cell death resulting from the iron-dependent accumulation of lipid peroxides associated with ROS. Among the ROS family, ONOO− is related to lipid peroxidation and glutathione depletion during the ferroptosis process [45]. In this study, we explored the biological application of DH-1 for detecting ONOO− during ferroptosis. Herein, erastin, which is a common inducer of ferroptosis, was employed. HeLa cells were pretreated with erastin for 15 h and then incubated with DH-1 for 30 min. It could be seen from Figure 8 that the fluorescence intensity was significantly enhanced compared with control cells without the stimulation of erastin. In addition, we carried out the inhibition experiment by using ferrostatin-1 (Fer-1), which is a common ferroptosis inhibitor. As displayed in the third row of Figure 8A, intracellular fluorescence intensity was largely weakened in the presence of Fer-1, which could further prove that the ONOO− produced during the ferroptosis process indeed resulted in the fluorescence signal changes. The results showed that the probe DH-1 may be a promising instrument for monitoring the dynamic ONOO− changes in erastin-induced ferroptosis.
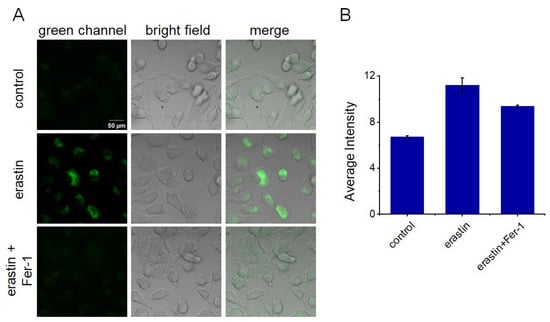
Figure 8.
Cellular ONOO− imaging during ferroptosis process in HeLa cells. (A) Confocal fluorescence images of cells incubated at various conditions. First row (control): cells were cultivated with DH-1 (10 µM) for 30 min; second row: cells were cultivated with erastin (40 µM) for 15 h, and next treated with DH-1; third row: cells were cultivated with erastin (40 µM) for 15 h, and next treated with Fer-1 (10 µM) for 15 h, followed by incubation with DH-1. (B) Cellular fluorescence intensity quantitation in panel A. λex = 405 nm; and λem = 500–540 nm. All the cells in the field of vision were used for statistical quantitation, and the cell number was >10 in one separate experiment. The data were expressed as the mean ± standard deviation (SD) of three separate measurements.
3. Materials and Methods
3.1. General
Nuclear magnetic resonance (NMR) spectra (including 1H and 13C NMR) were acquired using Bruker Avance-400 spectrometer. HRMS were obtained using Q-TOF6510 spectrograph (Agilent, Santa Clara, CA, USA). The pH of the solution was adjusted using a PHSJ-3F pH meter (LeiCi, Shanghai, China). Absorption spectra were collected using a U-3900 spectrophotometer (Hitachi, Tokyo, Japan). Emission spectra were measured using F-4600 spectrophotometer (Hitachi, Japan). Cellular fluorescence images were captured using FV3000 confocal scanning microscope (Olympus, Tokyo, Japan).
Ultrapure water was used in all the tests. All chemicals were provided by commercial sources and were of analytical grade. They were directly used without further purification. Mito Red and Lyso Red were purchased from KeyGEN BioTECH Co. Ltd., Nanjing, China.
3.2. Synthesis of the Probe DH-1
The probe DH-1 was prepared following the synthetic route outlined in Scheme 2, in which compound Rho was prepared using the previous method [46]. Rho (190 mg, 0.4 mmol) and ferrocenecarboxaldehyde (43 mg, 0.2 mmol) were added to the solution of toluene (10 mL) and n-butanol (10 mL). The mixture was stirred at 90 ºC for 4 h. Next, the solvent was evaporated. Subsequently, the residues were purified via silica gel chromatography with CH2Cl2/MeOH (15:1, v/v) as the eluent to provide DH-1 (yield: 79%). 1H NMR (400 MHz, DMSO-d6) δ 7.94 (d, J = 7.6 Hz, 1H), 7.79 (t, J = 7.6 Hz, 1H), 7.67 (t, J = 7.6 Hz, 1H), 7.32 (d, J = 8.0 Hz, 1H), 7.06 (s, 1H), 6.52 (d, J = 2.4 Hz, 1H), 6.44 (dd, J = 9.2, 2.4 Hz, 1H), 6.37 (d, J = 8.8 Hz, 1H), 4.54 (s, 2H), 4.38 (s, 2H), 4.18 (s, 5H), 3.36 (q, J = 6.8 Hz, 4H), 2.73–2.83 (m, 1H), 2.52–2.60 (m, 1H), 1.75–1.85 (m, 1H), 1.57–1.70 (m, 2H), 1.47–1.56 (m, 1H), 1.10 (t, J = 6.8 Hz, 6H). 13C NMR (100 MHz, DMSO-d6) δ 152.25, 149.42, 147.21, 135.71, 130.31, 128.75, 127.34, 126.96, 125.12, 124.03, 123.94, 109.30, 106.03, 104.76, 97.33, 86.80, 81.35, 70.34, 70.27, 69.66, 69.54, 69.43, 44.15, 27.32, 23.10, 22.34, 12.85. HRMS m/z: calcd for C35H34FeNO3+ [M]+: m/z 572.1883; found: m/z 572.1879.
3.3. Spectroscopic Measurements
DH-1 was dissolved in dimethyl sulfoxide to obtain stock solution (10−3 mol/L). A 5 mL sample of the mixture solution containing DH-1 (final concentration, 15 μM) was combined with an appropriate volume of PBS and ONOO− reacted at 37 °C for 1 h. Subsequently, 3 mL of the solution was transferred to the quartz cell to collect the absorbance and fluorescence spectra.
3.4. Culture of Cells
HeLa and RAW264.7 cells were cultured in DMEM, and the detailed culture conditions were the same as in the previous literature [47]. Cytotoxicity of probe DH-1 was evaluated using standard MTT method.
3.5. Colocalization Experiments
RAW264.7 or HeLa cells were pretreated with LPS (100 ng/mL) and IFN-γ (100 ng/mL) for 9–10 h to generate endogenous ONOO−. Subsequently, cells seeded in glass-bottom dish were co-stained with DH-1 (5 μM) and Mito Red (100 nM) or Lyso Red (100 nM) for 10 min at 37 °C. After being washed with PBS buffer 3 times, the cell images were captured using an Olympus FV3000 microscope. The excitation was set at 405 nm for DH-1 or 561 nm for Mito Red and Lyso Red; the corresponding fluorescence emissions were collected at 500–540 nm for DH-1 or 570–620 nm for Mito Red and Lyso Red.
3.6. Intracellular Fluorescence Imaging
Control (without stimulation): cells were incubated with DH-1 (5 μM) for 10 min.
Exogenous drug stimulation: cells were incubated with the exogenous drug SIN-1 (200 μM) for 2.5 h, and then rinsed with PBS buffer, followed by incubation with DH-1 (5 μM) for 10 min.
Endogenous drug stimulation: in the first group, cells were incubated with the endogenous drugs LPS (100 ng/mL) and IFN-γ (100 ng/mL) for 9–10 h, and then rinsed with PBS buffer, followed by incubation with DH-1 (5 μM) for 10 min. In the second group, cells were first incubated with LPS and IFN-γ, and then treated with PMA (10 nM) for 0.5 h, followed by incubation with DH-1 for 10 min. In the third group, cells were first incubated with LPS and IFN-γ, and then treated with PMA (10 nM) for 0.5 h, followed by incubation with AG (1 mM) for 0.5 h; finally, the cells were incubated with DH-1 for 10 min.
Finally, all the groups were subjected to cell fluorescence imaging with 405 nm excitation, and the corresponding fluorescence emissions were collected from 500 to 540 nm.
4. Conclusions
In conclusion, we have developed a new molecular fluorescence probe, DH-1, to detect cellular ONOO− based on the rhodamine skeleton. DH-1 showed many desirable properties, including high sensitivity, unique specificity, and physiological pH response, along with good biocompatibility. Moreover, DH-1 was capable of targeting mitochondria and detecting intracellular exogenous and endogenous ONOO− changes. In addition, we have successfully applied DH-1 for ONOO− imaging in the ferroptosis process; intracellular fluorescence could be efficiently attenuated in the presence of a ferroptosis inhibitor. Thus, the probe might act as an effective molecular tool for probing the biological functions of ONOO− in clinical practice.
Supplementary Materials
The following supporting information can be downloaded at: https://www.mdpi.com/article/10.3390/molecules28247976/s1, Figure S1: 1H NMR spectrum of DH-1; Figure S2: 13C NMR spectrum of DH-1; Figure S3: HRMS of DH-1; Figure S4: MS of the reaction solution containing DH-1 and ONOO−; Figure S5: Excitation spectra of DH-1 before and after reaction with ONOO−; Figure S6: Viability of HeLa cells treated with DH-1 at different concentrations (0–20 μM); Table S1: Comparison of DH-1 with other ONOO− fluorescent probes. References [48,49,50,51,52].
Author Contributions
Conceptualization, X.-Q.C., S.S. and X.-F.Z.; methodology, H.D.; software, H.D. and X.-F.Z.; validation, M.-Y.T.; formal analysis, H.D. and M.-Y.T.; investigation, X.-Q.C. and S.S.; data curation, H.D.; writing—original draft preparation, H.D.; writing—review and editing, S.S. and X.-F.Z.; visualization, X.-Q.C.; supervision, S.S. and X.-F.Z.; project administration, X.-Q.C.; funding acquisition, X.-Q.C. and S.S. All authors have read and agreed to the published version of the manuscript.
Funding
This research was funded by the Academic Promotion Program of Shandong First Medical University (2019QL008) and the Tai’an Science and Technology Innovation Development Project (2022NS307).
Institutional Review Board Statement
Not applicable.
Informed Consent Statement
Not applicable.
Data Availability Statement
The data presented in this study are available in the article and Supplementary Materials.
Conflicts of Interest
The authors declare no conflict of interest.
References
- Wang, K.; Guo, R.; Chen, X.Y.; Yang, Y.S.; Qiao, L.Q.; Wang, M.L. Multifunctional lysosome-targetable fluorescent probe for imaging peroxynitrite in acute liver injury model. Chem. Eng. J. 2023, 455, 140491. [Google Scholar] [CrossRef]
- Luo, X.; Cheng, Z.; Wang, R.; Yu, F. Indication of dynamic peroxynitrite fluctuations in the rat epilepsy model with a near-infrared two-photon fluorescent probe. Anal. Chem. 2021, 93, 2490–2499. [Google Scholar] [CrossRef]
- Li, H.; Liu, Y.; Li, X.; Li, X.; Ma, H. Design, synthesis and application of a dual-functional fluorescent probe for reactive oxygen species and viscosity. Spectrochim. Acta A Mol. Biomol. Spectrosc. 2021, 246, 119059. [Google Scholar] [CrossRef] [PubMed]
- Cheng, D.; Pan, Y.; Wang, L.; Zeng, Z.; Yuan, L.; Zhang, X.; Chang, Y.T. Selective visualization of the endogenous peroxynitrite in an inflamed mouse model by a mitochondria-targetable two-photon ratiometric fluorescent probe. J. Am. Chem. Soc. 2017, 139, 285–292. [Google Scholar] [CrossRef] [PubMed]
- Mao, Z.Q.; Xiong, J.H.; Wang, P.Z.; An, J.S.; Zhang, F.; Liu, Z.H.; Kim, J.S. Activity-based fluorescence probes for pathophysiological peroxynitrite fluxes. Coord. Chem. Rev. 2022, 454, 214356. [Google Scholar] [CrossRef]
- Darley-Usmar, V.M.; Hogg, N.; O’leary, V.J.; Wilson, M.T.; Moncada, S. The simultaneous generation of superoxide and nitric oxide can initiate lipid peroxidation in human low density lipoprotein. Free Rad. Res. Comms. 1992, 17, 9–20. [Google Scholar] [CrossRef]
- Pacher, P.; Beckman, J.S.; Liaudet, L. Nitric oxide and peroxynitrite in health and disease. Physio. Rev. 2007, 87, 315–424. [Google Scholar] [CrossRef]
- Radi, R.; Cassina, A.; Hodara, R. Nitric oxide and peroxynitrite interactions with mitochondria. Biol. Chem. 2002, 383, 401–409. [Google Scholar] [CrossRef]
- Zhang, X.F.; Shen, L.; Wang, S.; Chen, Q.; Cao, X.Q.; Shen, S.L.; Li, X. A new xanthene-based platform for developing NIR fluorogenic probes for in vivo bioimaging. Chem. Eng. J. 2023, 472, 145065. [Google Scholar] [CrossRef]
- Ren, M.H.; Zhou, C.Y.; Wang, L.F.; Lv, X.; Guo, W. Rationally designed meso-benzimidazole-pyronin with emission wavelength beyond 700 nm enabling in vivo visualization of acute-liver-injury-induced peroxynitrite. Chin. Chem. Lett. 2023, 34, 107646. [Google Scholar] [CrossRef]
- Zhang, K.; Zhang, Y.; Lan, Y.; Wang, F.; Gou, Z.; Yan, M.; Zuo, Y. Hyperbranched polysiloxane-based probe with enhanced lipophilicity for visualizing ONOO- fluctuations in endoplasmic reticulum. Anal. Chim. Acta 2023, 1249, 340939. [Google Scholar] [CrossRef] [PubMed]
- Shu, W.; Wu, Y.L.; Shen, T.J.; Cui, J.; Kang, H.; Jing, J.; Zhang, X.L. A mitochondria-targeted far red fluorescent probe for ratiometric imaging of endogenous peroxynitrite. Dye. Pigment. 2019, 170, 107609. [Google Scholar] [CrossRef]
- Lu, J.; Li, Z.; Zheng, X.; Tan, J.; Ji, Z.; Sun, Z.; You, J. A rapid response near-infrared ratiometric fluorescent probe enabled in real-time peroxynitrite tracking for pathological diagnosing and therapeutic assessment in rheumatoid arthritis model. J. Mater. Chem. B 2020, 8, 9343–9350. [Google Scholar] [CrossRef] [PubMed]
- Zeng, X.D.; Li, Z.L.; Fu, J.; Jiang, C.; Ma, M.S.; Zhu, L.; Jin, X. A novel ultrasensitive peroxynitrite-specific fluorescent probe and its bioimaging applications in living systems. Dye. Pigment. 2021, 186, 108982. [Google Scholar] [CrossRef]
- Zhang, J.; Zhen, X.; Zeng, J.; Pu, K. A dual-modal molecular probe for near-infrared fluorescence and photoacoustic imaging of peroxynitrite. Anal. Chem. 2018, 90, 9301–9307. [Google Scholar] [CrossRef] [PubMed]
- Huang, Y.; Yu, L.; Fu, L.L.; Hou, J.J.; Wang, L.X.; Sun, M.Z.; Wang, X.Y.; Chen, L.X. Molecular fluorescent probes for imaging and evaluation of peroxynitrite fluctuations in living cells and in vivo under hypoxic stress. Sens. Actuators B Chem. 2022, 370, 132410. [Google Scholar] [CrossRef]
- Ferrer-Sueta, G.; Radi, R. Chemical biology of peroxynitrite: Kinetics, diffusion, and radicals. ACS Chem. Biol. 2009, 4, 161–177. [Google Scholar] [CrossRef]
- Feng, S.M.; Zheng, Z.P.; Gong, S.Y.; Feng, G.Q. A unique probe enables labeling cell membrane and Golgi apparatus and tracking peroxynitrite in Golgi oxidative stress and drug-induced liver injury. Sens. Actuators B Chem. 2022, 361, 131751. [Google Scholar] [CrossRef]
- Wu, L.; Liu, J.; Tian, X.; Groleau, R.R.; Bull, S.D.; Li, P.; Tang, B.; James, T.D. Fluorescent probe for the imaging of superoxide and peroxynitrite during drug-induced liver injury. Chem. Sci. 2021, 12, 3921–3928. [Google Scholar] [CrossRef]
- Liu, S.; Zhu, Y.; Wu, P.; Xiong, H. Highly sensitive D-A-D-type near-infrared fluorescent probe for nitric oxide real-time imaging in inflammatory bowel disease. Anal. Chem. 2021, 93, 4975–4983. [Google Scholar] [CrossRef]
- Zhu, H.C.; Liu, C.Y.; Rong, X.D.; Zhang, Y.; Su, M.J.; Wang, X.; Liu, M.Y.; Zhang, X.H.; Sheng, W.L.; Zhu, B.C. A new isothiocyanate-based Golgi-targeting fluorescent probe for Cys and its bioimaging applications during the Golgi stress response. Bioorg. Chem. 2022, 122, 105741. [Google Scholar] [CrossRef]
- Yin, G.; Gan, Y.; Jiang, H.; Yu, T.; Liu, M.; Zhang, Y.; Li, H.; Yin, P.; Yao, S. Direct quantification and visualization of homocysteine, cysteine, and glutathione in Alzheimer’s and Parkinson’s disease model tissues. Anal. Chem. 2021, 93, 9878–9886. [Google Scholar] [CrossRef] [PubMed]
- Zhao, Y.; Kim, H.S.; Zou, X.; Huang, L.; Liang, X.; Li, Z.; Kim, J.S.; Lin, W. Harnessing dual-fluorescence lifetime probes to validate regulatory mechanisms of organelle interactions. J. Am. Chem. Soc. 2022, 144, 20854–20865. [Google Scholar] [CrossRef] [PubMed]
- Wang, P.; Yu, L.; Gong, J.; Xiong, J.; Zi, S.; Xie, H.; Zhang, F.; Mao, Z.; Liu, Z.; Kim, J.S. An activity-based fluorescent probe for imaging fluctuations of peroxynitrite (ONOO-) in the Alzheimer’s disease brain. Angew. Chem. Int. Ed. Engl. 2022, 61, e202206894. [Google Scholar] [CrossRef] [PubMed]
- Cheng, D.; Peng, J.; Lv, Y.; Su, D.; Liu, D.; Chen, M.; Yuan, L.; Zhang, X. De novo design of chemical stability near-infrared molecular probes for high-fidelity hepatotoxicity evaluation in vivo. J. Am. Chem. Soc. 2019, 141, 6352–6361. [Google Scholar] [CrossRef] [PubMed]
- Oliden-Sanchez, A.; Alvarado-Martinez, E.; Ramirez-Ornelas, D.E.; Vazquez, M.A.; Avellanal-Zaballa, E.; Banuelos, J.; Pena-Cabrera, E. Extended BODIPYs as red-NIR laser radiation sources with emission from 610 nm to 750 nm. Molecules 2023, 28, 4750. [Google Scholar] [CrossRef]
- He, L.; He, L.H.; Xu, S.; Ren, T.B.; Zhang, X.X.; Qin, Z.J.; Zhang, X.B.; Yuan, L. Engineering of reversible NIR-II redox-responsive fluorescent probes for imaging of inflammation in vivo. Angew. Chem. Int. Ed. Engl. 2022, 61, e202211409. [Google Scholar] [CrossRef]
- Sun, L.; Ouyang, J.; Zeng, F.; Wu, S. An AIEgen-based oral-administration nanosystem for detection and therapy of ulcerative colitis via 3D-MSOT/NIR-II fluorescent imaging and inhibiting NLRP3 inflammasome. Biomaterials 2022, 283, 121468. [Google Scholar] [CrossRef]
- Ueno, T.; Urano, Y.; Kojima, H.; Nagano, T. Mechanism-based molecular design of highly selective fluorescence probes for nitrative stress. J. Am. Chem. Soc. 2006, 128, 10640–10641. [Google Scholar] [CrossRef]
- Debowska, K.; Debski, D.; Michalowski, B.; Dybala-Defratyka, A.; Wojcik, T.; Michalski, R.; Jakubowska, M.; Selmi, A.; Smulik, R.; Piotrowski, L.; et al. Characterization of fluorescein-based monoboronate probe and its application to the detection of peroxynitrite in endothelial cells treated with doxorubicin. Chem. Res. Toxicol. 2016, 29, 735–746. [Google Scholar] [CrossRef]
- Chen, Z.J.; Tian, Z.Q.; Kallio, K.; Oleson, A.L.; Ji, A.; Borchardt, D.; Jiang, D.E.; Remington, S.J.; Ai, H.W. The N-B interaction through a water bridge: Understanding the chemoselectivity of a fluorescent protein based probe for peroxynitrite. J. Am. Chem. Soc. 2016, 138, 4900–4907. [Google Scholar] [CrossRef]
- Yu, F.B.; Li, P.; Li, G.Y.; Zhao, G.J.; Chu, T.S.; Han, K.L. A near-IR reversible fluorescent probe modulated by selenium for monitoring peroxynitrite and imaging in living cells. J. Am. Chem. Soc. 2011, 133, 11030–11033. [Google Scholar] [CrossRef]
- Peng, T.; Wong, N.K.; Chen, X.M.; Chan, Y.K.; Ho, D.H.H.; Sun, Z.N.; Hu, J.J.; Shen, J.G.; El-Nezami, H.; Yang, D. Molecular imaging of peroxynitrite with HKGreen-4 in live cells and tissues. J. Am. Chem. Soc. 2014, 136, 11728–11734. [Google Scholar] [CrossRef] [PubMed]
- Fang, Y.; Chen, R.X.; Qin, H.F.; Wang, J.J.; Zhang, Q.; Chen, S.; Wen, Y.H.; Wang, K.P.; Hu, Z.Q. A chromene based fluorescence probe: Accurate detection of peroxynitrite in mitochondria, not elsewhere. Sens. Actuators B Chem. 2021, 334, 129603. [Google Scholar] [CrossRef]
- Zhou, D.Y.; Li, Y.; Jiang, W.L.; Tian, Y.; Fei, J.; Li, C.Y. A ratiometric fluorescent probe for peroxynitrite prepared by de novo synthesis and its application in assessing the mitochondrial oxidative stress status in cells and in vivo. Chem. Commun. 2018, 54, 11590–11593. [Google Scholar] [CrossRef]
- Zhang, X.; Shen, S.; Liu, D.; Li, X.; Shi, W.; Ma, H. Combination of changeable π-conjugation and hydrophilic groups for developing water-soluble small-molecule NIR-II fluorogenic probes. Chem. Sci. 2023, 14, 2928–2934. [Google Scholar] [CrossRef] [PubMed]
- Xiong, T.; Li, M.; Chen, Y.; Du, J.; Fan, J.; Peng, X. A singlet oxygen self-reporting photosensitizer for cancer phototherapy. Chem. Sci. 2020, 12, 2515–2520. [Google Scholar] [CrossRef] [PubMed]
- Zhang, Y.; Zhang, X.F.; Chen, Q.; Cao, X.Q.; Shen, S.L. A novel near-infrared fluorescence off-on probe for imaging hypoxia and nitroreductase in cells and in vivo. Sens. Actuators B Chem. 2022, 353, 131145. [Google Scholar] [CrossRef]
- Zhang, X.; Li, X.; Shi, W.; Ma, H. Sensitive imaging of tumors using a nitroreductase-activated fluorescence probe in the NIR-II window. Chem. Commun. 2021, 57, 8174–8177. [Google Scholar] [CrossRef]
- Li, H.Y.; Li, X.H.; Wu, X.F.; Shi, W.; Ma, H.M. Observation of the generation of ONOO− in mitochondria under various stimuli with a sensitive fluorescence probe. Anal. Chem. 2017, 89, 5519–5525. [Google Scholar] [CrossRef]
- Xia, Q.F.; Feng, S.M.; Hong, J.X.; Feng, G.Q. One probe for multiple targets: A NIR fluorescent rhodamine-based probe for ONOO− and lysosomal pH detection in live cells. Sens. Actuators B Chem. 2021, 337, 129732. [Google Scholar] [CrossRef]
- Mao, G.J.; Gao, G.Q.; Dong, W.P.; Wang, Q.Q.; Wang, Y.Y.; Li, Y.; Su, L.; Zhang, G. A two-photon excited near-infrared fluorescent probe for imaging peroxynitrite during drug-induced hepatotoxicity and its remediation. Talanta 2021, 221, 121607. [Google Scholar] [CrossRef] [PubMed]
- Wu, D.; Ryu, J.C.; Chung, Y.W.; Lee, D.; Ryu, J.H.; Yoon, J.H.; Yoon, J. A far-red-emitting fluorescence probe for sensitive and selective detection of peroxynitrite in live cells and tissues. Anal. Chem. 2017, 89, 10924–10931. [Google Scholar] [CrossRef] [PubMed]
- Liu, Z.P.; Sun, Q.; Yan, M.; Zhang, C.L.; Yuan, H.; He, W.J. Activity-based fluorescent molecular logic gate probe for dynamic tracking of mitophagy induced by oxidative stress. Anal. Chem. 2021, 93, 3502–3509. [Google Scholar] [CrossRef] [PubMed]
- Wang, L.L.; Zhang, Y.R.; Zheng, M.H.; Wang, X.; Wu, X.; Jin, J.Y. A single fluorescent probe reveals changes in endoplasmic reticulum-mitochondria contact in hepatocytes during ferroptosis. Chem. Eng. J. 2023, 466, 143104. [Google Scholar] [CrossRef]
- Yuan, L.; Lin, W.; Yang, Y.; Chen, H. A unique class of near-infrared functional fluorescent dyes with carboxylic-acid-modulated fluorescence on/off switching: Rational design, synthesis, optical properties, theoretical calculations, and applications for fluorescence imaging in living animals. J. Am. Chem. Soc. 2012, 134, 1200–1211. [Google Scholar] [CrossRef]
- Chen, Q.; Zhang, X.F.; Wang, T.; Cao, X.Q.; Shen, S.L. A sensitive NIR mitochondria-targeting fluorescence probe for visualizing viscosity in living cells and mice. Anal. Chim. Acta 2022, 1231, 340443. [Google Scholar] [CrossRef]
- Liu, Y.Y.; Ma, Y.Y.; Lin, W.Y. Construction of a bi-functional ratiometric fluorescent probe for detection of endoplasmic reticulum viscosity and ONOO- in cells and zebrafish. Sens. Actuators B Chem. 2022, 373, 132742. [Google Scholar] [CrossRef]
- Song, Z.; Mao, D.; Sung, S.H.P.; Kwok, R.T.K.; Lam, J.W.Y.; Kong, D.; Ding, D.; Tang, B.Z. Activatable fluorescent nanoprobe with aggregation-induced emission characteristics for selective in vivo imaging of elevated peroxynitrite generation. Adv. Mater. 2016, 28, 7249–7256. [Google Scholar] [CrossRef]
- Kim, J.; Park, J.; Lee, H.; Choi, Y.; Kim, Y. A boronate-based fluorescent probe for the selective detection of cellular peroxynitrite. Chem. Commun. 2014, 50, 9353–9356. [Google Scholar] [CrossRef]
- Yu, F.B.; Li, P.; Wang, B.S.; Han, K.L. Reversible near-infrared fluorescent probe introducing tellurium to mimetic glutathione peroxidase for monitoring the redox cycles between peroxynitrite and glutathione in vivo. J. Am. Chem. Soc. 2013, 135, 7674–7680. [Google Scholar] [CrossRef] [PubMed]
- Wu, J.; Yang, Y.Z.; Zhang, L.; Wang, H.; Yang, M.; Yuan, J.L. A visible-light-excited Eu3+ complex-based luminescent probe for highly sensitive time-gated luminescence imaging detection of intracellular peroxynitrite. J. Mater. Chem. B 2017, 5, 2322–2329. [Google Scholar] [CrossRef] [PubMed]
Disclaimer/Publisher’s Note: The statements, opinions and data contained in all publications are solely those of the individual author(s) and contributor(s) and not of MDPI and/or the editor(s). MDPI and/or the editor(s) disclaim responsibility for any injury to people or property resulting from any ideas, methods, instructions or products referred to in the content. |
© 2023 by the authors. Licensee MDPI, Basel, Switzerland. This article is an open access article distributed under the terms and conditions of the Creative Commons Attribution (CC BY) license (https://creativecommons.org/licenses/by/4.0/).