

A Workflow Combining Machine Learning with Molecular Simulations Uncovers Potential Dual-Target Inhibitors against BTK and JAK3

 , , , ,
Abstract
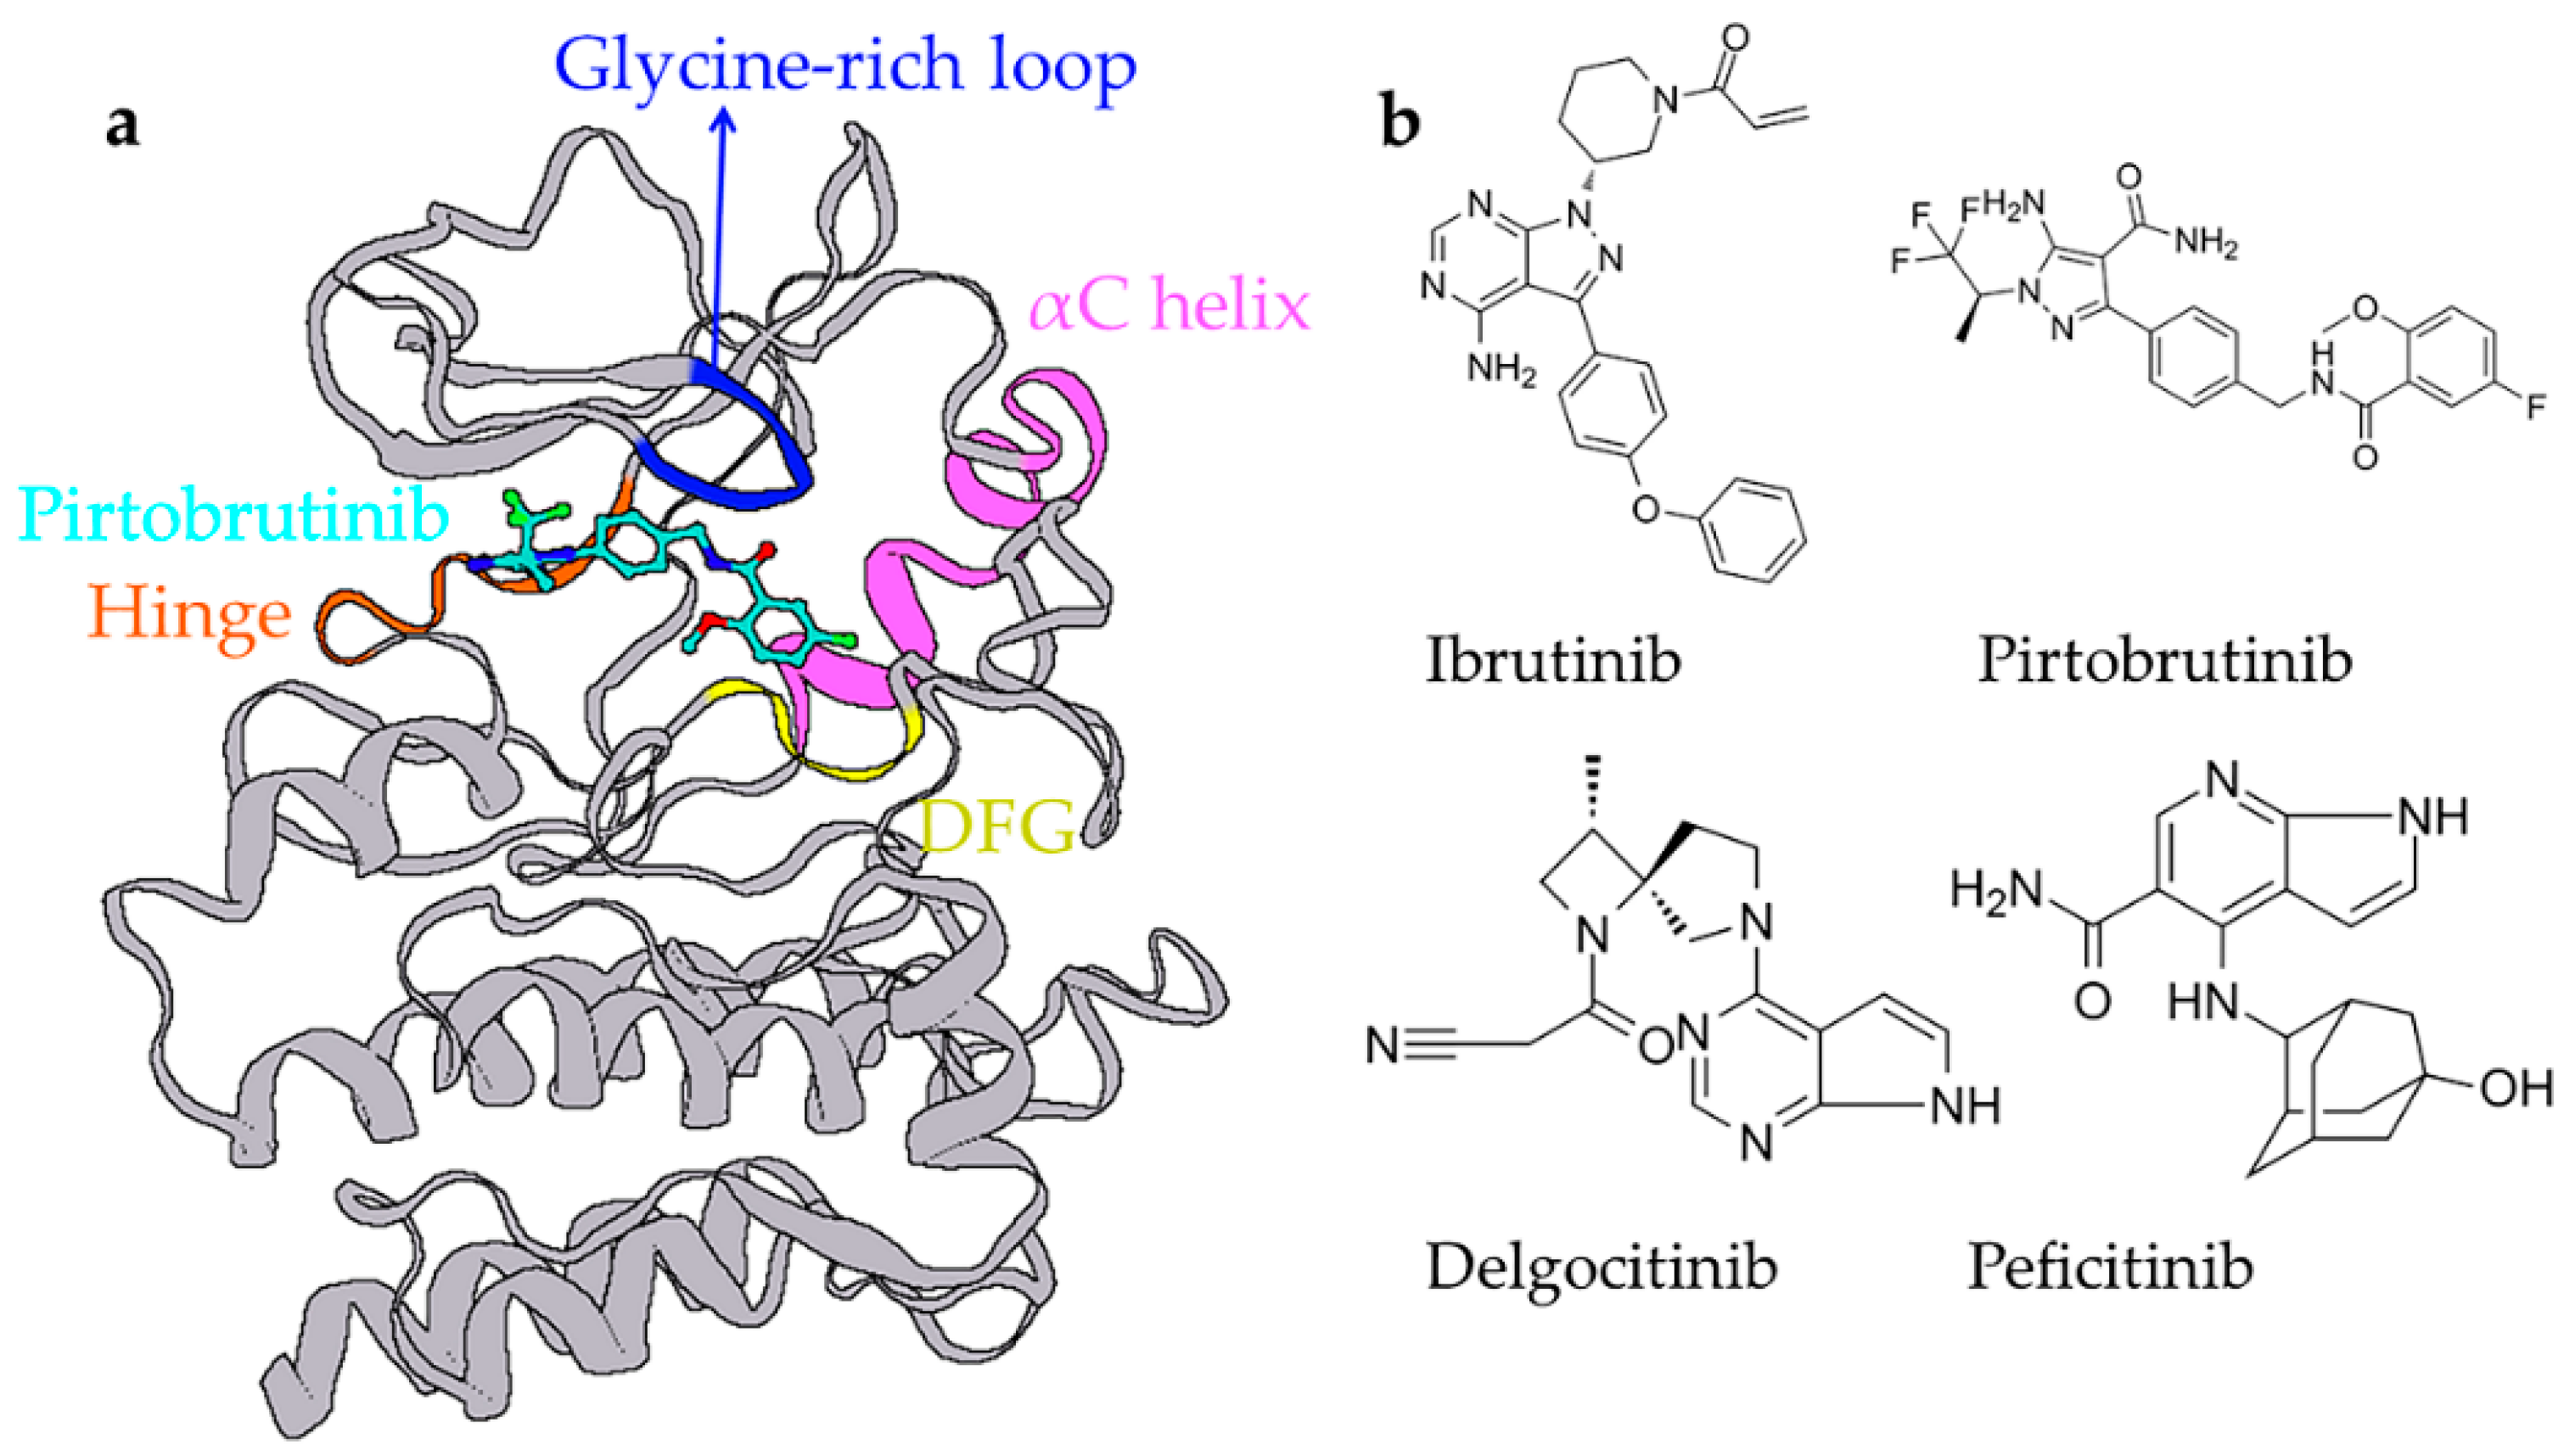
1. Introduction
2. Results
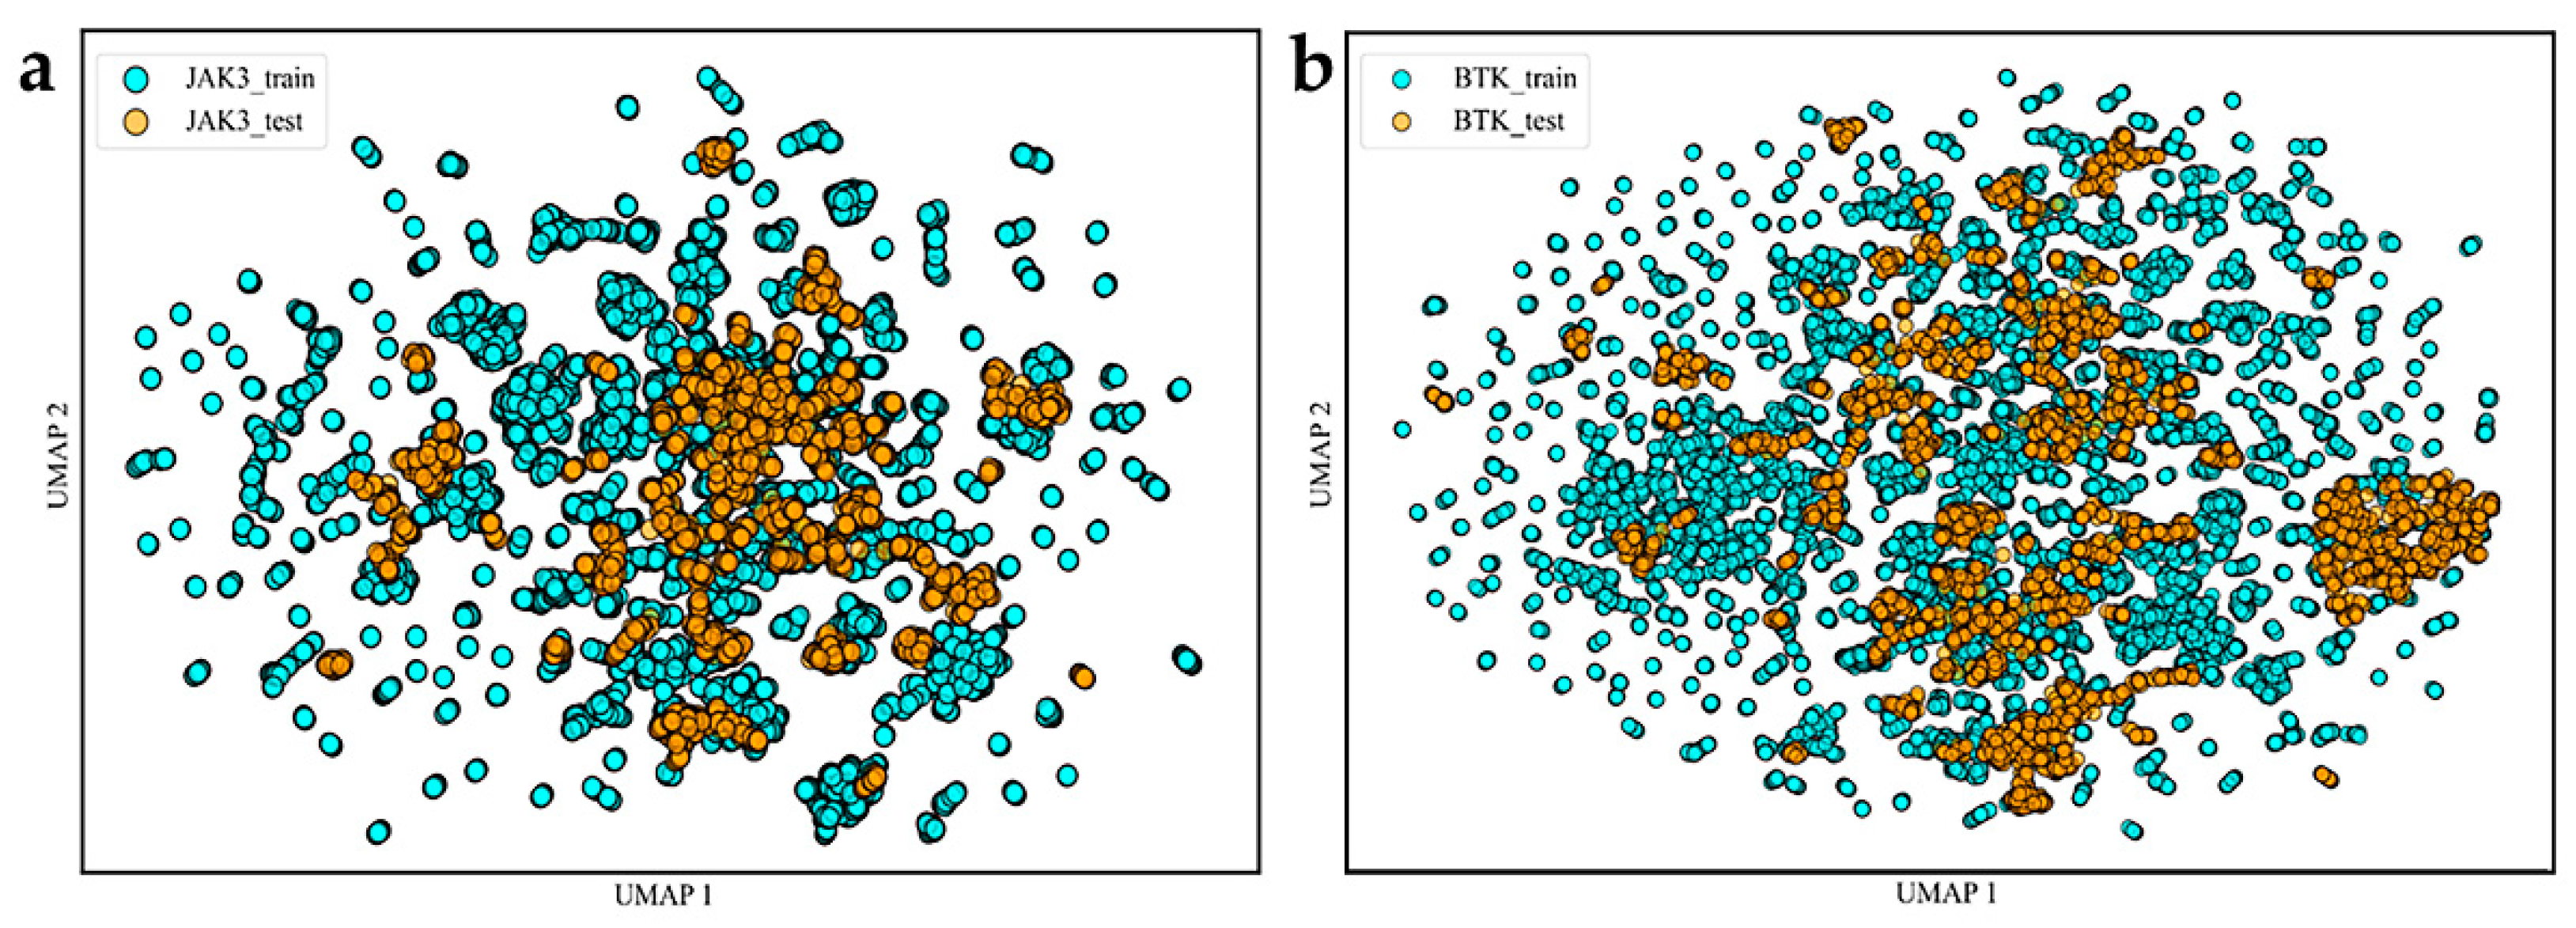
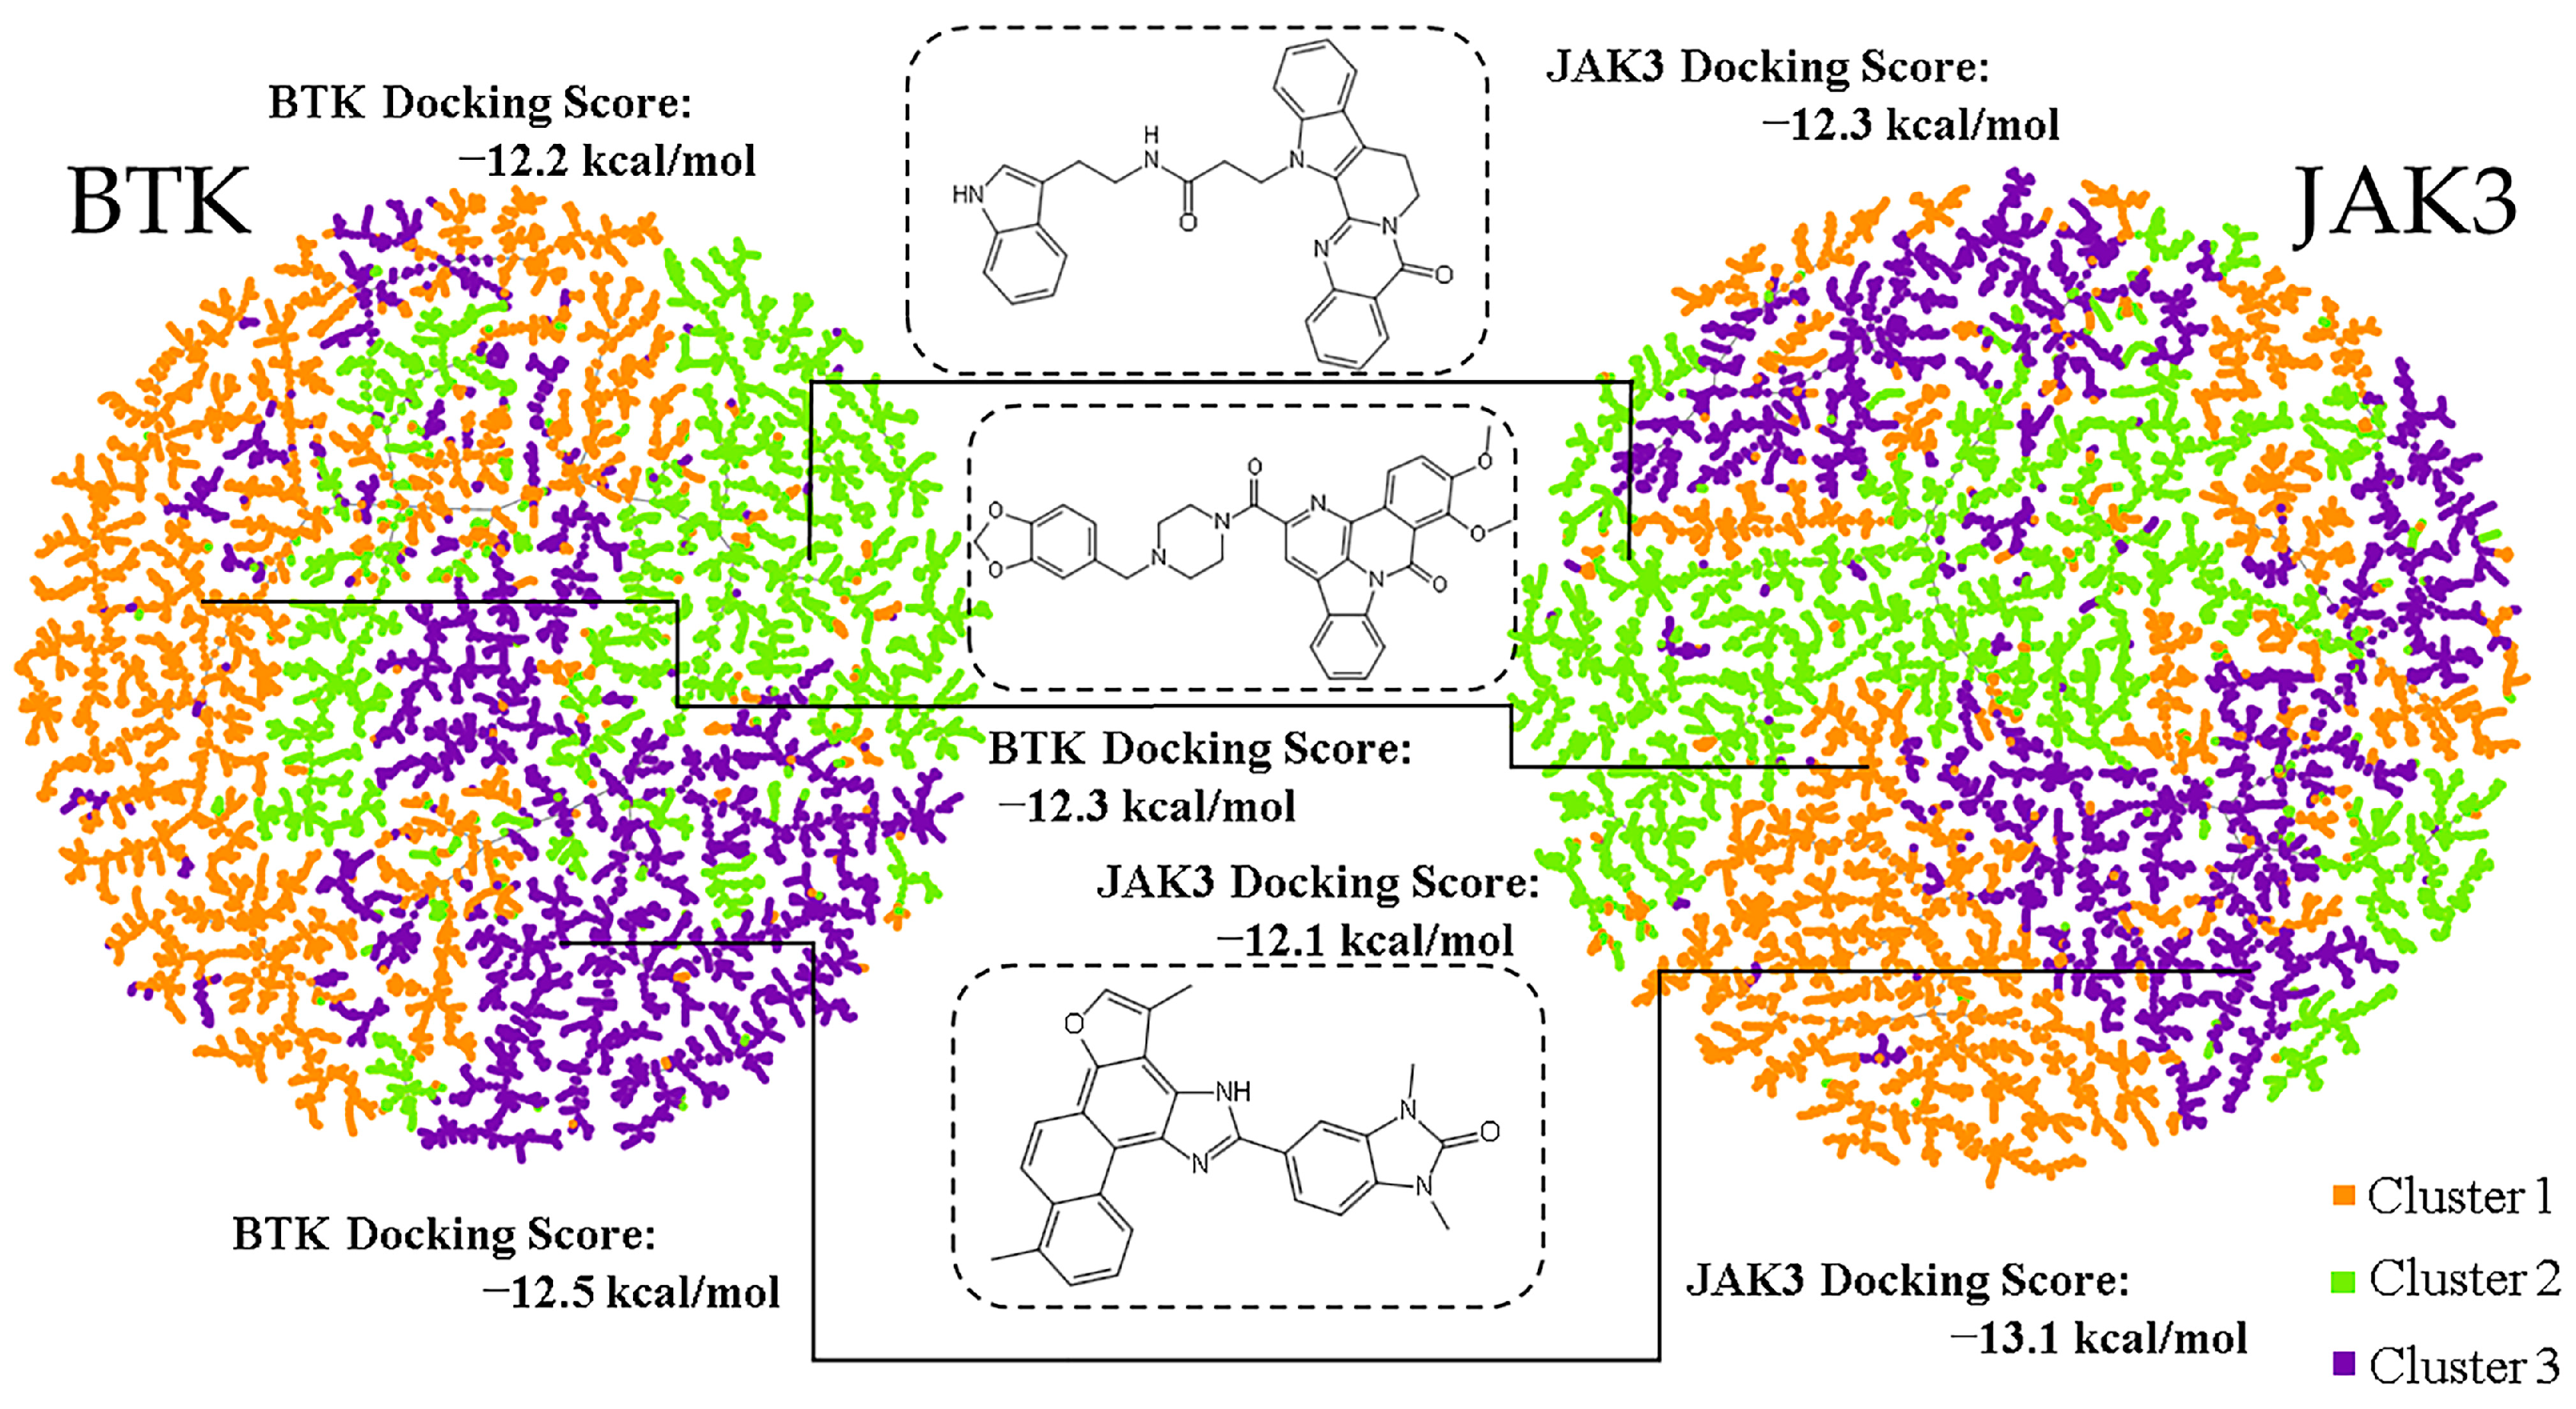
2.1. Spatial Diversity
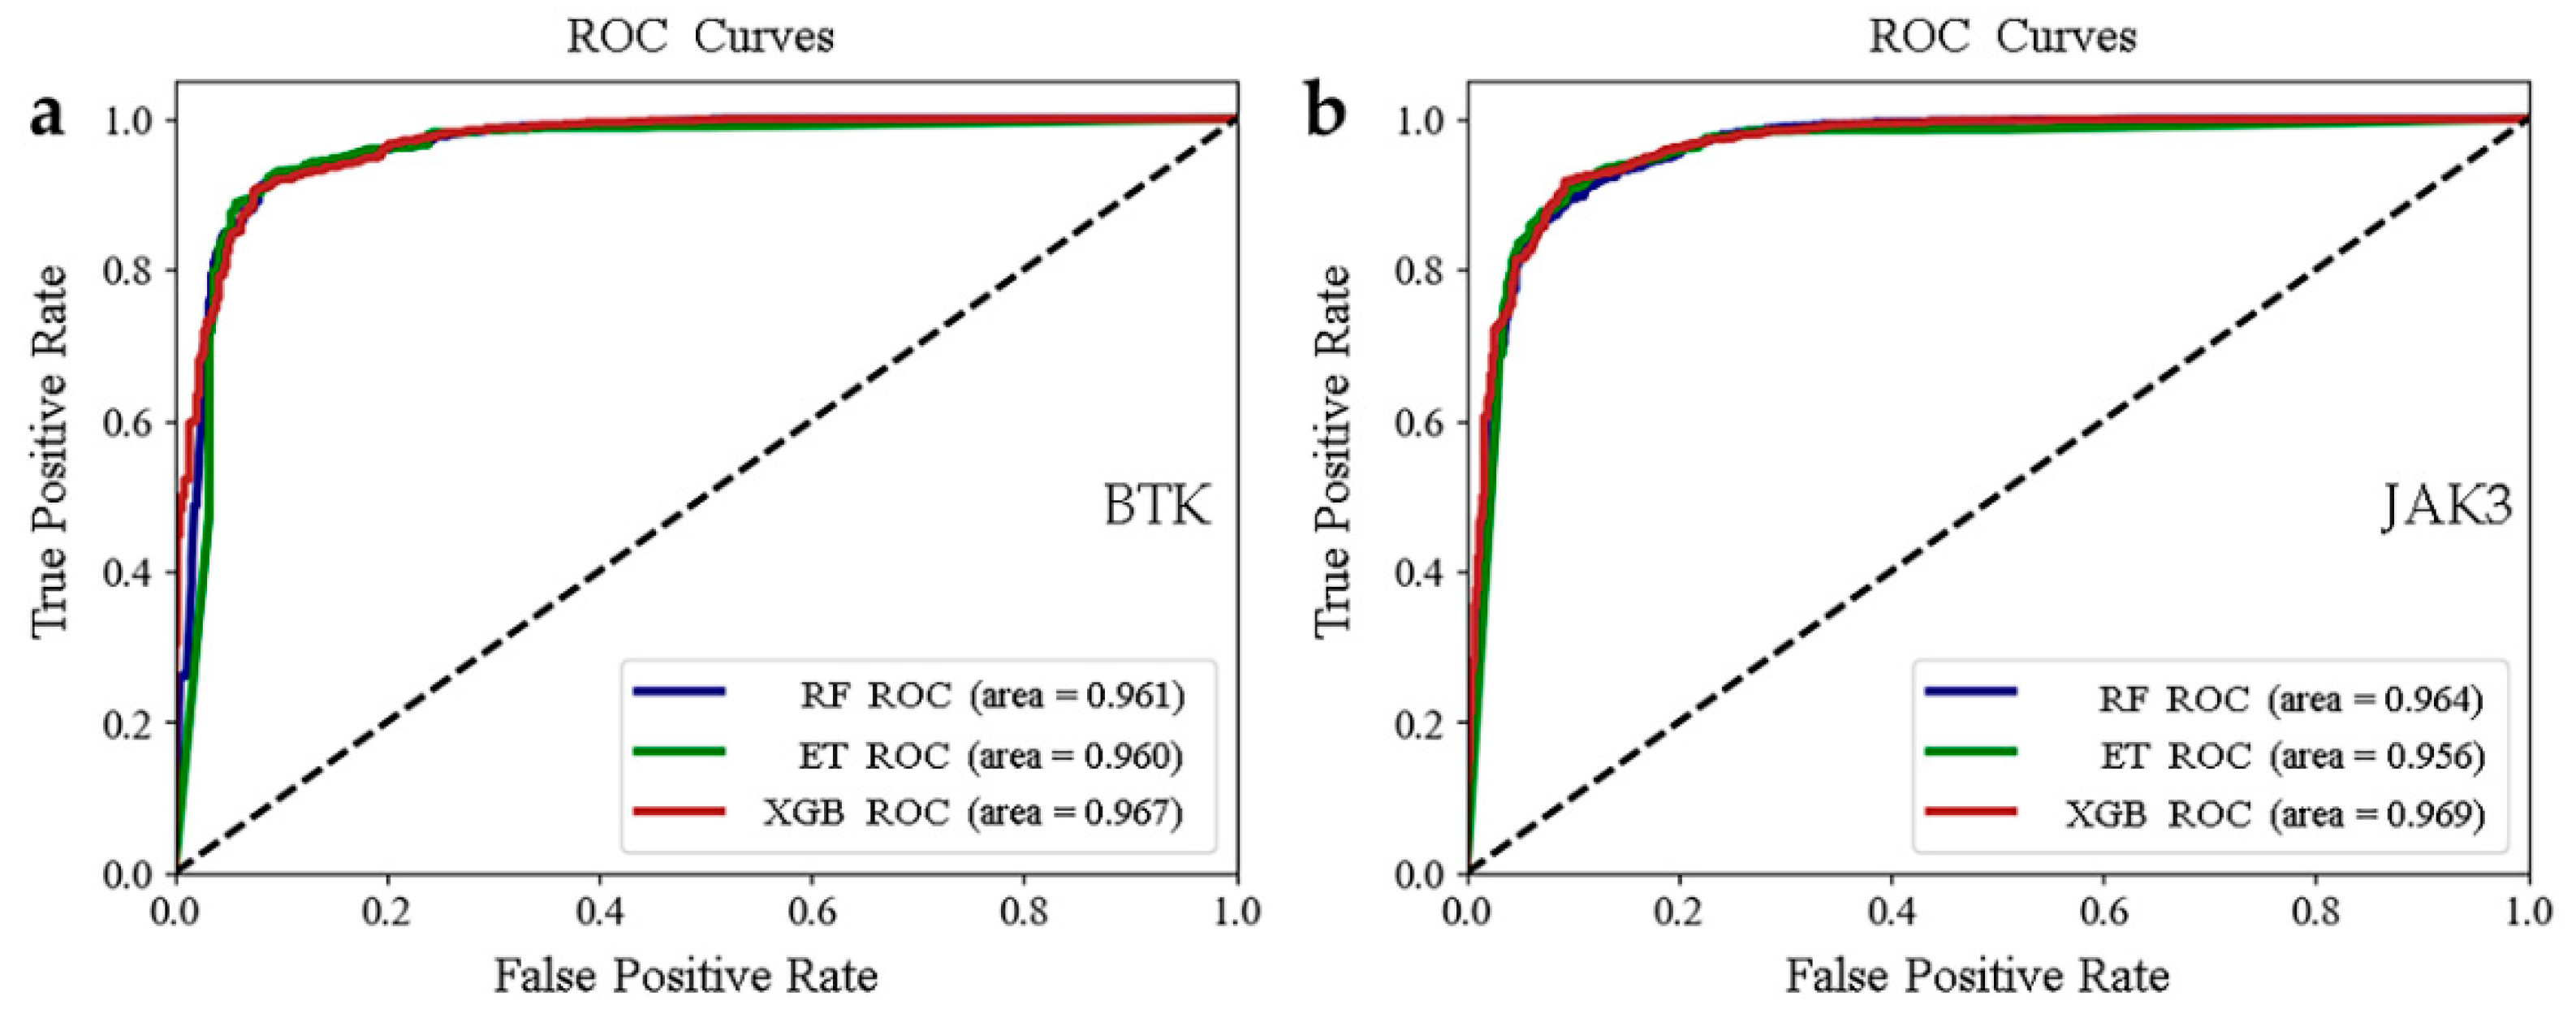
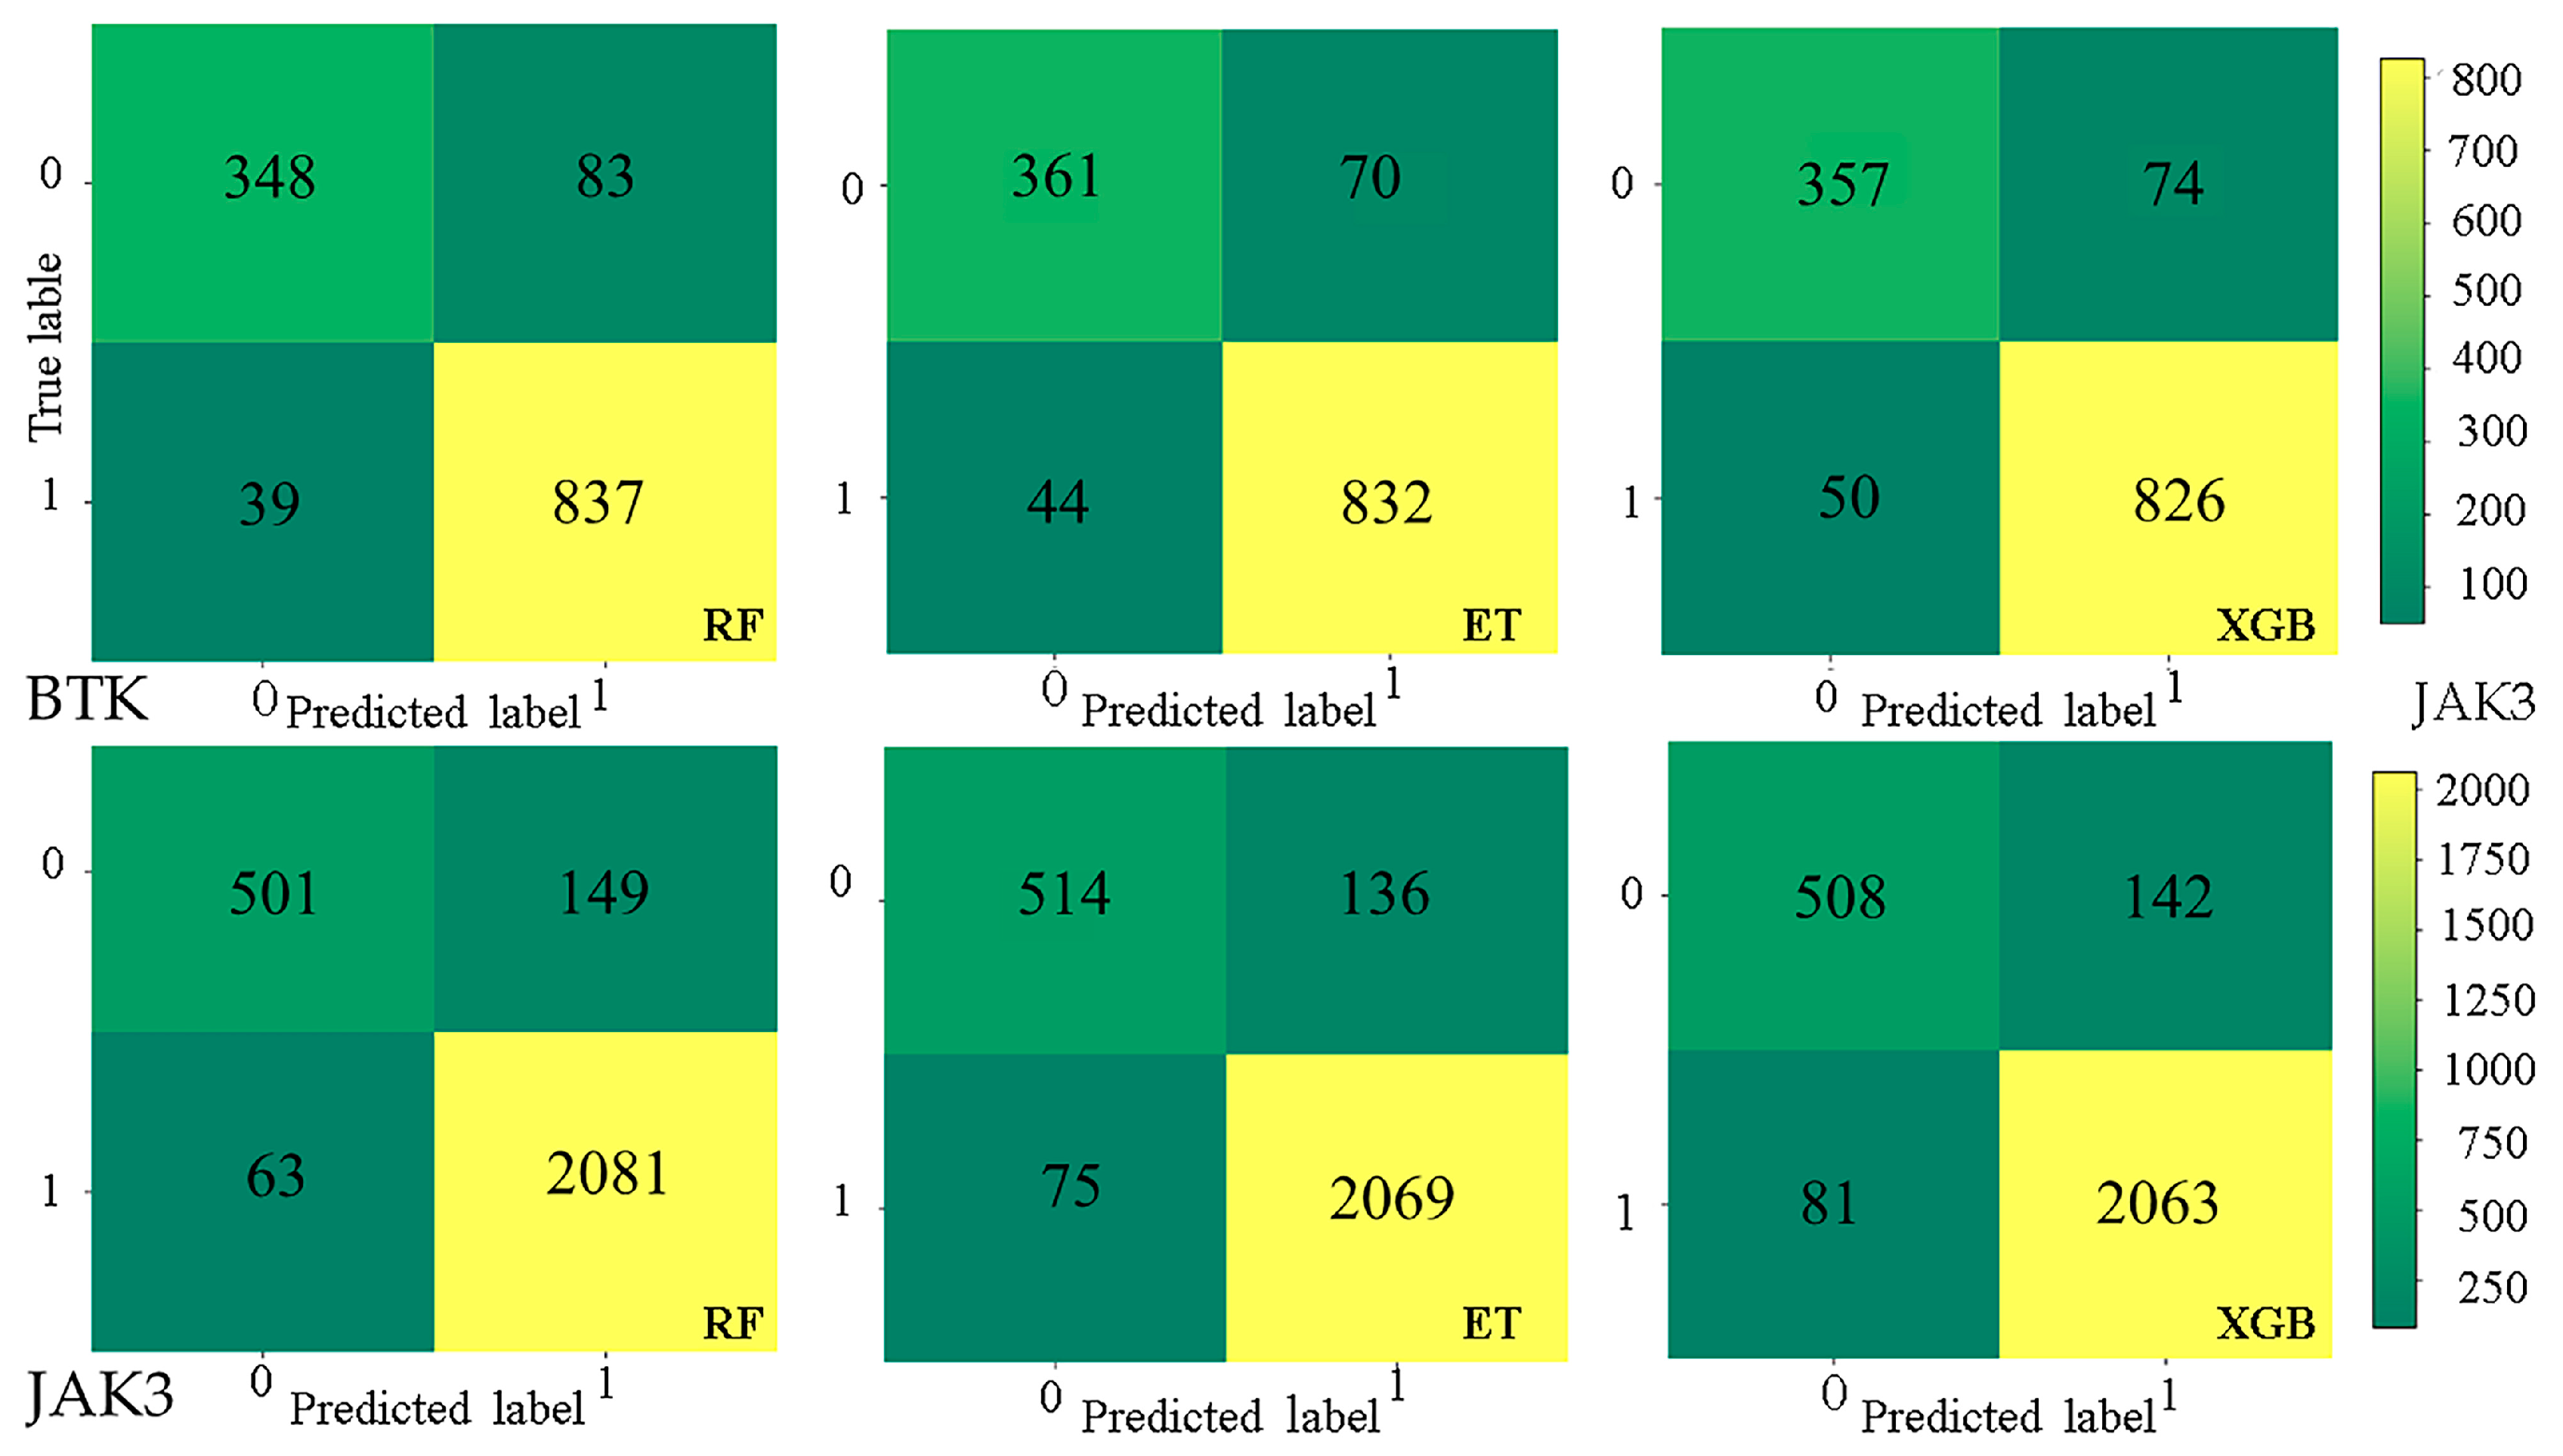
2.2. Establishment and Validation of Models
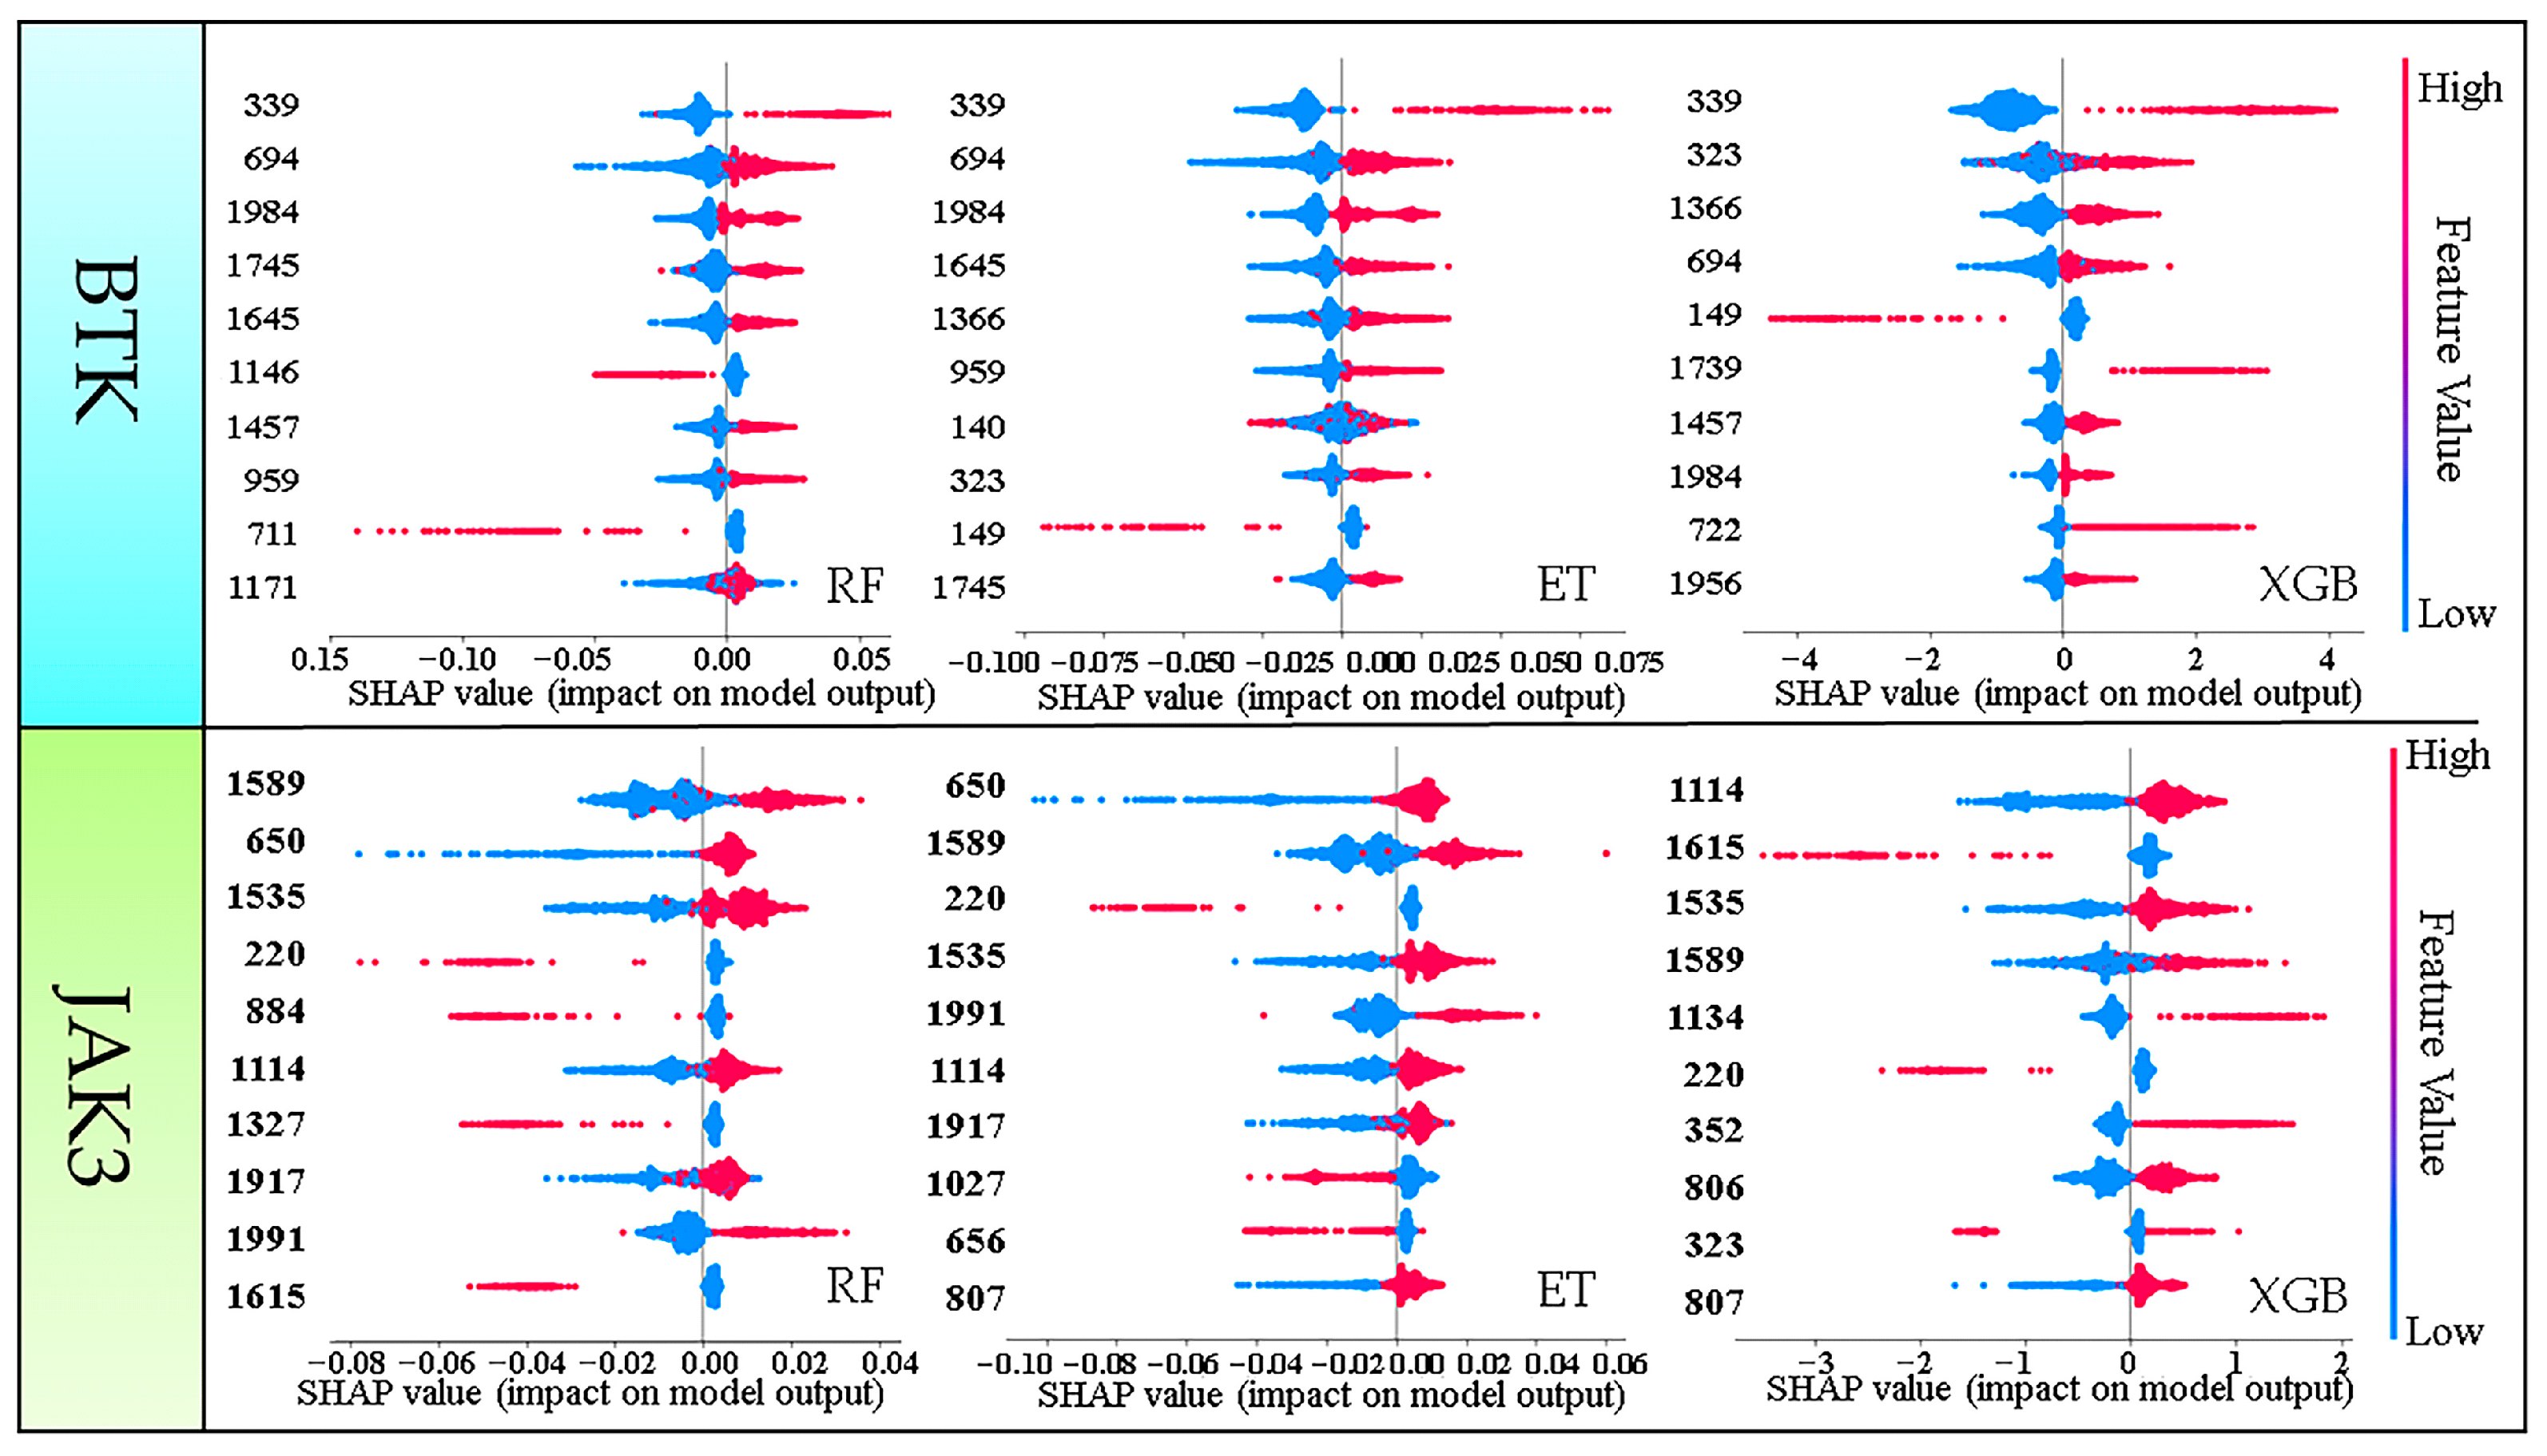
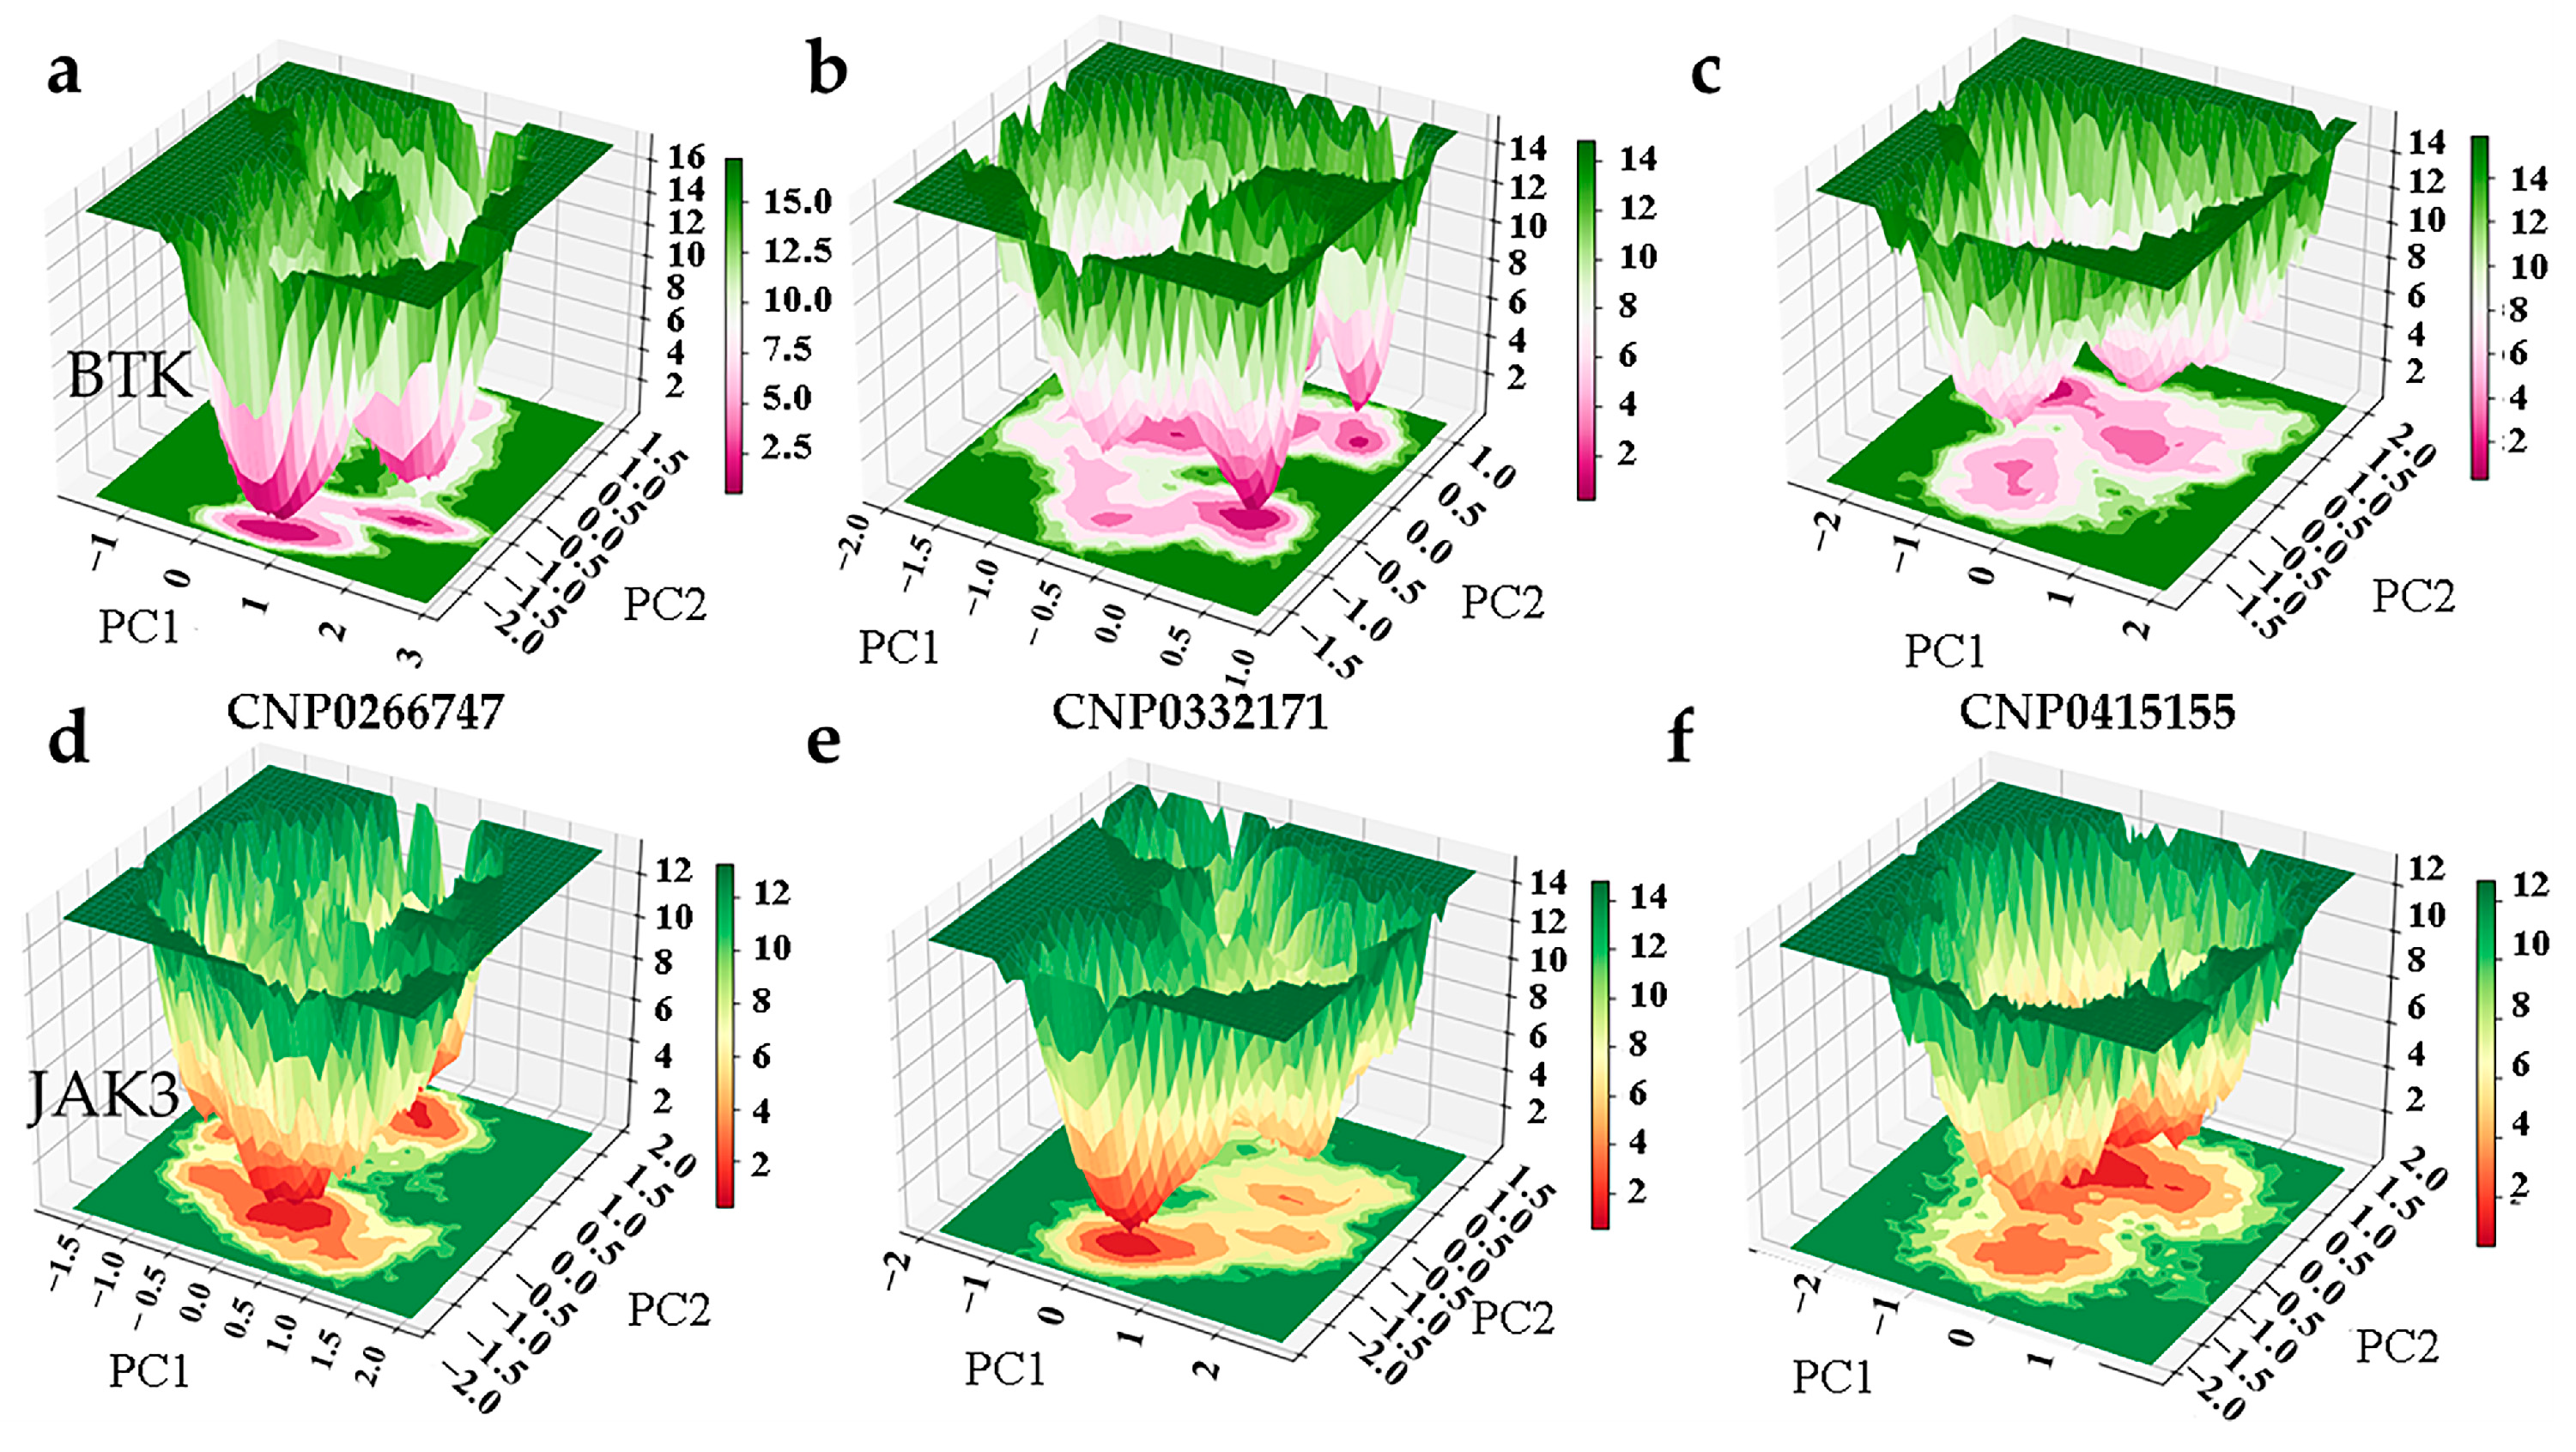
2.3. Explanatory Analysis of Models
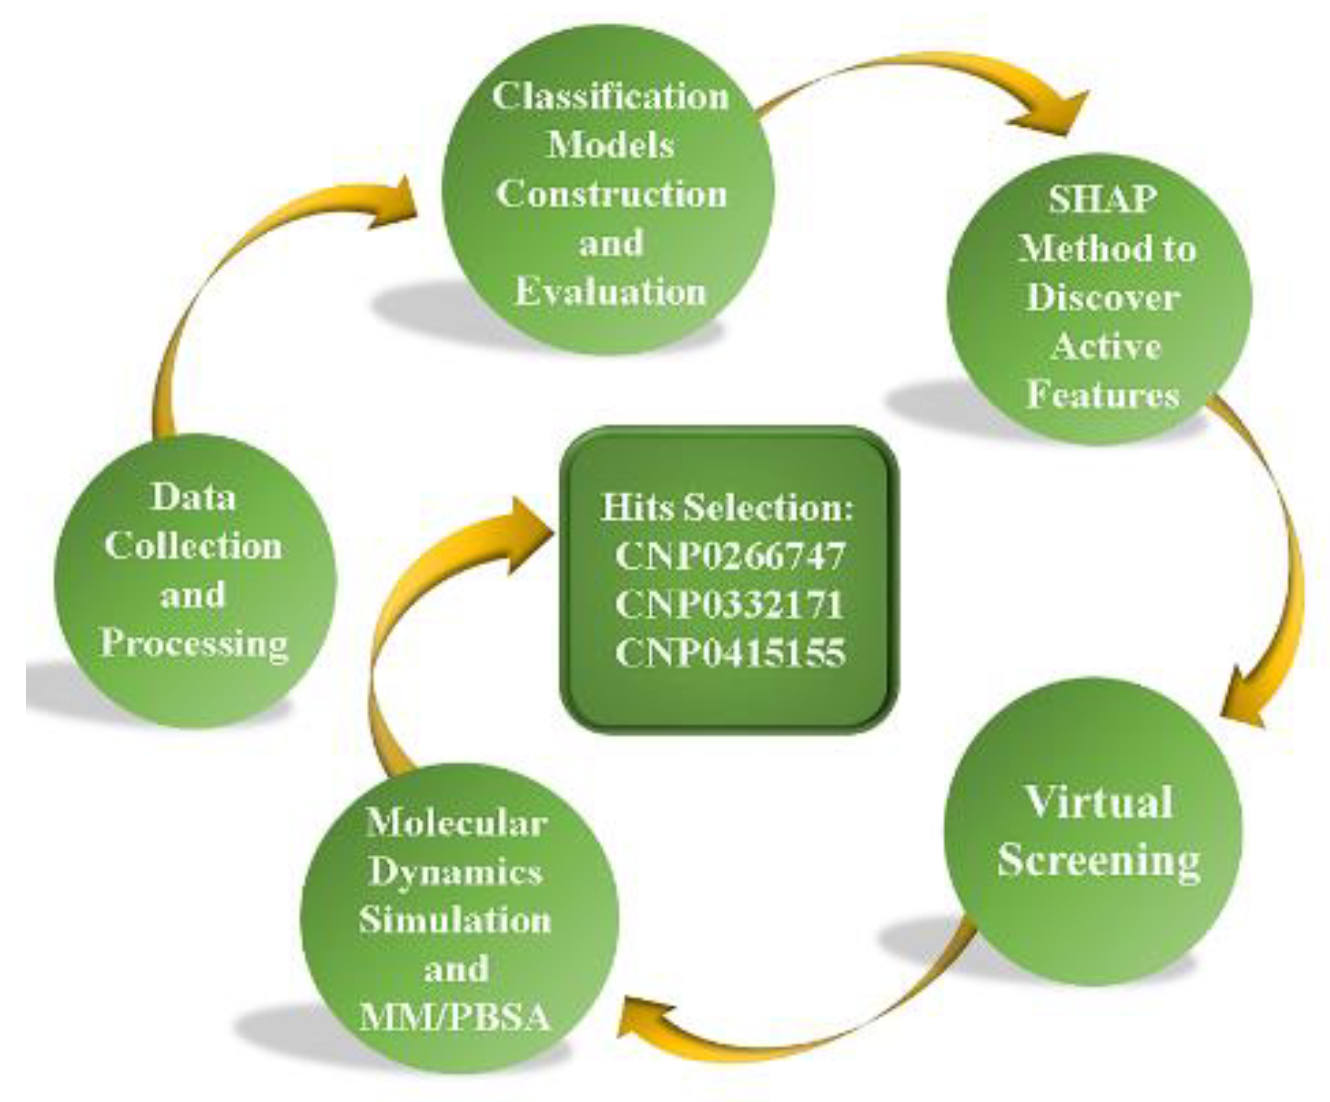
2.4. Virtual Screening
2.5. ADMET Analysis
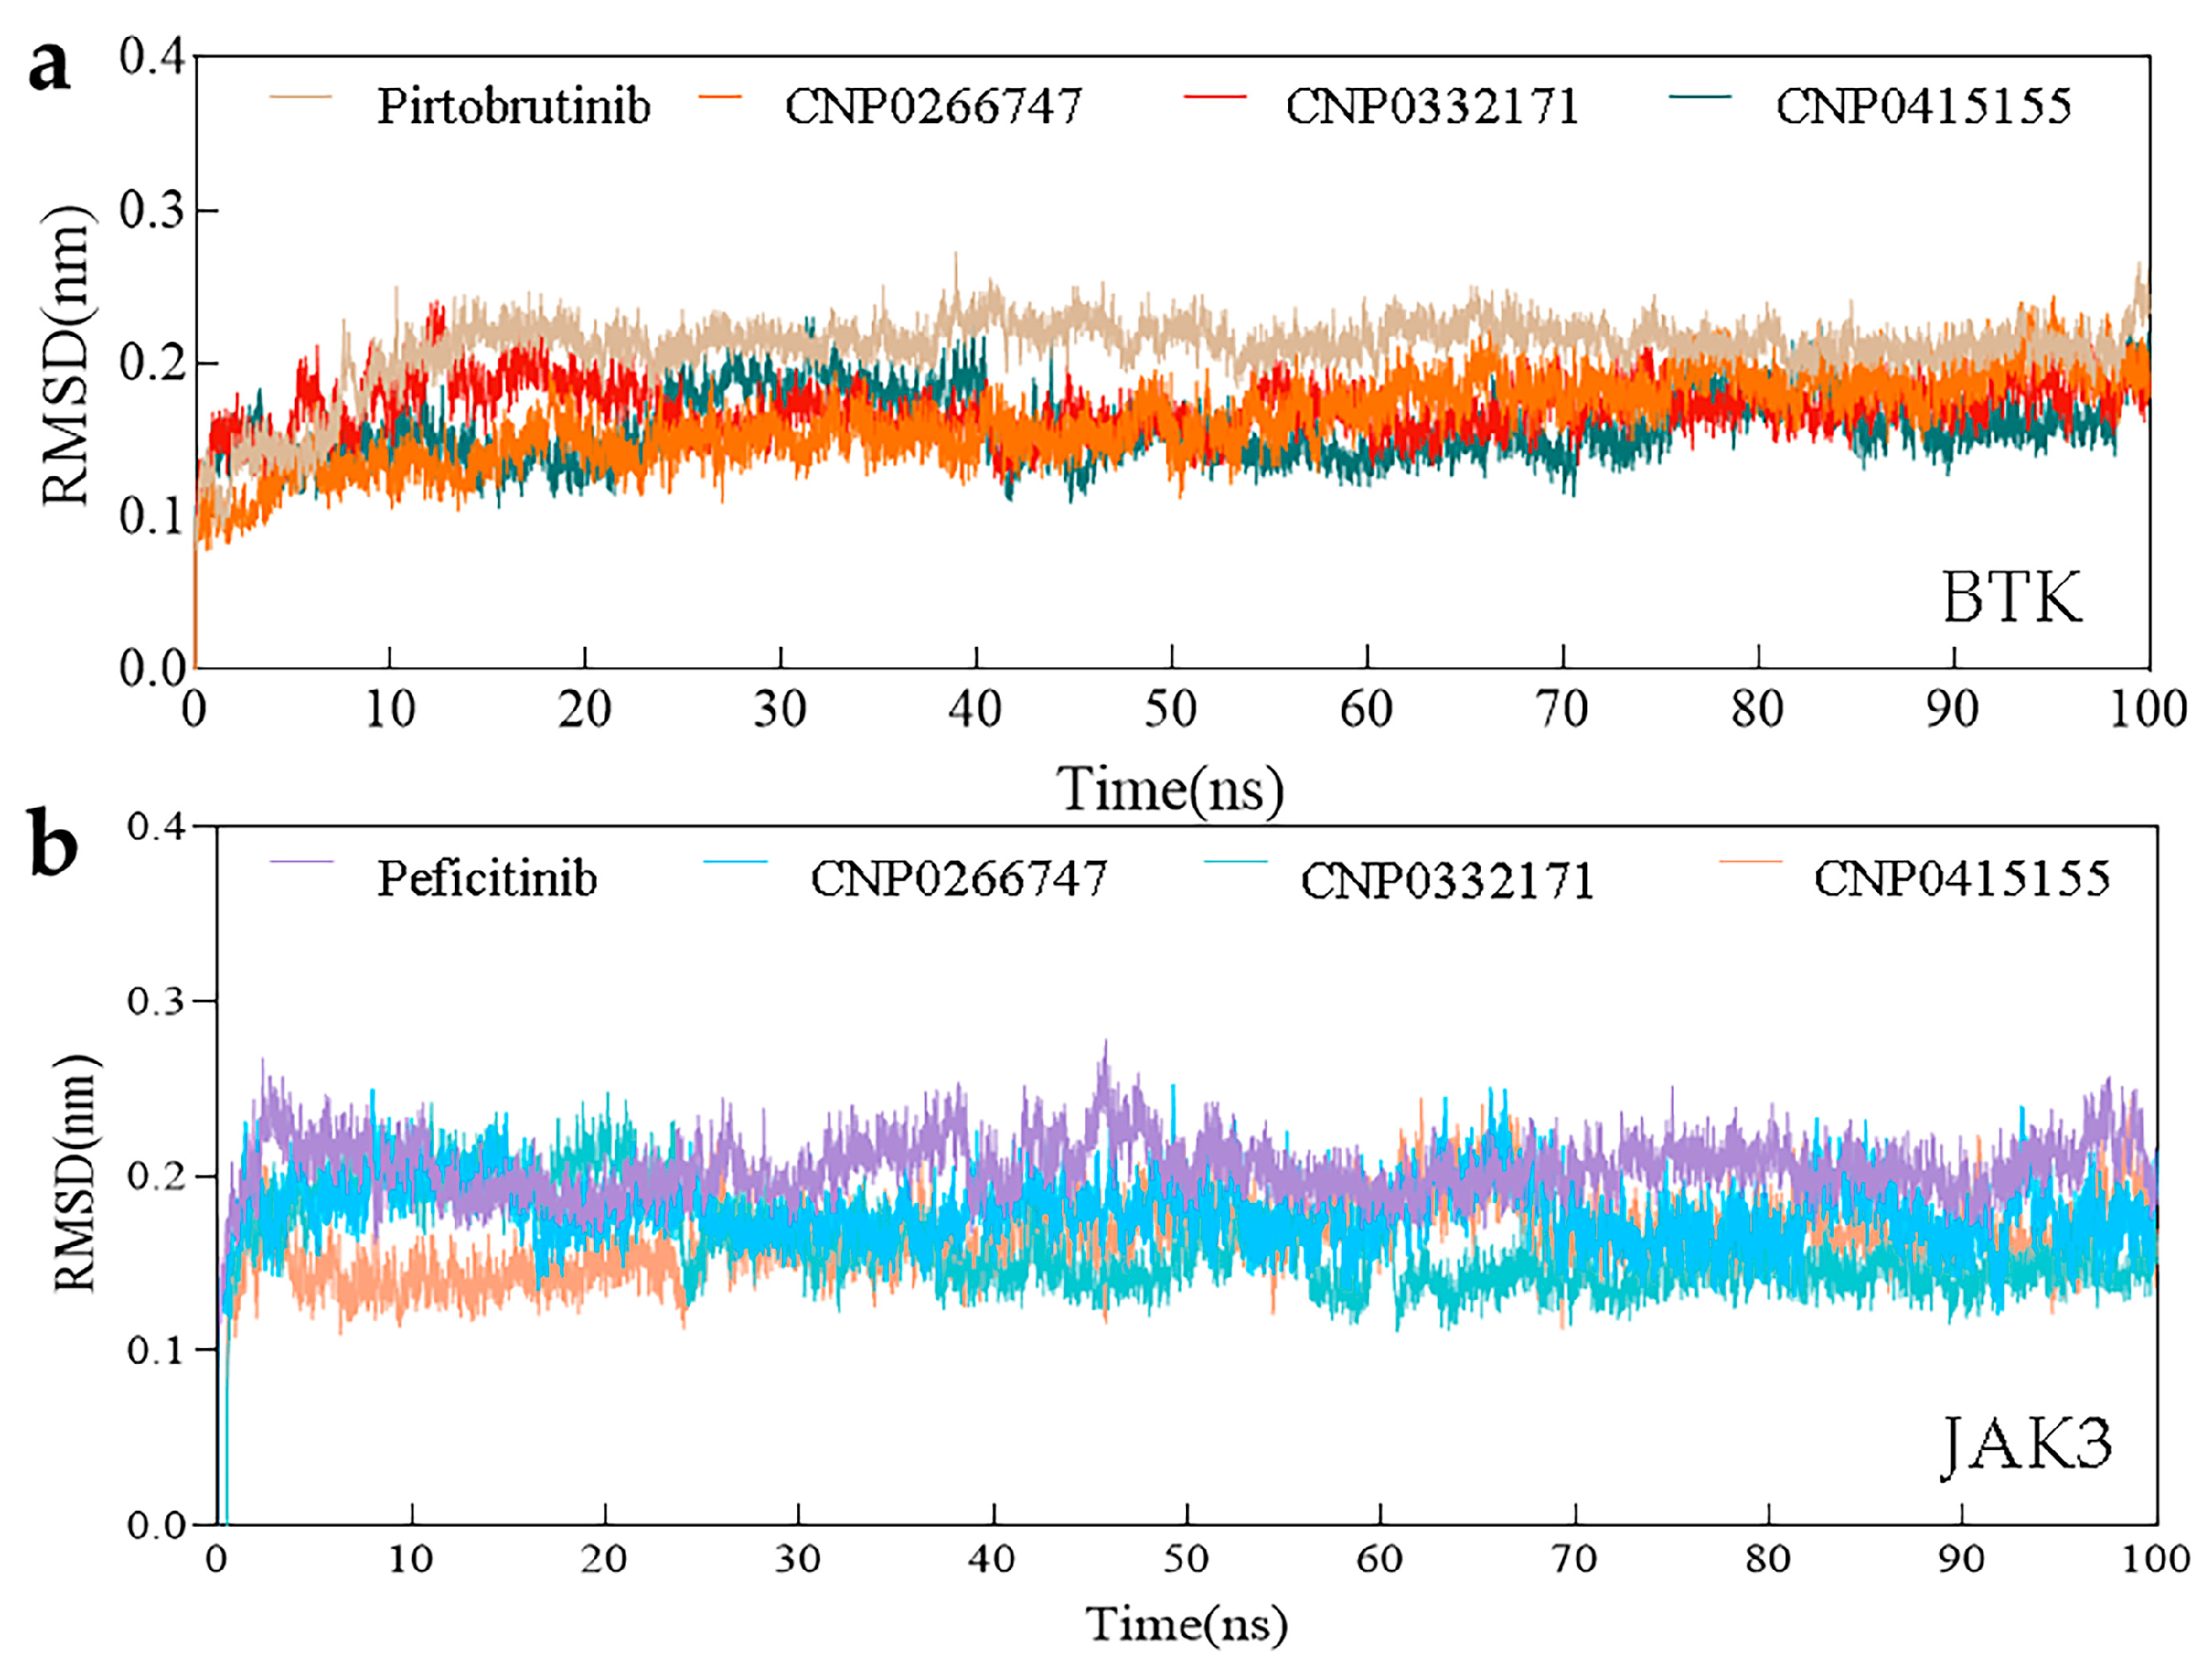
2.6. Molecular Dynamics Simulations
Root Mean Square Deviation (RMSD)
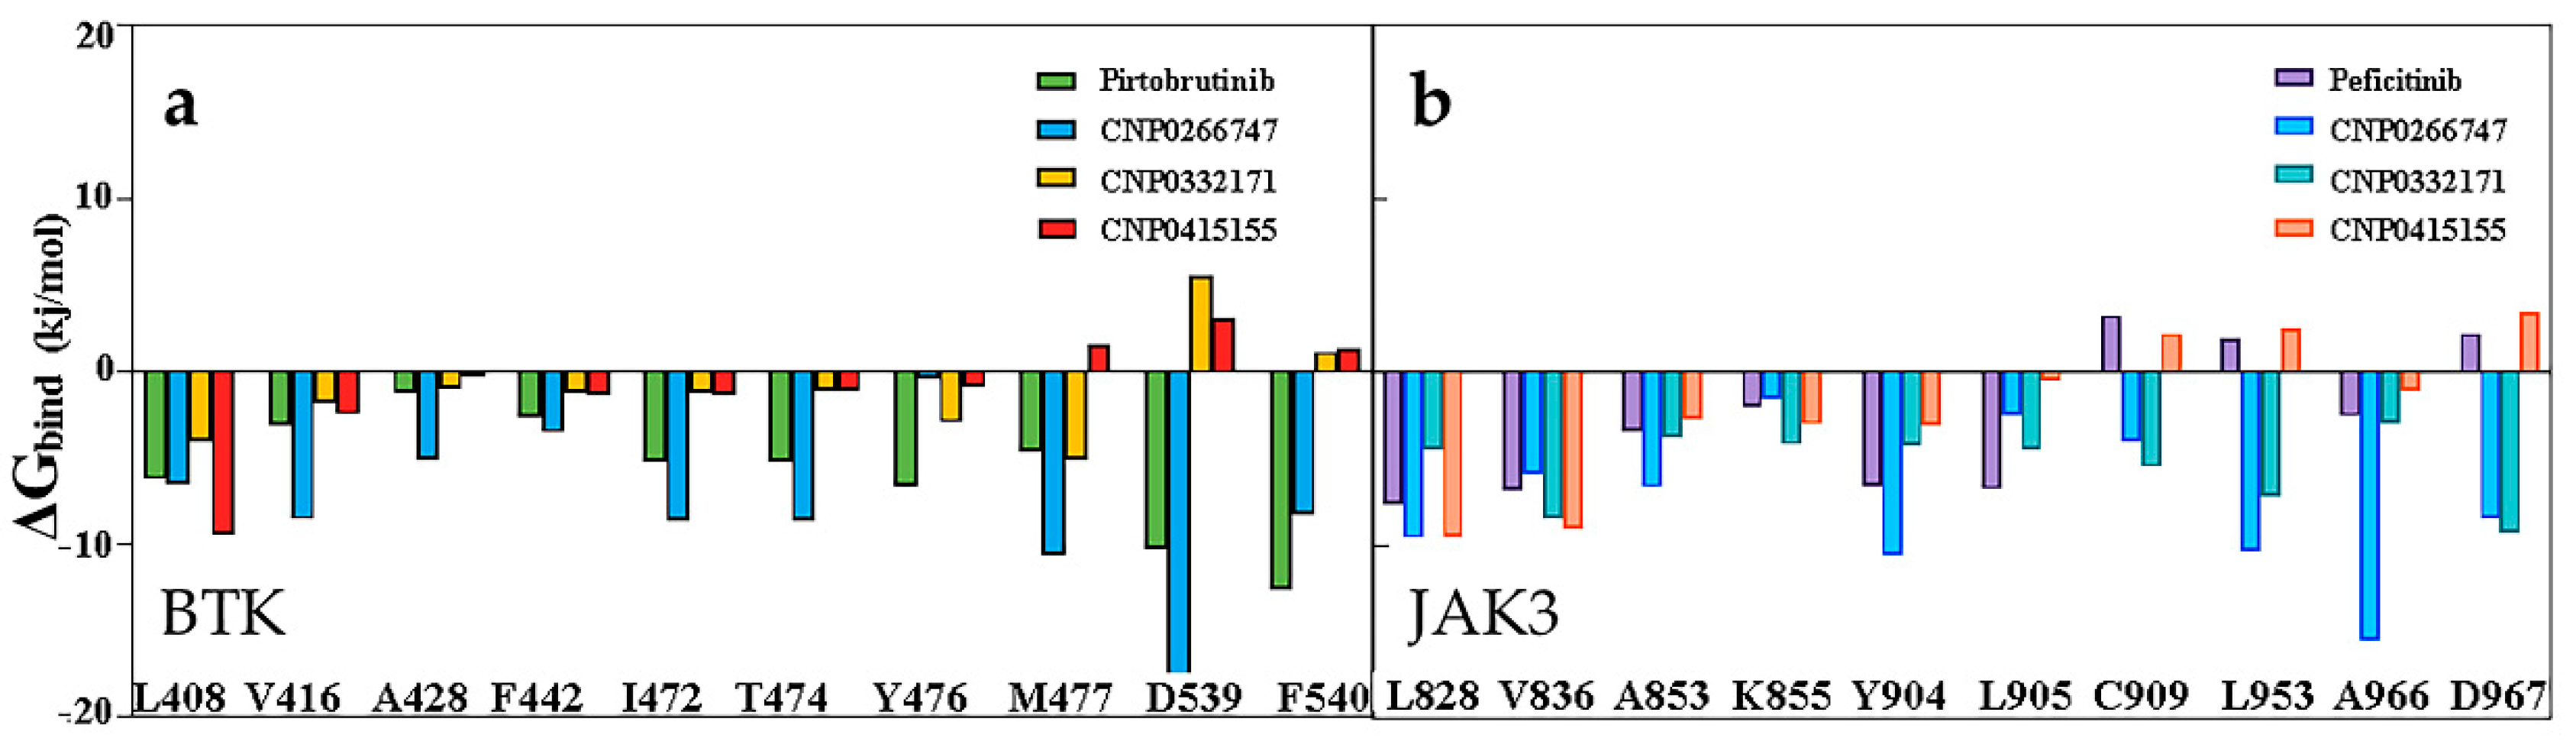
2.7. MM/PBSA Binding Free Energy
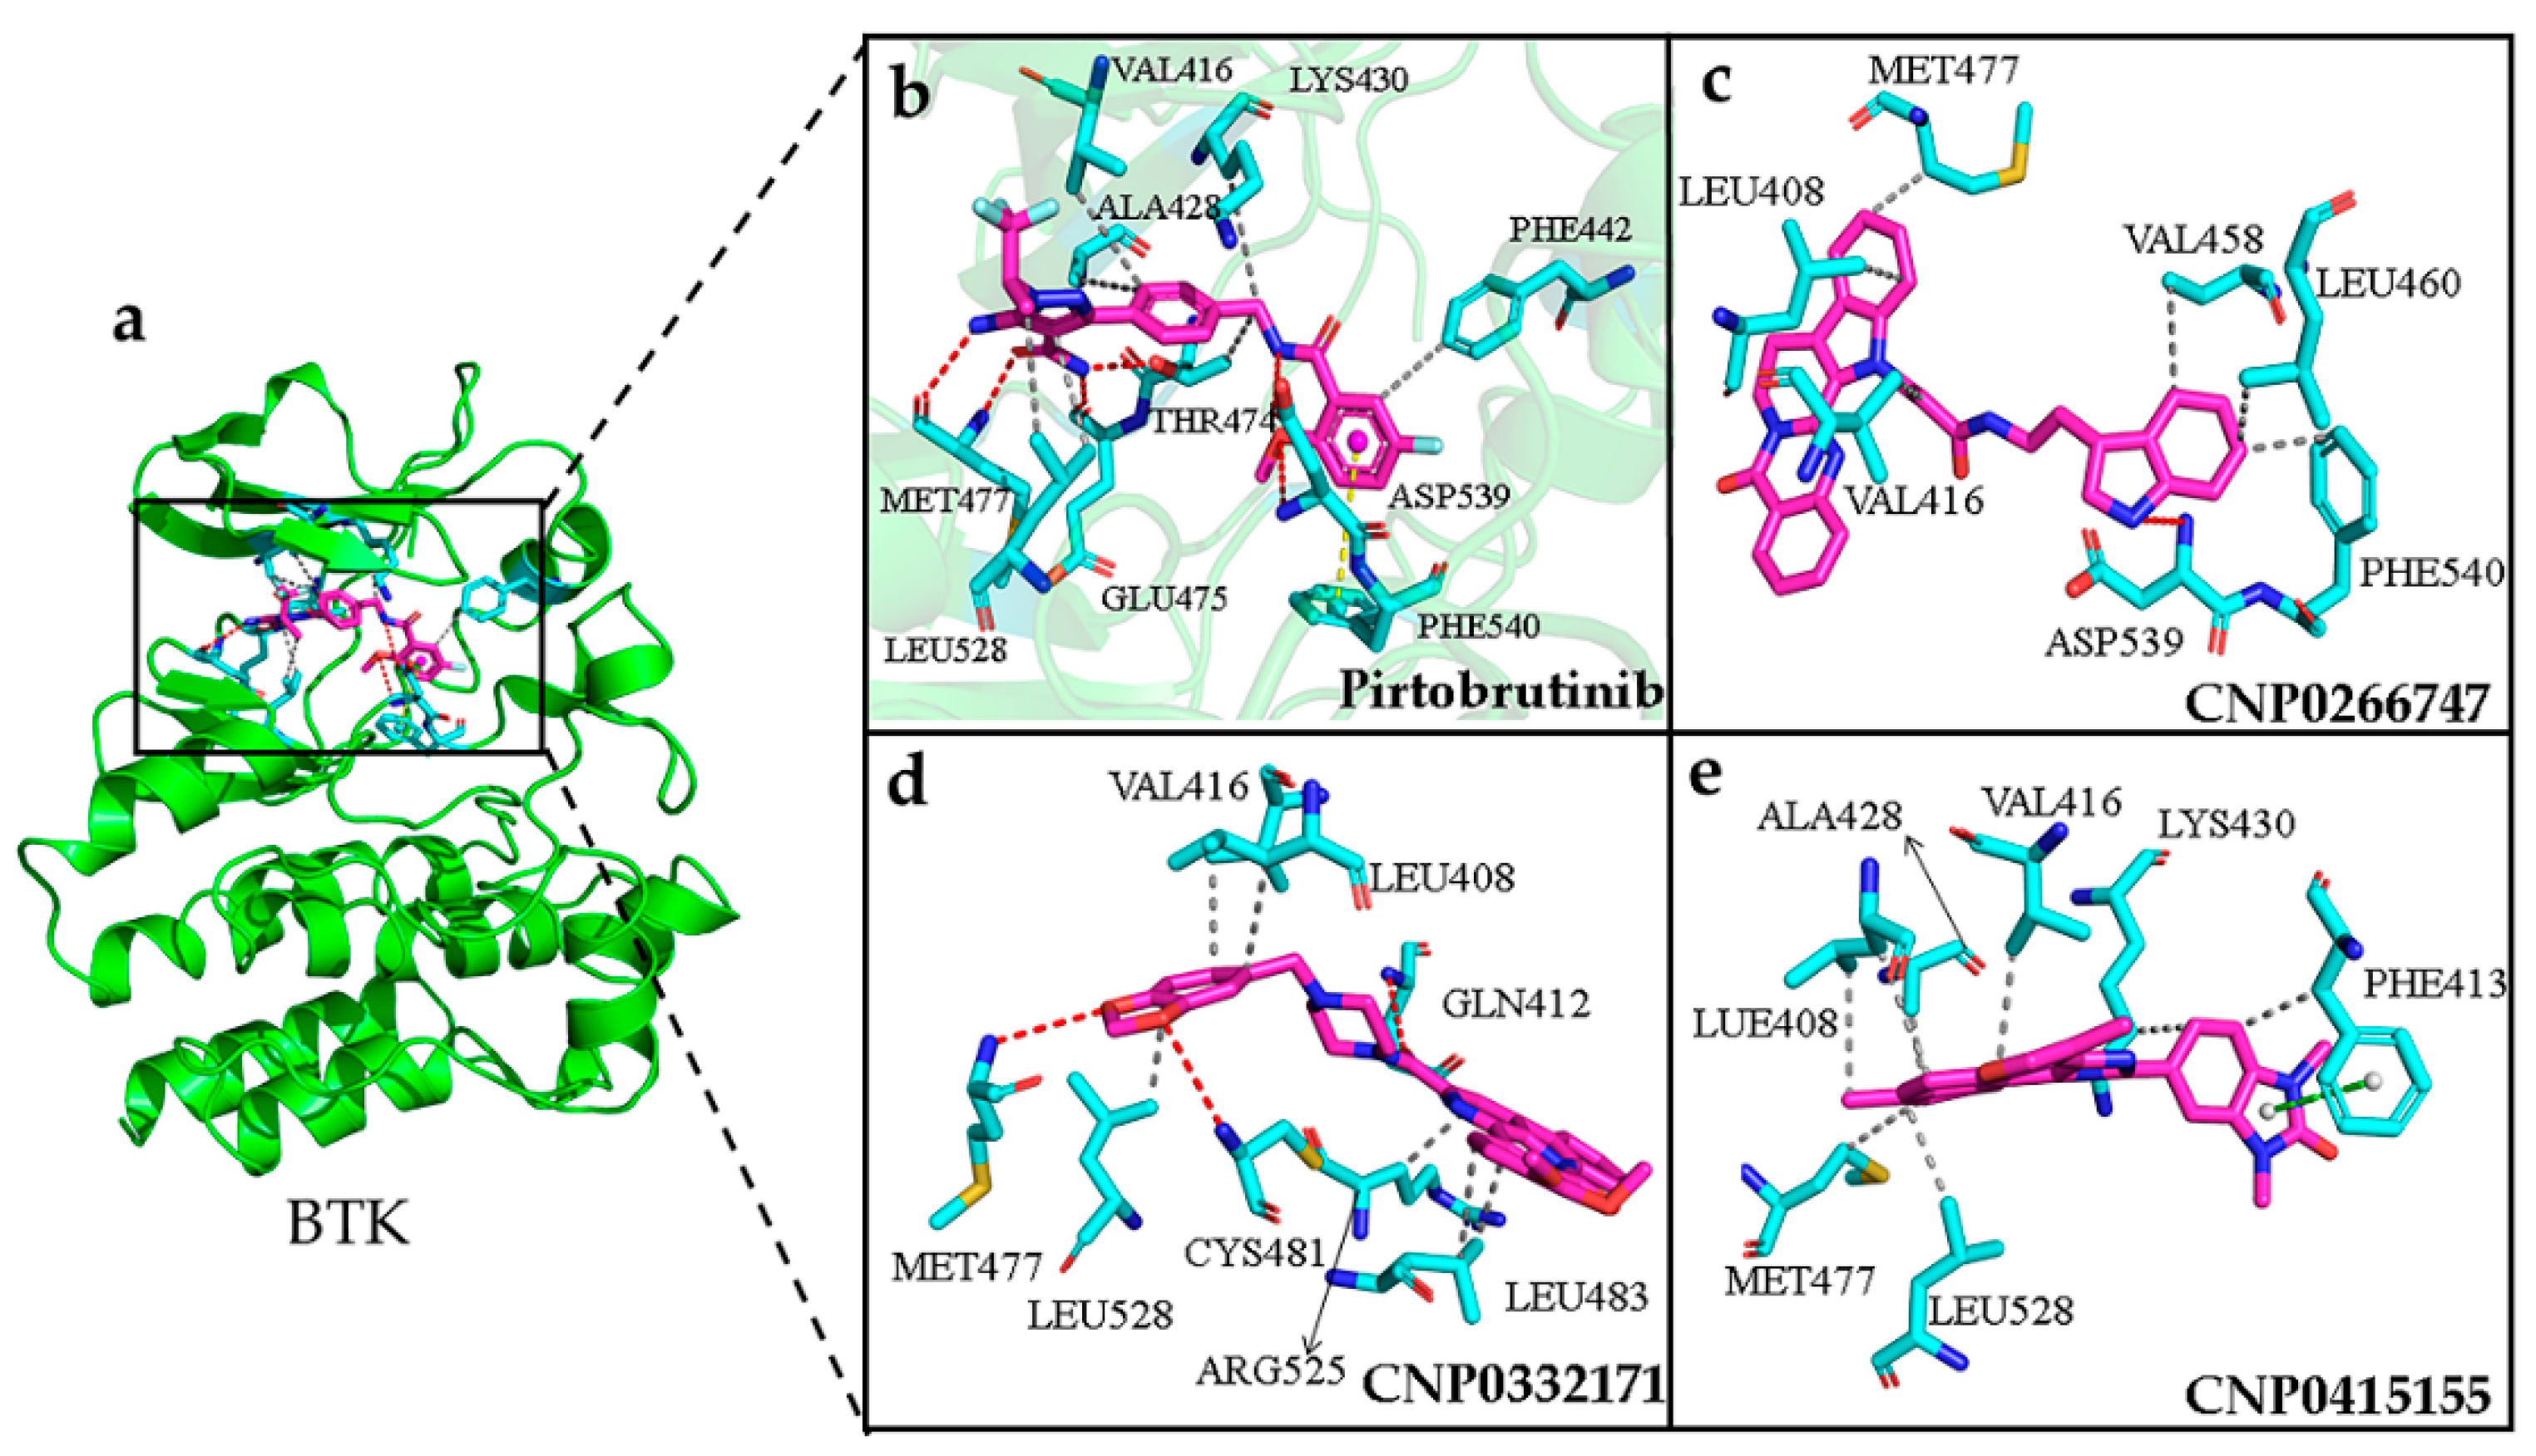
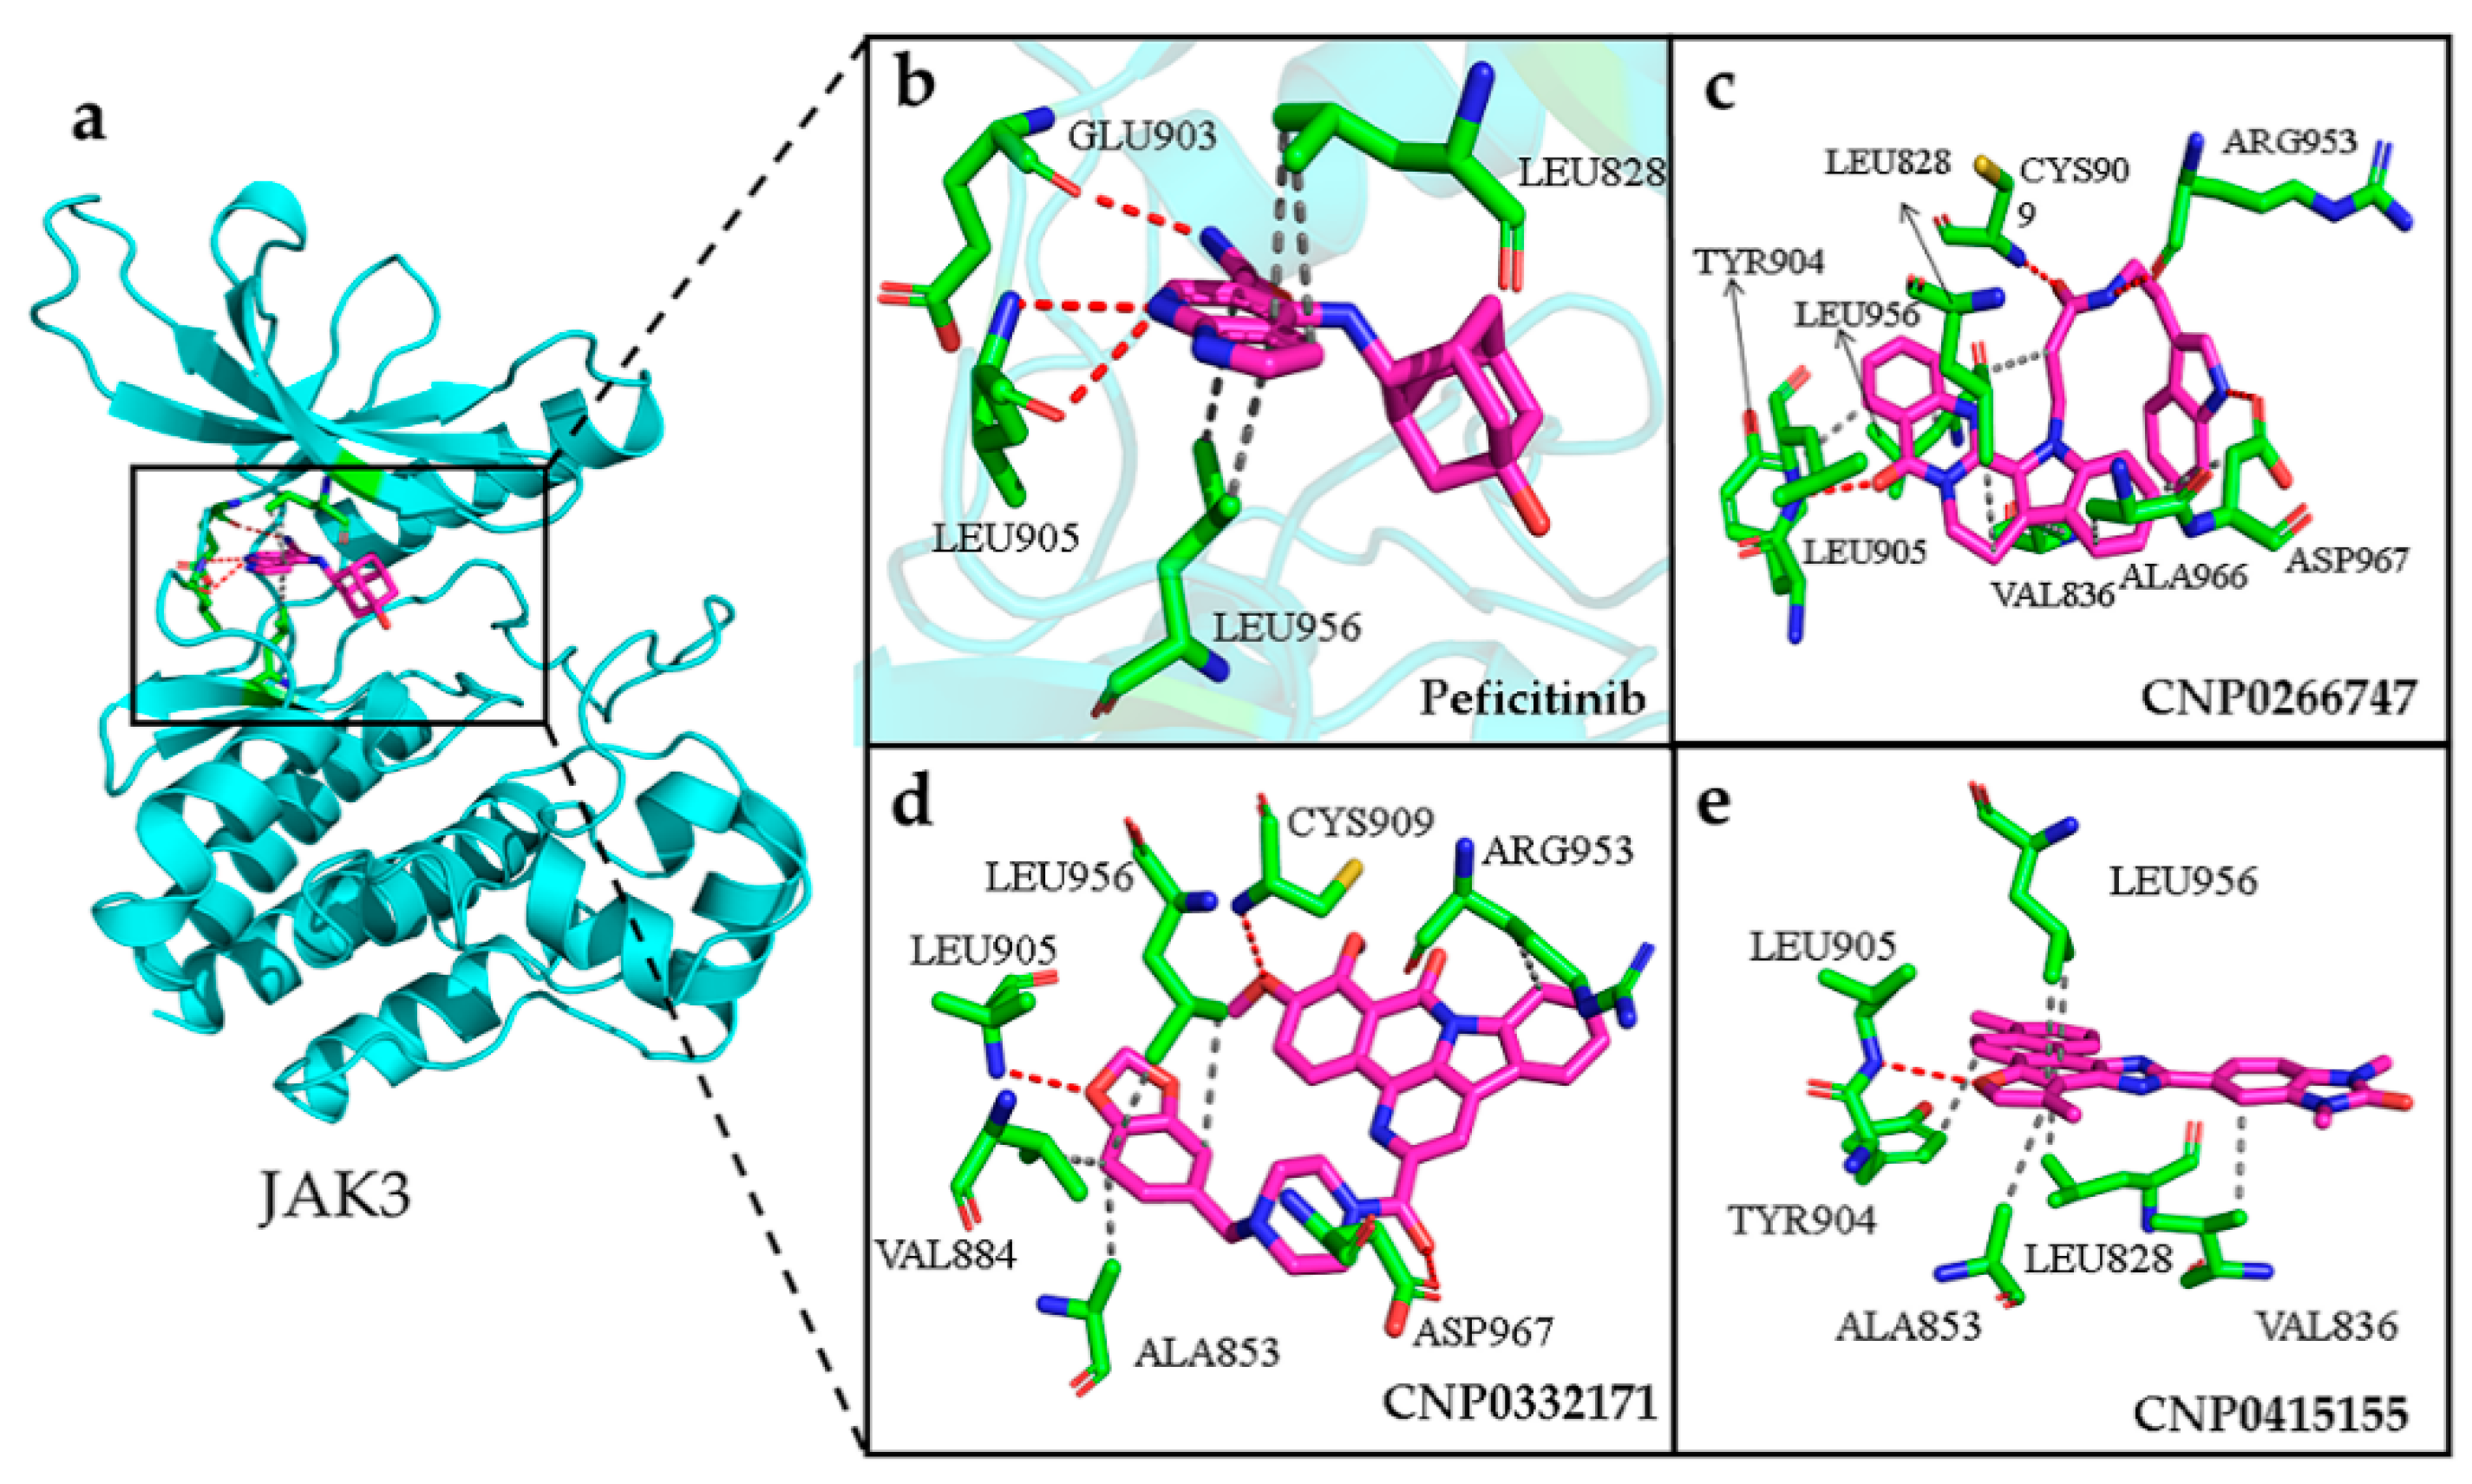
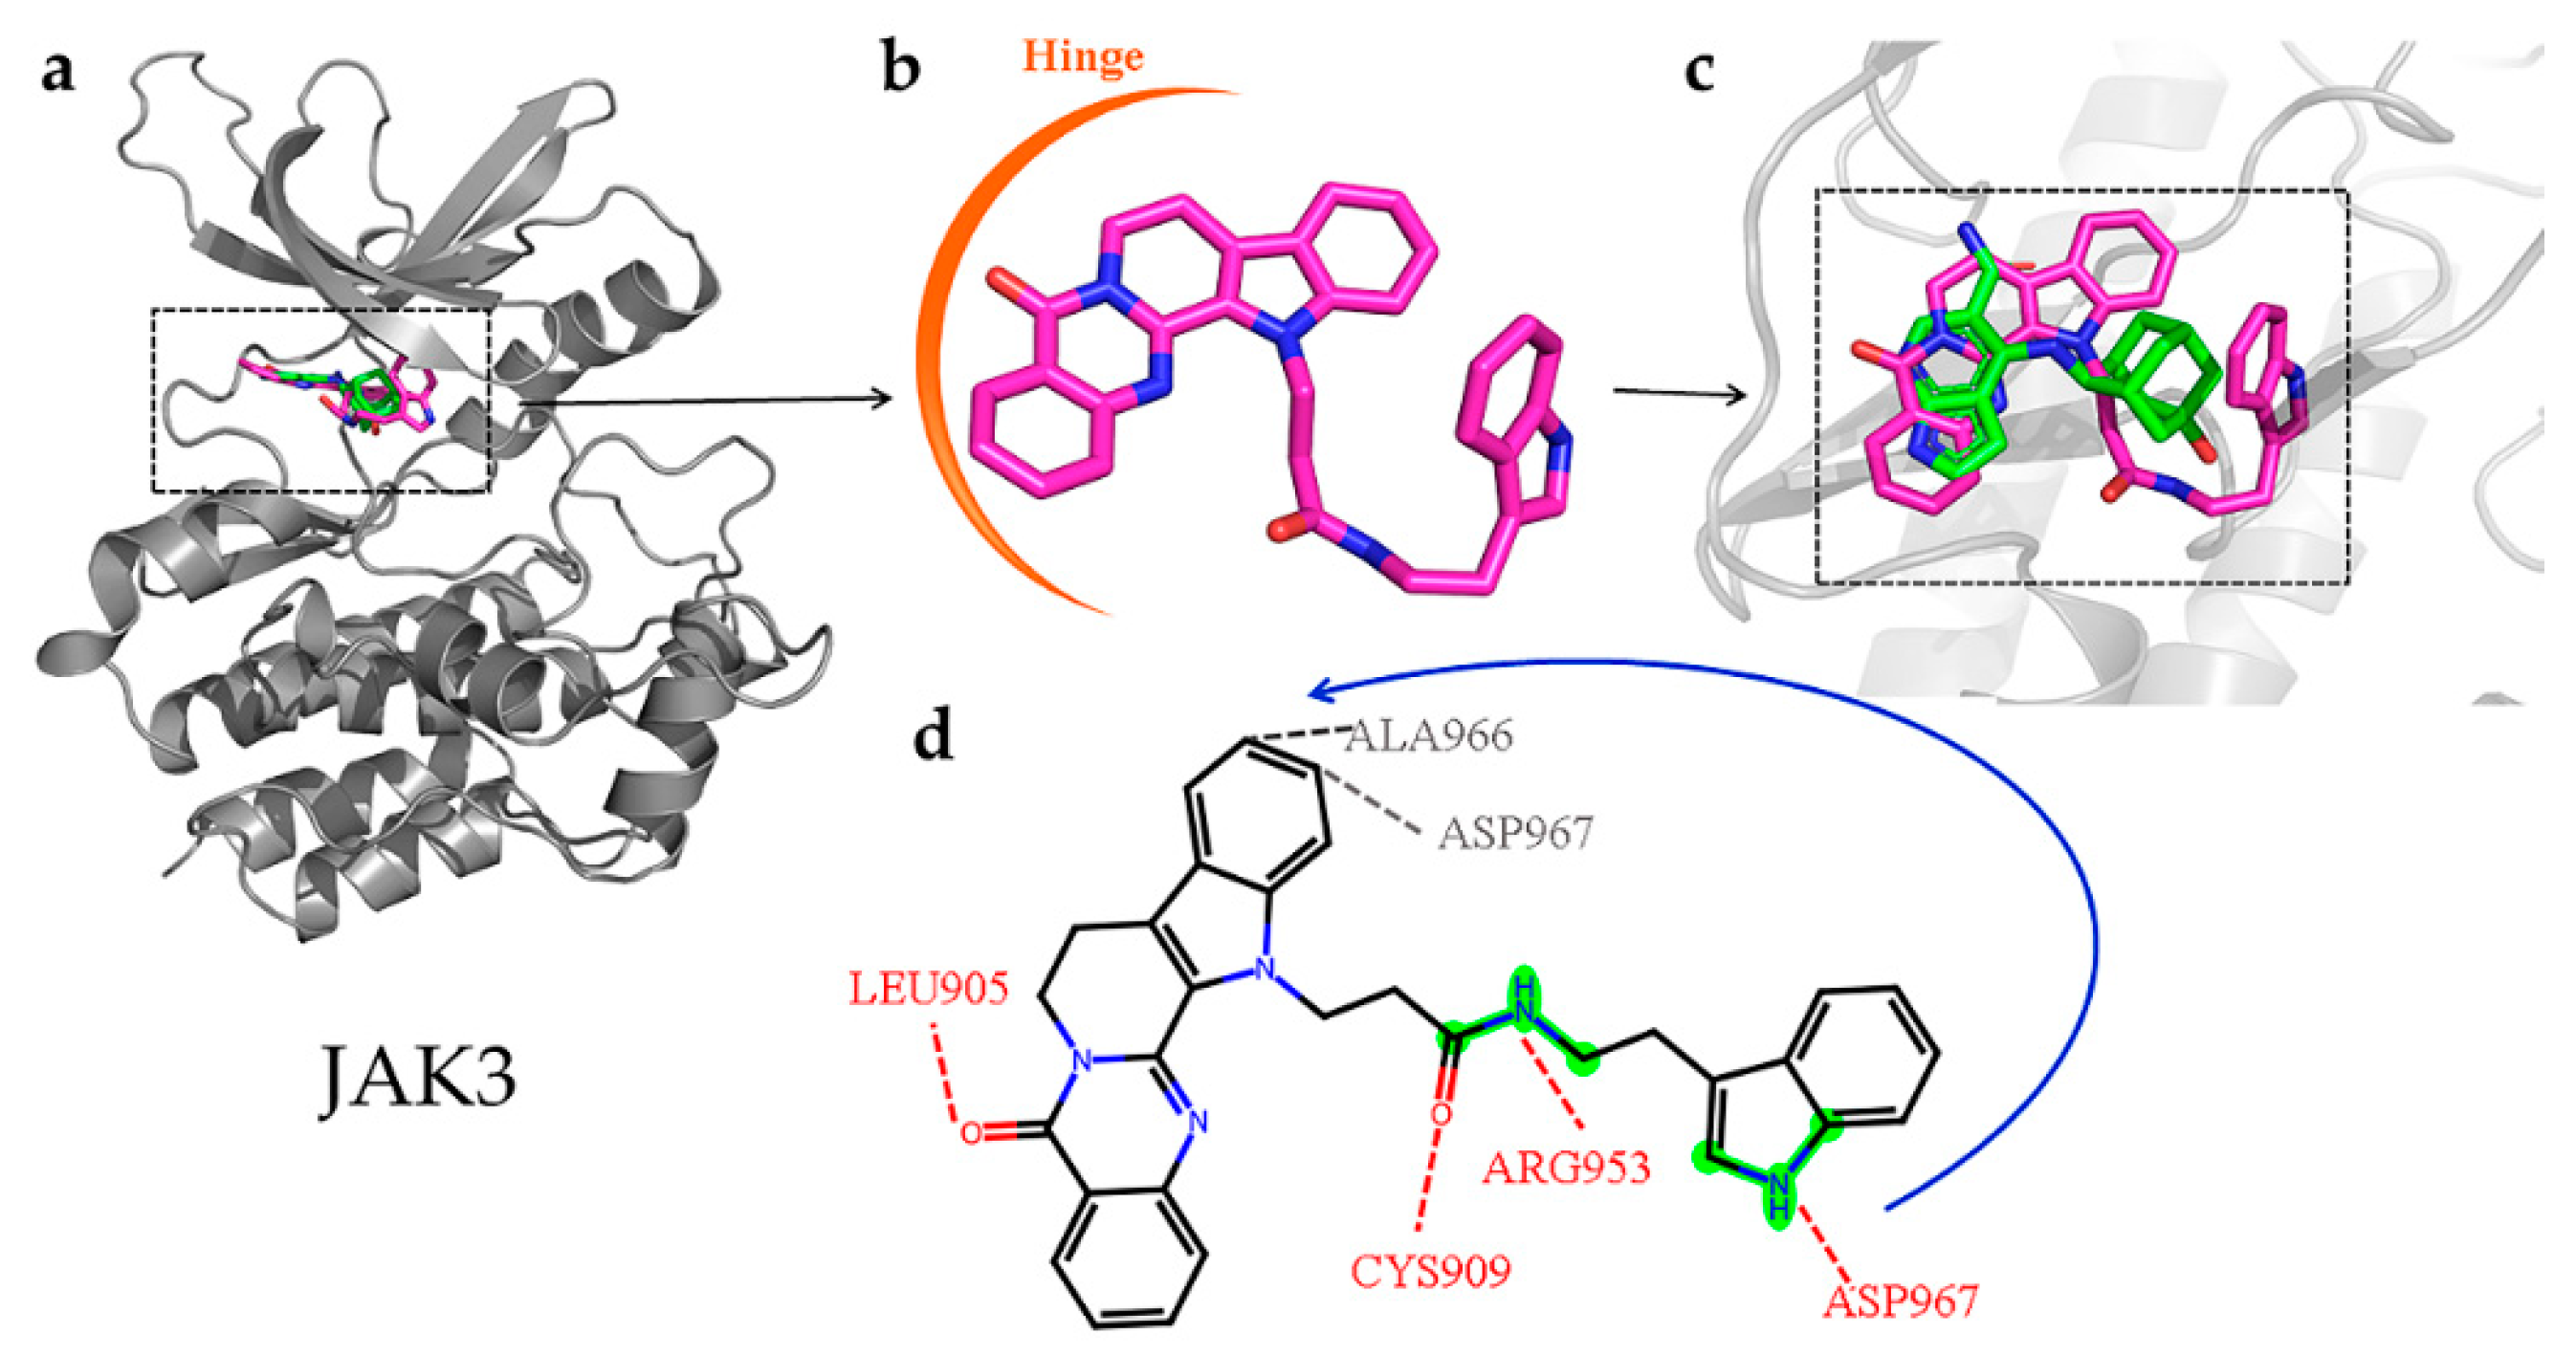
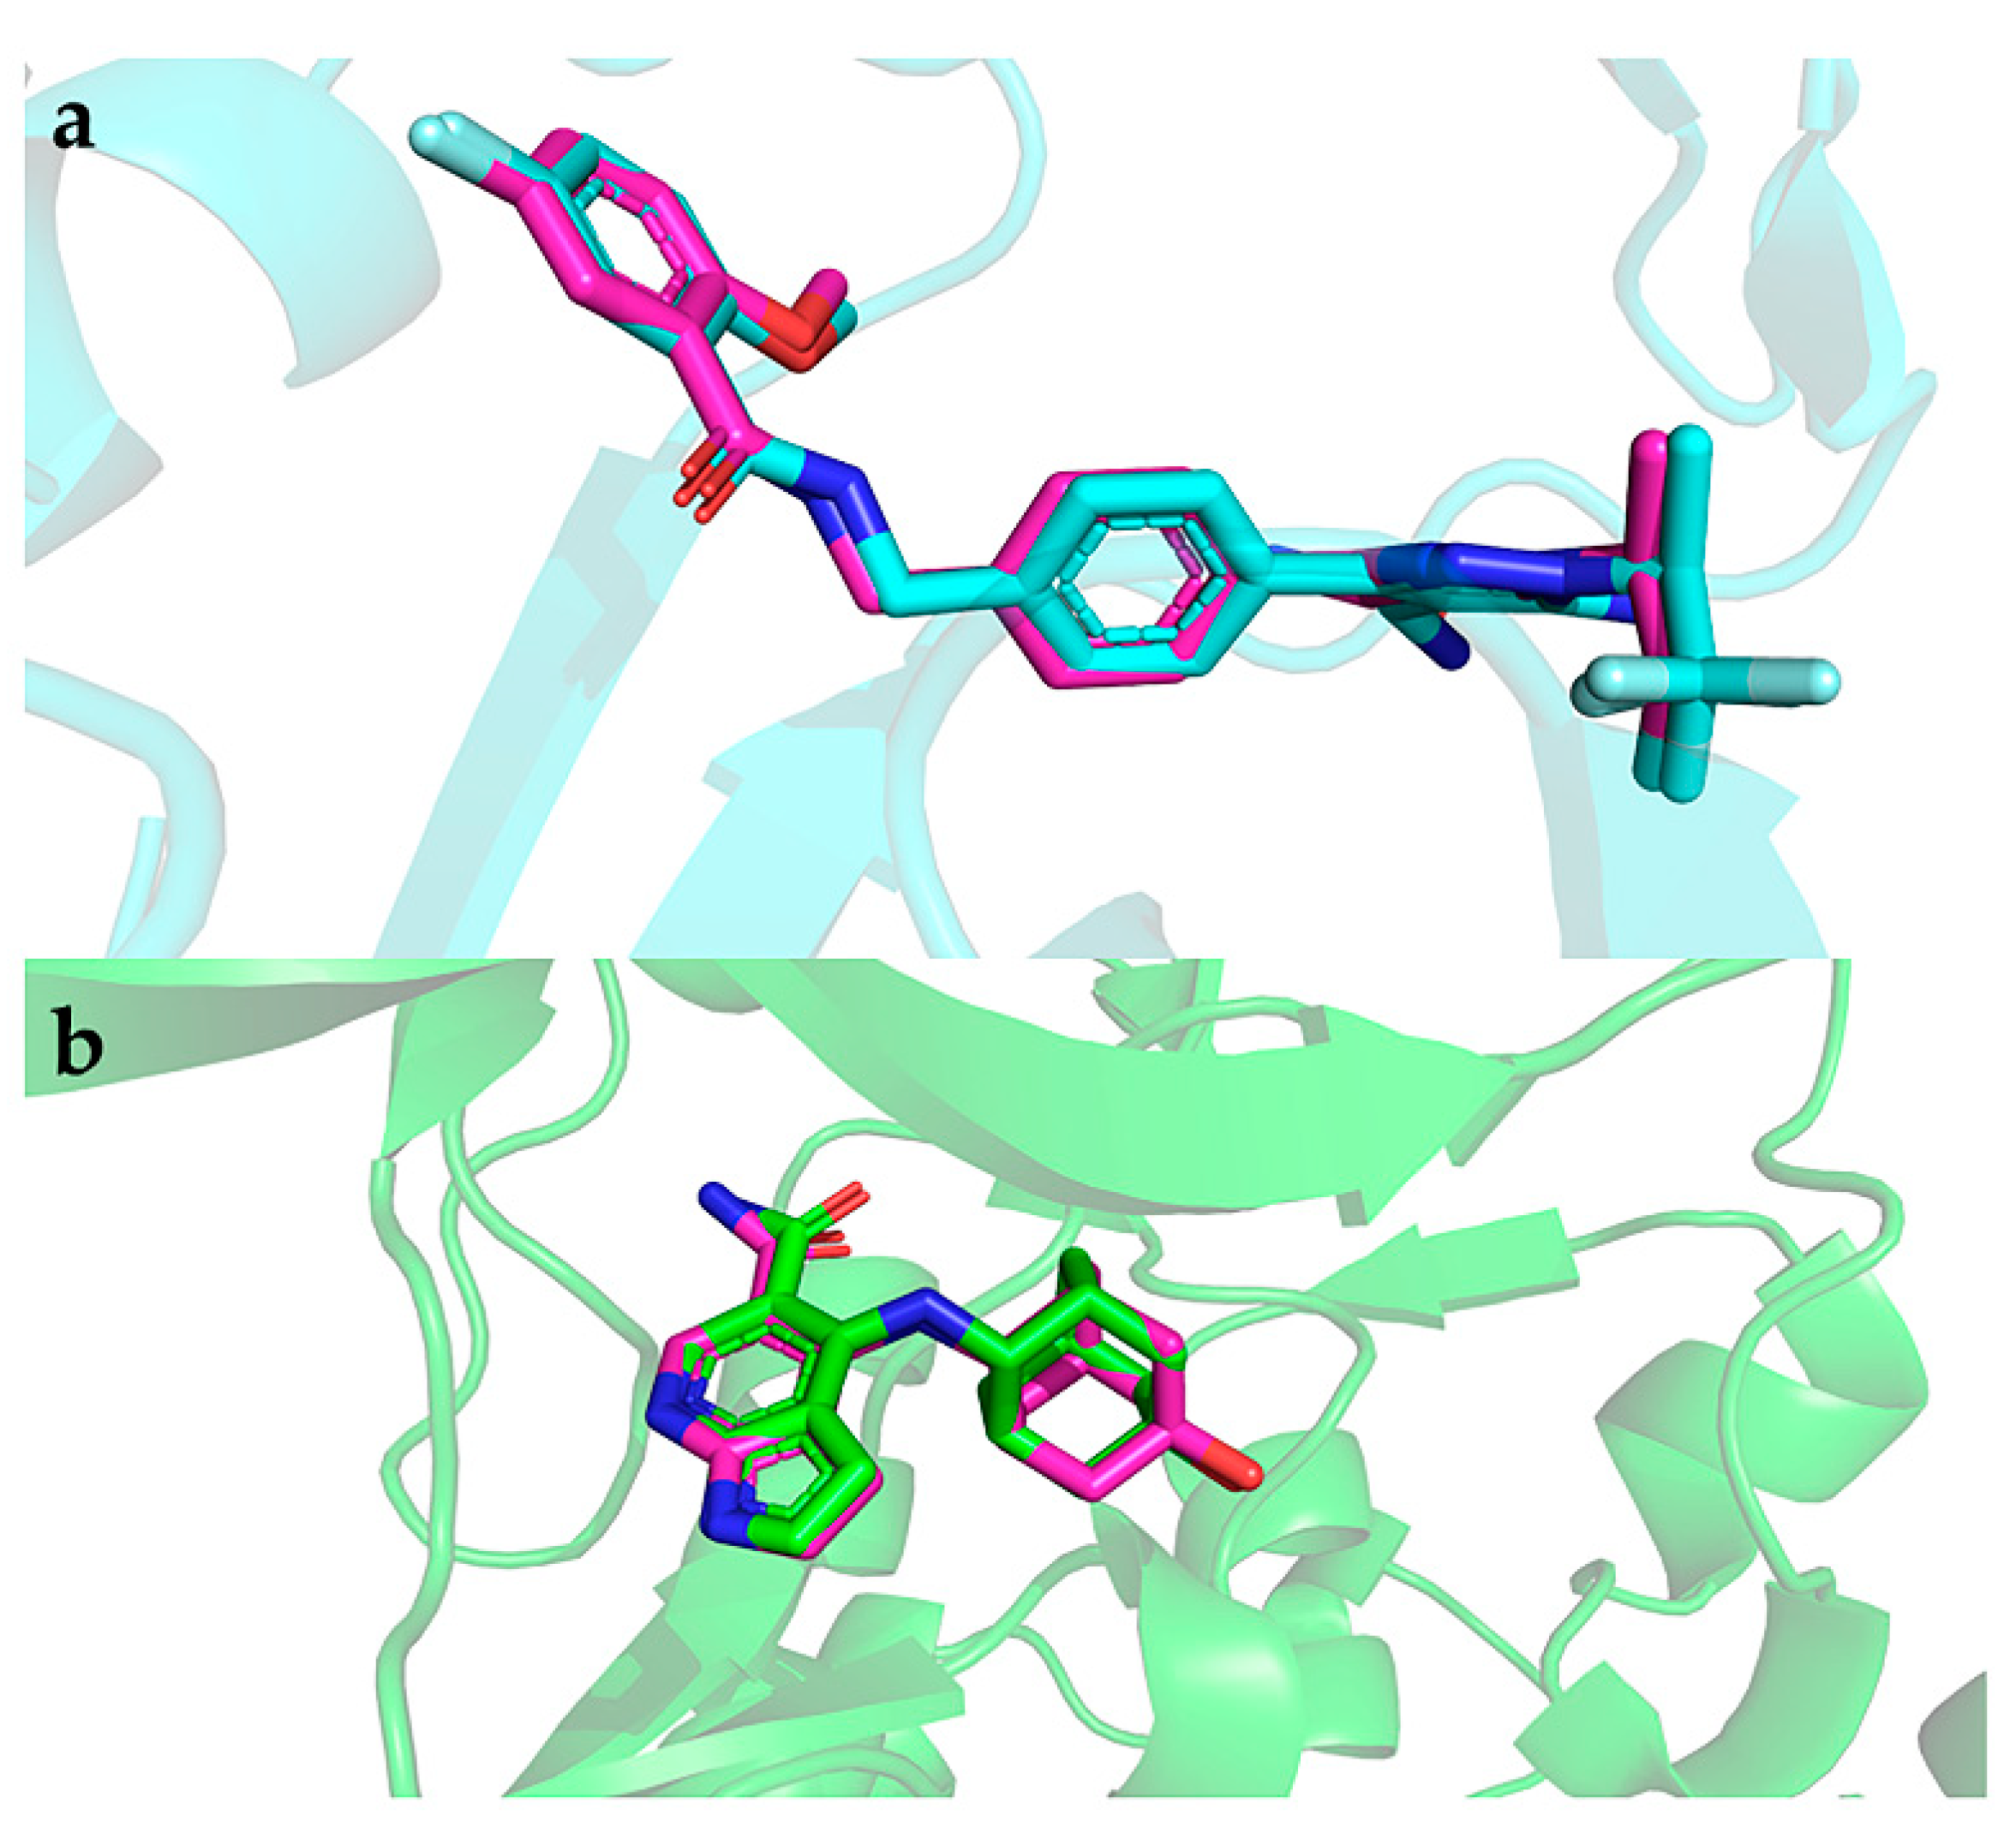
2.8. Interactions of the Screened Compounds with Their Protein Targets
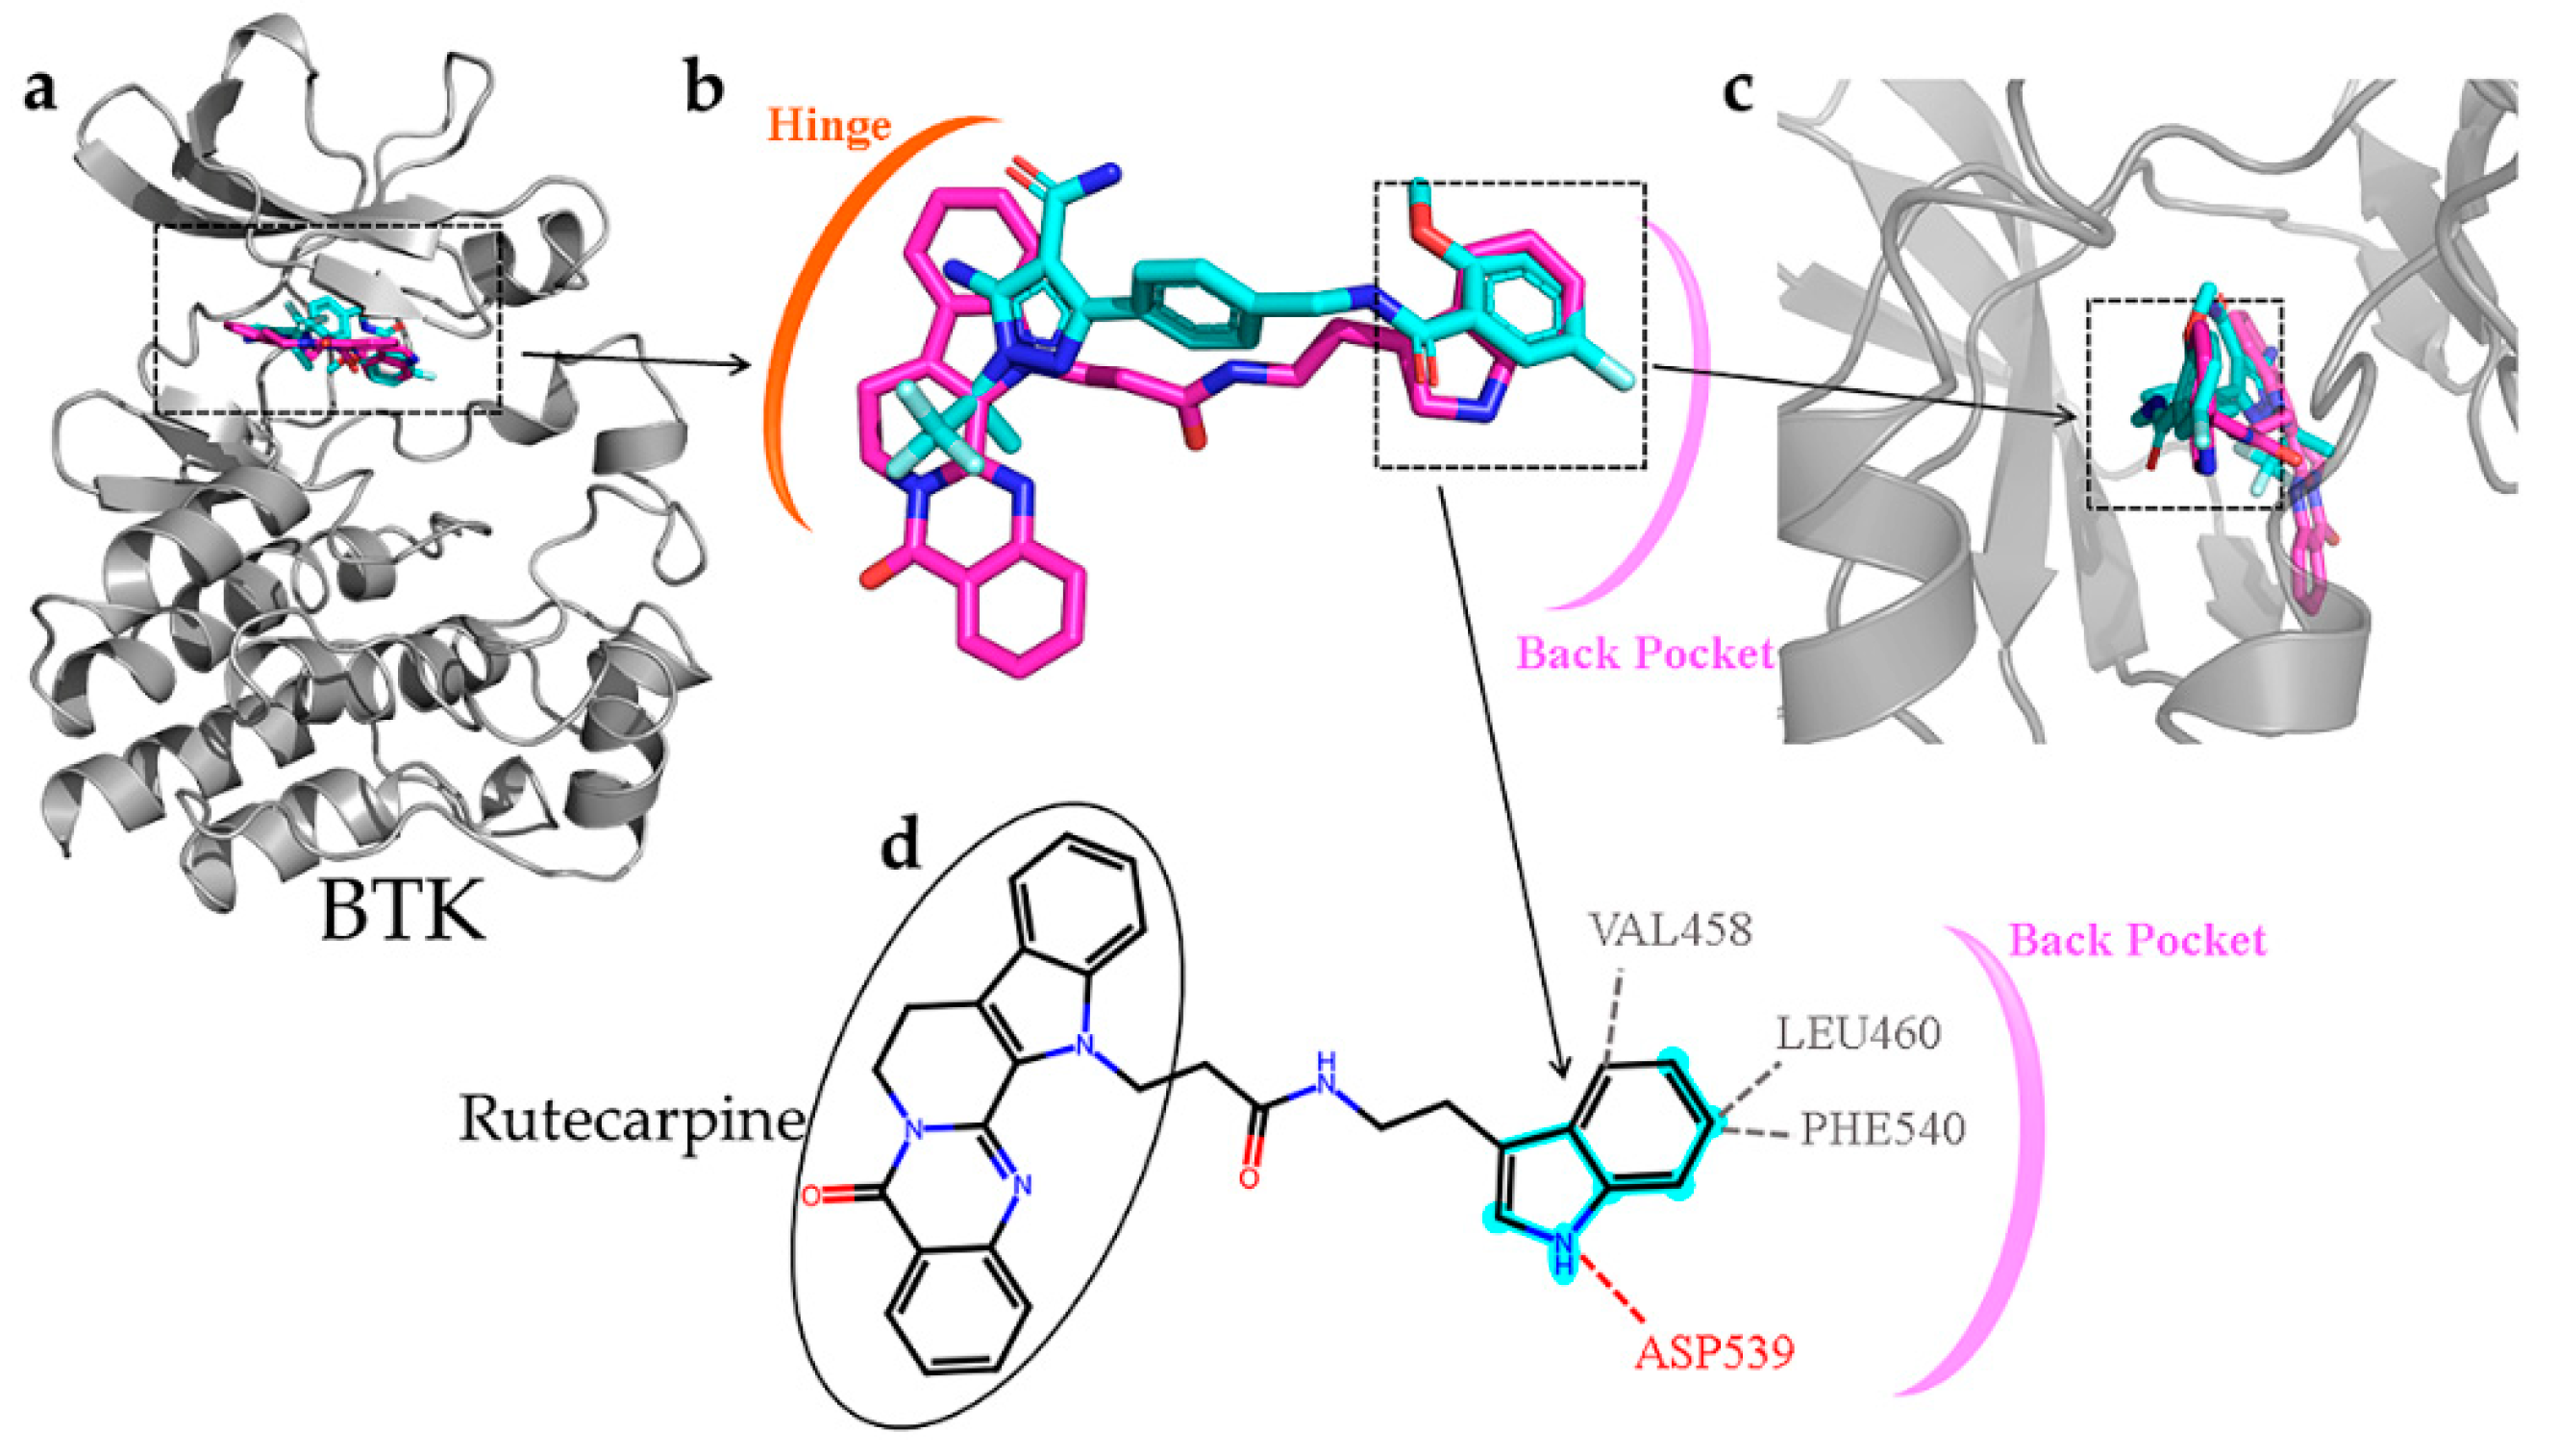
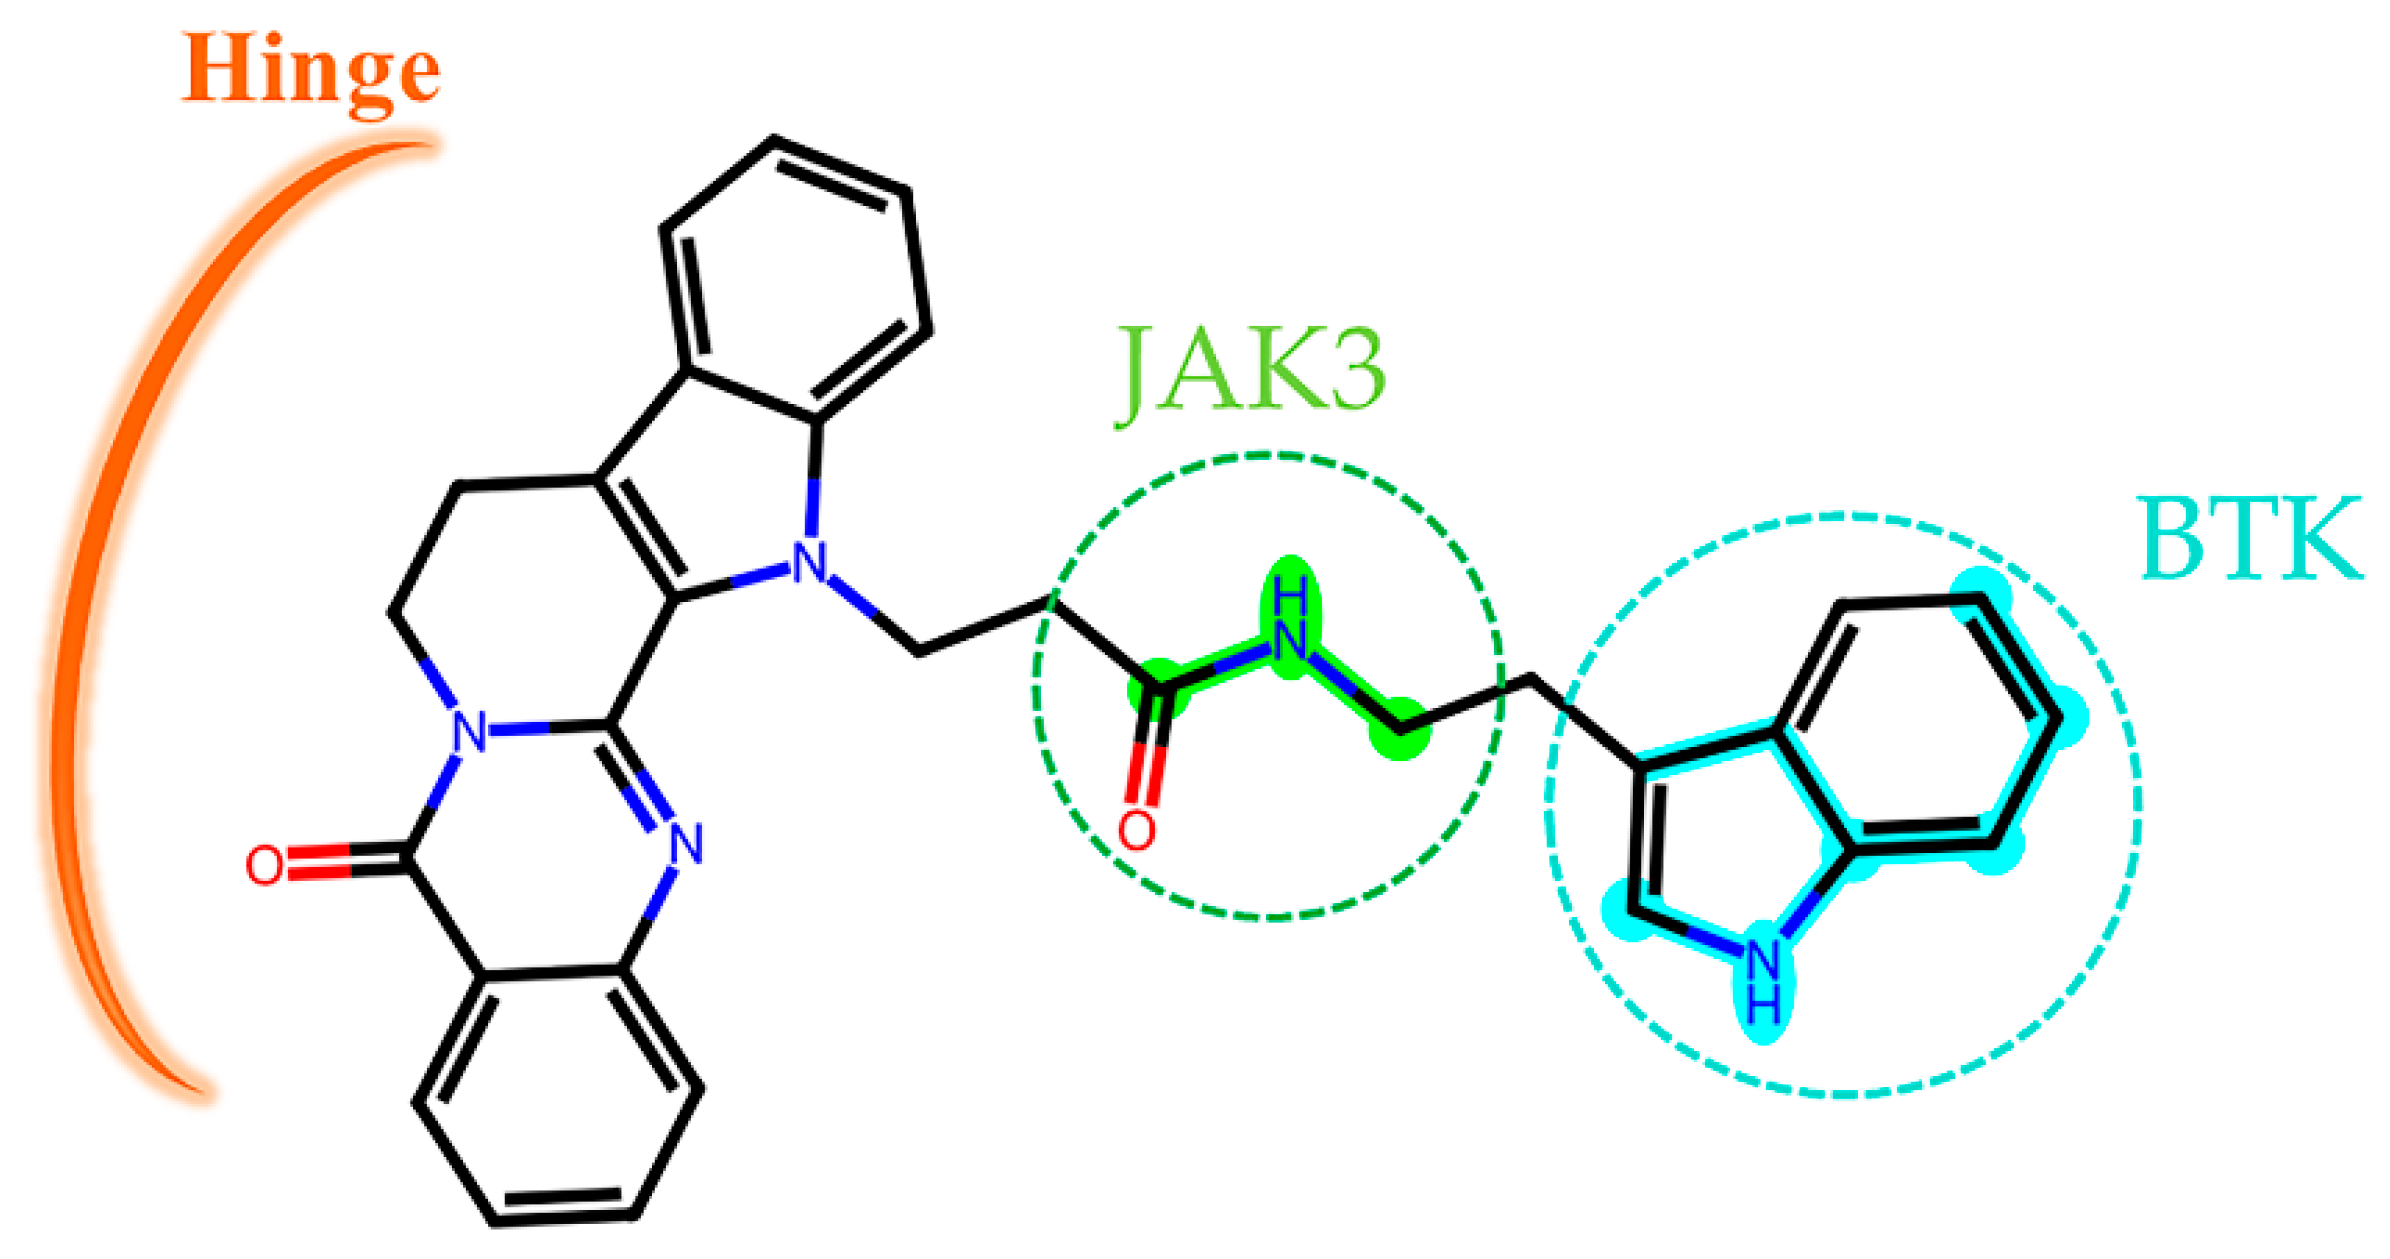
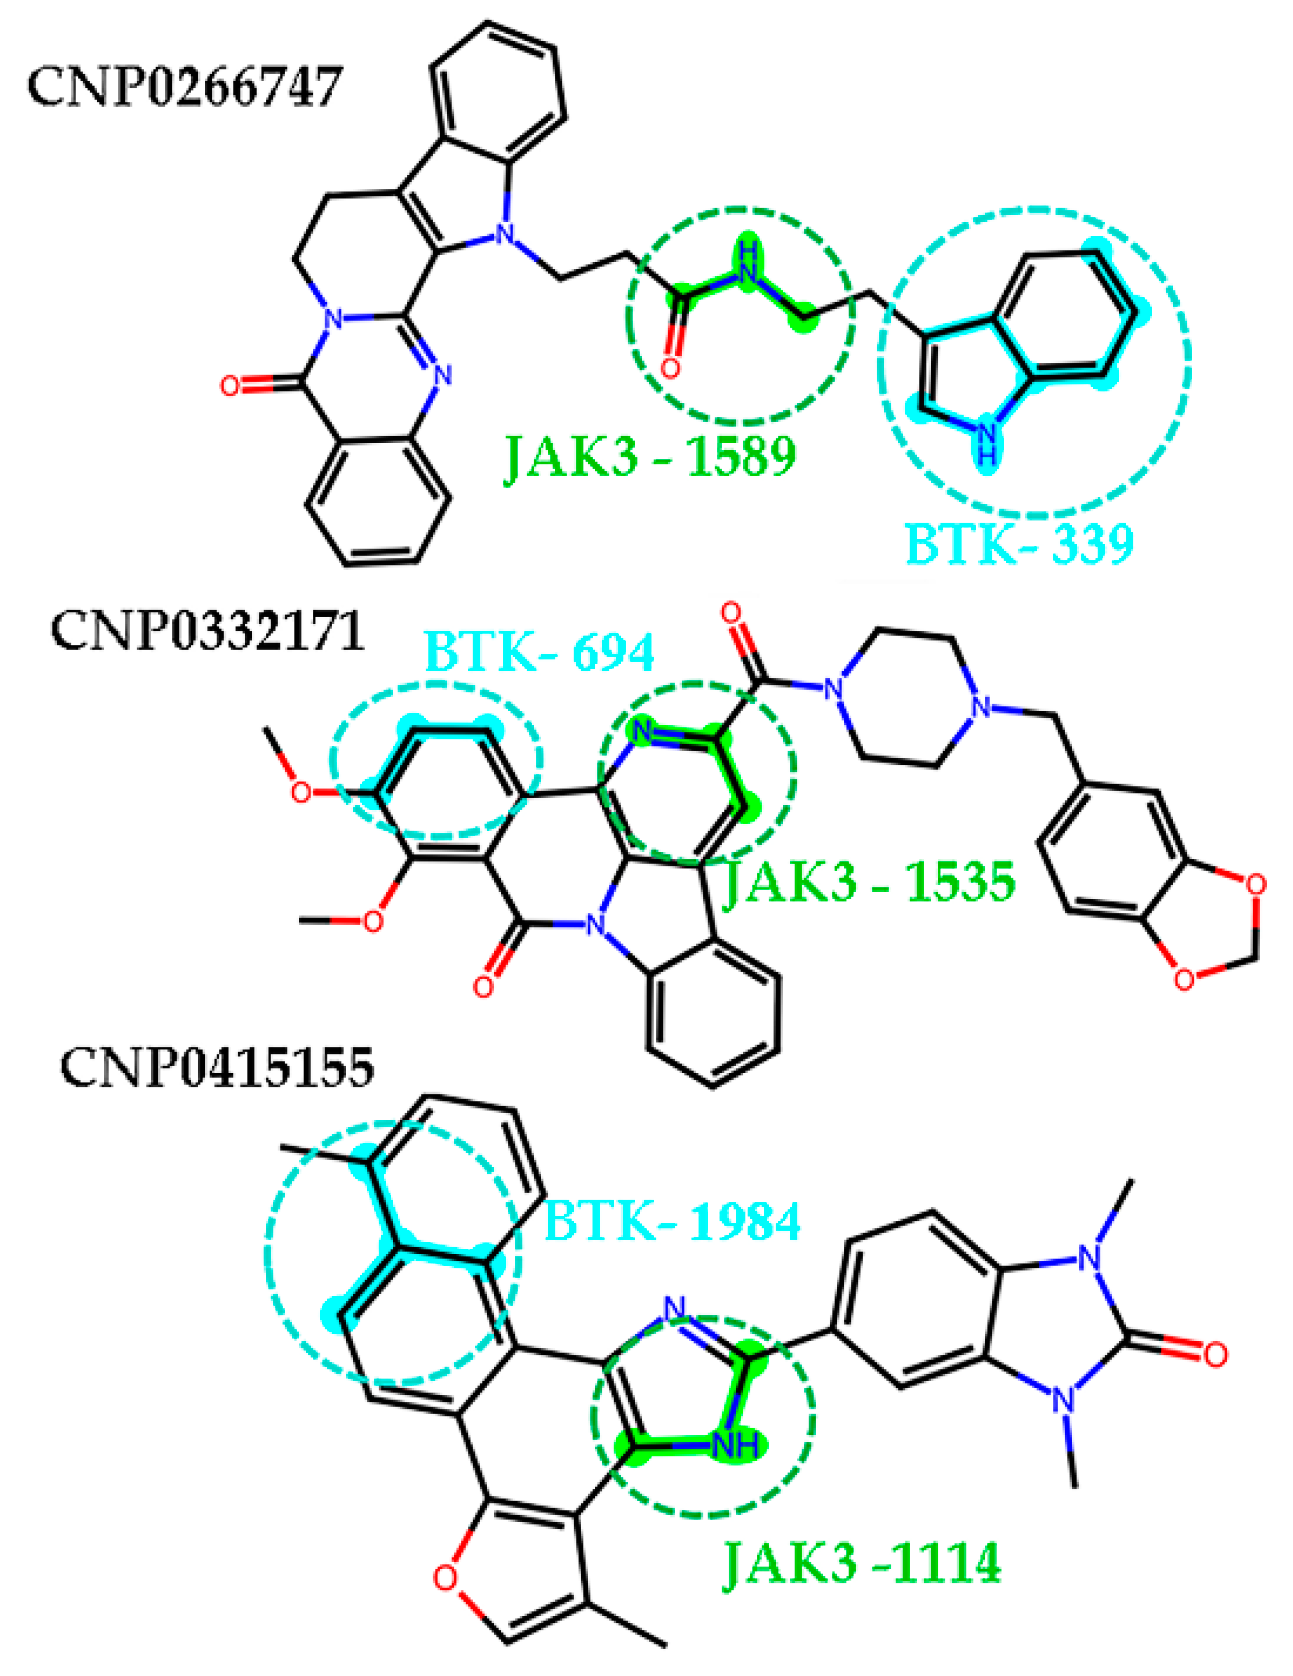
2.9. Active Fingerprint Fragments in CNP0266747 for Dual Targets
3. Discussion
4. Materials and Methods
4.1. Collection and Preparation of Data
4.2. Model Construction
4.3. Evaluation and Explanation of Models
4.4. Model Interpretation
4.5. Virtual Screening
4.6. Molecular Dynamics Simulations
Supplementary Materials
Author Contributions
Funding
Institutional Review Board Statement
Informed Consent Statement
Data Availability Statement
Conflicts of Interest
Sample Availability
Appendix A


| Compound | Residues | Occupancy | Compound | Residues | Occupancy | ||
|---|---|---|---|---|---|---|---|
| BTK | Pirtobrutinib | Glu475 Met477 Asp539 | 99.3% 95.7% 41.1% | JAK3 | Peficitinib | Glu903 Leu905 | 94.5% 77.8% |
| CNP0266747 | Asp539 | 97.6% | CNP0266747 | Asp967 Leu905 Cys909 Arg953 | 90.2% 97.9% 50.2% 42.9% | ||
| CNP0332171 | Gln412 Met477 | 55.2% 75.3% | CNP0332171 | Leu905 Cys909 | 88.3% 20.4% | ||
| CNP0415155 | Lys430 | 12.3% | CNP0415155 | Leu905 | 58.5% |


References
- Davis, M.I.; Hunt, J.P.; Herrgard, S.; Ciceri, P.; Wodicka, L.M.; Pallares, G.; Hocker, M.; Treiber, D.K.; Zarrinkar, P.P. Comprehensive analysis of kinase inhibitor selectivity. Nat. Biotechnol. 2011, 29, 1046–1051. [Google Scholar] [CrossRef] [PubMed]
- Oset-Gasque, M.J.; Marco-Contelles, J. Alzheimer’s Disease, the “One-Molecule, One-Target” Paradigm, and the Multitarget Directed Ligand Approach. ACS Chem. Neurosci. 2018, 9, 401–403. [Google Scholar] [CrossRef]
- Mishra, P.; Kumar, A.; Panda, G. Anti-cholinesterase hybrids as multi-target-directed ligands against Alzheimer’s disease (1998–2018). Bioorg. Med. Chem. 2019, 27, 895–930. [Google Scholar] [CrossRef]
- Gharwan, H.; Groninger, H. Kinase inhibitors and monoclonal antibodies in oncology: Clinical implications. Nat. Rev. Clin. Oncol. 2016, 13, 209–227. [Google Scholar] [CrossRef]
- Shen, P.; Wang, Y.; Jia, X.; Xu, P.; Qin, L.; Feng, X.; Li, Z.; Qiu, Z. Dual-target Janus kinase (JAK) inhibitors: Comprehensive review on the JAK-based strategies for treating solid or hematological malignancies and immune-related diseases. Eur. J. Med. Chem. 2022, 239, 114551. [Google Scholar] [CrossRef]
- Springuel, L.; Hornakova, T.; Losdyck, E.; Lambert, F.; Leroy, E.; Constantinescu, S.N.; Flex, E.; Tartaglia, M.; Knoops, L.; Renauld, J.-C. Cooperating JAK1 and JAK3 mutants increase resistance to JAK inhibitors. Blood 2014, 124, 3924–3931. [Google Scholar] [CrossRef] [PubMed][Green Version]
- Wang, E.; Mi, X.; Thompson, M.C.; Montoya, S.; Notti, R.Q.; Afaghani, J.; Durham, B.H.; Penson, A.; Witkowski, M.T.; Lu, S.X.; et al. Mechanisms of Resistance to Noncovalent Bruton’s Tyrosine Kinase Inhibitors. N. Engl. J. Med. 2022, 386, 735–743. [Google Scholar] [CrossRef]
- Vassilev, A.O.; Tibbles, H.E.; DuMez, D.; Venkatachalam, T.K.; Uckun, F.M. Targeting JAK3 and BTK Tyrosine Kinases with Rationally-Designed Inhibitors. Curr. Drug Targets 2006, 7, 327–343. [Google Scholar] [CrossRef]
- Hamaguchi, H.; Amano, Y.; Moritomo, A.; Shirakami, S.; Nakajima, Y.; Nakai, K.; Nomura, N.; Ito, M.; Higashi, Y.; Inoue, T. Discovery and structural characterization of peficitinib (ASP015K) as a novel and potent JAK inhibitor. Bioorg. Med. Chem. 2018, 26, 4971–4983. [Google Scholar] [CrossRef] [PubMed]
- Wang, Q.; Vogan, E.M.; Nocka, L.M.; Rosen, C.E.; Zorn, J.A.; Harrison, S.C.; Kuriyan, J. Autoinhibition of Bruton’s tyrosine kinase (Btk) and activation by soluble inositol hexakisphosphate. eLlife 2015, 4, e06074. [Google Scholar] [CrossRef] [PubMed]
- Mohamed, A.J.; Yu, L.; Bäckesjö, C.; Vargas, L.; Faryal, R.; Aints, A.; Christensson, B.; Berglöf, A.; Vihinen, M.; Nore, B.F.; et al. Bruton’s tyrosine kinase (Btk): Function, regulation, and transformation with special emphasis on the PH domain. Immunol. Rev. 2009, 228, 58–73. [Google Scholar] [CrossRef]
- Mohamed, A.J.; Nore, B.F.; Christensson, B.; Smith, C.I.E. Signalling of Bruton’s tyrosine kinase, Btk. Scand. J. Immunol. 1999, 49, 113–118. [Google Scholar] [CrossRef] [PubMed]
- Mease, P.J. B cell-targeted therapy in autoimmune disease: Rationale, mechanisms, and clinical application. J. Rheumatol. 2008, 35, 1245–1255. [Google Scholar]
- Sarvaria, A.; Madrigal, J.A.; Saudemont, A. B cell regulation in cancer and anti-tumor immunity. Cell. Mol. Immunol. 2017, 14, 662–674. [Google Scholar] [CrossRef]
- Byrd, J.C.; Furman, R.R.; Coutre, S.E.; Flinn, I.W.; Burger, J.A.; Blum, K.A.; Grant, B.; Sharman, J.P.; Coleman, M.; Wierda, W.G.; et al. Targeting BTK with Ibrutinib in Relapsed Chronic Lymphocytic Leukemia. N. Engl. J. Med. 2013, 369, 32–42. [Google Scholar] [CrossRef]
- Advani, R.H.; Buggy, J.J.; Sharman, J.P.; Smith, S.M.; Boyd, T.E.; Grant, B.; Kolibaba, K.S.; Furman, R.R.; Rodriguez, S.; Chang, B.Y.; et al. Bruton Tyrosine Kinase Inhibitor Ibrutinib (PCI-32765) Has Significant Activity in Patients with Relapsed/Refractory B-Cell Malignancies. J. Clin. Oncol. 2013, 31, 88–94. [Google Scholar] [CrossRef]
- Dhillon, S. Orelabrutinib: First Approval. Drugs 2021, 81, 503–507. [Google Scholar] [CrossRef]
- Wang, M.; Shah, N.; Alencar, A.; Gerson, J.; Patel, M.; Fakhri, B.; Jurczak, W.; Tan, X.; Lewis, K.; Fenske, T.; et al. A Highly Selective, Non-covalent (Reversible) BTK Inhibitor in Previously Treated Mantle Cell Lymphoma: Updated Results from The Phase 1/2 BRUIN Study. Br. J. Haematol. 2022, 197, 101–104. [Google Scholar]
- Mato, A.R.; Shah, N.N.; Jurczak, W.; Cheah, C.Y.; Pagel, J.M.; Woyach, J.A.; Fakhri, B.; Eyre, T.A.; Lamanna, N.; Patel, M.R.; et al. Pirtobrutinib in relapsed or refractory B-cell malignancies (BRUIN): A phase 1/2 study. Lancet 2021, 397, 892–901. [Google Scholar] [CrossRef] [PubMed]
- O’Shea, J.J.; Schwartz, D.M.; Villarino, A.V.; Gadina, M.; McInnes, I.B.; Laurence, A. The JAK-STAT Pathway: Impact on Human Disease and Therapeutic Intervention. Annu. Rev. Med. 2015, 66, 311–328. [Google Scholar] [CrossRef] [PubMed]
- He, L.; Pei, H.; Lan, T.; Tang, M.; Zhang, C.; Chen, L. Design and Synthesis of a Highly Selective JAK3 Inhibitor for the Treatment of Rheumatoid Arthritis. Arch. Pharm. 2017, 350, 1700194. [Google Scholar] [CrossRef]
- Xu, H.; Jesson, M.I.; Seneviratne, U.I.; Lin, T.H.; Sharif, M.N.; Xue, L.; Nguyen, C.; Everley, R.A.; Trujillo, J.I.; Johnson, D.S.; et al. PF-06651600, a Dual JAK3/TEC Family Kinase Inhibitor. ACS Chem. Biol. 2019, 14, 1235–1242. [Google Scholar] [CrossRef]
- Steele, A.J.; Prentice, A.G.; Cwynarski, K.; Hoffbrand, A.V.; Hart, S.M.; Lowdell, M.W.; Samuel, E.R.; Wickremasinghe, R.G. The JAK3-selective inhibitor PF-956980 reverses the resistance to cytotoxic agents induced by interleukin-4 treatment of chronic lymphocytic leukemia cells: Potential for reversal of cytoprotection by the microenvironment. Blood 2010, 116, 4569–4577. [Google Scholar] [CrossRef][Green Version]
- Sudbeck, E.A.; Liu, X.P.; Narla, R.K.; Mahajan, S.; Ghosh, S.; Mao, C.; Uckun, F.M. Structure-based design of specific inhibitors of Janus kinase 3 as apoptosis-inducing antileukemic agents. Clin. Cancer Res. 1999, 5, 1569–1582. [Google Scholar] [PubMed]
- Qazi, S.; Uckun, F.M. Gene expression profiles of infant acute lymphoblastic leukaemia and its prognostically distinct subsets. Br. J. Haematol. 2010, 149, 865–873. [Google Scholar] [CrossRef] [PubMed]
- Traves, P.G.; Murray, B.; Campigotto, F.; Galien, R.; Meng, A.; Di Paolo, J.A. JAK selectivity and the implications for clinical inhibition of pharmacodynamic cytokine signalling by filgotinib, upadacitinib, tofacitinib and baricitinib. Rheumatology 2021, 80, 865–875. [Google Scholar] [CrossRef]
- Shawky, A.M.; Almalki, F.A.; Abdalla, A.N.; Abdelazeem, A.H.; Gouda, A.M. A Comprehensive Overview of Globally Approved JAK Inhibitors. Pharmaceutics 2022, 14, 1001. [Google Scholar] [CrossRef]
- Qiu, Q.; Feng, Q.; Tan, X.; Guo, M. JAK3-selective inhibitor peficitinib for the treatment of rheumatoid arthritis. Expert Rev. Clin. Pharmacol. 2019, 12, 547–554. [Google Scholar] [CrossRef] [PubMed]
- Ren, J.; Shi, W.; Zhao, D.; Wang, Q.; Chang, X.; He, X.; Wang, X.; Gao, Y.; Lu, P.; Zhang, X.; et al. Design and synthesis of boron-containing diphenylpyrimidines as potent BTK and JAK3 dual inhibitors. Bioorg. Med. Chem. 2020, 28, 115236. [Google Scholar] [CrossRef]
- Ge, Y.; Wang, C.; Song, S.; Huang, J.; Liu, Z.; Li, Y.; Meng, Q.; Zhang, J.; Yao, J.; Liu, K.; et al. Identification of highly potent BTK and JAK3 dual inhibitors with improved activity for the treatment of B-cell lymphoma. Eur. J. Med. Chem. 2018, 143, 1847–1857. [Google Scholar] [CrossRef]
- Vamathevan, J.; Clark, D.; Czodrowski, P.; Dunham, I.; Ferran, E.; Lee, G.; Li, B.; Madabhushi, A.; Shah, P.; Spitzer, M.; et al. Applications of machine learning in drug discovery and development. Nat. Rev. Drug Discov. 2019, 18, 463–477. [Google Scholar] [CrossRef] [PubMed]
- Yang, M.; Tao, B.; Chen, C.; Jia, W.; Sun, S.; Zhang, T.; Wang, X. Machine Learning Models Based on Molecular Fingerprints and an Extreme Gradient Boosting Method Lead to the Discovery of JAK2 Inhibitors. J. Chem. Inf. Model. 2019, 59, 5002–5012. [Google Scholar] [CrossRef]
- Li, G.; Li, J.; Tian, Y.; Zhao, Y.; Pang, X.; Yan, A. Machine learning-based classification models for non-covalent Bruton’s tyrosine kinase inhibitors: Predictive ability and interpretability. Mol. Divers. 2023, 1–19. [Google Scholar] [CrossRef]
- Lundberg, S.M.; Lee, S.I. A Unified Approach to Interpreting Model Predictions. In Proceedings of the 1st International Conference on Neural Information Processing Systems, Long Beach, CA, USA, 4–9 December 2017. [Google Scholar]
- Armstrong, G.; Martino, C.; Rahman, G.; Gonzalez, A.; Vázquez-Baeza, Y.; Mishne, G.; Knight, R. Uniform Manifold Approximation and Projection (UMAP) Reveals Composite Patterns and Resolves Visualization Artifacts in Microbiome Data. mSystems 2021, 6, e0069121. [Google Scholar] [CrossRef] [PubMed]
- Probst, D.; Reymond, J.-L. Visualization of very large high-dimensional data sets as minimum spanning trees. J. Chemin. 2020, 12, 12. [Google Scholar] [CrossRef] [PubMed]
- Adasme, M.F.; Linnemann, K.L.; Bolz, S.N.; Kaiser, F.; Salentin, S.; Haupt, V.J.; Schroeder, M. PLIP 2021: Expanding the scope of the protein–ligand interaction profiler to DNA and RNA. Nucleic Acids Res. 2021, 49, W530–W534. [Google Scholar] [CrossRef]
- Sun, L.; Wang, Z.; Yang, Z.; Liu, X.; Dong, H. Virtual screening and structure–activity relationship study of novel BTK inhibitors in Traditional Chinese Medicine for the treatment of rheumatoid arthritis. J. Biomol. Struct. Dyn. 2023, 1–15. [Google Scholar] [CrossRef]
- Rajeswari, M.; Santhi, N.; Bhuvaneswari, V. Pharmacophore and Virtual Screening of JAK3 inhibitors. Bioinformation 2014, 10, 157–163. [Google Scholar] [CrossRef]
- Rogers, D.; Hahn, M. Extended-Connectivity Fingerprints. J. Chem. Inf. Model. 2010, 50, 742–754. [Google Scholar] [CrossRef]
- Breiman, L. Random forests. Mach. Learn. 2001, 45, 5–32. [Google Scholar] [CrossRef]
- Geurts, P.; Ernst, D.; Wehenkel, L. Extremely randomized trees. Mach. Learn. 2006, 63, 3–42. [Google Scholar]
- Chen, T.Q.; Guestrin, C. XGBoost: A Scalable Tree Boosting System. In Proceedings of the KDD’16: The 22nd ACM SIGKDD International Conference on Knowledge Discovery and Data Mining, San Francisco, CA, USA, 13–17 August 2016; pp. 785–794. [Google Scholar]
- Iman, R.L.; Hora, S.C. Bayesian Methods for Modeling Recovery Times with an Application to the Loss of Off-Site Power at Nuclear Power Plants. Risk Anal. 1989, 9, 25–36. [Google Scholar] [CrossRef]
- Holm, E.A. In defense of the black box. Science 2019, 364, 26–27. [Google Scholar] [CrossRef] [PubMed]
- Du, M.; Liu, N.; Hu, X. Techniques for interpretable machine learning. Commun. ACM 2020, 63, 68–77. [Google Scholar] [CrossRef]
- Huey, R.; Morris, G.M.; Olson, A.J.; Goodsell, D.S. A semiempirical free energy force field with charge-based desolvation. J. Comput. Chem. 2007, 28, 1145–1152. [Google Scholar] [CrossRef]
- Chabchoub, Y.; Fricker, C. Classification of the Velib Stations Using Kmeans, Dynamic Time Wraping and Dba Averaging Method. In Proceedings of the 2014 International Workshop on Computational Intelligence for Multimedia Understanding (IWCIM), Paris, France, 1–2 November 2014. [Google Scholar]
- Daina, A.; Michielin, O.; Zoete, V. SwissADME: A free web tool to evaluate pharmacokinetics, drug-likeness and medicinal chemistry friendliness of small molecules. Sci. Rep. 2017, 7, 42717. [Google Scholar] [CrossRef] [PubMed]
- Dong, J.; Wang, N.-N.; Yao, Z.-J.; Zhang, L.; Cheng, Y.; Ouyang, D.; Lu, A.-P.; Cao, D.-S. ADMETlab: A platform for systematic ADMET evaluation based on a comprehensively collected ADMET database. J. Cheminform. 2018, 10, 29. [Google Scholar] [CrossRef]
- Tirado-Rives, J.; Jorgensen, W.L. Performance of B3LYP Density Functional Methods for a Large Set of Organic Molecules. J. Chem. Theory Comput. 2008, 4, 297–306. [Google Scholar] [CrossRef]
- Case, D.A.; Cheatham, T.E., III; Darden, T.; Gohlke, H.; Luo, R.; Merz, K.M., Jr.; Onufriev, A.; Simmerling, C.; Wang, B.; Woods, R.J. The Amber biomolecular simulation programs. J. Comput. Chem. 2005, 26, 1668–1688. [Google Scholar] [CrossRef]
- Lu, T.; Chen, F. Multiwfn: A multifunctional wavefunction analyzer. J. Comput. Chem. 2012, 33, 580–592. [Google Scholar] [CrossRef] [PubMed]
- Hornak, V.; Abel, R.; Okur, A.; Strockbine, B.; Roitberg, A.; Simmerling, C. Comparison of multiple Amber force fields and development of improved protein backbone parameters. Proteins Struct. Funct. Bioinform. 2006, 65, 712–725. [Google Scholar] [CrossRef] [PubMed]
- Kholmurodov, K.; Smith, W.; Yasuoka, K.; Darden, T.; Ebisuzaki, T. A smooth-particle mesh Ewald method for DL_POLY molecular dynamics simulation package on the Fujitsu VPP700. J. Comput. Chem. 2000, 21, 1187–1191. [Google Scholar] [CrossRef]
- Kumari, R.; Kumar, R.; Lynn, A.; Consort, O.S.D.D. g_mmpbsa–A GROMACS Tool for High-Throughput MM-PBSA Calculations. J. Chem. Inf. Model. 2014, 54, 1951–1962. [Google Scholar] [CrossRef] [PubMed]
- Gohlke, H.; Case, D.A. Insights into protein-protein binding by binding free energy calculation and free energy decomposition using a generalized born model. Abstr. Pap. Am. Chem. Soc. 2003, 225, U791. [Google Scholar]
- Keretsu, S.; Bhujbal, S.P.; Cho, S.J. Computational study of paroxetine-like inhibitors reveals new molecular insight to inhibit GRK2 with selectivity over ROCK1. Sci. Rep. 2019, 9, 13053. [Google Scholar] [CrossRef]


| Method | AUC | Pre | F1 | Recall | ACC | |
|---|---|---|---|---|---|---|
| BTK | RF | 0.9487 | 0.9287 | 0.9491 | 0.9705 | 0.9195 |
| ET | 0.9355 | 0.9327 | 0.9451 | 0.9579 | 0.9139 | |
| XGB | 0.9524 | 0.9340 | 0.9483 | 0.9631 | 0.9187 | |
| JAK3 | RF | 0.9570 | 0.9111 | 0.9321 | 0.9543 | 0.9043 |
| ET | 0.9400 | 0.9196 | 0.9313 | 0.9435 | 0.9044 | |
| XGB | 0.9650 | 0.9209 | 0.9358 | 0.9513 | 0.9102 |
| Method | AUC | Pre | F1 | Recall | ACC | |
|---|---|---|---|---|---|---|
| BTK | RF | 0.9605 | 0.9311 | 0.9536 | 0.9771 | 0.9270 |
| ET | 0.9596 | 0.9346 | 0.9500 | 0.9700 | 0.9220 | |
| XGB | 0.9668 | 0.9406 | 0.9540 | 0.9678 | 0.9284 | |
| JAK3 | RF | 0.9640 | 0.9043 | 0.9313 | 0.9600 | 0.9051 |
| ET | 0.9557 | 0.9184 | 0.9344 | 0.9509 | 0.9105 | |
| XGB | 0.9686 | 0.9181 | 0.9326 | 0.9475 | 0.9082 |
| Bit | Fragment | Center | Radius | |
|---|---|---|---|---|
| BTK | 339 |  | C | 2 |
| 694 |  | C | 0 | |
| 1984 |  | C | 1 | |
| JAK3 | 1589 |  | N | 1 |
| 1535 |  | C | 1 | |
| 1114 |  | N | 0 |
| Natural Compound | Physicochemical Properties | Pharmacokinetics | Druglikeness | SA | ||
|---|---|---|---|---|---|---|
| LogP | LogS | HIA | logKp | Lipinski Rule | ||
| CNP0266747 | 3.43 | −5.70 | 98.0% | −6.35 cm/s | Accepted | 3.96 |
| CNP0332171 | 3.38 | −6.24 | 99.8% | −6.69 cm/s | Accepted | 3.93 |
| CNP0415155 | 4.15 | −6.82 | 86.4% | −4.91 cm/s | Accepted | 3.51 |
| Compound | ΔEele | ΔEvdw | ΔGPB | ΔGNP | −TΔS | ΔGbind | |
|---|---|---|---|---|---|---|---|
| BTK | CNP0266747 | −12.404 | −57.269 | 32.323 | −6.575 | 3.476 | −40.236 |
| CNP0332171 | −6.129 | −57.993 | 34.256 | −7.908 | 4.302 | −32.754 | |
| CNP0415155 | −3.722 | −54.622 | 30.340 | −6.607 | 3.368 | −31.245 | |
| Pirtobrutinib | −20.240 | −64.578 | 53.830 | −7.248 | 4.084 | −34.152 | |
| JAK3 | CNP0266747 | −12.972 | −64.284 | 41.625 | −7.083 | 5.248 | −37.468 |
| CNP0332171 | −10.516 | −64.387 | 48.254 | −7.075 | 3.445 | −30.280 | |
| CNP0415155 | −1.905 | −49.585 | 23.801 | −6.073 | 2.483 | −31.280 | |
| Peficitinib | −5.918 | −45.560 | 24.507 | −5.379 | 2.362 | −30.021 |
| Positive Prediction | Negative Prediction | |
|---|---|---|
| True positive | True positive (TP) | False negative (FN) |
| True negative | False positive (FP) | True negative (TN) |
Disclaimer/Publisher’s Note: The statements, opinions and data contained in all publications are solely those of the individual author(s) and contributor(s) and not of MDPI and/or the editor(s). MDPI and/or the editor(s) disclaim responsibility for any injury to people or property resulting from any ideas, methods, instructions or products referred to in the content. |
© 2023 by the authors. Licensee MDPI, Basel, Switzerland. This article is an open access article distributed under the terms and conditions of the Creative Commons Attribution (CC BY) license (https://creativecommons.org/licenses/by/4.0/).
Share and Cite
Liu, L.; Na, R.; Yang, L.; Liu, J.; Tan, Y.; Zhao, X.; Huang, X.; Chen, X. A Workflow Combining Machine Learning with Molecular Simulations Uncovers Potential Dual-Target Inhibitors against BTK and JAK3. Molecules 2023, 28, 7140. https://doi.org/10.3390/molecules28207140
Liu L, Na R, Yang L, Liu J, Tan Y, Zhao X, Huang X, Chen X. A Workflow Combining Machine Learning with Molecular Simulations Uncovers Potential Dual-Target Inhibitors against BTK and JAK3. Molecules. 2023; 28(20):7140. https://doi.org/10.3390/molecules28207140
Chicago/Turabian StyleLiu, Lu, Risong Na, Lianjuan Yang, Jixiang Liu, Yingjia Tan, Xi Zhao, Xuri Huang, and Xuecheng Chen. 2023. "A Workflow Combining Machine Learning with Molecular Simulations Uncovers Potential Dual-Target Inhibitors against BTK and JAK3" Molecules 28, no. 20: 7140. https://doi.org/10.3390/molecules28207140
APA StyleLiu, L., Na, R., Yang, L., Liu, J., Tan, Y., Zhao, X., Huang, X., & Chen, X. (2023). A Workflow Combining Machine Learning with Molecular Simulations Uncovers Potential Dual-Target Inhibitors against BTK and JAK3. Molecules, 28(20), 7140. https://doi.org/10.3390/molecules28207140