Abstract
Addressing the growing need for methods for ecofriendly dye removal from aqueous media, this study explores the potential of rice husks coated with iron oxide (Fe2O3@RH composites) for efficient Acid Blue 25 decontamination. The adsorption potential of Acid Blue 25 is analyzed using raw rice husks and Fe2O3 nanoparticles in the literature, but their enhanced removal capacity by means of Fe2O3@RH composites is reported for the first time in this study. Fe2O3@RH composites were analyzed by using analytical techniques such as TGA, SEM, FTIR, BET, and the point of zero charge (pH(PZC)). The Acid Blue 25 adsorption experiment using Fe2O3@RH composites showed maximum adsorption at an initial concentration of Acid Blue 25 of 80 ppm, a contact time of 50 min, a temperature of 313 K, 0.25 g of Fe2O3@RH composites, and a pH of 2. The maximum percentage removal of Acid Blue 25 was found to be 91%. Various linear and nonlinear kinetic and isothermal models were used in this study to emphasize the importance and necessity of the adsorption process. Adsorption isotherms such as the Freundlich, Temkin, Langmuir, and Dubinin–Radushkevich (D–R) models were applied. The results showed that all the isotherms were best fitted on the data, except the linear form of the D–R isotherm. Adsorption kinetics such as the intraparticle kinetic model, the Elovich kinetic model, and the pseudo-first-order and pseudo-second-order models were applied. All the kinetic models were found to be best fitted on the data, except the PSO model (types II, III, and IV). Thermodynamic parameters such as ΔG° (KJ/mol), ΔH° (KJ/mol), and ΔS° (J/K*mol) were studied, and the reaction was found to be exothermic in nature with an increase in the entropy of the system, which supported the adsorption phenomenon. The current study contributes to a comprehensive understanding of the adsorption process and its underlying mechanisms through characterization, the optimization of the conditions, and the application of various models. The findings of the present study suggest practical applications of this method in wastewater treatment and environmental remediation.
1. Introduction
Nowadays, pollution is a major challenge and it is causing many problems for human health. In recent years, there has been a significant increase in global awareness of the environmental consequences of industrial pollution [1]. Due to globalization and urbanization, the standard of living has increased, but they have also taken human life to a dangerous edge [2]. The discharge of industrial waste from factories and industries is full of harmful and toxic chemicals, including heavy metals and, particularly, dyes that give water an unpleasant color and smell [3]. All these pollutants make water unfit for drinking and household use. This makes human survival difficult, as water is the most crucial element for life [4].
A major factor that contributes to water pollution is the textile industry, particularly in Pakistan, where the textile industry is one of the major contributors to the economy of the country. These dyes are mostly released into water bodies and land without treatment. Different sorts of dyes have different physical and chemical properties that affect water in different ways [5,6]. Dyes contain specific chemical structures that influence water chemically and physically [7]. The presence of different dyes also covers the upper surface of water, which makes the penetration of sunlight into the water quite difficult, and, as a result, the photosynthetic activity in the water decreases, which negatively impacts the aquatic ecosystem [8].
Aside from their toxicity, dyes have carcinogenic, mutagenic, and teratogenic effects on living organisms [9]. With the passage of time, they damage the genetic material of living organisms [10]. Azo dyes that contain amine groups are discharged into water bodies and they undergo chemical reduction and produce amine, which is reported to be carcinogenic in nature [11,12].
One of the more noticeable anthraquinonic dyes is Acid Blue 25, which causes skin and eye irritation and may also create respiratory problems. Thus, the decontamination of dyes is of major concern to environmental chemists [13]. Over the years, numerous methods have been developed for the removal of dyes, including precipitation, an evaporative method, electrolytic extraction, reverse osmosis, ion exchange, membrane process filtration, and chemical treatment. These methodologies look attractive at first sight for the removal of environmental pollutants, but in reality are incompatible for this purpose. These methods have a high operative cost, require skilled workers for their operation, and require a huge amount of chemicals during processing, which make these methods incompatible for this purpose. Furthermore, these methods produce huge amounts of sludge during processing, so another problem arises with respect to how to handle this sludge, which is waste in itself [14].
Adsorption is one of the most promising methods because it is easy to operate, ecofriendly, and cost-effective [15]. In this regard, scientists have used a variety of adsorbents to remove these dyes from aqueous media [16]. The adsorption method has gained the attention of researchers for the removal of organic and inorganic pollutants from aqueous media over the last couple of decades. Materials with easy availability and a low cost are preferred for this purpose. In this context, agrowastes are considered to be an important source of adsorption. The binding capacity of these materials can be intensified via physical and chemical treatments and heat therapy.
Rice husks are one of the major agrowaste products, containing 35% cellulose, 25% hemicelluloses, 20% lignin, and 17% ash by weight [17]. They are cost-effective, ecofriendly, and easily available adsorbents that are used for the removal of pollutants [18]. Modified rice husks were used as adsorbents for the removal of crystal violet dye [19].
The use of nanoparticles is also gaining interest in the field of adsorption and environmental protection. Nanoparticles possess a high surface area and bulk properties, which make them a suitable choice for the adsorption of dyes and metals. They easily undergo modification with various chemical groups, which increases their affinity toward target components. As compared to other sorbents, like clay minerals, chelating minerals, and natural zeolites, nanoparticles serve as excellent adsorbents because of their increased selectivity, affinity, and capacity. In addition to all these properties, the usage of nanoparticles for dye adsorption is cost-effective and an easy method for waste disposal with unique size and shape. Iron oxide (Fe2O3) nanoparticles were also used as an affordable and easily accessible adsorbent for the removal of dyes [20].
Keeping in view the adsorptive potential of nanoparticles and rice husk, an attempt was made to load magnetic Fe2O3 nanoparticles on the surface of rice husk to synthesize a new sorbent. This novel adsorbent was prepared by using iron oxide and rice husk for the removal of anionic acidic dye (Acid Blue 25). Composites of iron oxide were prepared and coated on the surface of finely ground rice husk to enhance the adsorptive power of these sorbents. Both adsorbents were cost-effective, safe, and easily available, which made this study effective and low-cost. Adsorption parameters such as dye concentration, time, amount of adsorbent, and pH were optimized. Adsorption kinetics and isotherms were applied for the evaluation of data. The maximum percent removal of Acid Blue 25 was found to be 91% with just 0.2 g of the composites. Synthesized composites of Fe2O3 loaded on rice husk have been shown to boost the potential for decontamination of aqueous media from harmful dyes and can be successfully applied on a large scale to remove these harmful pollutants from the environment.
The goal of the current work was to synthesize an adsorbent with enhanced adsorption potential by modifying raw rice husk through the loading of magnetic composites. Removal of Acid Blue 25 was achieved by employing this new approach with a small quantity of adsorbent, by developing electrostatic interaction between the dye molecule and synthesized adsorbent. Comprehensive characterization and application of various models make it more effective for scientific understanding of the adsorption process and its applicability for environmental challenges related to Acid Blue 25 decontamination.
2. Results and Discussion
2.1. Characterization of Fe2O3@RH Composites
2.1.1. FTIR
FTIR spectra of Acid Blue 25 and Fe2O3@RH composites (before and after adsorption) are shown in Figure 1. Acid Blue 25 gives characteristics peak at 1612 cm−1 due to carbonyl stretching of –COOH, and another intense peak at 3452 cm−1 appears for –N-H and –O-H stretching of bonds along with intramolecular hydrogen bonding.
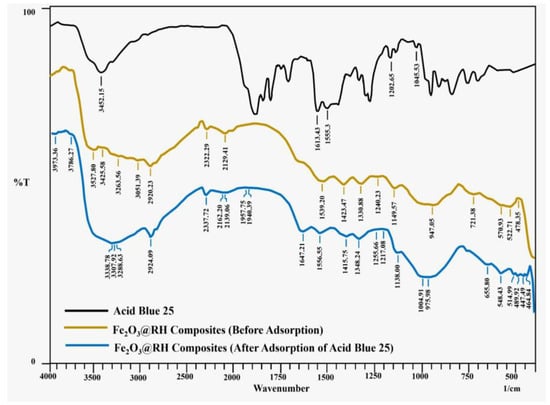
Figure 1.
FTIR spectra of Acid Blue 25 and Fe2O3@RH composites (before and after adsorption).
The curve before adsorption in Fe2O3@RH composites shows different peaks than after adsorption. A prominent range of peaks such as 3527, 3425, 3263, and 3051 cm−1 indicate the presence of the hydroxyl group. The peak at 2920 indicates the presence of -CH2 stretching vibrations. The peaks at 1539, 1423, 1330, and 1149 cm−1 indicate the presence of COO− asymmetric stretching, COO− symmetric stretching, C–H bending, and C–O–C stretching of glycosidic linkage, respectively. The range of peaks such as 570, 522, and 478 cm−1 indicate the presence of Fe–O bond in Iron (III) oxide.
The curve after adsorption shows various peaks. The peaks in the range of 3500–3200 indicate the presence of O–H and N–H stretching vibrations. The slight shift in this region indicates the adsorption of dye. Moreover, the peak at 2924 indicates methylene stretching vibrations. The peaks at 1556, 1415, 1348, and 1138 indicate the presence of COO− asymmetric stretching, COO− symmetric stretching, C–H bending, and C–O–C stretching of glycosidic linkage, respectively. The appearance of a new peak at 1004 indicates the presence of symmetric stretching of the SO3H group present in the dye.
2.1.2. SEM
SEM images of the composites are shown in Figure 2, with the large surface area which is responsible for the adsorption of dye on it. It shows the circular or oval shape of the composites. Some pores are also present on it. The presence of a functional group on the composite is responsible for the adsorption of dye on it. The large surface area and presence of cavities on the surface of the adsorbent make it an appropriate surface to attach Acid Blue 25.
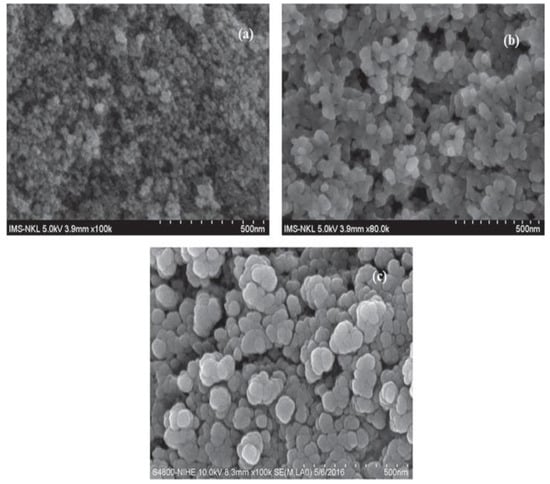
Figure 2.
SEM of Fe2O3@RH composites at 500 nm resolution (taken at three different angles, (a) (3.9 mm × 100), (b) (3.9 mm × 80 and (c) (8.3 mm × 100).
2.1.3. pH(PZC)
Point of zero charge bears an important place in adsorption study as pH is one of the governing factors for the adsorption of dye on the surface of the composites. During adsorption, electrostatic forces play an important role for adsorbing dye along with other interactive methods. In instances where the pH of an aqueous solution falls below the point of zero charge (PZC) [pH < pH(PZC)], the surface of the Fe2O3@RH composites adopts a positive charge. In scenarios where the pH of the aqueous solution corresponds to the point of zero charge (PZC) [pH = pH(PZC)], the surface of the Fe2O3@RH composites maintains an electrically neutral state. Conversely, when the pH of the aqueous solution surpasses the point of zero charge (PZC) [pH > pH(PZC)], the surface of the Fe2O3@RH composites attains a negative charge. Acid Blue 25 bears negative charge in solution, so it needs a positive surface for attachment. In this regard, dye adsorption is favorable at low pH value where composites carry positive charge on the surface (Figure 3).
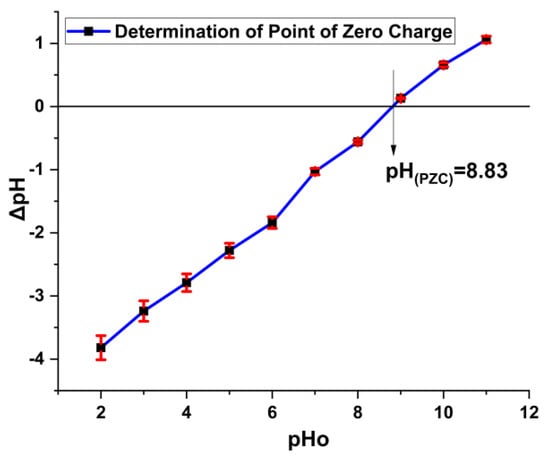
Figure 3.
pH(PZC) determination of Fe2O3@RH composites (before adsorption).
2.1.4. Brunauer–Emmett–Teller (BET)
The Brunauer–Emmett–Teller (BET) analysis elucidates the surface area of the Fe2O3@RH composites, revealing a surface measurement of 107.18 m²/g. In this regard, different methods are available for the determination of adsorbent area and porosity for the adsorption purpose. An empirical method used in this regard is the HK method, which requires the gas pressure and volume of the gas adsorbed to measure the surface of the adsorbent. Results of HK methods show a significant pore diameter of 0.432 nm available for the attachment of Acid Blue 25 on the surface of the adsorbent (Table 1).

Table 1.
BET results with surface area, pore volume, and diameter.
Similarly, the SF method, which is considered suitable for solid materials, was also used to determine the surface properties of the adsorbent. Parameters calculated by this method were also found to be in good agreement with the HK method. The porosity of the adsorbent as determined by these two methods is an indicator of small surface pores available on the surface of the Fe2O3@RH composites.
The N2 adsorption–desorption isotherm exhibited characteristics consistent with Type IV, featuring a hysteresis loop labeled as H3, as given in Figure 4. This observation serves as an indicative marker of the coexistence of iron oxide with rice husk within the composite material. Pore size and pore volume, as indicated in Table 1, make the adsorbent favorable for the adsorption of dye.
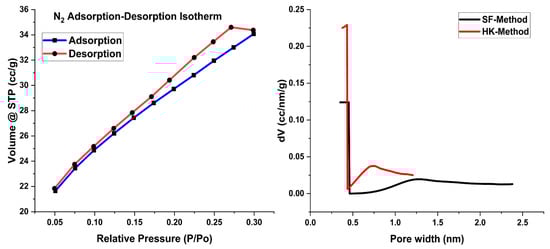
Figure 4.
BET plots with nitrogen adsorption–desorption isotherms and pore size distribution curves.
2.1.5. Thermogravimetric Analysis (TGA)
Thermogravimetric analysis of the raw rice husk, Fe2O3 nanoparticles, and Fe2O3@RH composites was performed to observe the behavior of these compounds towards variable heating rates. As shown in Figure 5, raw rice husk shows gradual weight loss from room temperature to 150 °C due to the moisture content and volatile content present in it. Major weight loss occurs at 210 °C, which can be attributed to major pyrolysis of rice husk, which results in main weight loss. For Fe2O3 nanoparticles, a slight change in weight is observed initially due to moisture content. Major changes in weight occur at 505 °C due to phase transition in synthetic nanomaterials. Fe2O3 changes to FeO above 500 °C in the second step of the thermogravimetric curve. In the case of Fe2O3@RH composites, the TGA curve shows weight loss due to moisture contents present in it at 106 °C. Major weight loss occurs at 360 °C due to decomposition of the composites. Due to the loading of Fe2O3 nanoparticles, the pyrolysis path of the rice husk changes and shifts to high temperature. At this stage, composites break down into their components, and pyrolysis of rice husk takes place [21,22].
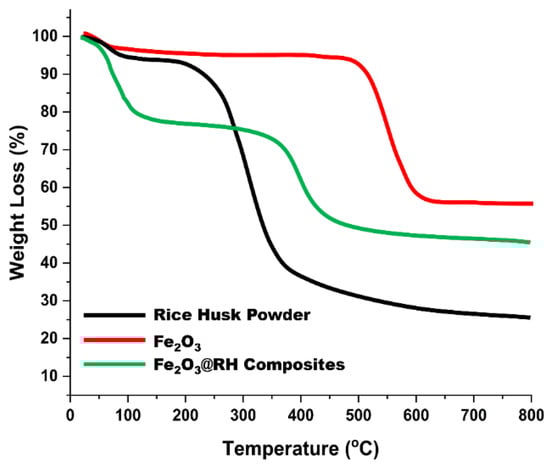
Figure 5.
TGA of raw rice husk, Fe2O3, and Fe2O3@RH composites.
2.2. Adsorption Parameters
An adsorption experiment was performed at variable initial concentration, contact time, temperature, pH, and amount of adsorbent, as shown in Figure 6.
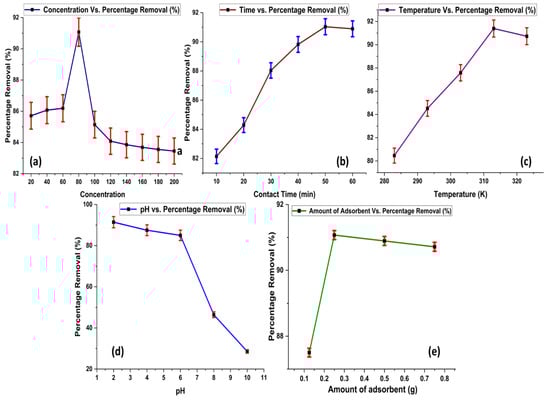
Figure 6.
Effect of adsorption parameters on % adsorption of Acid Blue 25, (a) Initial Concentration (b) Contact Time (c) Temperature (d) pH and (e) Amount of Adsorbent.
2.2.1. Effect of Initial Concentration of Acid Blue 25
The effective removal of Acid Blue 25 increases as the dye concentration rises. The highest removal rate was observed at a dye concentration of 80 ppm, as shown in Figure 6a. However, beyond this point, increasing the dye concentration does not lead to further increase in adsorption. This suggests that the adsorbent becomes saturated at a dye concentration of 80 ppm. Further increase in concentration of dye have no major effect on adsorption rate. A significant number of vacant positions is available on the surface of the adsorbent, but as dye concentration increases, these positions are captured by molecules of dye. Thus, at concentrations higher than 80 ppm, no promising effect is observed in term of dye adsorption. A similar trend is also observed in the reported data for the removal of Acid Blue 25 [23].
2.2.2. Effect of Contact Time
The adsorption of Acid Blue 25 becomes more pronounced as the duration of contact time between the adsorbent and the dye increases (Figure 6b). The optimal removal of the dye is observed at a contact time of 50 min. However, extending the contact time beyond this duration does not result in any further increase in dye adsorption. This indicates that the maximum adsorption efficiency is achieved at 50 min of contact time. As equilibrium is achieved at this time interval, further prolongation of time gives no profit in terms of adsorption.
2.2.3. Effect of Temperature
Temperature also plays an important role in adsorption studies. As the temperature rises, the percentage removal of Acid Blue 25 also increases. The optimum removal of the dye is achieved at 313 K. As temperature increases, entropy of the adsorption system also increases, which leads to a rise in the adsorption rate. However, raising the temperature beyond this point no longer results in further enhancement of dye adsorption, as depicted in Figure 6c.
2.2.4. Effect of pH
The highest removal of Acid Blue 25 occurs at a pH of 2, as obtained from experimental results given in Figure 6d. This indicates that the adsorbent’s surface and the dye molecules interact most effectively when the solution is acidic. As the pH increases, the surface charges of both the adsorbent and the dye molecules change. As supported by zeta potential, adsorbent surfaces bear positive charge below PZC value, so negatively charged dye molecules give effective removal at pH values below the PZC by develops attractive forces with dye. However, when pH is increased, a decrease in adsorption occurs due to a change in charge on the surface of the adsorbent, which leads to weaker interactions, causing a decrease in the removal efficiency of the dye. Data available in the literature also support the experimental findings of the present study [24].
2.2.5. Effect of Amount of Adsorbent
By increasing the amount of adsorbent, the removal efficiency of the dye increases, but the maximum efficiency is attained at 0.25 g. Further increasing the amount of the adsorbent does not increase the removal efficiency of the dye, as the maximum amount of the dye is removed at 0.25 g, and increasing the amount will not have any effect on the removal efficiency. This major change in adsorption occurs as dye molecules obtain more surface to attach with active sites. However, once a significant amount of dye removal is achieved, then the amount of adsorbent will not have a promising effect on the process of adsorption, as revealed in Figure 6e.
2.3. Thermodynamics
Experimental data were collected at various temperatures (ranging from 283 K to 323 K) to assess the influence of temperature on the adsorption process. The thermodynamic property can be described using the subsequent equation:
The symbols used in the equation represent the following: ΔS° stands for the alteration in entropy, ΔH° signifies the alteration in enthalpy, R denotes the universal gas constant, with a value of 8.314 Jmol−1K−1, T represents the absolute temperature, measured in kelvin (K), and Kd denotes the distribution coefficient, which is expressed through the subsequent equation:
Furthermore, the alteration in Gibbs free energy (ΔG°) can be determined through the application of the subsequent equation:
ΔG°, ΔH°, and ΔS° are computed based on the intercept and slope (Figure S1) obtained from the plot correlating to 1/T and lnKd [23]. Equations used for the calculation of different thermodynamic parameters are given in Table S1.
Thermodynamic parameters calculated for Acid Blue 25 are given in Table 2. Results indicate a negative value of Gibbs free energy (ΔG°) with increase in temperature. A negative value of Gibbs free energy is due to spontaneous nature of adsorption reaction. The value of Gibbs free energy increases as temperature is decreased; this reveals that adsorption is more favorable at high temperature ranges. A similarly positive outcome of enthalpy and entropy for the reaction is an indicator of an exothermic reaction nature and an increase in randomness during the adsorption process, respectively. As dye molecules attach to the surface of the adsorbent, there is an increase in randomness at the solid/solution interface which leads to an increase in entropy (ΔS°), and similar behavior has been observed by other researchers for dye adsorption. As the temperature is increased during adsorption, the movement of molecules also increases. This leads to the attachment of dye molecules on the surface of active sites [25]. Furthermore, it is also reported in the literature that the temperature has a positive effect on the adsorption process by increasing the area of the adsorbent. Pore volume increases and the probability of dye molecules to attach with the surface of the adsorbent also increases [26].
Table 2.
Thermodynamics results for Acid Blue 25.
2.4. Adsorption Isotherms
Equilibrium data of adsorption are used to check the design and operation of sorption processes. They also predict the performance of the sorption contact processes under a range of operating conditions. Large numbers of adsorption isotherms are available in this regard; however, few are found to be quite suitable for the purpose, i.e., Langmuir and Freundlich. In the present study, we applied Langmuir, Freundlich, and Dubinin–Radushkevich isotherms to our work. The adsorption isotherms applied to our work are given in Table S2.
Results indicate a high R2 value of 0.9 for all adsorption isotherms except the linear form of D–R isotherm, which gives 0.8 R2 for the adsorption of Acid Blue 25, as indicated in Table 3.
Table 3.
Linear and nonlinear parameters calculated for adsorption isotherms.
The Freundlich isotherm assumes multilayer adsorption mechanism for the adsorption. KF and 1/n are Freundlich constants showing adsorption capacity and adsorption intensity, respectively. Adsorption is considered favorable if the value of KF is between 1 and 20. Similarly, a low value of 1/n is an indicator of a heterogeneous surface suitable for adsorption purpose. Results obtained for the present study show efficient adsorption based on Freundlich constants (Figure 7). Values of KF and 1/n also depict a favorable adsorption of Acid Blue 25 on the adsorbent.
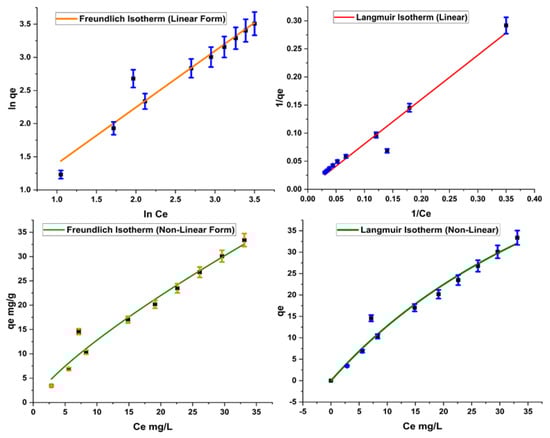
Figure 7.
Linear and nonlinear forms of Freundlich and Langmuir isotherms.
On the other hand, Langmuir is based on the assumption of the unilayer adsorption phenomenon. The constants in Langmuir, qm and RL, give maximum monolayer adsorption capacity and Langmuir affinity parameter, respectively. A high value of qm represents maximum adsorption, and adsorption is considered favorable if RL value is low. Results of the Langmuir isotherm, as given in Table 3, indicate that the reaction is promising for adsorption.
As far as the D–R model is concerned, it is used to determine the nature of the adsorption reaction. The D–R model provides information on whether the adsorption reaction is physical, chemical, or ion exchange in nature. The value of E is calculated for this model; an E value less than 8 kJ/mol indicates the physical nature of adsorption, and E = 8 to 16 kJ/mol is an indicator of the ion exchange mechanism. If the E value is found to be higher than 16 kJ/mol, then the adsorption process is chemisorption in nature. The current study gives a significantly high value of E, which is a sign of the chemical nature of the adsorption of dye on the surface of the adsorbent.
The Temkin isotherm is based on the assumption that the heat of the reaction changes during the adsorption phenomenon (Figure 8). The Temkin constant KT contributes information about binding energy in the adsorption process, and the constant BT provides information about the heat of adsorption [27]. Results indicate that BT > 0, which expresses the exothermic nature of the adsorption process, as given in Table 3.
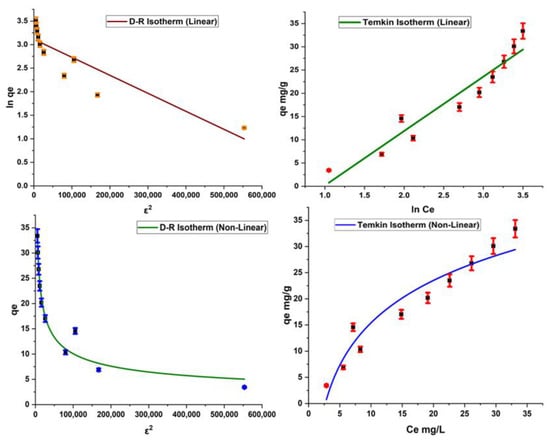
Figure 8.
Linear and nonlinear forms of Dubnin and Temkin isotherms.
2.5. Adsorption Kinetics
The time required for a particular adsorption process and the uptake level of the adsorption phenomenon are described by adsorption kinetics. Several kinetic models are available in this regard, as given in Table S3.
Figure 9 indicates different forms of kinetic models based on the abovementioned equations. R2 value was calculated for each kinetic model, and a value close to 1 is an indicator of model applicability for the adsorption system.
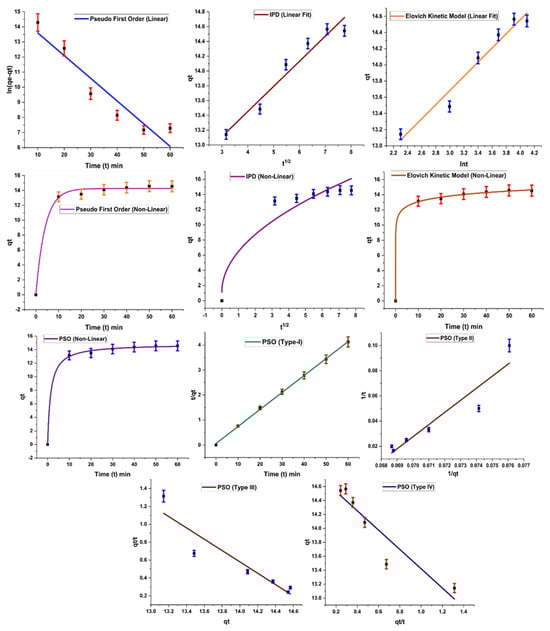
Figure 9.
Kinetic studies applied on the adsorption of Acid Blue 2.
Results of kinetic models are summarized in Table 4, which indicates the successful application of the pseudo-first-order kinetic model on the experimental results, with a high R2 value (0.9 for linear and 0.99 for nonlinear form). According to the pseudo-first-order kinetic model, rate of adsorption is related to adsorption sites freely available on the surface of the adsorbent. As these sites become occupied, the adsorption rate also falls. A similar trend is observed in the present study: adsorption increases with the increase in contact time initially, but after maximum adsorption, no significant role is played in terms of adsorption rate by increasing time. A similar trend is also reported in the literature by other researchers [25].
Table 4.
Kinetics results applied on the adsorption of Acid Blue 25.
In the case of the pseudo-second-order kinetic model, only type I gives a good result, with R2 close to 1; other types have low values for R2. This model is based on the assumption that the rate-limiting step is the adsorption phenomenon, which is responsible for attractive forces developing between the adsorbent and dye molecules [28]. The Elovich kinetic model is based on the theory that the rate of adsorption of dye decreases exponentially as the amount of dye adsorbed increases. It also provides information about the nature of the adsorption process. This model was also applied successfully on the work, indicating chemisorption behavior of the adsorbent.
Kinetic data were also subjected to the intraparticle diffusion kinetic model suggested by Weber and Morris. A high value of regression coefficient (R2 = 0.94) was obtained for the model, with value of adsorption capacity, C, showing significant adsorption of the dye. However, the plot of the diffusion model shows that the line is not passing through the origin, which is an indicator of the fact that the intraparticle diffusion kinetic model is not the only rate-governing step for the adsorption reaction [29].
2.6. Desorption/Regeneration of Fe2O3@RH Composites
Solid waste generated after the adsorption process is another serious threat to the environment. Its proper disposal is quite difficult as it carries harmful dyes on it. In this regard, different efforts are made by scientists to regenerate adsorbent and make it less harmful to the environment [30,31]. In the present work, after the adsorption phenomenon, the adsorbent was regenerated by treating it with ethanol for 1 h. Dye was desorbed, and after filtration and drying, adsorbent was again applied for the removal of dye. Initially, composites showed 91% dye removal efficiency. After four regeneration cycles, adsorption efficiency gradually decreased to 74.5%, as shown in Figure 10. Synthetic composites were found to be quite stable and efficient after several reuses. This property of composites makes them an excellent choice for water decontamination.
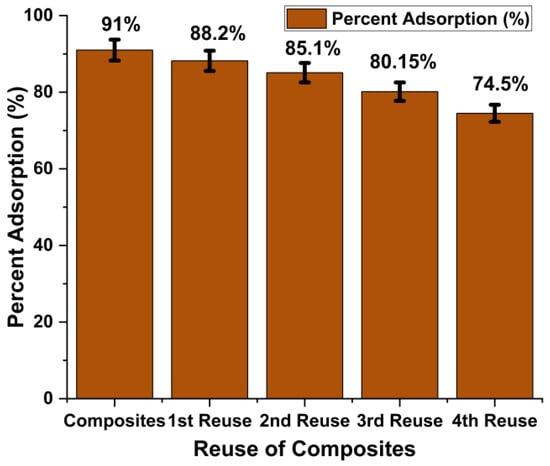
Figure 10.
Regeneration of the Fe2O3@RH composites for dye removal.
2.7. Adsorption Mechanism
The concept of the point of zero charge elucidates the positive charge present on the surface of the adsorbent, shedding light on the underlying mechanism of adsorption. The determined point of zero charge, calculated to be 8.83, signifies a neutral charge state on the adsorbent’s surface at this pH. However, when the pH falls below this point, the adsorbent’s surface becomes positively charged; conversely, if the pH exceeds the point of zero charge, the surface of the adsorbent takes on a negative charge. As a result, the optimal adsorption of Acid Blue 25 is observed at a pH of 2, indicative of an acidic medium. With an increase in pH beyond this point, the adsorption of Acid Blue 25 diminishes. This phenomenon can be attributed to the reduction in positive charge on the adsorbent’s surface as the pH rises (Figure 11). The adsorption mechanism is largely governed by electrostatic forces of attraction between the dye molecules and the charged adsorbent surface, and this interplay comprehensively elucidates the intricate process of adsorption.
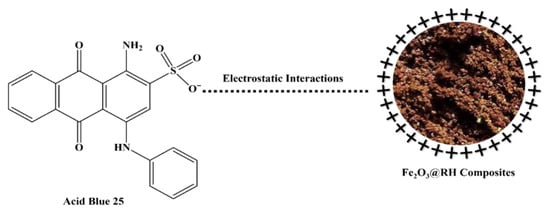
Figure 11.
Adsorption mechanism of Fe2O3@RH composites.
2.8. Comparison of Present Study with Reported Data
To evaluate the adsorption potential of synthetic adsorbents for the removal of Acid Blue 25, a comparison was made with reported data, as given in Table 5. Raw rice husk gives 80 to 90% removal of Acid Blue 25 with 2 g of adsorbent added, by increasing time interval up to 2 h. Similarly, Fe2O3 gives 75.7% dye removal if the amount of adsorbent added is 1 g. In comparison with these adsorbents, currently synthesized Fe2O3@RH composites give 91% adsorption potential with just 0.2 g of the adsorbent. A small amount of adsorbent providing efficient removal of Acid Blue 25 dye makes it an excellent choice for dye remediation for polluted water. Other data reported for the removal of Acid Blue 25 by employing diatomite show 72.81% removal efficiency with 0.9 g of the adsorbent material utilized.
Table 5.
Comparison of Fe2O3@RH composites adsorption with reported data.
3. Materials and Methods
3.1. Materials and Equipment
All chemicals used for the research work were of analytical grade with high purity. A list of chemicals and equipment utilized for the current study is given in Table S4. Rice husk was obtained from the Sargodha Rice Mill, Pakistan.
3.2. Methods
3.2.1. Preparation of Rice Husk
The obtained rice husk was washed 4–5 times with Millipore water to completely remove dust and impurities, and then it was dried for two days. After drying, the dried rice husk was crushed and ground into fine powder by using a pestle and mortar and passed through sieves to obtain a finely divided powder of rice husk.
3.2.2. Synthesis of Fe2O3@RH Composites
For the synthesis of Fe2O3@RH composites, 6 g of NaOH was dissolved in 100 mL of water and added to 10 g of finely divided powder of rice husk in a 250 mL beaker. In another flask, 8.11 g FeCl3.6H2O was dissolved in 100 mL of water, and the solution was heated to 70 °C to make it hot. The mixture of rice husk and NaOH was heated at 70 °C followed by the slow addition of a hot solution of FeCl3.6H2O. The slurry was mixed by constant stirring and aerated for 1 h until a brown–yellow color solution appeared. The product was dried in a drying oven at 70 °C for 12 h. The dried product was washed with water to remove excess NaOH, and a pure product was obtained. This final product was dried again for 2 days to remove the moisture. The final product obtained was pure Fe2O3@RH composites (Figure 12).
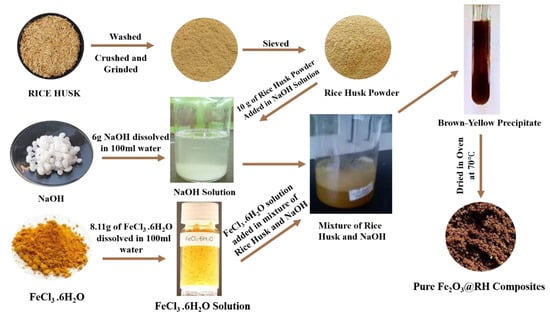
Figure 12.
Preparation of Fe2O3@RH composites.
3.3. Batch Experiment
A 1000 ppm stock solution of Acid Blue 25 dye was formulated by dissolving 1 g of the dye in a 1000 mL round-bottom flask, which was then adjusted to the mark. Following this, a series of Acid Blue 25 solutions with concentrations of 20, 40, 60, 80, 100, 120, 140, 160, 180, and 200 ppm were prepared from the stock solution. These solutions were employed in the subsequent adsorption experiments.
The adsorption investigations for Acid Blue 25 were performed using 100 mL Erlenmeyer flasks, where each flask accommodated 50 mL of the dye solution. The optimization of Acid Blue 25 dye removal was attained by varying adsorption parameters, including pH levels (ranging from 2 to 8), amount of Fe2O3@RH composite (ranging from 0.125 to 0.75 g), initial concentration of Acid Blue 25 (ranging from 20 to 200 ppm), and contact time (ranging from 20 to 60 min).
During each experimental trial, the solution underwent agitation using an orbital shaker (SHIN SAENG, Model No. SKIR-601L) at a consistent speed of 150 rpm. Subsequently, the residual concentration of Acid Blue 25 was quantified by means of a UV/visible spectrophotometer (Peak Instruments Model No. C-7200, Peak Instruments (Shanghai) Co., Ltd. China) at the wavelength of maximum absorption (λmax) at 600 nm. Each experiment was repeated three times to obtain the mean value. All obtained experimental data were meticulously charted and subjected to analysis using Origin Pro 2022 (Version Number 225 (9.9.0.225)). The assessment of adsorption efficiency (expressed as R (%)) was conducted through the utilization of the subsequent equation [35,36]:
The adsorption capacity (qe, mg/g) of Acid Blue 25, which signifies the quantity of Acid Blue 25 adsorbed upon reaching equilibrium, was evaluated by using the subsequent equation: [37,38]:
The variable qt signifies the adsorption capacity of Acid Blue 25 at a specific time (t) and is measured in milligrams per gram (mg/g). The parameter C0 corresponds to the concentration of Acid Blue 25 at the initial time (t = 0), measured in milligrams per liter (mg/L). Ce represents the concentration of Acid Blue 25 at the designated time (t) and is expressed in milligrams per liter (mg/L). The symbol V pertains to the volume of the solution in liters (L), and m denotes the mass of the Fe2O3@RH composite sorbent, quantified in grams (g).
The adsorption data pertaining to Acid Blue 25 dye were subjected to modeling using diverse adsorption isotherms, which encompassed the Freundlich, Langmuir, Temkin, and Dubinin–Radushkevich models. In the kinetic experiments, the initial concentration of Acid Blue 25 was set at 80 ppm, while the experimental volume equaled 50 mL. The Fe2O3@RH composite mass employed amounted to 25 mg.
Throughout the course of the kinetic experiments, 5 mL of the suspension was extracted at predefined time intervals and subjected to agitation using an orbital shaker. This methodology facilitated the determination of the residual concentration of Acid Blue 25 within the solution. The subsequent equation was employed to compute the amount of Acid Blue 25 adsorbed (qt, mg/g) at a specific time (t) [39].
The experimental dataset underwent analysis through the utilization of four kinetic models: the pseudo-first-order model, the intraparticle diffusion model, the Elovich kinetic model, and the pseudo-second-order model. These models were employed to characterize and comprehend the adsorption kinetics of Acid Blue 25 dye within the scope of the study.
3.4. Point of Zero Charge (pHPZC)
The point of zero charge (PZC) of the Fe2O3@RH composites was determined through the utilization of the salt addition method. This method involved establishing a relationship between pH and surface potential over an extensive pH range (from 2 to 11). To execute the experiment, a 0.1 M solution of NaNO3 was carefully prepared in a 500 mL flask. Subsequently, 50 mL of this solution was transferred to ten distinct flasks. In each flask, the initial pH values (ranging from 2 to 11) were precisely adjusted using 0.1 M HCl and 0.1 M NaOH solutions. Following this, accurately measured quantities (0.25 g each) of the Fe2O3@RH composites were introduced into the flasks containing solutions with varying pH levels. These solutions were subjected to thorough agitation on an orbital shaker for approximately 24 h while maintaining a controlled temperature of 30 °C. After the agitation period, the solutions were filtered, and the final pH values were determined using a pH meter. The alteration in pH before and after the experiment was computed using the subsequent equation:
In this context, “pH” denotes the final pH value, while “pHo” represents the initial pH value. The juncture where these two values coincide on the x-axis marks the point of intersection, which indicates the point of zero charge (PZC) for the Fe2O3@RH composites [40,41].
4. Conclusions
The phenomenon of adsorption emerges as a remarkable solution for effectively removing hazardous substances, including dyes, from aqueous environments. This study highlights the utilization of rice husk coated with iron oxide (Fe2O3@RH composites) as a highly favorable choice in addressing the removal of toxic Acid Blue 25 dye. Characterization of the composites provides information about important functional groups present on the surface of the adsorbent which help to develop electrostatic interaction between Acid Blue 25 and synthesized composites. Overall results demonstrated that although raw rice husk and Fe2O3 nanoparticles are separately used for the removal of Acid Blue 25, their removal efficiency was low compared with the current work. A small amount of synthetic composites (0.2 g) was found to be effective for the significant concentration of dye removal (91%) in just 50 min of contact time. Feasibility of the adsorption process and its mode of adsorption was also depicted by adsorption isotherms and thermodynamic models applied successfully to the work. The present work gives an insight into Acid Blue 25 remediation from wastewater with inexpensive adsorbent and promising potential of adsorption.
Supplementary Materials
The following supporting information can be downloaded at: https://www.mdpi.com/article/10.3390/molecules28207124/s1. Table S1. Equations used for Calculation of Thermodynamic Parameters; Table S2. Isothermal Models and Equations Applied on Adsorption of Acid Blue 25; Table S3. Kinetic Models Applied on Adsorption of Acid Blue 25; Table S4. Chemicals and Equipment used for the Work; Figure S1. Thermodynamics for Acid Blue 25. Refs. [42,43,44,45,46,47,48,49,50] are cited in the Supplementary Materials.
Author Contributions
Conceptualization and supervision, F.B.; writing original draft, S.K.; investigations, H.K.; methodology, S.N.; data curation, M.S.H.; validation, M.M.; editing, G.S.; statistical analysis, H.K.N.; data analysis and editing, J.Z.; resources and project administration, A.-R.Z.G. All authors have read and agreed to the published version of the manuscript.
Funding
This work was funded by the Researchers Supporting Project number (RSPD2023R686), King Saud University, Riyadh, Saudi Arabia.
Institutional Review Board Statement
Not applicable.
Informed Consent Statement
Not applicable.
Data Availability Statement
Supplementary data is provided.
Acknowledgments
The authors extend their appreciation to the Researchers Supporting Project number RSPD2023R686, King Saud University, Riyadh, Saudi Arabia.
Conflicts of Interest
The authors declare no conflict of interest.
Sample Availability
Not applicable.
References
- Gill, A.R.; Viswanathan, K.K.; Hassan, S.J.R. The Environmental Kuznets Curve (EKC) and the environmental problem of the day. Renew. Sustain. Energy Rev. 2018, 81, 1636–1642. [Google Scholar] [CrossRef]
- Botkin, D.B.; Keller, E.A. Environmental Science: Earth as a Living Planet; John Wiley & Sons Ltd.: Hoboken, NJ, USA, 1998. [Google Scholar]
- Singh, R.L.; Singh, R.P.; Gupta, R.; Singh, R. Advances in Biological Treatment of Industrial Waste Water and Their Recycling for a Sustainable Future; Springer: Berlin/Heidelberg, Germany, 2019. [Google Scholar]
- Gong, R.; Li, M.; Yang, C.; Sun, Y.; Chen, J. Removal of cationic dyes from aqueous solution by adsorption on peanut hull. J. Hazard. Mater. 2005, 121, 247–250. [Google Scholar] [CrossRef]
- Kanwal, S.; Irfan, A.; Al-Hussain, S.A.; Sharif, G.; Mumtaz, A.; Batool, F.; Zaki, M.E.A. Fabrication of Composites of Sodium Alginate with Guar Gum and Iron Coated Activated Alumina for the Purification of Water from Direct Blue 86. Coatings 2023, 13, 103. [Google Scholar] [CrossRef]
- Kant, R. Textile dyeing industry an environmental hazard. Nat. Sci. 2012, 4, 17027. [Google Scholar] [CrossRef]
- Weldegebrieal, G.K. Synthesis method, antibacterial and photocatalytic activity of ZnO nanoparticles for azo dyes in wastewater treatment: A review. Inorg. Chem. Commun. 2020, 120, 108140. [Google Scholar] [CrossRef]
- Doble, M.; Kumar, A. Biotreatment of Industrial Effluents; Elsevier: Amsterdam, The Netherlands, 2005. [Google Scholar]
- Padhi, B.S. Pollution due to synthetic dyes toxicity & carcinogenicity studies and remediation. Int. J. Environ. Sci. 2012, 3, 940–955. [Google Scholar]
- Lellis, B.; Fávaro-Polonio, C.Z.; Pamphile, J.A.; Polonio, J.C. Innovation, Effects of textile dyes on health and the environment and bioremediation potential of living organisms. BIORI 2019, 3, 275–290. [Google Scholar] [CrossRef]
- Chequer, F.M.D.; Dorta, D.J.; de Oliveira, D.P. Azo dyes and their metabolites: Does the discharge of the azo dye into water bodies represent human and ecological risks. Adv. Treat. Text. Effl. 2011, 48, 28–48. [Google Scholar]
- Pinheiro, H.M.; Touraud, E.; Thomas, O. Aromatic amines from azo dye reduction: Status review with emphasis on direct UV spectrophotometric detection in textile industry wastewaters. Dye. Pigment. 2004, 61, 121–139. [Google Scholar] [CrossRef]
- Chakrabortty, D.; Gupta, S.S. Photo-catalytic decolourisation of toxic dye with N-doped Titania: A case study with Acid Blue 25. J. Environ. Sci. 2013, 25, 1034–1043. [Google Scholar] [CrossRef]
- Kurniawan, T.A.; Chan, G.Y.; Lo, W.H.; Babel, S. Physico–chemical treatment techniques for wastewater laden with heavy metals. J. Chem. Eng. 2006, 118, 83–98. [Google Scholar] [CrossRef]
- Gupta, V.K.; Kumar, R.; Nayak, A.; Saleh, T.A.; Barakat, M.J.A. Adsorptive removal of dyes from aqueous solution onto carbon nanotubes: A review. Adv. Colloid Interface Sci. 2013, 193, 24–34. [Google Scholar] [CrossRef]
- Paredes-Quevedo, L.C.; Castellanos, N.J.; Carriazo, J.G. Influence of Porosity and Surface Area of a Modified Kaolinite on the Adsorption of Basic Red 46 (BR-46). Water Air Soil Pollut. 2021, 232, 509. [Google Scholar] [CrossRef]
- Premalal, H.G.; Ismail, H.; Baharin, A.J.P.T. Comparison of the mechanical properties of rice husk powder filled polypropylene composites with talc filled polypropylene composites. Polym. Test. 2002, 21, 833–839. [Google Scholar] [CrossRef]
- Okoro, H.K.; Alao, S.M.; Pandey, S.; Jimoh, I.; Basheeru, K.A.; Caliphs, Z.; Ngila, J.C. Recent potential application of rice husk as an eco-friendly adsorbent for removal of heavy metals. Appl. Water Sci. 2022, 12, 259. [Google Scholar] [CrossRef]
- Homagai, P.L.; Poudel, R.; Poudel, S.; Bhattarai, A. Adsorption and removal of crystal violet dye from aqueous solution by modified rice husk. Heliyon 2022, 8, e09261. [Google Scholar] [CrossRef] [PubMed]
- Zhang, H.; Luan, Q.; Tang, H.; Huang, F.; Zheng, M.; Deng, Q.; Xiang, X.; Yang, C.; Shi, J.; Zheng, C.; et al. Removal of methyl orange from aqueous solutions by adsorption on cellulose hydrogel assisted with Fe2O3 nanoparticles. Cellulose 2017, 24, 903–914. [Google Scholar] [CrossRef]
- Lassoued, A.; Lassoued, M.S.; Dkhil, B.; Ammar, S.; Gadri, A. Synthesis, photoluminescence and Magnetic properties of iron oxide (α-Fe2O3) nanoparticles through precipitation or hydrothermal methods. Phys. E Low-Dimens. Syst. Nanostruct. 2018, 101, 212–219. [Google Scholar] [CrossRef]
- El-Sayed, S. Thermal decomposition, kinetics and combustion parameters determination for two different sizes of rice husk using TGA. Eng. Agric. Environ. Food 2019, 12, 460–469. [Google Scholar] [CrossRef]
- Wang, P.; Cao, M.; Wang, C.; Ao, Y.; Hou, J.; Qian, J. Kinetics and thermodynamics of adsorption of methylene blue by a magnetic graphene-carbon nanotube composite. Appl. Surf. Sci. 2014, 290, 116–124. [Google Scholar] [CrossRef]
- Foo, K.Y.; Hameed, B. An overview of dyes removal via activated carbon adsorption process. Desalin. Water Treat. 2011, 19, 255–274. [Google Scholar] [CrossRef]
- Hanafiah, M.A.K.M.; Ngah, W.S.W.; Zolkafly, S.H.; Teong, L.C.; Majid, Z.A.A. Acid Blue 25 adsorption on base treated Shorea dasyphylla sawdust: Kinetic, isotherm, thermodynamic and spectroscopic analysis. J. Environ. Sci. 2012, 24, 261–268. [Google Scholar] [CrossRef]
- Mangun, C.L.; Benak, K.R.; Daley, M.A.; Economy, J. Oxidation of activated carbon fibers: Effect on pore size, surface chemistry, and adsorption properties. Chem. Mater. 1999, 11, 3476–3483. [Google Scholar] [CrossRef]
- Isiuku, B.O.; Okonkwo, P.C.; Emeagwara, C.D. Batch adsorption isotherm models applied in single and multicomponent adsorption systems–a review. J. Dispers. Sci. 2021, 42, 1879–1897. [Google Scholar] [CrossRef]
- Ho, Y.S.; McKay, G. A comparison of chemisorption kinetic models applied to pollutant removal on various sorbents. Process Saf. Environ. Prot. 1998, 76, 332–340. [Google Scholar] [CrossRef]
- Nworie, F.S.; Nwabue, F.I.; Oti, W.; Mbam, E.; Nwali, B.U. Removal of methylene blue from aqueous solution using activated rice husk biochar: Adsorption isotherms, kinetics and error analysis. J. Chil. Chem. Soc. 2019, 64, 4365–4376. [Google Scholar] [CrossRef]
- Patel, H. Review on solvent desorption study from exhausted adsorbent. J. Saudi Chem. Soc. 2021, 25, 101302. [Google Scholar] [CrossRef]
- Rápó, E.; Tonk, S. Factors Affecting Synthetic Dye Adsorption; Desorption Studies: A Review of Results from the Last Five Years (2017–2021). Molecules 2021, 26, 5419. [Google Scholar] [CrossRef]
- Saroj, S.; Singh, S.V.; Mohan, D. Removal of Colour (Direct Blue 199) from Carpet Industry Wastewater Using Different Biosorbents (Maize Cob, Citrus Peel and Rice Husk). Arab. J. Sci. Eng. 2015, 40, 1553–1564. [Google Scholar] [CrossRef]
- El-Feky, H.H.; El-Sayed, G.O.; Shalabi, R.R. Removal of Acid Blue 342 from Aqueous Solution by Fe2O3/Fe3O4 Magnetic Nanocomposite. J. Appl. Sci. 2021, 6, 107–118. [Google Scholar] [CrossRef]
- Badii, K.; Ardejani, F.D.; Saberi, M.A.; Limaee, N.Y. Adsorption of Acid blue 25 dye on diatomite in aqueous solutions. Indian J. Chem. Technol. 2010, 17, 7–16. [Google Scholar]
- Wang, J.; Kou, L.; Huang, Z.; Zhao, L. One-pot preparation of MnO x impregnated cotton fibers for methylene blue dye removal. RSC Adv. 2018, 8, 21577–21584. [Google Scholar] [CrossRef]
- Zhang, H.; Wang, P.; Zhang, Y.; Cheng, B.; Zhu, R.; Li, F. Synthesis of a novel arginine-modified starch resin and its adsorption of dye wastewater. RSC Adv. 2020, 10, 41251–41263. [Google Scholar] [CrossRef] [PubMed]
- Modwi, A.; Abbo, M.A.; Hassan, E.A.; Houas, A. Effect of annealing on physicochemical and photocatalytic activity of Cu5% loading on ZnO synthesized by sol–gel method. J. Mater. Sci. Mater. Electron. 2016, 27, 12974–12984. [Google Scholar] [CrossRef]
- Yuan, Z.; Wang, J.; Wang, Y.; Liu, Q.; Zhong, Y.; Wang, Y.; Li, L.; Lincoln, S.F.; Guo, X. Preparation of a poly (acrylic acid) based hydrogel with fast adsorption rate and high adsorption capacity for the removal of cationic dyes. RSC Adv. 2019, 9, 21075–21085. [Google Scholar] [CrossRef]
- Khezami, L.; Aissa, M.A.B.; Modwi, A.; Guesmi, A.; Algethami, F.K.; Bououdina, M. Efficient removal of organic dyes by Cr-doped ZnO nanoparticles. Biomass Convers. Biorefin. 2022, 1–14. [Google Scholar] [CrossRef]
- Mahmood, T.; Saddique, M.T.; Naeem, A.; Westerhoff, P.; Mustafa, S.; Alum, A. Comparison of different methods for the point of zero charge determination of NiO. Ind. Eng. Chem. Res. 2011, 50, 10017–10023. [Google Scholar] [CrossRef]
- Gupta, V.; Nayak, A.J.C. Cadmium removal and recovery from aqueous solutions by novel adsorbents prepared from orange peel and Fe2O3 nanoparticles. J. Chem. Eng. 2012, 180, 81–90. [Google Scholar] [CrossRef]
- Sundaramurthy, S.; Srivastava, V.; Mishra, I.M. Isotherm, Thermodynamics, Desorption, and Disposal Study for the Adsorption of Catechol and Resorcinol onto Granular Activated Carbon. J. Chem. Eng. Data 2011, 56, 811–818. [Google Scholar]
- Salih, S.; Anwer, S.; Faraj, R. Biosorption of mercury from wastewater using isolated Aspergillus sp. modified 1,10 Phenanthroline: Hill isotherm model. Sci. J. Univ. Zakho 2017, 5, 288–295. [Google Scholar] [CrossRef]
- Bayuo, J.; Pelig-Ba, K.; Abukari, M. Isotherm Modeling of Lead (II) Adsorption From Aqueous Solution Using Groundnut Shell As A Low-Cost Adsorbent. IOSR J. Appl. Chem. 2018, 11, 18–23. [Google Scholar]
- Shafiq, M.; Alazba, P.; Amin, M. Kinetic and Isotherm Studies of Ni2+ and Pb2+ Adsorption from Synthetic Wastewater Using Eucalyptus camdulensis—Derived Biochar. Sustainability 2021, 13, 3785. [Google Scholar] [CrossRef]
- Oboh, I.; Aluyor, E.; Audu, T. Second-order kinetic model for the adsorption of divalent metal ions on Sida acuta leaves. Int. J. Phys. Sci. 2013, 8, 1722–1728. [Google Scholar]
- Zafar, S.; Khalid, N.; Daud, M.; Mirza, M. Kinetic Studies of the Adsorption of Thorium Ions onto Rice Husk from Aqueous Media: Linear and Nonlinear Approach. Nucleus 2015, 52, 14–19. [Google Scholar]
- Abbas, M. Application of Used Tea Leaves for Multi Functions. Eur. Acad. Res. 2014, 2, 8660–8690. [Google Scholar]
- Yu, T.; Liang, S.; Shang, X. In Kinetic and thermodynamic study of Am(III) sorption on Na-bentonite: Comparison of linear and non-linear methods. Indian J. Chem. Technol. 2017, 24, 123–133. [Google Scholar]
- Benmessaoud, A.; Djamel, N.; Mekatel, E.H.; Samira, A. A Comparative Study of the Linear and Non-Linear Methods for Determination of the Optimum Equilibrium Isotherm for Adsorption of Pb2+ Ions onto Algerian Treated Clay. Iran. J. Chem. Chem. Eng. 2020, 39, 153. [Google Scholar]
Disclaimer/Publisher’s Note: The statements, opinions and data contained in all publications are solely those of the individual author(s) and contributor(s) and not of MDPI and/or the editor(s). MDPI and/or the editor(s) disclaim responsibility for any injury to people or property resulting from any ideas, methods, instructions or products referred to in the content. |
© 2023 by the authors. Licensee MDPI, Basel, Switzerland. This article is an open access article distributed under the terms and conditions of the Creative Commons Attribution (CC BY) license (https://creativecommons.org/licenses/by/4.0/).