Quality by Design (QbD) Based Method for Estimation of Xanthohumol in Bulk and Solid Lipid Nanoparticles and Validation
Abstract
1. Introduction
2. Results and Discussion
2.1. Preliminary HPLC Method Development Studies
2.2. Risk Assessment Studies
2.3. Optimization
2.4. Effects of Independent Variables on Dependent Variables
2.4.1. Effect of Independent Variables on Retention Time
2.4.2. Effect of Independent Variables on Peak Area
2.4.3. Effect of Independent Variables on Peak Height
2.4.4. Effect of Independent Variables on Tailing Factor
2.4.5. Effect Independent Variables on Theoretical Plates
2.5. Optimization of Chromatographic Method
2.6. Method Validation
2.6.1. Linearity
2.6.2. LOD and LOQ
2.6.3. Accuracy (Recovery Method)
2.6.4. Precision
2.6.5. Robustness
2.7. Parameters of System Suitability
System Specificity
2.8. Applications of Developed and Validated Method for Characterization of SLNs
Determination of % EE
3. Materials and Methods
3.1. Materials and Equipments Used
3.2. Chromatographic Conditions
3.3. Standards Preparation
Preparation of Stock and Working XH Solution
3.4. Method Development
3.4.1. Risk Assessment Studies
3.4.2. Optimization of Chromatographic Method
3.5. Method Validation
3.5.1. Preparation of Quality Control Samples
3.5.2. Linearity
3.5.3. LOD and LOQ
3.5.4. Accuracy
3.5.5. Precision
3.5.6. Robustness
3.5.7. System Suitability
3.6. Formulation of Solid Lipid Nanoparticles (SLNs)
3.7. System Specificity
3.8. Application of Developed and Validated Method for Characterization of SLNs
Determination of Percentage Entrapment Efficiency (% EE)
4. Conclusions
Author Contributions
Funding
Institutional Review Board Statement
Informed Consent Statement
Data Availability Statement
Acknowledgments
Conflicts of Interest
Abbreviations
References
- Venturelli, S.; Burkard, M.; Biendl, M.; Lauer, U.M.; Frank, J.; Busch, C. Prenylated Chalcones and Flavonoids for the Prevention and Treatment of Cancer. Nutrition 2016, 32, 1171–1178. [Google Scholar] [CrossRef] [PubMed]
- Harish, V.; Haque, E.; Śmiech, M.; Taniguchi, H.; Jamieson, S.; Tewari, D.; Bishayee, A. Xanthohumol for Human Malignancies: Chemistry, Pharmacokinetics and Molecular Targets. Int. J. Mol. Sci. 2021, 22, 4478. [Google Scholar] [CrossRef]
- Venè, R.; Benelli, R.; Minghelli, S.; Astigiano, S.; Tosetti, F.; Ferrari, N. Xanthohumol Impairs Human Prostate Cancer Cell Growth and Invasion and Diminishes the Incidence and Progression of Advanced Tumors in TRAMP Mice. Mol. Med. 2012, 18, 1292–1302. [Google Scholar] [CrossRef] [PubMed]
- Girisa, S.; Saikia, Q.; Bordoloi, D.; Banik, K.; Monisha, J.; Daimary, U.D.; Verma, E.; Ahn, K.S.; Kunnumakkara, A.B. Xanthohumol from Hop: Hope for Cancer Prevention and Treatment. IUBMB Life 2021, 73, 1016–1044. [Google Scholar] [CrossRef] [PubMed]
- National Center for Biotechnology Information. PubChem Compound Summary for CID 639665, Xanthohumol. 2021. Available online: https://pubchem.ncbi.nlm.nih.gov/compound/Xanthohumol (accessed on 17 October 2022).
- Gerhauser, C.; Alt, A.; Heiss, E.; Gamal-Eldeen, A.; Klimo, K.; Knauft, J.; Neumann, I.; Scherf, H.-R.; Frank, N.; Bartsch, H.; et al. Cancer Chemopreventive Activity of Xanthohumol, a Natural Product Derived from Hop. Mol. Cancer Ther. 2002, 1, 959–969. [Google Scholar] [PubMed]
- Vázquez Loureiro, P.; Hernández Jiménez, I.; Sendón, R.; Rodriguez-Bernaldo de Quirós, A.; Barbosa-Pereira, L. Determination of Xanthohumol in Hops, Food Supplements and Beers by HPLC. Foods 2019, 8, 435. [Google Scholar] [CrossRef]
- Sus, N.; Schlienz, J.; Calvo-Castro, L.A.; Burkard, M.; Venturelli, S.; Busch, C.; Frank, J. Validation of a Rapid and Sensitive Reversed-Phase Liquid Chromatographic Method for the Quantification of Prenylated Chalcones and Flavanones in Plasma and Urine. NFS J. 2018, 10, 1–9. [Google Scholar] [CrossRef]
- Avula, B.; Ganzera, M.; Warnick, J.E.; Feltenstein, M.W.; Sufka, K.J.; Khan, I.A. High-Performance Liquid Chromatographic Determination of Xanthohumol in Rat Plasma, Urine, and Fecal Samples. J. Chromatogr. Sci. 2004, 42, 378–382. [Google Scholar] [CrossRef]
- Subramanian, V.B.; Katari, N.K.; Dongala, T.; Jonnalagadda, S.B. Stability-Indicating RP-HPLC Method Development and Validation for Determination of Nine Impurities in Apixaban Tablet Dosage Forms. Robustness Study by Quality by Design Approach. Biomed. Chromatogr. 2020, 34, e4719. [Google Scholar] [CrossRef]
- Patel, K.Y.; Dedania, Z.R.; Dedania, R.R.; Patel, U. QbD Approach to HPLC Method Development and Validation of Ceftriaxone Sodium. Futur. J. Pharm. Sci. 2021, 7, 141. [Google Scholar] [CrossRef]
- Wani, Y.B.; Patil, D.D. An Experimental Design Approach for Optimization of Spectrophotometric Method for Estimation of Cefixime Trihydrate Using Ninhydrin as Derivatizing Reagent in Bulk and Pharmaceutical Formulation. J. Saudi Chem. Soc. 2017, 21, S101–S111. [Google Scholar] [CrossRef]
- Ferreira, S.L.C.; Bruns, R.E.; Ferreira, H.S.; Matos, G.D.; David, J.M.; Brandão, G.C.; da Silva, E.G.P.; Portugal, L.A.; dos Reis, P.S.; Souza, A.S.; et al. Box-Behnken Design: An Alternative for the Optimization of Analytical Methods. Anal. Chim. Acta 2007, 597, 179–186. [Google Scholar] [CrossRef]
- Yu, L.X.; Amidon, G.; Khan, M.A.; Hoag, S.W.; Polli, J.; Raju, G.K.; Woodcock, J. Understanding Pharmaceutical Quality by Design. AAPS J. 2014, 16, 771–783. [Google Scholar] [CrossRef]
- Tome, T.; Žigart, N.; Časar, Z.; Obreza, A. Development and Optimization of Liquid Chromatography Analytical Methods by Using AQbD Principles: Overview and Recent Advances. Org. Process Res. Dev. 2019, 23, 1784–1802. [Google Scholar] [CrossRef]
- Elkhoudary, M.M.; Abdel Salam, R.A.; Hadad, G.M. Development and Optimization of HPLC Analysis of Metronidazole, Diloxanide, Spiramycin and Cliquinol in Pharmaceutical Dosage Forms Using Experimental Design. J. Chromatogr. Sci. 2016, 54, 1701–1712. [Google Scholar] [CrossRef][Green Version]
- Ameeduzzafar; El-Bagory, I.; Alruwaili, N.K.; Imam, S.S.; Alomar, F.A.; Elkomy, M.H.; Ahmad, N.; Elmowafy, M. Quality by Design (QbD) Based Development and Validation of Bioanalytical RP-HPLC Method for Dapagliflozin: Forced Degradation and Preclinical Pharmacokinetic Study. J. Liq. Chromatogr. Relat. Technol. 2020, 43, 53–65. [Google Scholar] [CrossRef]
- Singh, B.; Kumar, R.; Ahuja, N. Optimizing Drug Delivery Systems Using Systematic" Design of Experiments." Part I: Fundamental Aspects. Crit. Rev. Ther. Drug Carr. Syst. 2005, 22, 27–105. [Google Scholar] [CrossRef]
- Jain, A.; Beg, S.; Saini, S.; Sharma, T.; Katare, O.P.; Singh, B. Application of Chemometric Approach for QbD-Enabled Development and Validation of an RP-HPLC Method for Estimation of Methotrexate. J. Liq. Chromatogr. Relat. Technol. 2019, 42, 502–512. [Google Scholar] [CrossRef]
- Seyed-Hosseini, S.M.; Safaei, N.; Asgharpour, M.J. Reprioritization of Failures in a System Failure Mode and Effects Analysis by Decision Making Trial and Evaluation Laboratory Technique. Reliab. Eng. Syst. Saf. 2006, 91, 872–881. [Google Scholar] [CrossRef]
- Vora, C.; Patadia, R.; Mittal, K.; Mashru, R. Risk Based Approach for Design and Optimization of Stomach Specific Delivery of Rifampicin. Int. J. Pharm. 2013, 455, 169–181. [Google Scholar] [CrossRef]
- Beg, S.; Sharma, G.; Katare, O.P.; Lohan, S.; Singh, B. Development and Validation of a Stability-Indicating Liquid Chromatographic Method for Estimating Olmesartan Medoxomil Using Quality by Design. J. Chromatogr. Sci. 2015, 53, 1048–1059. [Google Scholar] [CrossRef]
- Pecchio, M.; Salman, H.; Irache, J.M.; Renedo, M.J.; Dios-Viéitez, M.C. Development and Validation of a HPLC Method for the Determination of Cyclosporine a in New Bioadhesive Nanoparticles for Oral Administration. Indian J. Pharm. Sci. 2014, 76, 132. [Google Scholar]
- Singh, G.; Pai, R.S.; Pandit, V. Development and Validation of a HPLC Method for the Determination of Trans-Resveratrol in Spiked Human Plasma. J. Adv. Pharm. Technol. Res. 2012, 3, 130. [Google Scholar]
- Dejaegher, B.; Heyden, Y. Vander Ruggedness and Robustness Testing. J. Chromatogr. A 2007, 1158, 138–157. [Google Scholar] [CrossRef]
- Kumar, R.; Kumar, R.; Khursheed, R.; Awasthi, A.; Khurana, N.; Singh, S.K.; Khurana, S.; Sharma, N.; Gunjal, P.; Kaur, J. Development and Validation of RP-HPLC Method for Estimation of Fisetin in Rat Plasma. S. African J. Bot. 2021, 140, 284–289. [Google Scholar] [CrossRef]
- Kumar, R.; Kumar, R.; Khursheed, R.; Awasthi, A.; Ramanunny, A.K.; Kaur, J.; Khurana, N.; Singh, S.K.; Khurana, S.; Pandey, N.K. Validated Reverse Phase-High-Performance Liquid Chromatography Method for Estimation of Fisetin in Self-Nanoemulsifying Drug Delivery System. Assay Drug Dev. Technol. 2020, 18, 274–281. [Google Scholar] [CrossRef]
- Kapoor, B.; Gupta, R.; Gulati, M.; Singh, S.K.; Khatik, G.L.; Chawla, M.; Nagappan, K.V.; Khursheed, R.; Kumar, R. High-Performance Liquid Chromatography and Liquid Chromatography/Mass Spectrometry Studies on Stress Degradation Behavior of Sulfapyridine and Development of a Validated, Specific, Stability-Indicating HPLC Assay Method. Assay Drug Dev. Technol. 2020, 18, 119–133. [Google Scholar] [CrossRef]


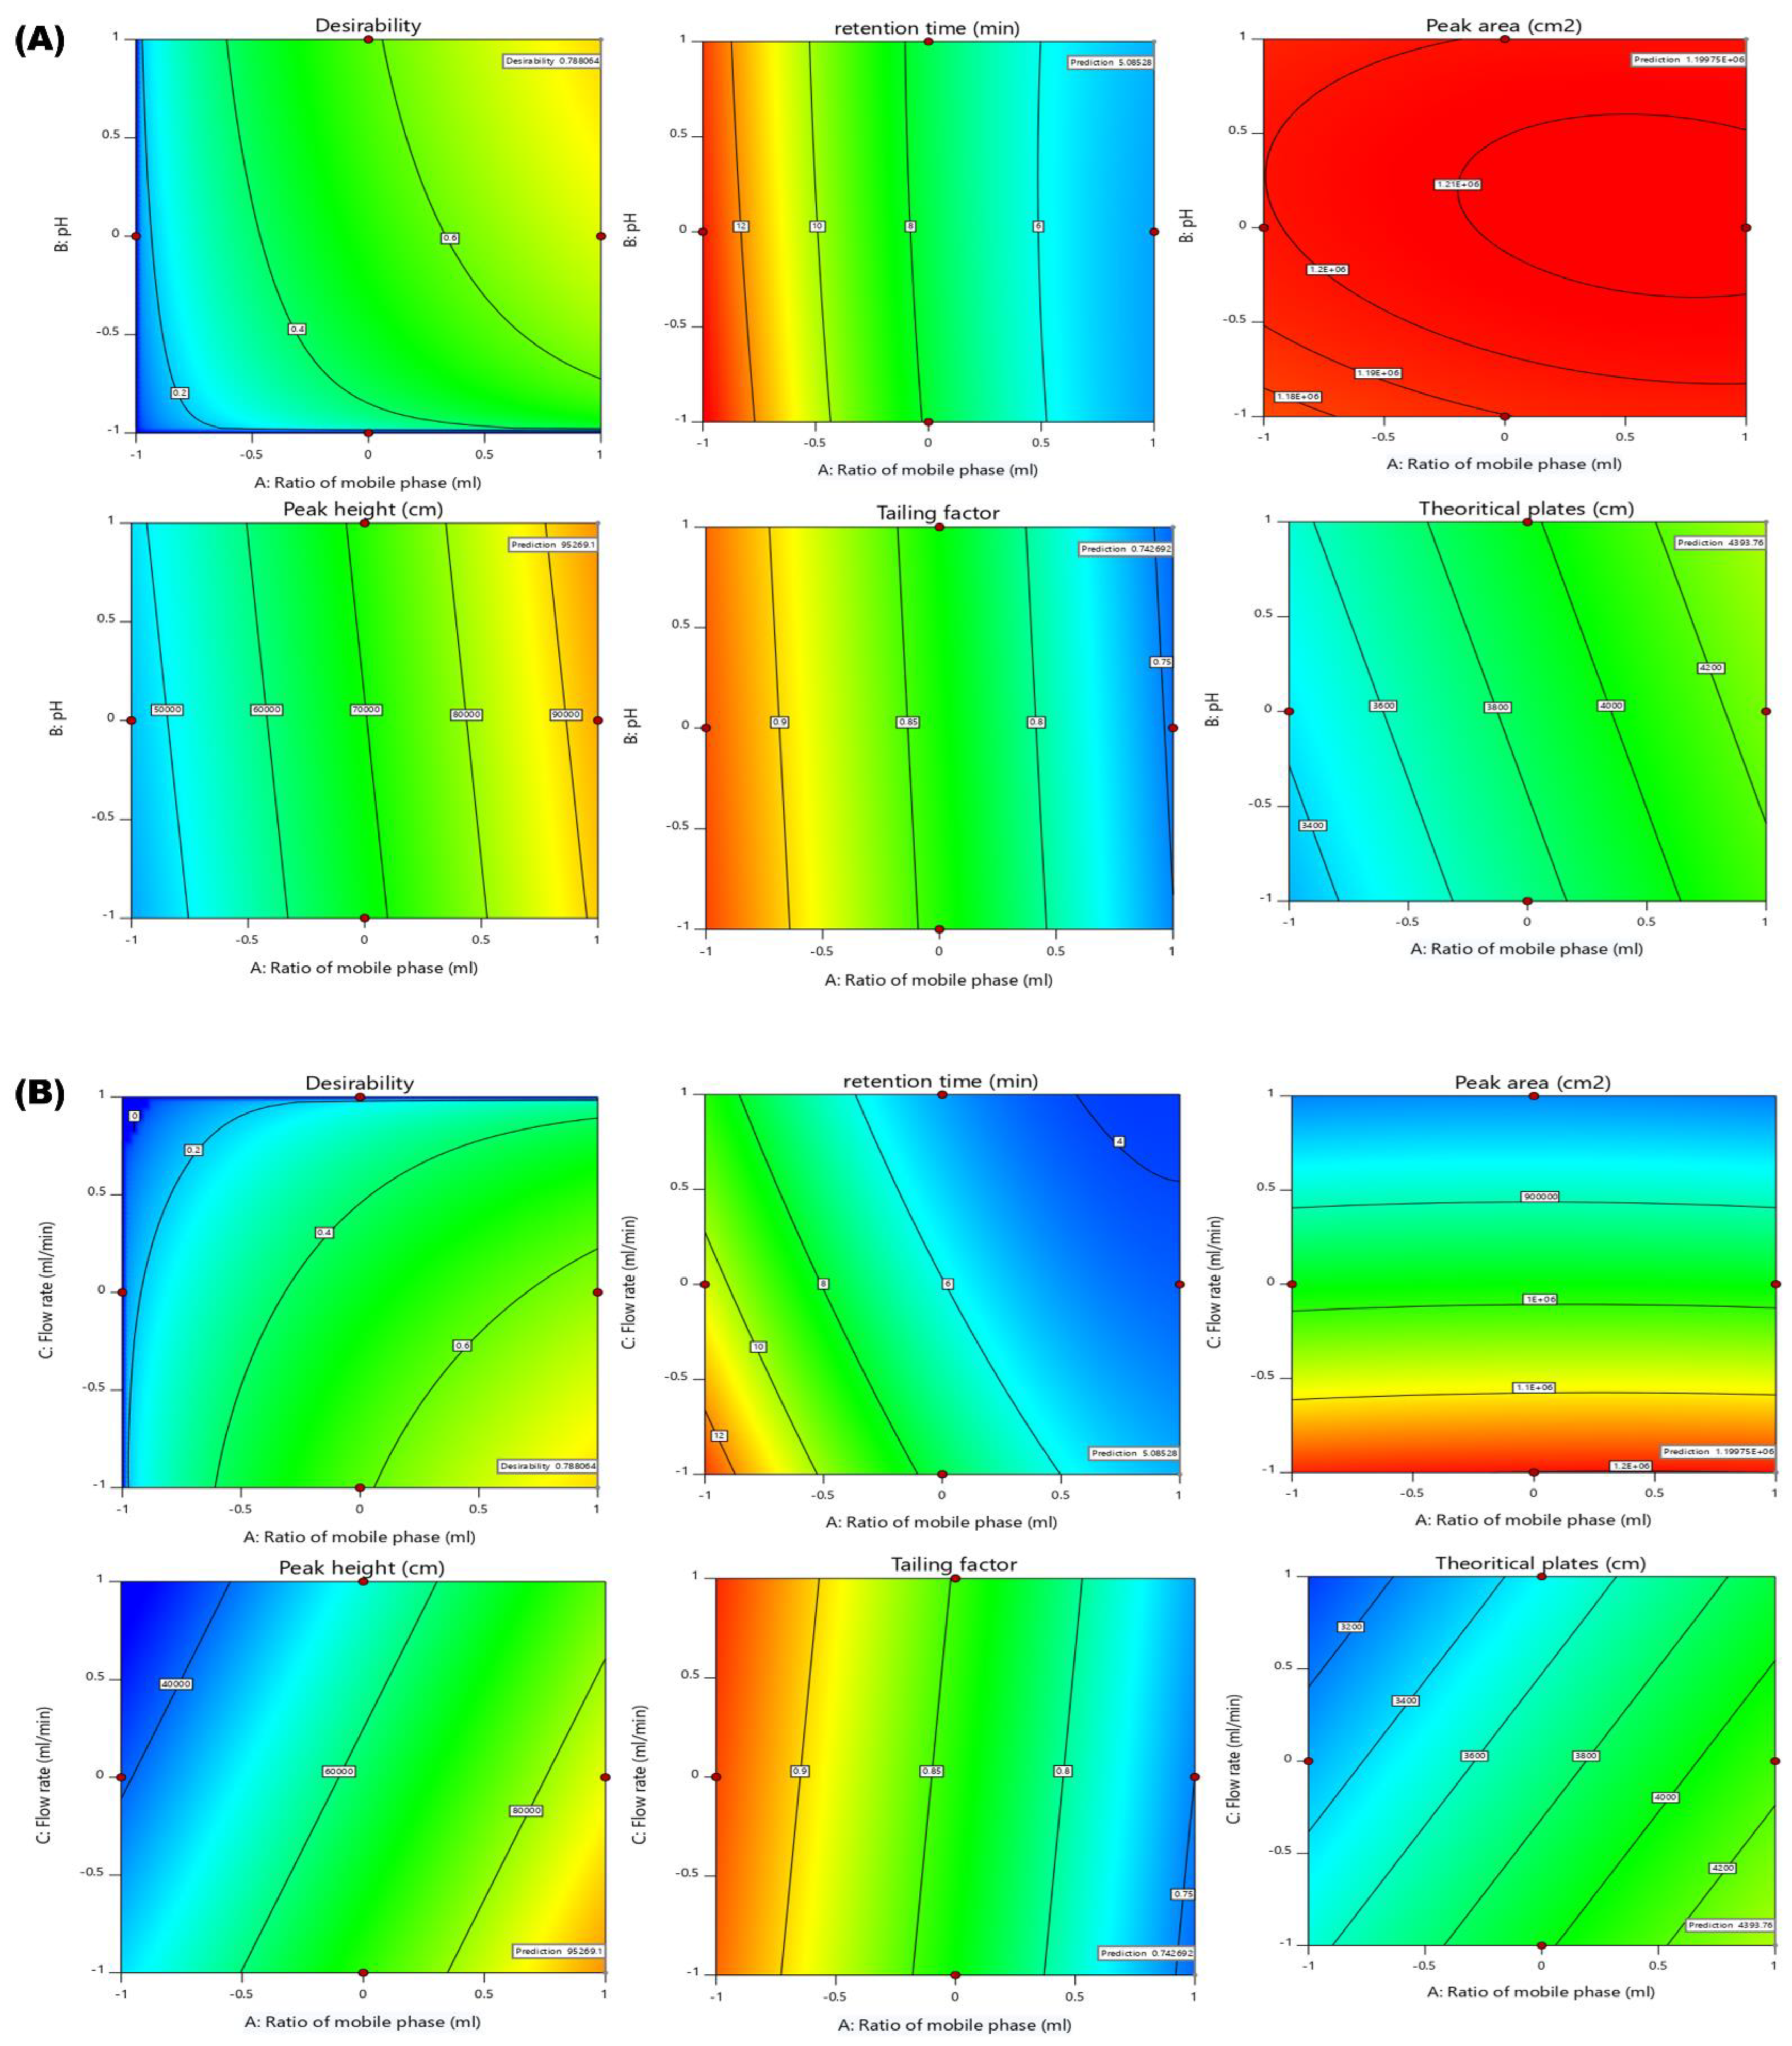
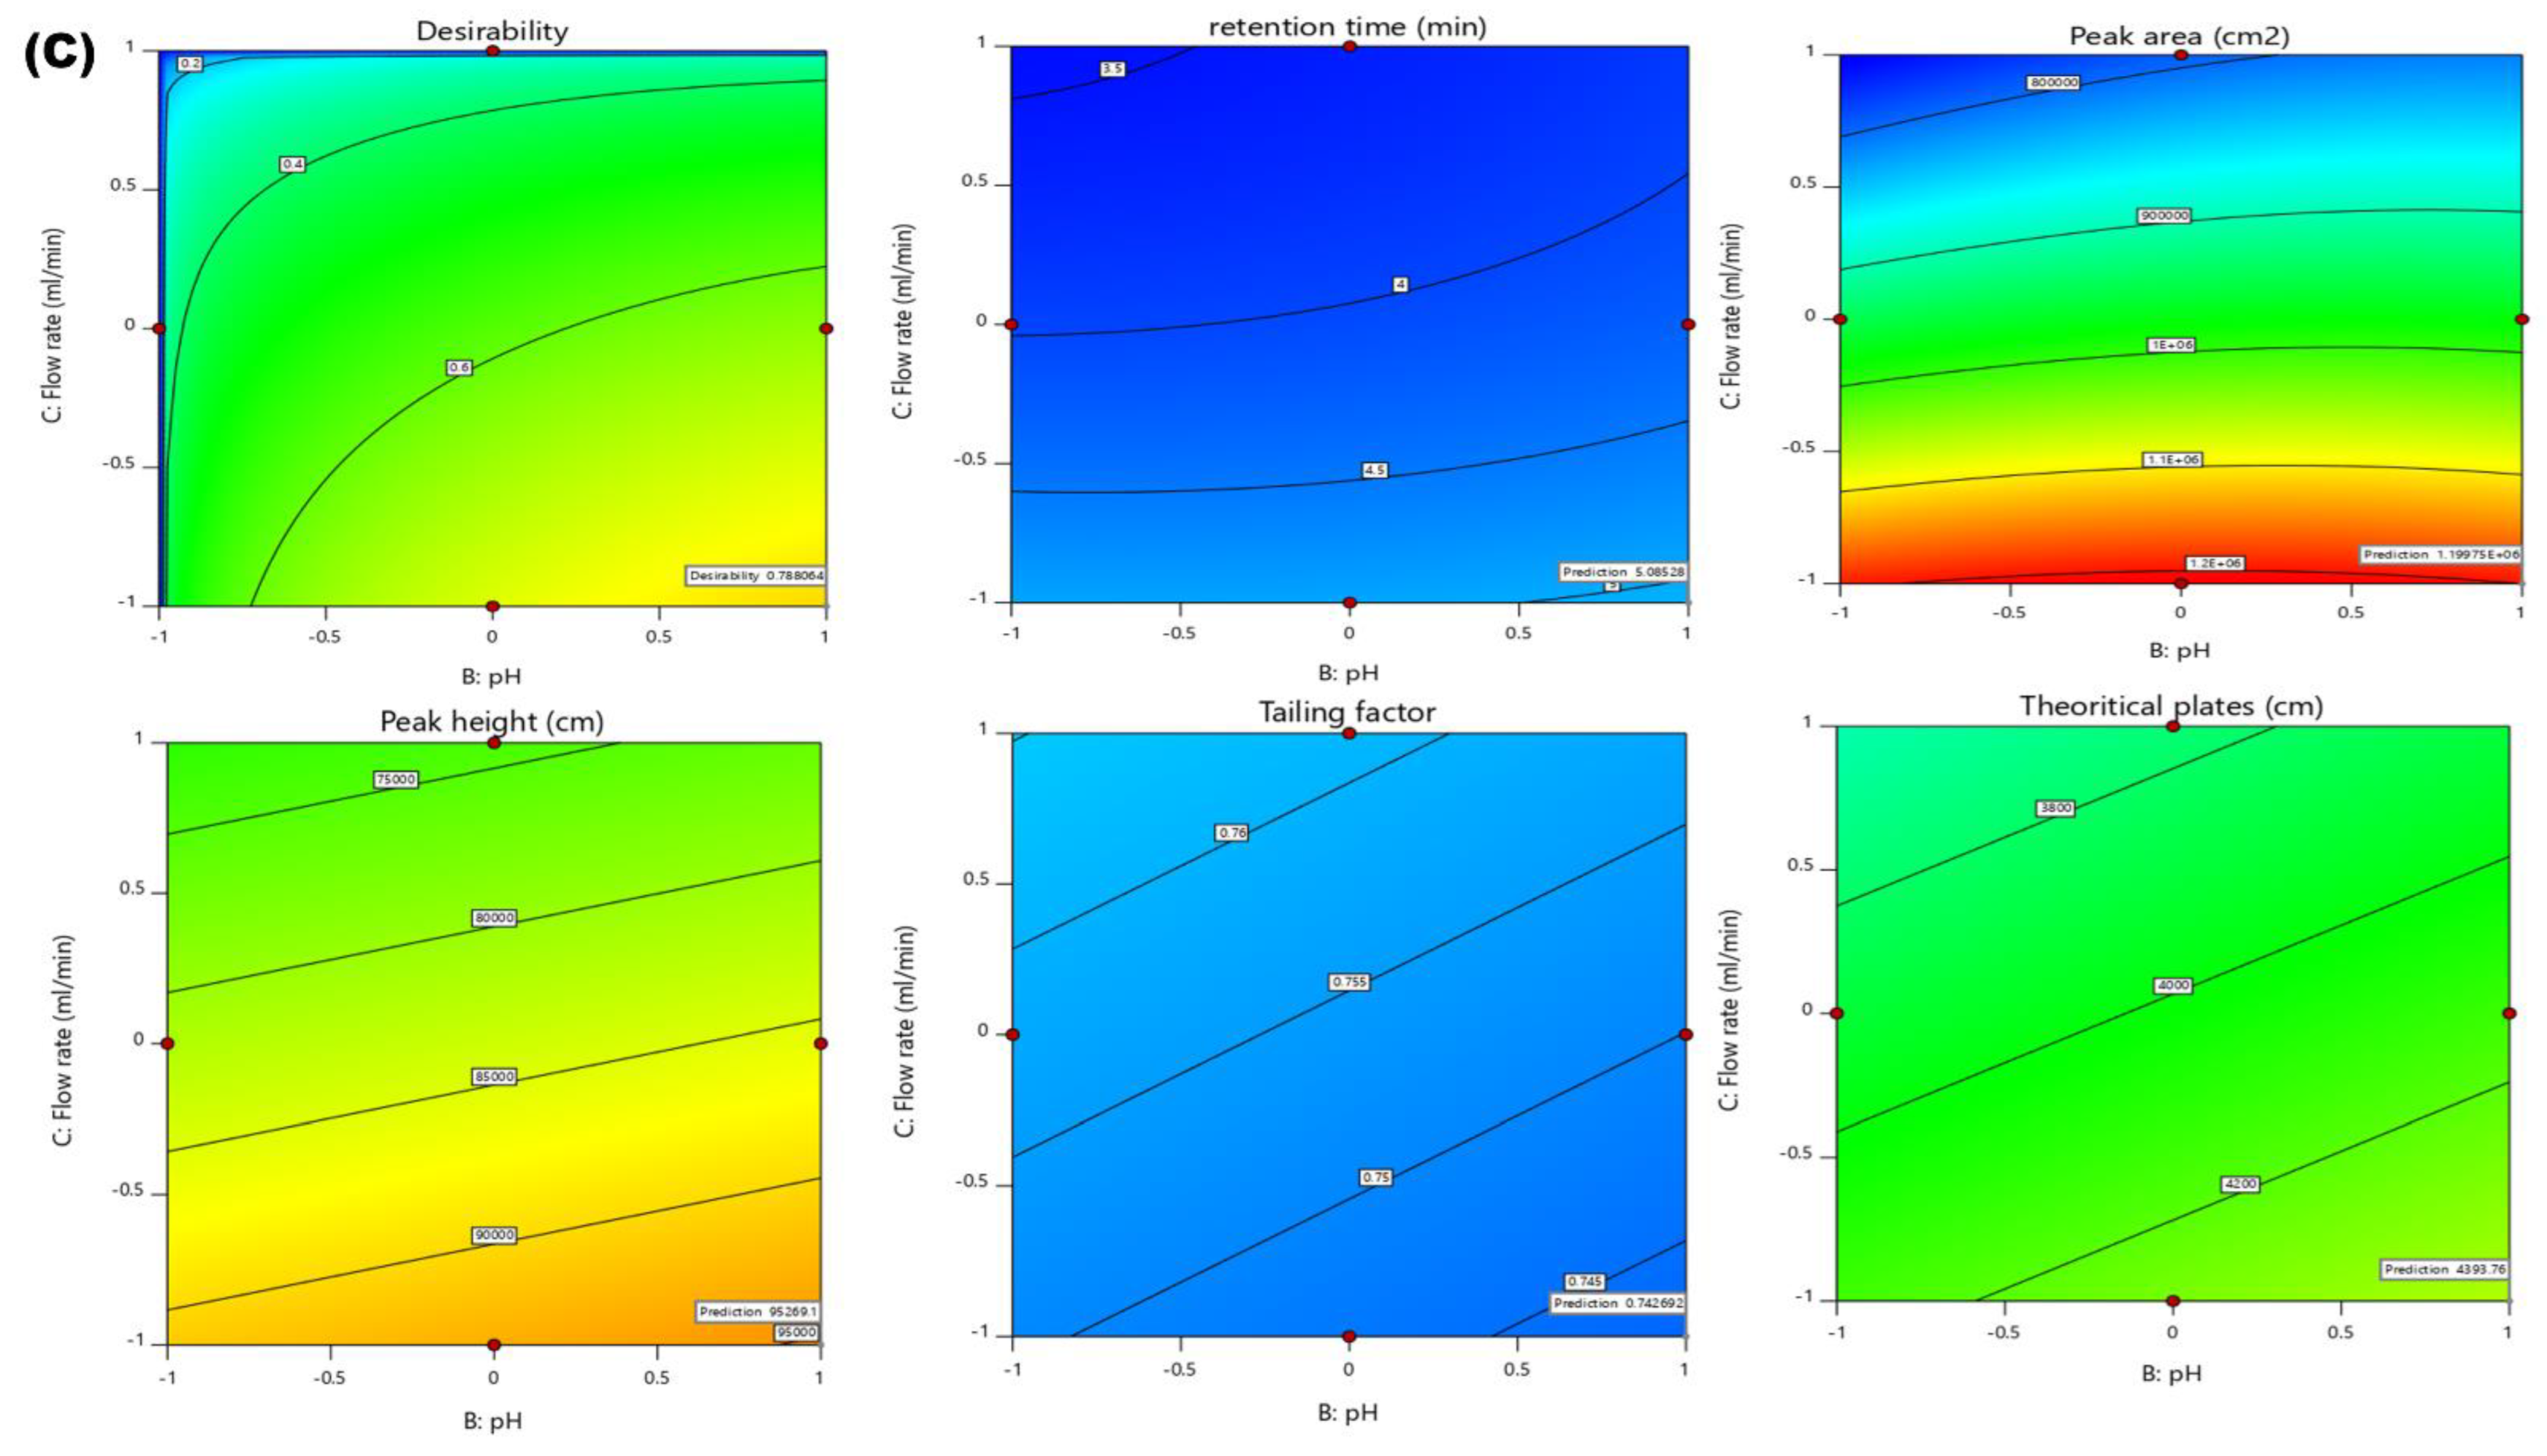
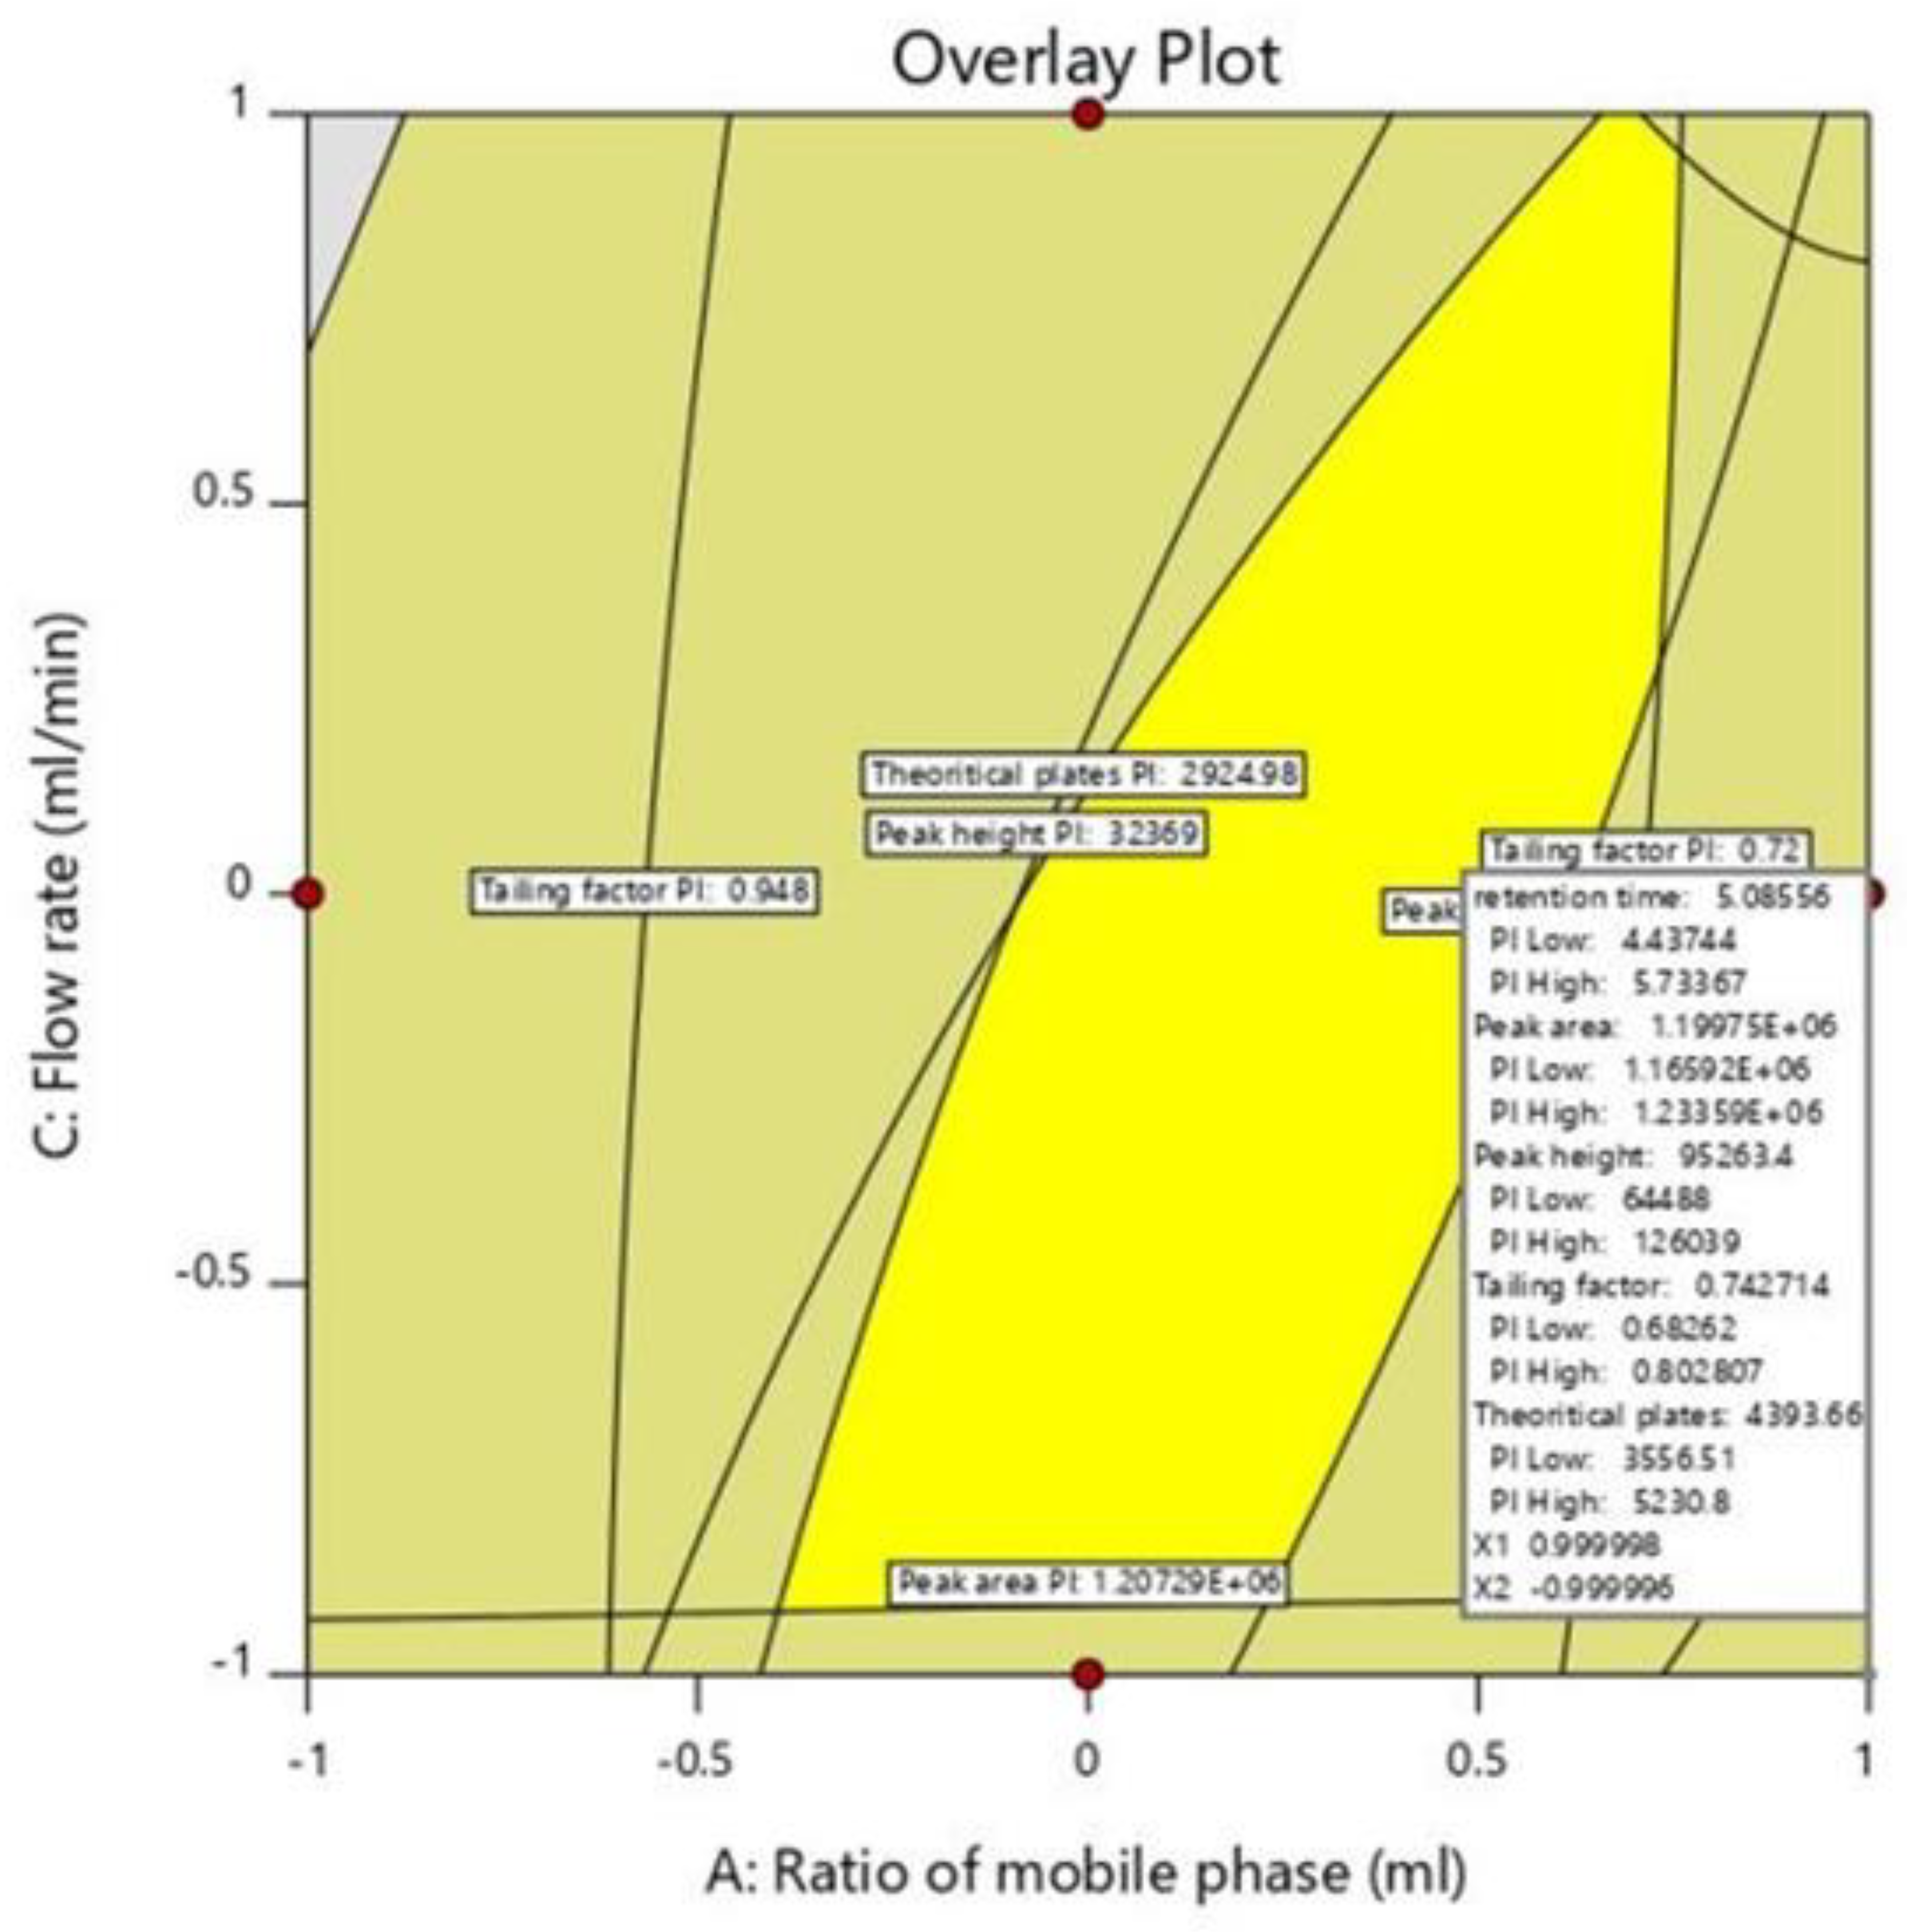
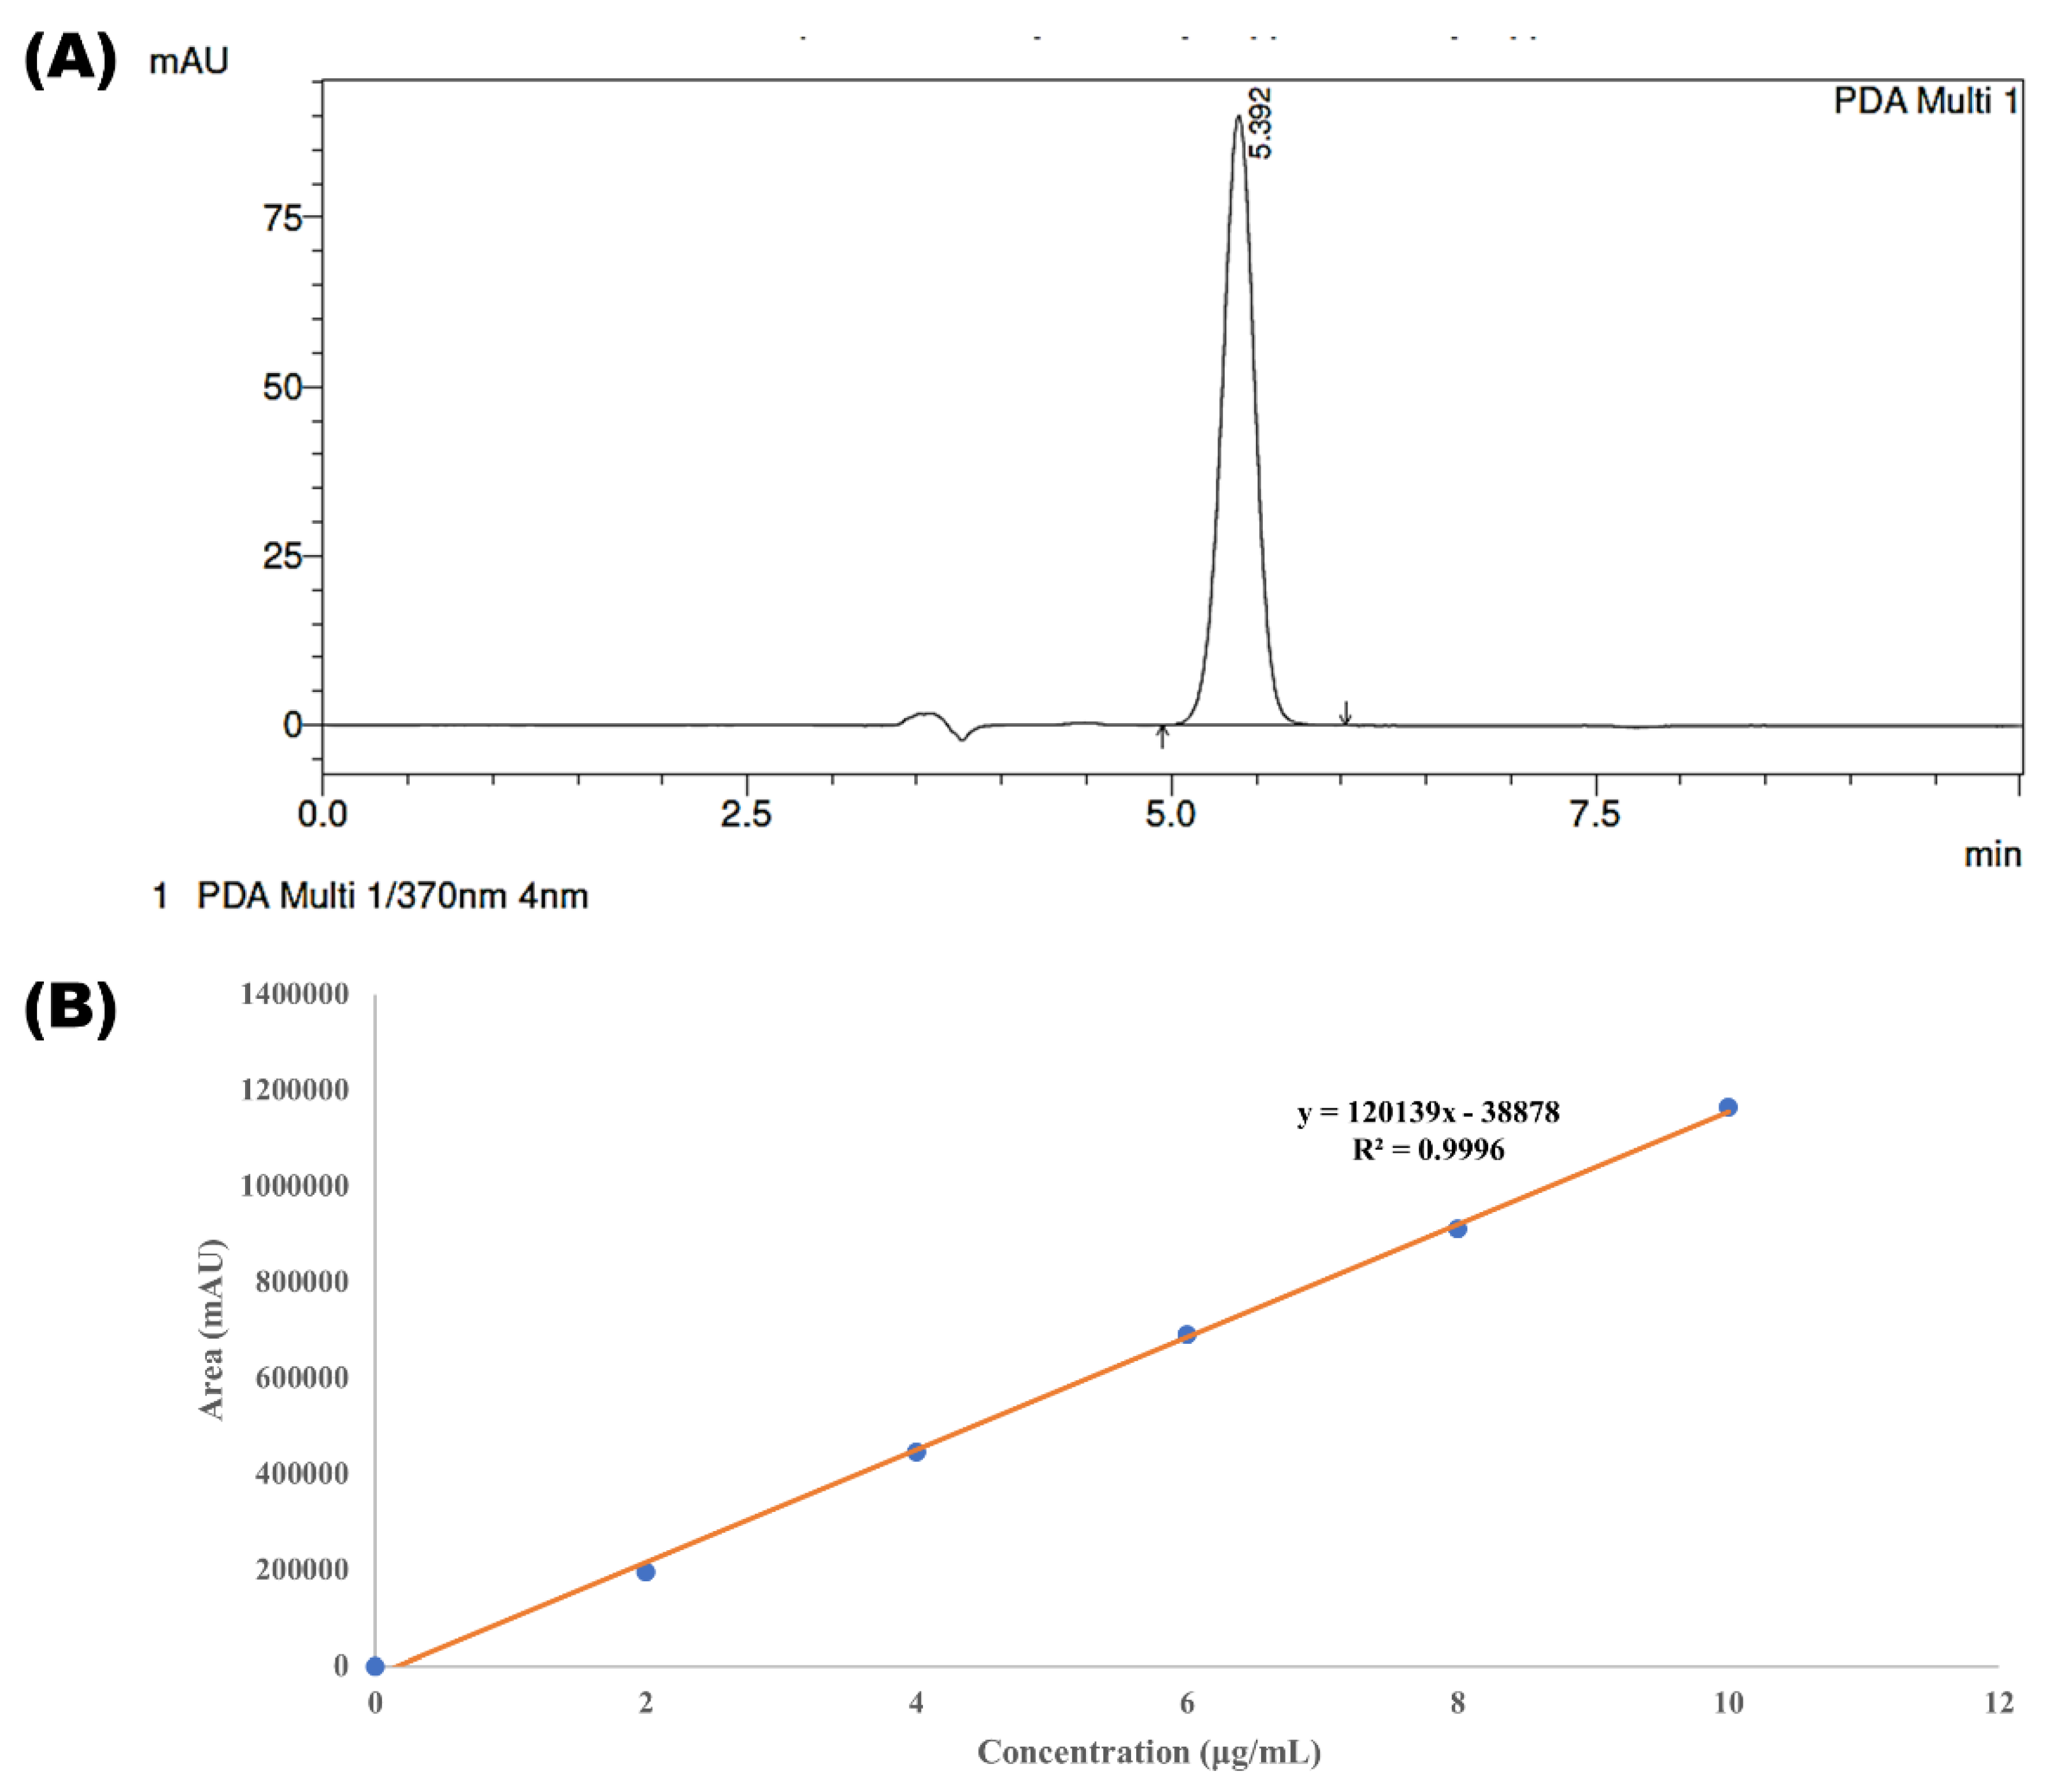
| Chromatographic Method Parameters of XH | |||||||
|---|---|---|---|---|---|---|---|
| CAAs | Composition of Mobile Phase | pH of 0.1% OPA | Column Temperature (20–40 °C) | Injection Volume | Flow Rate | Flow Type | Column Dimension |
| Peak area | + | + | − | − | + | − | 0 |
| Retention time | + | + | 0 | − | + | 0 | 0 |
| Peak height | + | + | − | − | + | 0 | 0 |
| Tailing factor | + | − | − | − | 0 | − | 0 |
| S.N. | Factor A: Ratio of Mobile Phase (mL) | Factor B: pH | Factor C: Flow Rate ml/min | Response (R1), Retention Time (min) | Response (R2), Peak Area (mAU) | Response (R3), Peak Height (AU) | Response (R4) Tailing Factor | Response (R5), Theoretical Plates (cm) |
|---|---|---|---|---|---|---|---|---|
| 1 | 0 | −1 | 1 | 5.129 | 751,181 | 57,142 | 0.840 | 3513.72 |
| 2 | 1 | −1 | 0 | 4.045 | 944,677 | 92,949 | 0.760 | 3566.48 |
| 3 | −1 | 1 | 0 | 10.477 | 968,790 | 35,711 | 0.932 | 3119.75 |
| 4 | −1 | 0 | 1 | 8.856 | 799,071 | 36,086 | 0.948 | 2924.98 |
| 5 | 1 | 0 | 1 | 3.306 | 783,788 | 32,369 | 0.780 | 3300.93 |
| 6 | 0 | 1 | 1 | 5.017 | 808,365 | 59,340 | 0.830 | 3155.68 |
| 7 | 0 | 1 | −1 | 7.379 | 115,5783 | 62,326 | 0.851 | 3757.14 |
| 8 | −1 | 0 | −1 | 13.398 | 1,207,293 | 37,080 | 0.916 | 3336.44 |
| 9 # | 0 | 0 | 0 | 6.042 | 973,375 | 62,039 | 0.832 | 3558.42 |
| 10 | 1 | 1 | 0 | 4.460 | 989,728 | 105,582 | 0.720 | 5103.66 |
| 11 # | 0 | 0 | 0 | 6.042 | 973,375 | 62,039 | 0.846 | 3558.42 |
| 12 | 0 | −1 | −1 | 7.791 | 1,195,844 | 61,884 | 0.833 | 3822.58 |
| 13 # | 0 | 0 | 0 | 6.054 | 975,458 | 62,138 | 0.839 | 4167.72 |
| 14 | −1 | −1 | 0 | 10.936 | 911,593 | 34,327 | 0.932 | 3158.42 |
| 15 # | 0 | 0 | 0 | 6.031 | 977,418 | 62,089 | 0.833 | 3558.42 |
| 16 | 1 | 0 | −1 | 4.957 | 1,203,094 | 99,607 | 0.740 | 3916.72 |
| 17 # | 0 | 0 | 0 | 6.062 | 973,375 | 62,039 | 0.932 | 3558.42 |
| Factors | Levels | |||||||
| Low (−1) | Middle (0) | High (+1) | ||||||
| Mobile phase ratio (A:B) | 25:75 | 18:82 | 10:90 | |||||
| pH | 1.5 | 1.7 | 1.9 | |||||
| Flow rate mL/min | 0.8 | 1 | 1.2 | |||||
| Summary | |||||||||||||||
|---|---|---|---|---|---|---|---|---|---|---|---|---|---|---|---|
| Source | Sequential p Value | Lack of Fit p Value | |||||||||||||
| R1 | R2 | R3 | R4 | R5 | R1 | R2 | R3 | R4 | R5 | ||||||
| Linear | <0.0001 | <0.0001 | 0.0026 | <0.0001 | 0.0248 | <0.0001 | <0.0001 | <0.0001 | 0.9806 | 0.1867 | |||||
| 2FI | 0.4811 | 0.6616 | 0.135 | 0.8889 | 0.264 | <0.0001 | <0.0001 | <0.0001 | 0.9432 | 0.2032 | |||||
| Quadratic | <0.0001 | 0.0049 | 0.3969 | 0.8191 | 0.5808 | <0.0001 | 0.0004 | <0.0001 | 0.852 | 0.1314 | |||||
| Cubic | <0.0001 | 0.0004 | <0.0001 | 0.852 | 0.1314 | ||||||||||
| Sequential Model Sum of squares (type-1) | |||||||||||||||
| Source | Sum of squares | df | |||||||||||||
| Mean Vs total | 791.28 | 1.63 × 10¹³ | 6.18 × 10¹⁰ | 12.14 | 2.20 × 10⁸ | 1 | 1 | 1 | 1 | 1 | |||||
| Linear Vs mean | 106.21 | 3.48 × 10¹¹ | 5.14 × 1009 | 0.0668 | 2.04 × 10⁶ | 3 | 3 | 3 | 3 | 3 | |||||
| 2FI Vs Linear | 2.3 | 8.85 × 10⁸ | 1.13 × 1009 | 0.0006 | 6.41 × 10⁵ | 3 | 3 | 3 | 3 | 3 | |||||
| Quadratic Vs 2FI | 8.32 | 4.45 × 10⁹ | 5.28 × 1008 | 0.0011 | 3.20 × 10⁵ | 3 | 3 | 3 | 3 | 3 | |||||
| Cubic Vs Quadratic | 0.3462 | 9.32 × 10⁸ | 1.08 × 1009 | 0.0014 | 7.69 × 10⁵ | 3 | 3 | 3 | 3 | 3 | |||||
| Residual | 0.0006 | 1.32 × 10⁷ | 7.86 × 1003 | 0.0073 | 2.97 × 10⁵ | 4 | 4 | 4 | 4 | 4 | |||||
| Total | 908.46 | 1.66 × 10¹³ | 6.97 × 10¹⁰ | 12.21 | 2.24 × 10⁸ | 17 | 17 | 17 | 17 | 17 | |||||
| Lack of fit test | |||||||||||||||
| Linear | 10.97 | 6.27 × 10⁹ | 2.74 × 10⁹ | 0.0032 | 1.73 × 10⁶ | 9 | 9 | 9 | 9 | 9 | |||||
| 2FI | 8.66 | 5.39 × 10⁹ | 1.61 × 10⁹ | 0.0026 | 1.09 × 10⁶ | 6 | 6 | 6 | 6 | 6 | |||||
| Quadratic | 0.3462 | 9.32 × 10⁸ | 1.08 × 10⁹ | 0.0014 | 7.69 × 10⁵ | 3 | 3 | 3 | 3 | 3 | |||||
| Cubic | 0 | 0 | 0 | 0 | 0 | 0 | 0 | 0 | 0 | 0 | |||||
| Pure error | 0.0006 | 1.32 × 10⁷ | 7.86 × 10³ | 0.0073 | 2.97 × 10⁵ | 4 | 4 | 4 | 4 | 4 | |||||
| Model summary statistics | |||||||||||||||
| Source | Standard deviation | R-squared | |||||||||||||
| Linear | 0.9185 | 21,984.64 | 14,513.20 | 0.0283 | 394.79 | 0.9064 | 0.9822 | 0.6525 | 0.8648 | 0.5016 | |||||
| 2FI | 0.9308 | 23,233.85 | 12,683.67 | 0.0314 | 372.23 | 0.9261 | 0.9847 | 0.7958 | 0.8727 | 0.6592 | |||||
| Quadratic | 0.2226 | 11,619.20 | 12,425.46 | 0.0352 | 390.14 | 0.997 | 0.9973 | 0.8628 | 0.8876 | 0.7379 | |||||
| Cubic | 0.012 | 1815.16 | 44.33 | 0.0426 | 272.49 | 1 | 1 | 1 | 0.9059 | 0.9269 | |||||
| Fit summary and ANOVA using DOE models | |||||||||||||||
| Summary | |||||||||||||||
| Source | Adjusted R-squared | Predicted R-squared | |||||||||||||
| R1 | R2 | R3 | R4 | R5 | R1 | R2 | R3 | R4 | R5 | R1 | R2 | R3 | R4 | R5 | |
| Linear | 0.8848 | 0.9782 | 0.5723 | 0.8336 | 0.3866 | 0.8289 | 0.9631 | 0.2745 | 0.816 | 0.035 | |||||
| 2FI | 0.8817 | 0.9756 | 0.6733 | 0.7964 | 0.4547 | 0.7232 | 0.9226 | −0.0408 | 0.7576 | −0.4254 | |||||
| Quadratic | 0.9932 | 0.9939 | 0.6865 | 0.7431 | 0.4009 | 0.9527 | 0.9578 | −1.1945 | 0.5603 | −2.1389 | |||||
| Cubic | 1 | 0.9999 | 1 | 0.6235 | 0.7078 | ||||||||||
| Sequential Model Sum of squares (type-1) | |||||||||||||||
| Source | Mean square | F-value | p-value Prob > F | ||||||||||||
| Mean Vs total | 791.28 | 1.63 × 10+13 | 6.18 × 10+10 | 12.14 | 2.2 × 10⁸ | ||||||||||
| Linear Vs mean | 35.4 | 1.16 × 10+11 | 1.71 × 10⁹ | 0.0223 | 679,600 | 41.97 | 239.76 | 8.14 | 27.72 | 4.36 | <0.0001 | <0.0001 | 0.0026 | <0.0001 | 0.0248 |
| 2FI Vs Linear | 0.7676 | 2.95 × 10⁸ | 3.77 × 10⁸ | 0.0002 | 213,500 | 0.886 | 0.5465 | 2.34 | 0.2076 | 1.54 | 0.4811 | 0.6616 | 0.135 | 0.8889 | 0.264 |
| Quadratic Vs 2FI | 2.77 | 1.48 × 10⁹ | 1.76 × 10⁸ | 0.0004 | 106,700 | 55.96 | 10.99 | 1.14 | 0.3082 | 0.7009 | <0.0001 | 0.0049 | 0.3969 | 0.8191 | 0.5808 |
| Cubic Vs Quadratic | 0.1154 | 3.11 × 10⁸ | 3.60 × 10⁸ | 0.0005 | 256,200 | 800.35 | 94.28 | 1.83 × 10⁵ | 0.2591 | 3.45 | <0.0001 | 0.0004 | <0.0001 | 0.852 | 0.1314 |
| Residual | 0.0001 | 3.30 × 10⁶ | 1.97 × 10³ | 0.0018 | 742,49.8 | ||||||||||
| Total | 53.44 | 9.78 × 10+11 | 4.10 × 10⁹ | 0.7185 | 1.3 × 10⁷ | ||||||||||
| Lack of fit test | |||||||||||||||
| Linear | 1.22 | 6.97 × 10⁸ | 3.04 × 10⁹ | 0.0004 | 192,100 | 8450.09 | 211.45 | 154,800 | 0.1939 | 2.59 | <0.0001 | <0.0001 | <0.0001 | 0.9806 | 0.1867 |
| 2FI | 1.44 | 8.98 × 10⁸ | 2.68 × 10⁸ | 0.0004 | 181,400 | 10,013.39 | 272.4 | 136,400 | 0.2347 | 2.44 | <0.0001 | <0.0001 | <0.0001 | 0.9432 | 0.2032 |
| Quadratic | 0.1154 | 3.11 × 10⁸ | 3.60 × 10⁸ | 0.0005 | 256,200 | 800.35 | 94.28 | 183,300 | 0.2591 | 3.45 | <0.0001 | 0.0004 | <0.0001 | 0.852 | 0.1314 |
| Cubic | |||||||||||||||
| Pure error | 0.0001 | 1.32 × 10⁷ | 1965.20 | 0.0018 | 74,249.8 | ||||||||||
| Model summary statistics | |||||||||||||||
| Source | Adjusted R-squared | Predicted R-squared | PRESS | ||||||||||||
| Linear | 0.8848 | 0.9782 | 0.5723 | 0.8336 | 0.3866 | 0.8289 | 0.9631 | 0.2745 | 0.816 | 0.035 | 20.05 | 1.31 × 10¹⁰ | 5.72 × 10⁹ | 0.0142 | 3.92 × 10⁶ |
| 2FI | 0.8817 | 0.9756 | 0.6733 | 0.7964 | 0.4547 | 0.7232 | 0.9226 | −0.0408 | 0.7576 | −0.4547 | 32.43 | 2.74 × 10¹⁰ | 8.20 × 10⁹ | 0.0187 | 5.79 × 10⁶ |
| Quadratic | 0.9932 | 0.9939 | 0.6865 | 0.7431 | 0.4009 | 0.9527 | 0.9578 | −1.1945 | 0.5603 | −2.1389 | 5.54 | 1.49 × 10¹⁰ | 1.73 × 10+10 | 0.034 | 1.28 × 10⁷ |
| Cubic | 1 | 0.9999 | 1 | 0.6235 | 0.7078 | ||||||||||
| Levels | Concentration of Standard (µg/mL) | Concentration of Sample (µg/mL) | Mean Area ± SD (n = 6) | %RSD | % Recovery Mean Area ± SD | %RSD |
|---|---|---|---|---|---|---|
| LQC | 4.8 | 6 | 598,171.3 ± 1850.81 | 0.309 | 109.7 ± 1.08 | 0.988 |
| MQC | 6 | 6 | 690,278.2 ± 5265.43 | 0.762 | 101.1 ± 0.76 | 0.761 |
| HQC | 7.2 | 6 | 843,344.6 ± 7804.51 | 0.925 | 101.9 ± 0.90 | 0.883 |
| Levels | Concentration (µg/mL) | Parameters | |||||||||
|---|---|---|---|---|---|---|---|---|---|---|---|
| Interday Precision (Repeatability) (Mean Area ± SD) (n = 6) | %RSD | Inter Analyst (Mean Area ± SD) (n = 6) | %RSD | Intraday Precision (Mean Area ± SD) (n = 6) | %RSD | ||||||
| Analyst 1 | Analyst 2 | Analyst 3 | Day 1 | Day 2 | Day 3 | ||||||
| LQC | 4.8 | 596,769.7 ± 4592.90 | 0.76 | 596,278.4 ± 3545.17 | 0.594 | 590,802.8 ± 5873.30 | 0.994 | ||||
| MQC | 6 | 691,518.4 ± 4491.63 | 0.64 | 690,742.9 ± 4967.83 | 0.719 | 690,659.7 ± 5102.69 | 0.738 | ||||
| HQC | 7.2 | 840,356.3 ± 9244.59 | 1.10 | 843,885.7 ± 7510.50 | 0.889 | 870,089.2 ± 6965.64 | 0.800 | ||||
| Variable | Value (mL/min) | Concentration (µg/mL) | (Mean Area ± SD) (n = 6) | %RSD | (Mean Rt ± SD) (n = 6) | %RSD |
|---|---|---|---|---|---|---|
| Flow rate (mL/min) | 0.6 | 6 | 886,757.4 ±11,624.23 | 1.310 | 6.9 ± 0.02 | 0.403 |
| 0.8 | 6 | 648,420.8 ± 5814.92 | 0.896 | 5.1 ± 0.03 | 0.756 | |
| 1 | 6 | 607,624.1 ± 2930.18 | 0.482 | 4.1 ± 0.05 | 1.212 | |
| Wavelength | 365 | 6 | 613,765.6 ± 2492.74 | 0.400 | 5.1 ± 0.04 | 0.931 |
| 370 | 6 | 690,351.9 ± 5983.36 | 0.931 | 5.1 ± 0.03 | 0.588 | |
| 375 | 6 | 706,587.3 ± 6579.47 | 0.931 | 5.1 ± 0.05 | 1.000 |
| Parameter | Value | Limit |
|---|---|---|
| Tailing factor | 0.991 | <2 |
| Theoretical plate | 4446.667 | >2000 |
| HETP | 31.7 | Depends on theoretical plate |
| Peak purity index | 0.999 | >0.5 |
| % of XH Entrapped ± SD | % of XH Unentrapped ± SD | % Total Amount of XH Recovered ± SD | % RSD |
|---|---|---|---|
| 75.31 ± 0.17 | 23.83 ± 0.07 | 99.13 ± 0.14 | 0.142 |
| 67.68 ± 0.62 | 33.21 ± 0.23 | 100.9 ± 0.50 | 0.496 |
| 71.5 ± 0.75 | 28.9 ± 0.15 | 100.4 ± 0.60 | 0.599 |
| QTPP Elements | Target | Justification |
|---|---|---|
| Target analyte | XH | HPLC method development for the detection of XH, active analyte in samples |
| Target sample | Active pharmaceutical ingredient (API), SLN | HPLC method development for XH is essential for their detection in API and SLN formulation |
| Sample form | API is in solid form, SLN dispersion | XH API is in solid form |
| Method type | RP-HPLC | In reverse phase chromatography, using a hydrophobic stationary phase offers the benefit of high retention for the majority of high lipophilic drug molecules. XH has high lipophilicity (log p 4.6). As a result, the reverse-phase technique would be more efficient. |
| Instrument requirement | Quaternary pump HPLC system with PDA Detector | Choosing a quaternary pump in comparison to the binary pump, this device delivers great accuracy in mixing mobile phase liquids, whereas PDA detector results in detection of degradants at various wavelengths. |
| Sample characteristic | Liquid sample | The analyte must be prepared in liquid form for quantification and detection by reverse phase chromatography because it must be miscible with the mobile phase. |
| Standard preparation | Standard dilutions of drug | For the separation of drug, the standard dilutions were prepared by using mobile phase mixture. |
| Sample preparation | Weighing, handling, sampling, mixing with solvents | To prepare samples accurate amount of drug should be weighed and mixed with the solvents in order to get stock. Then serial dilutions should be made after sonicating the stock. |
| Method application | For assay of XH | The developed method should be capable of assaying XH in bulk and in various nano lipid based carriers such as SLNs. |
Disclaimer/Publisher’s Note: The statements, opinions and data contained in all publications are solely those of the individual author(s) and contributor(s) and not of MDPI and/or the editor(s). MDPI and/or the editor(s) disclaim responsibility for any injury to people or property resulting from any ideas, methods, instructions or products referred to in the content. |
© 2023 by the authors. Licensee MDPI, Basel, Switzerland. This article is an open access article distributed under the terms and conditions of the Creative Commons Attribution (CC BY) license (https://creativecommons.org/licenses/by/4.0/).
Share and Cite
Harish, V.; Almalki, W.H.; Alshehri, A.; Alzahrani, A.; Gupta, M.M.; Alzarea, S.I.; Kazmi, I.; Gulati, M.; Tewari, D.; Gupta, G.; et al. Quality by Design (QbD) Based Method for Estimation of Xanthohumol in Bulk and Solid Lipid Nanoparticles and Validation. Molecules 2023, 28, 472. https://doi.org/10.3390/molecules28020472
Harish V, Almalki WH, Alshehri A, Alzahrani A, Gupta MM, Alzarea SI, Kazmi I, Gulati M, Tewari D, Gupta G, et al. Quality by Design (QbD) Based Method for Estimation of Xanthohumol in Bulk and Solid Lipid Nanoparticles and Validation. Molecules. 2023; 28(2):472. https://doi.org/10.3390/molecules28020472
Chicago/Turabian StyleHarish, Vancha, Waleed Hassan Almalki, Ahmed Alshehri, Abdulaziz Alzahrani, Madan Mohan Gupta, Sami I. Alzarea, Imran Kazmi, Monica Gulati, Devesh Tewari, Gaurav Gupta, and et al. 2023. "Quality by Design (QbD) Based Method for Estimation of Xanthohumol in Bulk and Solid Lipid Nanoparticles and Validation" Molecules 28, no. 2: 472. https://doi.org/10.3390/molecules28020472
APA StyleHarish, V., Almalki, W. H., Alshehri, A., Alzahrani, A., Gupta, M. M., Alzarea, S. I., Kazmi, I., Gulati, M., Tewari, D., Gupta, G., Dua, K., & Singh, S. K. (2023). Quality by Design (QbD) Based Method for Estimation of Xanthohumol in Bulk and Solid Lipid Nanoparticles and Validation. Molecules, 28(2), 472. https://doi.org/10.3390/molecules28020472


