
Integrated Structural, Functional, and ADMET Analysis of 2-Methoxy-4,6-diphenylnicotinonitrile: The Convergence of X-ray Diffraction, Molecular Docking, Dynamic Simulations, and Advanced Computational Insights


Abstract
:1. Introduction
2. Results and Discussion
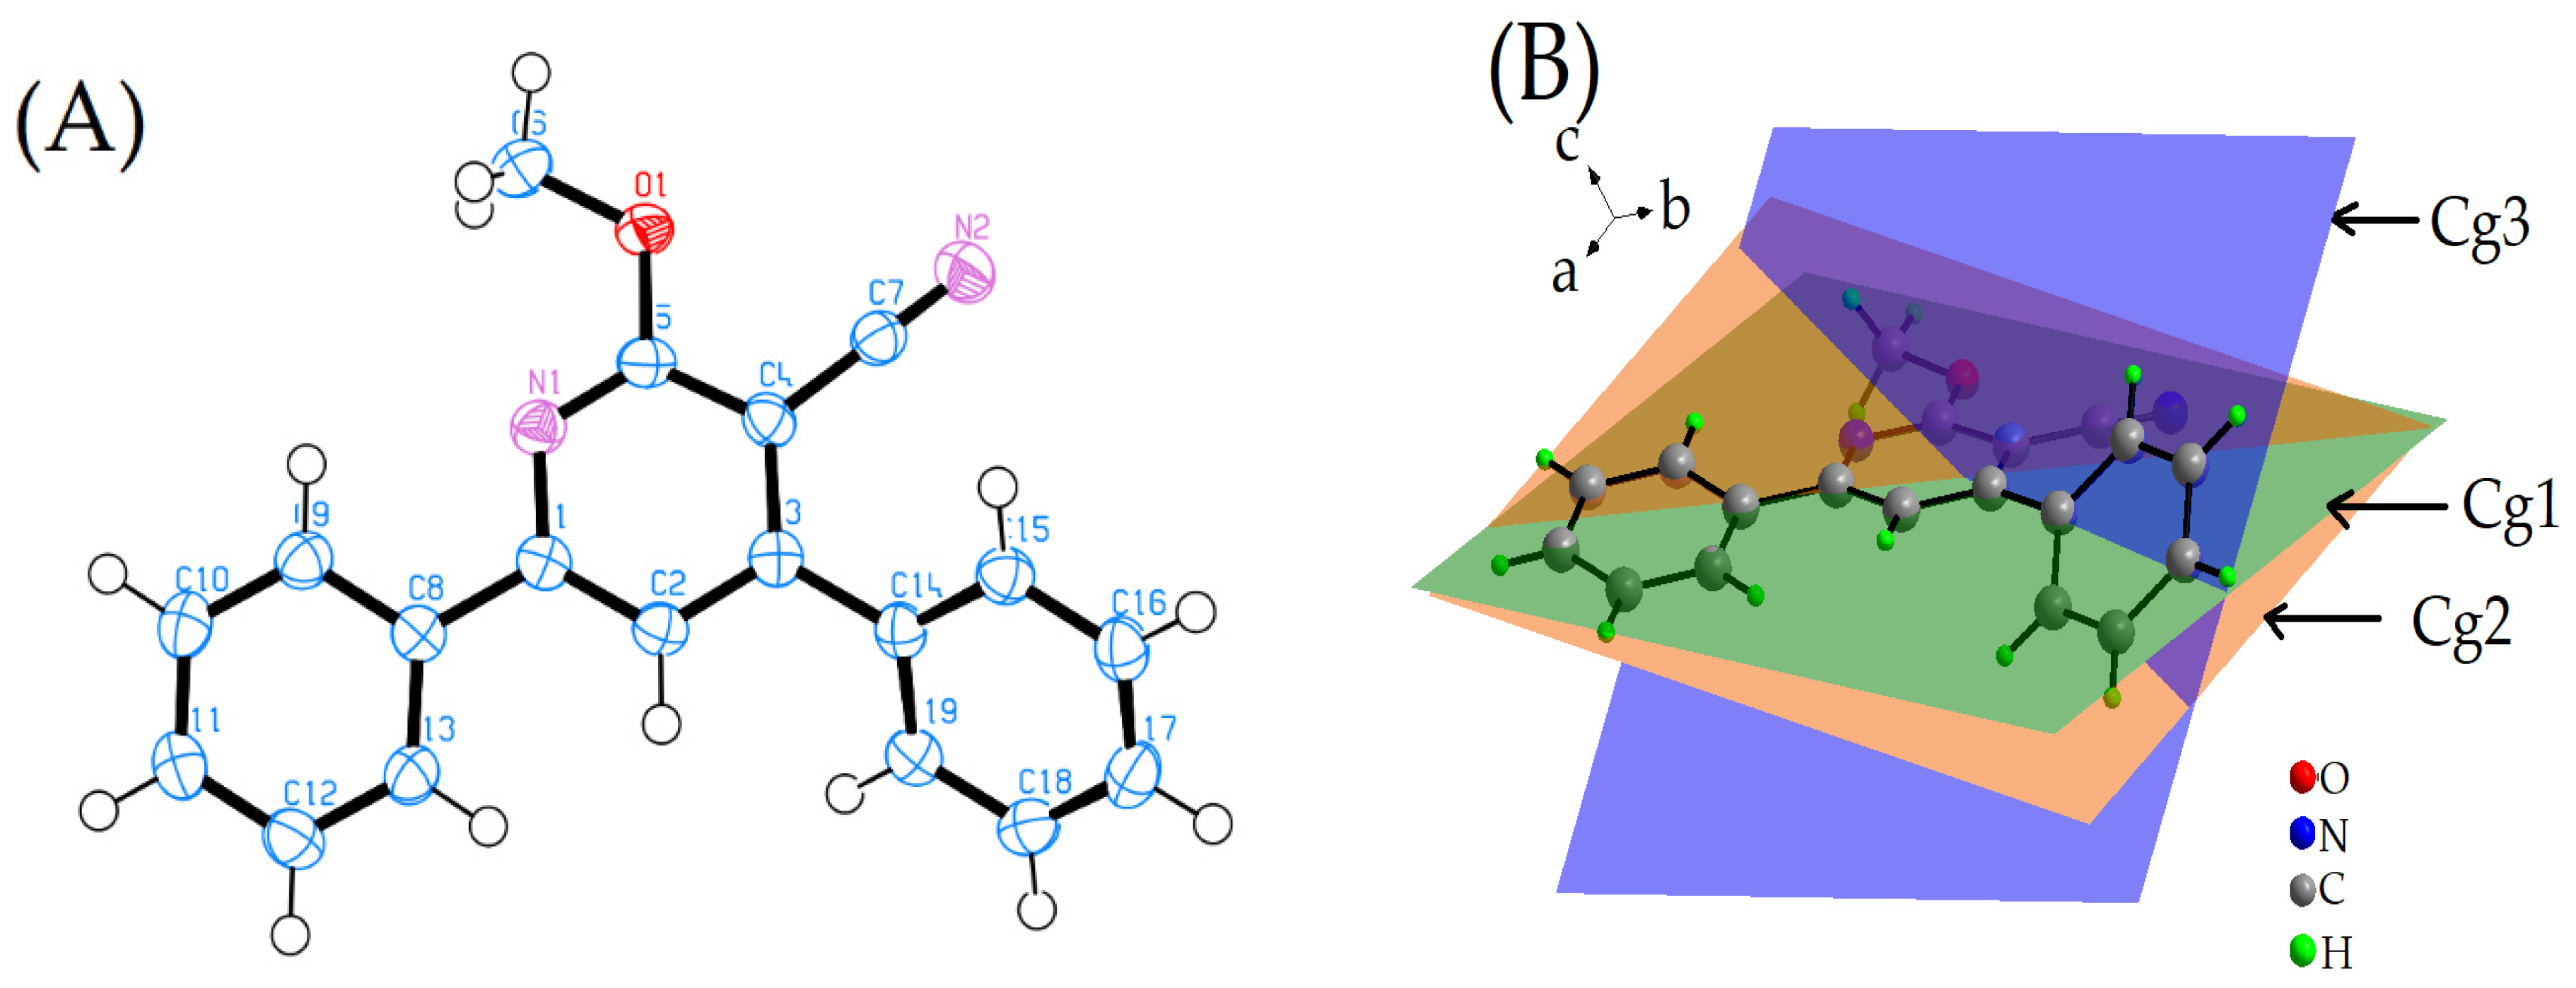
2.1. Description of the X-ray Crystal Structure
2.2. Hirshfeld Surface Calculations
2.2.1. Dnorm
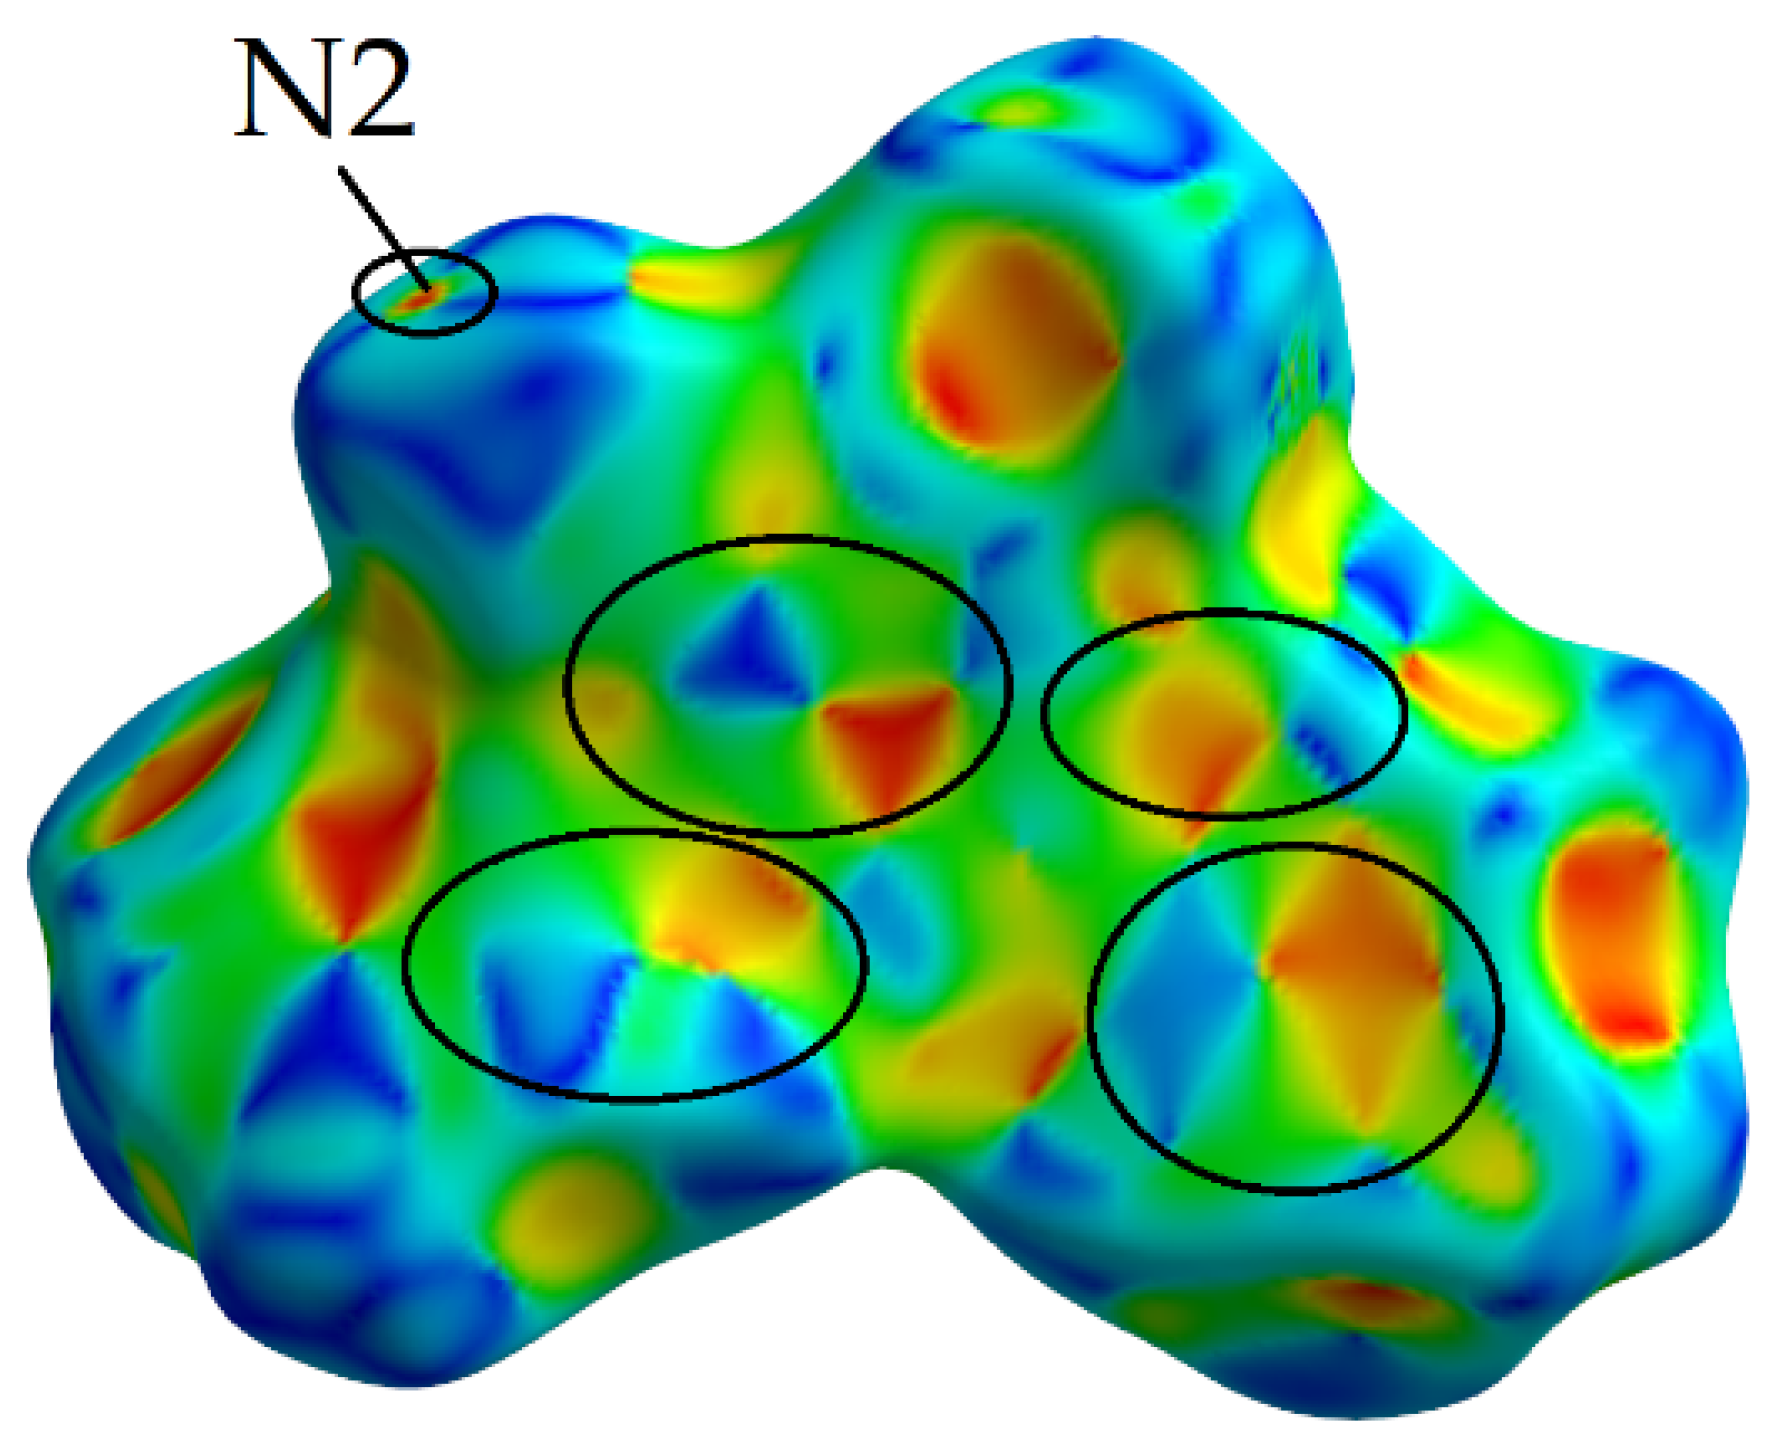
2.2.2. De and Di
2.2.3. Curvedness
Shape Index
2.2.4. The Fragment Patch
2.2.5. Two-Dimensional Fingerprint Plots
2.3. Energy Frameworks
- For the π–π stacking interaction, the electrostatic term is −2.01, while the dispersion term significantly contributes with a value of −95.96. The combination of both these interactions leads to a substantial total energy term of −54.31. This suggests that the π–π stacking interaction is predominantly stabilized by the dispersion forces, which are known to be critical for π systems. While the electrostatic contribution is minimal in this context, it still plays a role in determining the overall energy of the interaction.
- For the weak intermolecular interactions involving N2, the electrostatic contribution is −13.63, which is notably higher in magnitude than that observed for π–π stacking. The dispersion term for this interaction is −28.74, which, while still significant, is considerably less dominant than its counterpart in the π–π stacking. The total energy term for this interaction is −27.85, indicating that both electrostatic and dispersion interactions are nearly equally contributing to the stability of these weak intermolecular contacts.
2.4. Density Functional Theory (DFT) Computations
2.4.1. Optimization of the Structure
2.4.2. Global Reactivity Descriptors for the Investigated Compound
2.4.3. Analysis of Local Reactivity Indices for the Examined Molecule
2.4.4. Frontier Molecular Orbitals (FMOs)
2.4.5. Evaluating the Aromaticity and π–π Stacking Capability of the Analyzed Molecule
2.4.6. Electrostatic Potential Representation of the Molecule (MEP)
2.5. Molecular Docking Studies
2.6. Molecular Dynamic Simulation
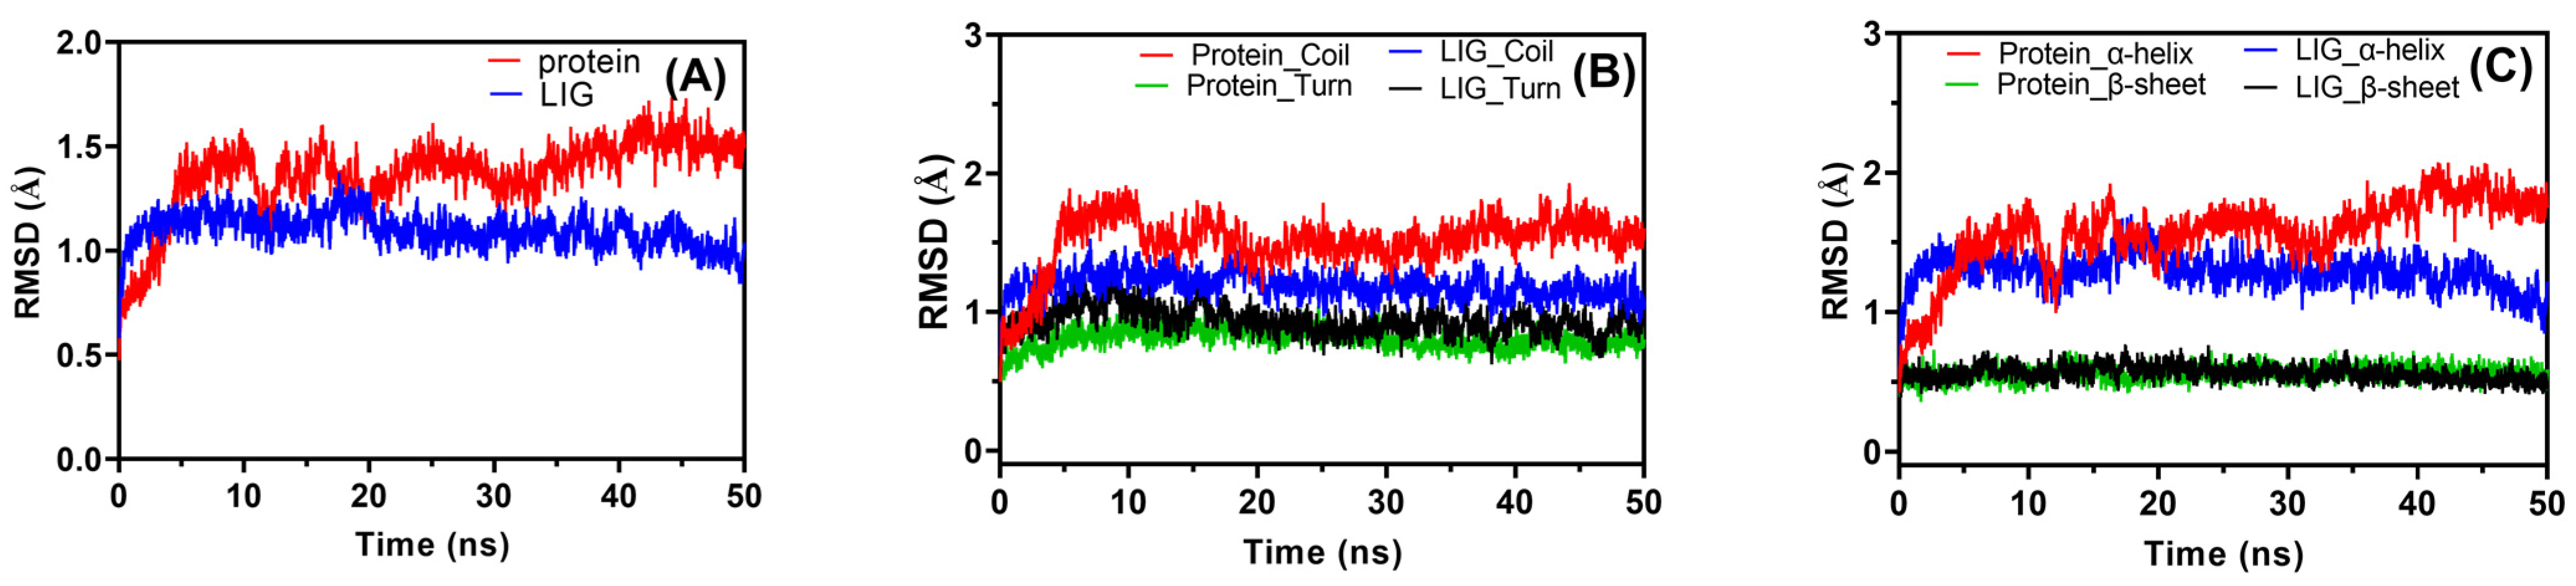
2.6.1. Root Mean Square Deviation (RMSD)
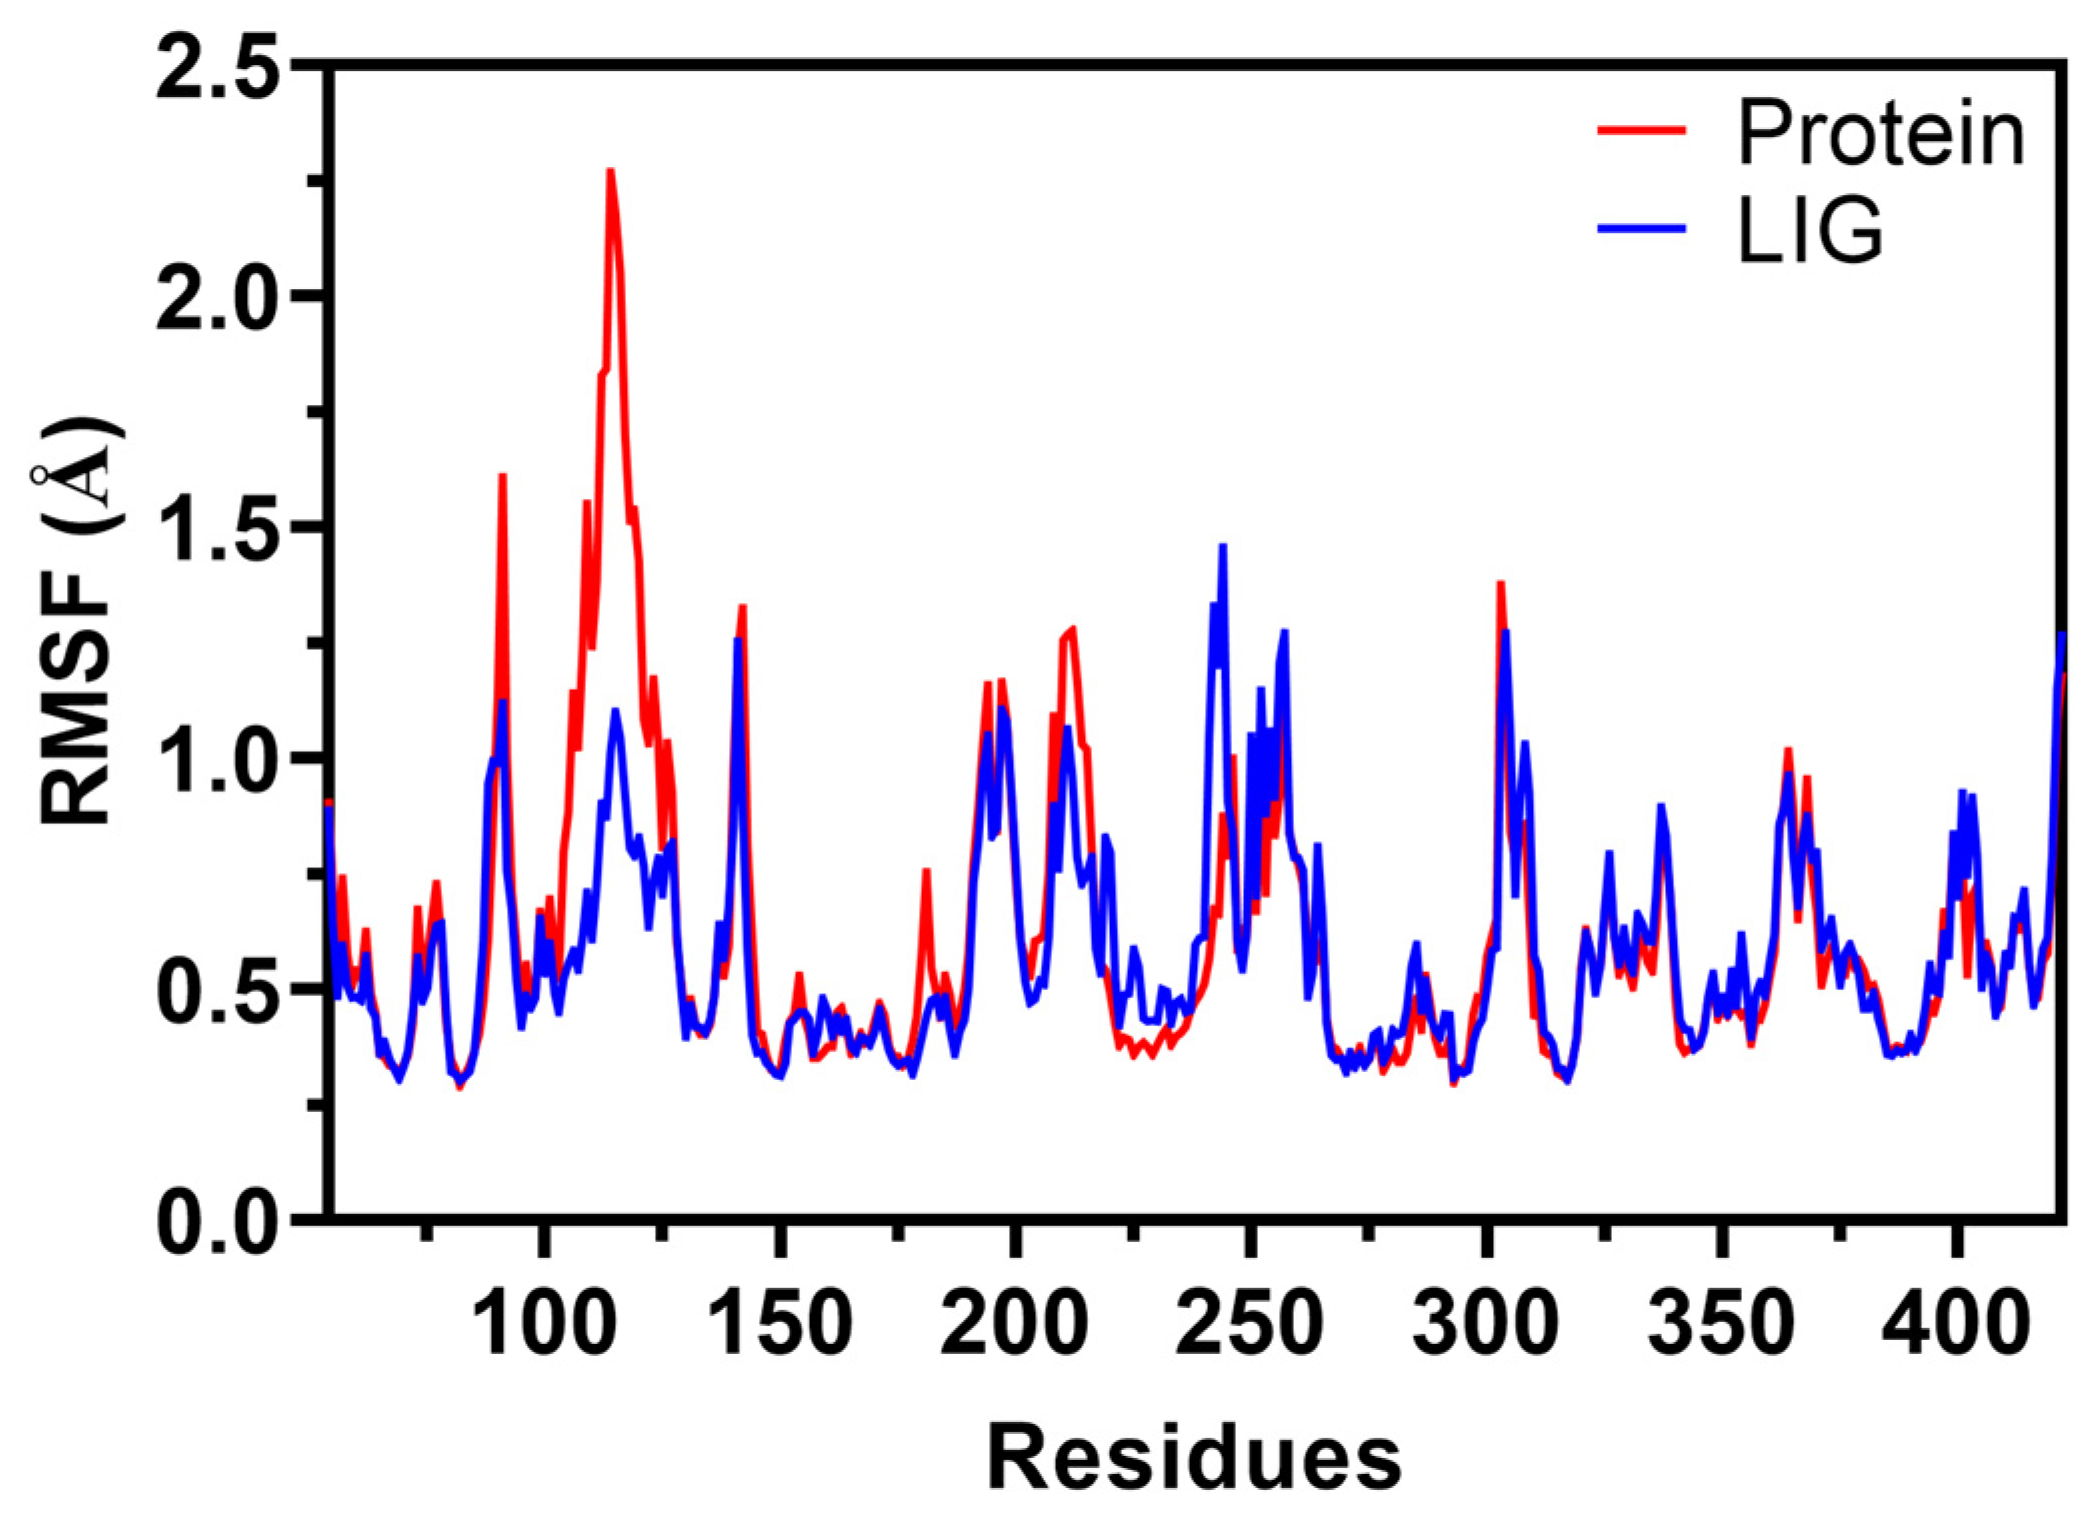
2.6.2. Root Mean Square Fluctuations (RMSF)
2.6.3. Radius of Gyration (Rg)
2.6.4. Hydrogen Bond Analysis
2.7. ADMET and Physicochemical Property Prediction
2.7.1. Physicochemical Properties of 2-Methoxy-4,6-Diphenylnicotinonitrile
2.7.2. ADMET Prediction of 2-Methoxy-4,6-Diphenylnicotinonitrile
3. Materials and Methods
3.1. Synthesis
3.2. Single-Crystal X-ray Diffraction
4. Computational Details
4.1. Hirshfeld Surfaces
4.2. Density Functional Theory (DFT) Calculations
5. In Silico Methods
5.1. Molecular Docking
5.2. Molecular Dynamic Simulation
5.3. Drug-Likeness and ADMET Prediction
6. Conclusions
Author Contributions
Funding
Institutional Review Board Statement
Informed Consent Statement
Data Availability Statement
Acknowledgments
Conflicts of Interest
References
- Perez-Medina, L.; Mariella, R.; McElvain, S. The Preparation and Reactions of Some Polysubstituted Pyridines. 2-Methyl-3-hydroxy-5-hydroxymethylpyridine (4-Deshydroxymethylpyridoxin). J. Am. Chem. Soc. 1947, 69, 2574–2579. [Google Scholar] [CrossRef]
- Upton, C.; Osborne, R.H.; Jaffar, M. Conformationally-restricted ligands for the histamine H1 receptor. Bioorg. Med. Chem. Lett. 2000, 10, 1277–1279. [Google Scholar] [CrossRef]
- Rakshin, S.O.; Odin, I.S.; Sosnin, I.M.; Zatynatskiy, E.A.; Ostapenko, G.I.; Golovanov, A.A. Synthesis and fluorescence properties of nicotinonitrile 1, 2, 3-triazole derivatives. Russ. Chem. Bull. 2018, 67, 1710–1715. [Google Scholar] [CrossRef]
- Kotb, E.R.; El-Hashash, M.A.; Salama, M.A.; Kalf, H.S.; Abdel Wahed, N.A.M. Synthesis and reactions of some novel nicotinonitrile derivatives for anticancer and antimicrobial evaluation. Acta Chim. Slov. 2009, 56, 908–919. [Google Scholar]
- El-Sayed, H.A.; Hamid, A.M.A.; Mohammed, S.M.; Moustafa, A.H. Design, synthesis, and antimicrobial activity of fluorophore 1,2,3-triazoles linked nicotinonitrile derivatives. Synth. Commun. 2019, 49, 2096–2105. [Google Scholar] [CrossRef]
- Zhang, F.; Zhao, Y.; Sun, L.; Ding, L.; Gu, Y.; Gong, P. Synthesis and anti-tumor activity of 2-amino-3-cyano-6-(1H-indol-3-yl)-4-phenylpyridine derivatives in vitro. Eur. J. Med. Chem. 2011, 46, 3149–3157. [Google Scholar] [CrossRef] [PubMed]
- Shamroukh, A.H.; El-Shahat, M.; Drabowicz, J.; Ali, M.M.; Rashad, A.E.; Ali, H.S. Anticancer evaluation of some newly synthesized N-nicotinonitrile derivative. Eur. J. Med. Chem. 2013, 69, 521–526. [Google Scholar] [CrossRef]
- Bekhit, A.A.; Baraka, A.M. Novel milrinone analogs of pyridine-3-carbonitrile derivatives as promising cardiotonic agents. Eur. J. Med. Chem. 2005, 40, 1405–1413. [Google Scholar] [CrossRef] [PubMed]
- Rashad, A.E.; Shamroukh, A.H.; El-Hashash, M.A.; El-Farargy, A.F.; Yousif, N.M.; Salama, M.A.; Mostafa, A.; El-Shahat, M. Synthesis and anti-avian influenza virus (H5N1) evaluation of some novel nicotinonitriles and their N-acylic nucleosides. J. Heterocycl. Chem. 2012, 49, 1130–1135. [Google Scholar] [CrossRef]
- Siddiqui, N.; Ahsan, W.; Alam, M.S.; Ali, R.; Srivastava, K.; Ahmed, S. Anticonvulsant activity of a combined pharmacophore of pyrazolo-pyridines with Lesser toxicity in mice. Bull. Korean Chem. Soc. 2011, 32, 576–582. [Google Scholar] [CrossRef]
- Jackson, M.R.; Cox, K.D.; Baugh, S.D.P.; Wakeen, L.; Rashad, A.A.; Lam, P.Y.S.; Polyak, B.; Jorns, M.S. Discovery of a first-in-class inhibitor of sulfide: Quinone oxidoreductase that protects against adverse cardiac remodelling and heart failure. Cardiovasc. Res. 2022, 118, 1771–1784. [Google Scholar] [CrossRef] [PubMed]
- Girgis, A.S.; Kalmouch, A.; Hosni, H.M. Synthesis of novel 3-pyridinecarbonitriles with amino acid function and their fluorescence properties. Amino Acids 2004, 26, 139–146. [Google Scholar] [CrossRef] [PubMed]
- Suwunwong, T.; Chantrapromma, S.; Fun, H.-K. Synthesis, Characterization, Crystal Structure, TGA and Blue Fluorescence of 6-(4-Chlorophenyl)-4-(4-methoxyphenyl)-2-methoxynicotinonitrile. J. Chem. Crystallogr. 2013, 43, 538–543. [Google Scholar] [CrossRef]
- Raghukumar, V.; Thirumalai, D.; Ramakrishnan, V.; Karunakara, V.; Ramamurthy, P. Ramamurthy, Synthesis of nicotinonitrile derivatives as a new class of NLO materials. Tetrahedron 2003, 59, 3761–3768. [Google Scholar] [CrossRef]
- Ahipa, T.N.; Kumar, V.; Adhikari, A.V. New columnar liquid crystal materials based on luminescent 2-methoxy-3-cyanopyridines. Struct. Chem. 2014, 25, 1165–1174. [Google Scholar] [CrossRef]
- Koner, R.R.; Sinha, S.; Kumar, S.; Nandi, C.K.; Ghosh, S. 2-Aminopyridine derivative as fluorescence ‘On–Off’molecular switch for selective detection of Fe3+/Hg2+. Tetrahedron Lett. 2012, 53, 2302–2307. [Google Scholar] [CrossRef]
- Liu, W.; Chen, Z.; Zheng, C.-J.; Liu, X.-K.; Wang, K.; Li, F.; Dong, Y.-P.; Ou, X.-M.; Zhang, X.-H. A novel nicotinonitrile derivative as an excellent multifunctional blue fluorophore for highly efficient hybrid white organic light-emitting devices. J. Mater. Chem. C 2015, 3, 8817–8823. [Google Scholar] [CrossRef]
- Gökce, H.; Sert, Y.; Alpaslan, G.; El-Azab, A.S.; Alanazi, M.M.; Al-Agamy, M.H.; Abdel-Aziz, A.A.M. Hirshfeld Surface, Molecular Docking Study, Spectroscopic Characterization and NLO Profile of 2-Methoxy-4, 6-Diphenylnicotinonitrile. ChemistrySelect 2019, 4, 9857–9870. [Google Scholar] [CrossRef]
- Clegg, W. X-ray Crystallography; Oxford University Press: New York, NY, USA, 2015; Volume 60. [Google Scholar]
- Spackman, M.A.; Jayatilaka, D. Hirshfeld surface analysis. CrystEngComm 2009, 11, 19–32. [Google Scholar] [CrossRef]
- Desiraju, G.R. Supramolecular synthons in crystal engineering—A new organic synthesis. Angew. Chem. Int. Ed. Engl. 1995, 34, 2311–2327. [Google Scholar] [CrossRef]
- Zhang, Y.; Pan, W.; Yang, W. Describing van der Waals Interaction in diatomic molecules with generalized gradient approximations: The role of the exchange functional. J. Chem. Phys. 1997, 107, 7921–7925. [Google Scholar] [CrossRef]
- Chai, J.-D.; Head-Gordon, M. Systematic optimization of long-range corrected hybrid density functionals. J. Chem. Phys. 2008, 128, 084106. [Google Scholar] [CrossRef] [PubMed]
- Mague, J.T.; Abdel-Aziz, A.-M.; El-Azab, A.S.; Al-Swaidan, I.A. 2-Methoxy-4,6-diphenylnicotinonitrile. Acta Crystallogr. Sect. E Struct. Rep. Online 2014, 70, o228. [Google Scholar] [CrossRef] [PubMed]
- Meyer, A. The size of molecules. Chem. Soc. Rev. 1986, 15, 449–474. [Google Scholar] [CrossRef]
- Chavez-Urias, I.F.; López-González, L.E.; Plascencia-Martínez, D.F.; García, J.J.; Flores-Alamo, M.; Sugich-Miranda, R.; Medrano, F.; Picos-Corrales, L.A.; López-Gastélum, K.-A.; Velázquez-Contreras, E.F.; et al. l-Isoleucine-Schiff Base Copper(II) Coordination Polymers: Crystal Structure, Spectroscopic, Hirshfeld Surface, and DFT Analyses. ACS Omega 2023, 8, 24601–24614. [Google Scholar] [CrossRef] [PubMed]
- Soman, R.; Sujatha, S.; Arunkumar, C. Quantitative crystal structure analysis of fluorinated porphyrins. J. Fluor. Chem. 2014, 163, 16–22. [Google Scholar] [CrossRef]
- Bakheit, A.H.; Abuelizz, H.A.; Al-Salahi, R. A DFT Study and Hirshfeld Surface Analysis of the Molecular Structures, Radical Scavenging Abilities and ADMET Properties of 2-Methylthio (methylsulfonyl)-[1,2,4] triazolo [1,5-a] quinazolines: Guidance for Antioxidant Drug Design. Crystals 2023, 13, 1086. [Google Scholar] [CrossRef]
- Bakheit, A.H.; Al-Salahi, R.; Ghabbour, H.A.; Ali, E.A.; AlRuqi, O.S.; Mostafa, G.A.E. Synthesis, X-ray Crystal Structure, and Computational Characterization of Tetraphenylborate, 3-(5H-Dibenzo[a,d] cyclohepten-5-ylidene)-N,N-Dimethyl-1-propanamine. Crystals 2023, 13, 1088. [Google Scholar] [CrossRef]
- Bakheit, A.H.; Attwa, M.W.; Kadi, A.A.; Ghabbour, H.A.; Alkahtani, H.M. Alkahtani, Exploring the Chemical Reactivity, Molecular Docking, Molecular Dynamic Simulation and ADMET Properties of a Tetrahydrothienopyridine Derivative Using Computational Methods. Crystals 2023, 13, 1020. [Google Scholar] [CrossRef]
- Osman, U.M.; Silvarajoo, S.; Noor Hassim, M.F.; Arshad, S.; Anizaim, A.H.; Abdul Razak, F.I. Synthesis, X-Ray Structure, Hirshfeld Surface Analysis, DFT Calculations, and Molecular Docking Studies of Nickel (II) Complex with Thiosemicarbazone Derivative. Bioinorg. Chem. Appl. 2021, 2021, 1–11. [Google Scholar] [CrossRef] [PubMed]
- Balakrishnan, C.; Manonmani, M.; Sivaraman, S.; Markkandan, R.; Ahamed, S.R.; Vinitha, G.; Meenakshisundaram, S.; Sockalingam, R. Multiple strong hydrogen bonded supramolecular cocrystals of 18-crown-6 with 5-nitroisophthalic acid: Solvent effect and optical nonlinearities. J. Mol. Struct. 2020, 1201, 127158. [Google Scholar] [CrossRef]
- Mackenzie, C.F.; Spackman, P.R.; Jayatilaka, D.; Spackman, M.A. CrystalExplorer model energies and energy frameworks: Extension to metal coordination compounds, organic salts, solvates and open-shell systems. IUCrJ 2017, 4, 575–587. [Google Scholar] [CrossRef] [PubMed]
- Bakheit, A.H.; Al-Salahi, R.; Al-Majed, A.A. Thermodynamic and Computational (DFT) Study of Non-Covalent Interaction Mechanisms of Charge Transfer Complex of Linagliptin with 2,3-Dichloro-5,6-dicyano-1,4-benzoquinone (DDQ) and Chloranilic acid (CHA). Molecules 2022, 27, 6320. [Google Scholar] [CrossRef]
- Abuelizz, H.A.; Taie, H.A.A.; Bakheit, A.H.; Marzouk, M.; Abdellatif, M.M.; Al-Salahi, R. Biological Evaluation of 4-(1H-triazol-1-yl)benzoic Acid Hybrids as Antioxidant Agents: In Vitro Screening and DFT Study. Appl. Sci. 2021, 11, 11642. [Google Scholar] [CrossRef]
- Abuelizz, H.A.; Taie, H.A.A.; Bakheit, A.H.; Mostafa, G.A.E.; Marzouk, M.; Rashid, H.; Al-Salahi, R. Investigation of 4-Hydrazinobenzoic Acid Derivatives for Their Antioxidant Activity: In Vitro Screening and DFT Study. ACS Omega 2021, 6, 31993–32004. [Google Scholar] [CrossRef]
- Ghabbour, H.A.; Bakheit, A.H.; Ezzeldin, E.; Mostafa, G.A.E. Synthesis Characterization and X-ray Structure of 2-(2,6-Dichlorophenylamino)-2-imidazoline Tetraphenylborate: Computational Study. Appl. Sci. 2022, 12, 3568. [Google Scholar] [CrossRef]
- McKinnon, J.J.; Spackman, M.A.; Mitchell, A.S. Novel tools for visualizing and exploring intermolecular interactions in molecular crystals. Acta Crystallogr. Sect. B 2004, 60, 627–668. [Google Scholar] [CrossRef]
- Jeffrey, G.A. An Introduction to Hydrogen Bonding; Oxford University Press: New York, NY, USA, 1997; Volume 12. [Google Scholar]
- Nishio, M. CH/π Hydrogen Bonds in Crystals. CrystEngComm 2004, 6, 130–158. [Google Scholar] [CrossRef]
- Hajji, M.; Mtiraoui, H.; Amiri, N.; Msaddek, M.; Guerfel, T. Crystallographic and first-principles density functional theory study on the structure, noncovalent interactions, and chemical reactivity of 1,5-benzodiazepin-2-ones derivatives. Int. J. Quantum Chem. 2019, 119, e26000. [Google Scholar] [CrossRef]
- Gonthier, J.F.; Steinmann, S.N.; Roch, L.; Ruggi, A.; Luisier, N.; Severin, K.; Corminboeuf, C. π-Depletion as a criterion to predict π-stacking ability. Chem. Commun. 2012, 48, 9239–9241. [Google Scholar] [CrossRef]
- Bakheit, A.H.; Abuelizz, H.A.; Al-Salahi, R. Hirshfeld Surface Analysis and Density Functional Theory Calculations of 2-Benzyloxy-1,2,4-triazolo[1,5-a] quinazolin-5(4H)-one: A Comprehensive Study on Crystal Structure, Intermolecular Interactions, and Electronic Properties. Crystals 2023, 13, 1410. [Google Scholar] [CrossRef]
- Mostafa, G.A.; Bakheit, A.; AlMasoud, N.; AlRabiah, H. Charge Transfer Complexes of Ketotifen with 2,3-Dichloro-5,6-dicyano-p-benzoquinone and 7,7,8,8-Tetracyanoquodimethane: Spectroscopic Characterization Studies. Molecules 2021, 26, 2039. [Google Scholar] [CrossRef] [PubMed]
- Hemanth Kumar, P.; Srikanth, A.; Kumari, G.S.; Ravi, L.; Sarveswari, S.; Vijayakumar, V. One Pot Synthesis of “3-(4, 5-Diphenyl-1 H-Imidazol-2-yl)-2-Phenoxyquinolines” and Their Potential as α-Glucosidase Inhibitors: Molecular Docking and MDS Investigation. Polycycl. Aromat. Compd. 2023, 1–22. [Google Scholar] [CrossRef]
- Al-Arab, M.M. A facile synthesis of 6-alkoxy-2,4-diaryl-5-cyanopyridine. J. Heterocycl. Chem. 1989, 26, 1665–1673. [Google Scholar] [CrossRef]
- Sheldrick, G.M. Crystal structure refinement with SHELXL. Acta Crystallogr. Sect. C Struct. Chem. 2015, 71, 3–8. [Google Scholar] [CrossRef] [PubMed]
- Dolomanov, O.V.; Bourhis, L.J.; Gildea, R.J.; Howard, J.A.; Puschmann, H. OLEX2: A complete structure solution, refinement and analysis program. J. Appl. Crystallogr. 2009, 42, 339–341. [Google Scholar] [CrossRef]
- Macrae, C.F.; Edgington, P.R.; McCabe, P.; Pidcock, E.; Shields, G.P.; Taylor, R.; Towler, M.; van de Streek, J. Streek, Mercury: Visualization and analysis of crystal structures. J. Appl. Crystallogr. 2006, 39, 453–457. [Google Scholar] [CrossRef]
- Brandenburg, K.; Berndt, M. Diamond, Version 2.1; Crystal Impact GbR: Bonn, Germany, 1999.
- Farrugia, L.J. ORTEP-3 for Windows-a version of ORTEP-III with a Graphical User Interface (GUI). J. Appl. Crystallogr. 1997, 30, 565. [Google Scholar] [CrossRef]
- Bakheit, A.H.; Attwa, M.W.; Kadi, A.A.; Alkahtani, H.M. Structural Analysis and Reactivity Insights of (E)-Bromo-4-((4-((1-(4-chlorophenyl)ethylidene)amino)-5-phenyl-4H-1,2,4-triazol-3-yl)thio)-5-((2-isopropylcyclohexyl)oxy) Furan-2(5H)-one: A Combined Approach Using Single-Crystal X-ray Diffraction, Hirshfeld Surface Analysis, and Conceptual Density Functional Theory. Crystals 2023, 13, 1313. [Google Scholar]
- McKinnon, J.J.; Jayatilaka, D.; Spackman, M.A. Towards quantitative analysis of intermolecular interactions with Hirshfeld surfaces. Chem. Commun. 2007, 37, 3814–3816. [Google Scholar] [CrossRef]
- Sreenatha, N.R.; Chakravarthy, A.S.J.; Suchithra, B.; Lakshminarayana, B.N.; Hariprasad, S.; Ganesha, D. Crystal, spectral characterization, molecular docking, Hirshfeld computational studies and 3D-energy framework analysis of a novel puckered compound (C14H15Cl O): 2-Chloro-3-phenyl-5, 5-dimethylcyclohex-2-en-1-one. J. Mol. Struct. 2020, 1210, 127979. [Google Scholar] [CrossRef]
- Arulraj, R.; Sivakumar, S.; Suresh, S.; Anitha, K. Synthesis, vibrational spectra, DFT calculations, Hirshfeld surface analysis and molecular docking study of 3-chloro-3-methyl-2,6-diphenylpiperidin-4-one. Spectrochim. Acta Part A Mol. Biomol. Spectrosc. 2020, 232, 118166. [Google Scholar] [CrossRef]
- Jeroundi, D.; Sebbar, N.K.; Hökelek, T.; Rodi, Y.K.; Mazzah, A.; Renard, C.; Chakroune, S. Crystal structure, Hirshfeld surface analysis and interaction energy and DFT studies of 10-allyl-pyrrolo [2,1-c][1,4] benzodiazepine-5,11-dione. Moroc. J. Heterocycl. Chem. 2020, 19, 43–54. [Google Scholar]
- Shit, S.; Marschner, C.; Mitra, S. Synthesis, Crystal structure, and Hirshfeld Surface Analysis of a New Mixed Ligand Copper (II) Complex. Acta Chim. Slov. 2016, 63, 129–137. [Google Scholar]
- Spackman, M.A.; McKinnon, J.J. Fingerprinting intermolecular interactions in molecular crystals. CrystEngComm 2002, 4, 378–392. [Google Scholar] [CrossRef]
- Spackman, P.R.; Turner, M.J.; McKinnon, J.J.; Wolff, S.K.; Grimwood, D.J.; Jayatilaka, D.; Spackman, M.A. CrystalExplorer: A program for Hirshfeld surface analysis, visualization and quantitative analysis of molecular crystals. J. Appl. Crystallogr. 2021, 54, 1006–1011. [Google Scholar] [CrossRef]
- Jayatilaka, D.; Grimwood, D.J. Tonto: A fortran based object-oriented system for quantum chemistry and crystallography. In International Conference on Computational Science; Springer: Berlin/Heidelberg, Germany, 2003. [Google Scholar]
- Bond, A.D. ProcessPIXEL: A program to generate energy-vector models from Gavezzotti’s PIXEL calculations. J. Appl. Crystallogr. 2014, 47, 1777–1780. [Google Scholar] [CrossRef]
- Shishkin, O.V.; Dyakonenko, V.V.; Maleev, A.V.; Schollmeyer, D.; Vysotsky, M.O. Columnar supramolecular architecture of crystals of 2-(4-Iodophenyl)-1, 10-phenanthroline derived from values of intermolecular interaction energy. CrystEngComm 2011, 13, 800–805. [Google Scholar] [CrossRef]
- Kumara, K.; Dileep Kumar, A.; Naveen, S.; Ajay Kumar, K.; Lokanath, N.K. Synthesis, spectral characterization and X-ray crystal structure studies of 3-(benzo[d][1,3]dioxol-5-yl)-5-(3-methylthiophen-2-yl)-4,5-dihydro-1H-pyrazole-1-carboxamide: Hirshfeld surface, DFT and thermal analysis. J. Mol. Struct. 2018, 1161, 285–298. [Google Scholar] [CrossRef]
- Turner, M.J.; McKinnon, J.J.; Jayatilaka, D.; Spackman, M.A. Visualisation and characterisation of voids in crystalline materials. CrystEngComm 2011, 13, 1804–1813. [Google Scholar] [CrossRef]
- Frisch, M.J.T.; Schlegel, G.W.; Scuseria, H.B.; Robb, G.E.; Cheeseman, M.A.; Scalmani, J.R.; Barone, G.; Mennucci, V.; Petersson, B.; Nakatsuji, H.; et al. Gaussian 09, Revision D.01; Gaussian Inc.: Wallingford, CT, USA, 2009; Volume 123, pp. 150–166. [Google Scholar]
- Dennington, R.; Keith, T.; Millam, J.; Semichem Inc. GaussView, Version 6.1; Semichem Inc.: Shawnee Mission, KS, USA, 2016.
- Zhang, I.Y.; Wu, J.; Xu, X. Extending the reliability and applicability of B3LYP. Chem. Commun. 2010, 46, 3057–3070. [Google Scholar] [CrossRef]
- Shukla, A.; Khan, E.; Srivastava, K.; Sinha, K.; Tandon, P.; Vangala, V.R. Study of molecular interactions and chemical reactivity of the nitrofurantoin–3-aminobenzoic acid cocrystal using quantum chemical and spectroscopic (IR, Raman, 13 C SS-NMR) approaches. CrystEngComm 2017, 19, 3921–3930. [Google Scholar] [CrossRef]
- Mostafa, G.A.E.; Bakheit, A.H.; Al-Agamy, M.H.; Al-Salahi, R.; Ali, E.A.; Alrabiah, H. Synthesis of 4-Amino-N-[2(diethylamino)Ethyl]Benzamide Tetraphenylborate Ion-Associate Complex: Characterization, Antibacterial and Computational Study. Molecules 2023, 28, 2256. [Google Scholar] [CrossRef] [PubMed]
- Bakheit, A.H.; Ghabbour, H.A.; Hussain, H.; Al-Salahi, R.; Ali, E.A.; Mostafa, G.A.E. Synthesis and Computational and X-ray Structure of 2, 3, 5-Triphenyl Tetrazolium, 5-Ethyl-5-phenylbarbituric Acid Salt. Crystals 2022, 12, 1706. [Google Scholar] [CrossRef]
- Lu, T.; Chen, F. Multiwfn: A multifunctional wavefunction analyzer. J. Comput. Chem. 2012, 33, 580–592. [Google Scholar] [CrossRef] [PubMed]
- Domingo, L.R.; Ríos-Gutiérrez, M.; Pérez, P. Applications of the conceptual density functional theory indices to organic chemistry reactivity. Molecules 2016, 21, 748. [Google Scholar] [CrossRef]
- Geerlings, P.; De Proft, F.; Langenaeker, W. Conceptual density functional theory. Chem. Rev. 2003, 103, 1793–1874. [Google Scholar] [CrossRef]
- Liu, S.-B. Conceptual density functional theory and some recent developments. Acta Phys. Chim. Sin. 2009, 25, 590–600. [Google Scholar]
- Bayrakdar, A.; Kart, H.H.; Elcin, S.; Deligoz, H.; Karabacak, M. Synthesis and DFT calculation of a novel 5,17-di (2-antracenylazo)-25,27-di (ethoxycarbonylmethoxy)-26,28-dihydroxycalix [4] arene. Spectrochim. Acta Part A Mol. Biomol. Spectrosc. 2015, 136, 607–617. [Google Scholar] [CrossRef]
- O’boyle, N.M.; Tenderholt, A.L.; Langner, K.M. Cclib: A library for package-independent computational chemistry algorithms. J. Comput. Chem. 2008, 29, 839–845. [Google Scholar] [CrossRef]
- Wong, B.M.; Hsieh, T.H. Optoelectronic and Excitonic Properties of Oligoacenes: Substantial Improvements from Range-Separated Time-Dependent Density Functional Theory. J. Chem. Theory Comput. 2010, 6, 3704–3712. [Google Scholar] [CrossRef] [PubMed]
- Foster, M.E.; Wong, B.M. Nonempirically tuned range-separated DFT accurately predicts both fundamental and excitation gaps in DNA and RNA nucleobases. J. Chem. Theory Comput. 2012, 8, 2682–2687. [Google Scholar] [CrossRef]
- Huang, F.; Hu, H.; Wang, K.; Peng, C.; Xu, W.; Zhang, Y.; Gao, J.; Liu, Y.; Zhou, H.; Huang, R.; et al. Identification of highly selective lipoprotein-associated phospholipase A2 (Lp-PLA2) inhibitors by a covalent fragment-based approach. J. Med. Chem. 2020, 63, 7052–7065. [Google Scholar] [CrossRef] [PubMed]
- Eskandrani, R.; Al-Rasheed, L.S.; Ansari, S.A.; Bakheit, A.H.; Almehizia, A.A.; Almutairi, M.; Alkahtani, H.M. Targeting Transcriptional CDKs 7, 8, and 9 with Anilinopyrimidine Derivatives as Anticancer Agents: Design, Synthesis, Biological Evaluation and In Silico Studies. Molecules 2023, 28, 4271. [Google Scholar] [CrossRef] [PubMed]
- Abuelizz, H.A.; Bakheit, A.H.; Marzouk, M.; El-Senousy, W.M.; Abdellatif, M.M.; Mostafa, G.A.E.; Saquib, Q.; Hassan, S.B.; Al-Salahi, R. Antiviral activity of some benzo [g] quinazolines against coxsackievirus B4: Biological screening and docking study. Pharmacol. Rep. 2023, 75, 962–978. [Google Scholar] [CrossRef] [PubMed]
- Phillips, J.C.; Hardy, D.J.; Maia, J.D.C.; Stone, J.E.; Ribeiro, J.V.; Bernardi, R.C.; Buch, R.; Fiorin, G.; Hénin, J.; Jiang, W.; et al. Scalable molecular dynamics on CPU and GPU architectures with NAMD. J. Chem. Phys. 2020, 153, 044130. [Google Scholar] [CrossRef] [PubMed]
- Jo, S.; Kim, T.; Iyer, V.G.; Im, W. CHARMM-GUI: A web-based graphical user interface for CHARMM. J. Comput. Chem. 2008, 29, 1859–1865. [Google Scholar] [CrossRef] [PubMed]
- Jo, S.; Cheng, X.; Islam, M.S.; Huang, L.; Rui, H.; Zhu, A.; Lee, H.S.; Qi, Y.; Han, W.; Vanommeslaeghe, K.; et al. CHARMM-GUI PDB manipulator for advanced modeling and simulations of proteins containing nonstandard residues. Adv. Protein Chem. Struct. Biol. 2014, 96, 235–265. [Google Scholar]
- Humphrey, W.; Dalke, A.; Schulten, K. VMD: Visual molecular dynamics. J. Mol. Graph. 1996, 14, 33–38. [Google Scholar] [CrossRef]


| Parameter | Data |
|---|---|
| Identification code | 983247 |
| Empirical formula | C19H14N2O |
| Formula weight | 286.32 |
| Temperature/K | 100(2) |
| Crystal system | orthorhombic |
| Space group | P21212 |
| a/Å | 15.0686(16) |
| b/Å | 24.327(3) |
| c/Å | 3.8986(4) |
| α/° | 90.00 |
| β/° | 90.00 |
| γ/° | 90.00 |
| Volume/Å3 | 1429.1(3) |
| Z | 4 |
| ρcalcg/cm3 | 1.331 |
| μ/mm−1 | 0.084 |
| F(000) | 600.0 |
| Crystal size/mm3 | 0.22 × 0.11 × 0.06 |
| Radiation | MoKα (λ = 0.71073) |
| 2Θ range for data collection/° | 3.18 to 56.92 |
| Index ranges | −19 ≤ h ≤ 20, −31 ≤ k ≤ 31, −5 ≤ l ≤ 5 |
| Reflections collected | 12356 |
| Independent reflections | 3344 [Rint = 0.0465, Rsigma = 0.0411] |
| Data/restraints/parameters | 3344/0/200 |
| Goodness-of-fit on F2 | 1.036 |
| Final R indexes [I ≥ 2σ (I)] | R1 = 0.0404, wR2 = 0.0880 |
| Final R indexes [all data] | R1 = 0.0481, wR2 = 0.0933 |
| Largest diff. peak/hole/e Å−3 | 0.20/−0.21 |
| Number | Angle/° | Length/Å | Length-VdW | Symm. op. 1 | Symm. op. 2 | |
|---|---|---|---|---|---|---|
| 1 | H6B⋯H10 | 138.99 | 2.364 | −0.036 | x,y,z | 1 − x,−y,−1 + z |
| 2 | H6A⋯H6A | 149.55 | 2.372 | −0.028 | x,y,z | 1 − x,−y,z |
| 3 | H17⋯C10 | 159.57 | 2.824 | −0.076 | x,y,z | 1.5 − x,1/2 + y,−z |
| 4 | N2⋯H19 | 136.08 | 2.749 | −0.001 | x,y,z | −1/2 + x,1/2 − y,−1 − z |
| 5 | N2⋯H2 | 176.33 | 2.702 | −0.048 | x,y,z | −1/2 + x,1/2 − y,−z |
| 6 | N2⋯H13 | 159.25 | 2.663 | −0.087 | x,y,z | −1/2 + x,1/2 − y,−z |
| 7 | H12⋯H16 | 126 | 2.398 | −0.002 | x,y,z | 1/2 + x,1/2 − y,1 − z |
| Name | Mean+ | Mean− | Pi | Sigma+ | Sigma− | SigmaT | Nu |
|---|---|---|---|---|---|---|---|
| di | 1.67 | ~ | 0.216 | 5.08 × 10⁹ | ~ | 2.16 × 10¹⁴ | 0 |
| de | 1.69 | ~ | 0.207 | 5.16 × 10⁹ | ~ | 2.20 × 10¹⁴ | 0 |
| dnorm | 0.45 | −0.0287 | 0.2 | 3.63 × 10⁸ | 45.3 | 1.54 × 10¹³ | 6.92 × 10⁻¹⁰ |
| Shape Index | 0.515 | −0.407 | 0.408 | 2.39 × 10⁸ | 2.61 × 10⁷ | 7.49 × 10¹² | 0.0419 |
| Curvedness | 0.0626 | −1.04 | 0.438 | 152 | 1.93 × 10⁹ | 8.19 × 10¹⁴ | 3.68 × 10⁻¹⁰ |
| Color of the Area | Area Number. | Area/Å2 | Color of the Area | Area Number | Area/Å2 |
|---|---|---|---|---|---|
| 1 | 7.7 | 9 | 12.4 | ||
| 2 | 69.9 | 10 | 30.8 | ||
| 3 | 22.2 | 11 | 6.0 | ||
| 4 | 31.7 | 12 | 9.1 | ||
| 5 | 7.7 | 13 | 9.4 | ||
| 6 | 10.6 | 14 | 11.2 | ||
| 7 | 10.6 | 15 | 71.7 | ||
| 8 | 9.6 | 16 | 8.7 |
| Inside Atom | Outside Atom | ||||
|---|---|---|---|---|---|
| O | N | C | H | ||
| C | 0.1 | 1.5 | 15.5 | 7.7 | 24.9 |
| H | 2.7 | 6.5 | 5.1 | 48.5 | 62.8 |
| N | 0.1 | 0 | 1.3 | 7.6 | 9 |
| O | 0 | 0.1 | 0.1 | 3.1 | 3.3 |
| 2.9 | 8.2 | 22.1 | 66.9 | ||
| N | Symop | R | Electron Density | Eele | Epol | Edis | Erep | Etot | |
|---|---|---|---|---|---|---|---|---|---|
| 2 | −x, −y, z | 10.44 | B3LYP/6-31G(d,p) | −0.9947 | −0.4697 | −7.6196 | 5.1944 | −4.8259 | |
| 2 | x, y, z | 3.90 | B3LYP/6-31G(d,p) | −2.0088 | −3.5951 | −95.9593 | 55.0986 | −54.3109 | |
| 1 | −x, −y, z | 9.69 | B3LYP/6-31G(d,p) | −2.7551 | −0.8832 | −19.1408 | 10.9829 | −13.4501 | |
| 2 | −x + 1/2, y + 1/2, −z | 12.77 | B3LYP/6-31G(d,p) | −0.8316 | −0.3984 | −8.7222 | 0.0000 | −8.7693 | |
| 2 | −x + 1/2, y + 1/2, −z | 13.03 | B3LYP/6-31G(d,p) | −2.8150 | −0.2619 | −7.7392 | 0.0000 | −9.9093 | |
| 2 | x + 1/2, −y + 1/2, −z | 8.28 | B3LYP/6-31G(d,p) | −13.6349 | −6.3419 | −28.7381 | 26.3618 | −27.8500 | |
| 2 | x + 1/2, −y + 1/2, −z | 9.60 | B3LYP/6-31G(d,p) | −7.7203 | −3.2340 | −8.5227 | 5.6320 | −14.4981 | |
| 2 | x + 1/2, −y + 1/2, −z | 8.67 | B3LYP/6-31G(d,p) | 0.1625 | −0.6978 | −11.9824 | 6.7784 | −6.5917 | |
| 1 | −x, −y, z | 14.38 | B3LYP/6-31G(d,p) | 1.5232 | −0.1605 | −3.1131 | 0.0000 | −1.2192 |
| Length/Å | Experimental | Theoretical (DFT) | Absolute Error | ||||
|---|---|---|---|---|---|---|---|
| Atom | SC-XRD | B3PW91 | wb97xd | b3lyp | B3PW91 | wb97xd | b3lyp |
| O1―C5 | 1.3583(19) | 1.331 | 1.3397 | 1.43 | 0.0273 | 0.0186 | 0.0717 |
| O1―C6 | 1.437(2) | 1.4243 | 1.4345 | 1.43 | 0.0127 | 0.0025 | 0.007 |
| N1―C1 | 1.359(2) | 1.3419 | 1.3485 | 1.3948 | 0.0171 | 0.0105 | 0.0358 |
| N1―C5 | 1.311(2) | 1.3139 | 1.317 | 1.3951 | 0.0029 | 0.006 | 0.0841 |
| N2―C7 | 1.147(2) | 1.1516 | 1.1558 | 1.1466 | 0.0046 | 0.0088 | 0.0004 |
| C1―C2 | 1.388(2) | 1.3888 | 1.395 | 1.3952 | 0.0008 | 0.007 | 0.0072 |
| C1―C8 | 1.485(2) | 1.4846 | 1.4843 | 1.54 | 0.0004 | 0.0007 | 0.055 |
| C2―C3 | 1.397(2) | 1.3956 | 1.4 | 1.3947 | 0.0014 | 0.003 | 0.0023 |
| C3―C4 | 1.400(2) | 1.3966 | 1.4057 | 1.3954 | 0.0034 | 0.0057 | 0.0046 |
| C3―C14 | 1.487(2) | 1.4829 | 1.4851 | 1.54 | 0.0041 | 0.0019 | 0.053 |
| C4―C5 | 1.411(2) | 1.4124 | 1.4198 | 1.3948 | 0.0014 | 0.0088 | 0.0162 |
| C4―C7 | 1.435(2) | 1.4272 | 1.4243 | 1.54 | 0.0078 | 0.0107 | 0.105 |
| C8―C9 | 1.398(2) | 1.3964 | 1.4025 | 1.3952 | 0.0016 | 0.0045 | 0.0028 |
| C8―C13 | 1.397(2) | 1.3966 | 1.4028 | 1.3948 | 0.0004 | 0.0058 | 0.0022 |
| C9―C10 | 1.385(2) | 1.3865 | 1.3899 | 1.3947 | 0.0015 | 0.0049 | 0.0097 |
| C10―C11 | 1.390(2) | 1.39 | 1.3939 | 1.3954 | 0 | 0.0039 | 0.0054 |
| C11―C12 | 1.386(2) | 1.3894 | 1.3934 | 1.3948 | 0.0034 | 0.0074 | 0.0088 |
| C12―C13 | 1.380(2) | 1.3876 | 1.3907 | 1.3951 | 0.0076 | 0.0107 | 0.0151 |
| C14―C15 | 1.399(2) | 1.395 | 1.4009 | 1.3952 | 0.004 | 0.0019 | 0.0038 |
| C14―C19 | 1.395(2) | 1.396 | 1.4022 | 1.3948 | 0.001 | 0.0072 | 0.0002 |
| C15―C16 | 1.388(2) | 1.3878 | 1.3913 | 1.3947 | 0.0002 | 0.0033 | 0.0067 |
| C16―C17 | 1.382(2) | 1.3893 | 1.3929 | 1.3954 | 0.0073 | 0.0109 | 0.0134 |
| C17―C18 | 1.386(2) | 1.3894 | 1.3932 | 1.3948 | 0.0034 | 0.0072 | 0.0088 |
| C18―C19 | 1.386(2) | 1.3875 | 1.391 | 1.3951 | 0.0015 | 0.005 | 0.0091 |
| Mean Absolute Error (MAE) | 0.004825 | 0.006538 | 0.022013 | ||||
| Angle/° | Experimental | Theoretical (DFT) | Absolute Error | ||||
|---|---|---|---|---|---|---|---|
| Atoms | SC-XRD | B3PW91 | wb97xd | b3lyp | B3PW91 | wb97xd | b3lyp |
| C5―O1―C6 | 116.07(13) | 117.6143 | 118.0351 | 109.5 | 1.5443 | 1.9651 | 6.57 |
| C5―N1―C1 | 117.68(14) | 118.9425 | 119.0151 | 120 | 1.2625 | 1.3351 | 2.32 |
| N1―C1―C2 | 121.80(15) | 121.6597 | 121.2835 | 119.9985 | 0.1403 | 0.5165 | 1.8015 |
| N1―C1―C8 | 115.97(14) | 116.191 | 116.4997 | 120.0043 | 0.221 | 0.5297 | 4.0343 |
| C2―C1―C8 | 122.23(14) | 122.1361 | 122.2057 | 119.9972 | 0.0939 | 0.0243 | 2.2328 |
| C1―C2―C3 | 120.49(15) | 120.1082 | 120.599 | 120.0086 | 0.3818 | 0.109 | 0.4814 |
| C2―C3―C4 | 117.52(15) | 117.8936 | 117.65 | 119.9942 | 0.3736 | 0.13 | 2.4742 |
| C2―C3―C14 | 119.74(15) | 119.6337 | 119.6121 | 120.0128 | 0.1063 | 0.1279 | 0.2728 |
| C4―C3―C14 | 122.74(15) | 122.4719 | 122.7377 | 119.993 | 0.2681 | 0.0023 | 2.747 |
| C3―C4―C5 | 117.62(15) | 117.7392 | 117.5435 | 119.994 | 0.1192 | 0.0765 | 2.374 |
| C3―C4―C7 | 123.46(15) | 122.9391 | 123.3874 | 119.9811 | 0.5209 | 0.0726 | 3.4789 |
| C5―C4―C7 | 118.89(15) | 119.3067 | 119.0467 | 120.0249 | 0.4167 | 0.1567 | 1.1349 |
| O1―C5―C4 | 115.69(14) | 116.5456 | 116.1911 | 120.0113 | 0.8556 | 0.5011 | 4.3213 |
| N1―C5―O1 | 119.45(15) | 119.8054 | 119.9158 | 119.984 | 0.3554 | 0.4658 | 0.534 |
| N1―C5―C4 | 124.86(15) | 123.6463 | 123.8904 | 120.0047 | 1.2137 | 0.9696 | 4.8553 |
| N2―C7―C4 | 178.56(19) | 179.8173 | 179.2402 | 180 | 1.2573 | 0.6802 | 1.44 |
| C9―C8―C1 | 120.03(14) | 119.5014 | 119.8124 | 119.9972 | 0.5286 | 0.2176 | 0.0328 |
| C13―C8―C1 | 121.52(15) | 121.7039 | 121.764 | 120.0043 | 0.1839 | 0.244 | 1.5157 |
| C13―C8―C9 | 118.44(15) | 118.7942 | 118.4223 | 119.9985 | 0.3542 | 0.0177 | 1.5585 |
| C10―C9―C8 | 120.84(16) | 120.5916 | 120.7559 | 120.0086 | 0.2484 | 0.0841 | 0.8314 |
| C9―C10―C11 | 120.12(16) | 120.1896 | 120.2645 | 119.9942 | 0.0696 | 0.1445 | 0.1258 |
| C12―C11―C10 | 119.29(16) | 119.6758 | 119.5661 | 119.994 | 0.3858 | 0.2761 | 0.704 |
| C13―C12―C11 | 120.81(17) | 120.1707 | 120.2242 | 120.0047 | 0.6393 | 0.5858 | 0.8053 |
| C12―C13―C8 | 120.49(16) | 120.5715 | 120.7626 | 120 | 0.0815 | 0.2726 | 0.49 |
| C15―C14―C3 | 121.35(15) | 121.4162 | 121.4486 | 119.9972 | 0.0662 | 0.0986 | 1.3528 |
| C19―C14―C3 | 119.47(14) | 119.384 | 119.7933 | 120.0043 | 0.086 | 0.3233 | 0.5343 |
| C19―C14―C15 | 119.15(15) | 119.193 | 118.7431 | 119.9985 | 0.043 | 0.4069 | 0.8485 |
| C16―C15―C14 | 119.70(16) | 120.2317 | 120.4784 | 120.0086 | 0.5317 | 0.7784 | 0.3086 |
| C17―C16―C15 | 120.56(16) | 120.2587 | 120.3076 | 119.9942 | 0.3013 | 0.2524 | 0.5658 |
| C16―C17―C18 | 120.19(15) | 119.8341 | 119.7065 | 119.994 | 0.3559 | 0.4835 | 0.196 |
| C17―C18―C19 | 119.64(16) | 120.0176 | 120.0971 | 120.0047 | 0.3776 | 0.4571 | 0.3647 |
| C18―C19―C14 | 120.72(15) | 120.4614 | 120.6642 | 120 | 0.2586 | 0.0558 | 0.72 |
| Mean Absolute Error (MAE) | 0.42631875 | 0.386275 | 1.625831 | ||||
| Vertical IP (eV) | Vertical EA (eV) | Mulliken Electronegativity (eV) | Chemical Potential (eV) | Hardness (eV) | Softness (eV−1) | Electrophilicity Index (eV) | Nucleophilicity Index (eV) |
|---|---|---|---|---|---|---|---|
| 7.7691 | 0.3931 | 4.0811 | −4.0811 | 7.3759 | 0.1356 | 1.1290 | 2.8345 |
| Atoms | ||
|---|---|---|
| C1 | 0.5642 | 6.829 |
| C2 | 5.788 | −2.458 |
| C3 | −3.521 | 5.293 |
| C4 | 9.618 | 5.372 |
| C5 | −0.047 | −0.941 |
| N7 | −0.332 | 2.558 |
| O8 | 2.468 | −0.084 |
| C9 | 0.266 | 0.0119 |
| C13 | −2.552 | −0.833 |
| N14 | 4.712 | 3.193 |
| C15 | 0.871 | −0.194 |
| C16 | −0.325 | 0.841 |
| C17 | −0.005 | 1.176 |
| C18 | 0.270 | −0.366 |
| C20 | −0.01592 | −0.53473 |
| C22 | 0.316333 | 1.631732 |
| C26 | 3.001526 | −0.09676 |
| C27 | 1.516165 | 2.361079 |
| C28 | 1.541635 | 2.098325 |
| C29 | −0.80325 | −1.1757 |
| C31 | −0.79917 | −1.06386 |
| C33 | 4.678211 | 3.593401 |
| No. | Energy (cm−1) | Wavelength (nm) | Osc. Strength | Major Contributors | Minor Contributors |
|---|---|---|---|---|---|
| 1 | 35,227.88 | 283.8661 | 0.5084 | HOMO->LUMO (86%) | H–4->LUMO (2%), H–1->LUMO (4%) |
| 2 | 40,377.73 | 247.6613 | 0.0355 | H–5->LUMO (38%), H–2->LUMO (19%) | H–4->LUMO (3%), H–4->L+3 (2%), H–3->LUMO (6%), H–2->L+1 (2%), H–1->LUMO (6%), HOMO->L+1 (9%), HOMO->L+3 (4%) |
| 3 | 40,469.68 | 247.0986 | 0.0694 | H–5->LUMO (27%), H–1->LUMO (50%) | H–6->LUMO (2%), HOMO->LUMO (4%), HOMO->L+1 (7%) |
| MO | eV | Symmetry | C6H5 | C7H3N2O | Accurate Values | ||
|---|---|---|---|---|---|---|---|
| 6 | L+10 | 3.74 | A | 72 | 28 | 0.719 | 0.281 |
| 85 | L+9 | 3.59 | A | 46 | 54 | 0.455 | 0.545 |
| 84 | L+8 | 3.32 | A | 87 | 13 | 0.867 | 0.133 |
| 83 | L+7 | 3.12 | A | 21 | 79 | 0.21 | 0.79 |
| 82 | L+6 | 3 | A | 77 | 23 | 0.77 | 0.23 |
| 81 | L+5 | 2.06 | A | 69 | 31 | 0.695 | 0.305 |
| 80 | L+4 | 1.85 | A | 49 | 51 | 0.487 | 0.513 |
| 79 | L+3 | 1.39 | A | 98 | 2 | 0.98 | 0.02 |
| 78 | L+2 | 1.34 | A | 97 | 3 | 0.965 | 0.035 |
| 77 | L+1 | 0.67 | A | 50 | 50 | 0.497 | 0.503 |
| 76 | LUMO | −0.4 | A | 31 | 69 | 0.312 | 0.688 |
| 75 | HOMO | −8.41 | A | 34 | 66 | 0.342 | 0.658 |
| 74 | H–1 | −9.04 | A | 76 | 24 | 0.761 | 0.239 |
| 73 | H–2 | −9.33 | A | 98 | 2 | 0.978 | 0.022 |
| 72 | H–3 | −9.33 | A | 99 | 1 | 0.986 | 0.014 |
| 71 | H–4 | −9.6 | A | 56 | 44 | 0.558 | 0.442 |
| 70 | H–5 | −10.08 | A | 9 | 91 | 0.087 | 0.913 |
| 69 | H–6 | −10.51 | A | 29 | 71 | 0.287 | 0.713 |
| 68 | H–7 | −11.37 | A | 8 | 92 | 0.084 | 0.916 |
| 67 | H–8 | −11.76 | A | 28 | 72 | 0.284 | 0.716 |
| 66 | H–9 | −11.84 | A | 74 | 26 | 0.74 | 0.26 |
| 65 | H–10 | −11.93 | A | 77 | 23 | 0.769 | 0.231 |
| Rings | Shannon Aromaticity Index | Electron Density Curvature | HOMA Value | LOLIPOP Value | Bird Aromaticity Index |
|---|---|---|---|---|---|
| A | 2.13677 × 10⁻⁵ | −0.015717083 | 0.995029 | 4.62163 | 97.174013 |
| B | 0.002116365 | −0.018111547 | 0.961494 | 2.642712 | 87.617472 |
| C | 2.14365 × 10⁻⁵ | −0.015807651 | 0.993422 | 5.569972 | 96.640669 |
| Ligand | Receptor | Interaction | Distance | E (kcal/mol) | Score (kcal/mol) |
|---|---|---|---|---|---|
| N | NE2 GLN 352 (A) | H-acceptor | 3.56 | −0.8 | −7.05 |
| N 36 | N LEU 153 (A) | H-acceptor | 2.85 | −4.2 | |
| N 36 | N PHE 274 (A) | H-acceptor | 3.39 | −2.8 | |
| 6-ring | CZ PHE 110 (A) | pi-H | 3.83 | −1.3 |
Disclaimer/Publisher’s Note: The statements, opinions and data contained in all publications are solely those of the individual author(s) and contributor(s) and not of MDPI and/or the editor(s). MDPI and/or the editor(s) disclaim responsibility for any injury to people or property resulting from any ideas, methods, instructions or products referred to in the content. |
© 2023 by the authors. Licensee MDPI, Basel, Switzerland. This article is an open access article distributed under the terms and conditions of the Creative Commons Attribution (CC BY) license (https://creativecommons.org/licenses/by/4.0/).
Share and Cite
Bakheit, A.H.; Alkahtani, H.M. Integrated Structural, Functional, and ADMET Analysis of 2-Methoxy-4,6-diphenylnicotinonitrile: The Convergence of X-ray Diffraction, Molecular Docking, Dynamic Simulations, and Advanced Computational Insights. Molecules 2023, 28, 6859. https://doi.org/10.3390/molecules28196859
Bakheit AH, Alkahtani HM. Integrated Structural, Functional, and ADMET Analysis of 2-Methoxy-4,6-diphenylnicotinonitrile: The Convergence of X-ray Diffraction, Molecular Docking, Dynamic Simulations, and Advanced Computational Insights. Molecules. 2023; 28(19):6859. https://doi.org/10.3390/molecules28196859
Chicago/Turabian StyleBakheit, Ahmed H., and Hamad M. Alkahtani. 2023. "Integrated Structural, Functional, and ADMET Analysis of 2-Methoxy-4,6-diphenylnicotinonitrile: The Convergence of X-ray Diffraction, Molecular Docking, Dynamic Simulations, and Advanced Computational Insights" Molecules 28, no. 19: 6859. https://doi.org/10.3390/molecules28196859
APA StyleBakheit, A. H., & Alkahtani, H. M. (2023). Integrated Structural, Functional, and ADMET Analysis of 2-Methoxy-4,6-diphenylnicotinonitrile: The Convergence of X-ray Diffraction, Molecular Docking, Dynamic Simulations, and Advanced Computational Insights. Molecules, 28(19), 6859. https://doi.org/10.3390/molecules28196859