Article

Revealing the Control Mechanisms of pH on the Solution Properties of Chitin via Single-Molecule Studies

1
Department of Food Science and Engineering, Moutai Institute, Renhuai 564502, China
2
School of Mechanical Engineering, Sichuan University, Chengdu 610065, China
3
School of Materials Science and Engineering, South China University of Technology, Guangzhou 510641, China
*
Authors to whom correspondence should be addressed.
Molecules 2023, 28(19), 6769; https://doi.org/10.3390/molecules28196769
Submission received: 30 August 2023 / Revised: 16 September 2023 / Accepted: 20 September 2023 / Published: 22 September 2023

Abstract

:
Chitin is one of the most common polysaccharides and is abundant in the cell walls of fungi and the shells of insects and aquatic organisms as a skeleton. The mechanism of how chitin responds to pH is essential to the precise control of brewing and the design of smart chitin materials. However, this molecular mechanism remains a mystery. Results from single-molecule studies, including single-molecule force spectroscopy (SMFS), AFM imaging, and molecular dynamic (MD) simulations, have shown that the mechanical and conformational behaviors of chitin molecules show surprising pH responsiveness. This can be compared with how, in natural aqueous solutions, chitin tends to form a more relaxed spreading conformation and show considerable elasticity under low stretching forces in acidic conditions. However, its molecular chain collapses into a rigid globule in alkaline solutions. The results show that the chain state of chitin can be regulated by the proportions of inter- and intramolecular H-bonds, which are determined via the number of water bridges on the chain under different pH values. This basic study may be helpful for understanding the cellular activities of fungi under pH stress and the design of chitin-based drug carriers.

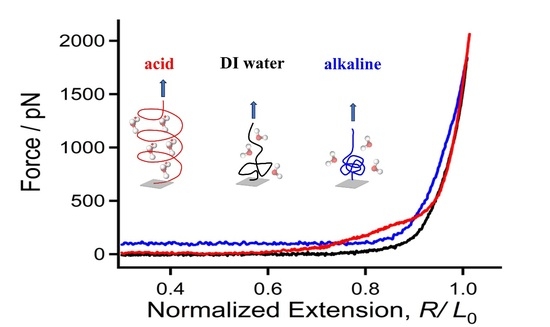
Graphical Abstract

1. Introduction

Chitin, as the second-most abundant biomacromolecule after cellulose, is widely distributed in biological species, including all fungal species and many insects and invertebrate aquatic organisms. Similar to cellulose, chitin is a structural polysaccharide composed of β-(1-4)-linked N-acetylglucosamine (GlcNAc) repeating units (Figure 1A). The only structural difference between these two polymers is the alkyl group side chain of the saccharide ring [1]. In fungi, chitin is located in the innermost layer of the cell wall, which is generally close to the phospholipid bilayer. The mass fraction of chitin in the cell wall of brewing beneficial fungi (yeasts) can be up to 15%. The inner chitin layer ensures the stability of the cell wall and plays a key role in functions such as protecting fungi from external stress and embedding important proteins in the cell wall and membrane. As an important type of biomaterial, chitin hydrogels have been widely used as wound dressings because of their biocompatibility and ability to provide a moist environment for wound healing [2,3,4,5]. In addition, the use of chitin-based hydrogels as drug carriers has aroused a great deal of attention [6,7,8,9].
The biological properties of chitin are closely related to the environment in which it is found. In particular, an environment’s pH value will affect the distribution of chitin around the cell membrane, which plays an important role in regulating the proliferation and growth of yeast [1,10,11,12,13,14,15]. In one report, chitin was found to be abundantly distributed on the external cell wall surface during the isotropic growth of a daughter cell [16,17]. Moreover, the intracell liquids were proven to be acidic (pH = 4–6) in this period [18]. The growth rate of the cells and the content of chitin in the cell wall were both clearly increasing under acidic conditions, which may be related to the morphology of chitin [19]. In addition, pH is also deeply involved in the properties of chitin materials. When chitin is used as a drug carrier, the drug release efficiency at an acidic pH is better than that at a neutral pH [2,15,20,21]. Even though the functions of fungi and the performance of chitin-based hydrogel drugs are deeply related to pH values, the mechanisms of the mechanical and conformational behaviors of chitin in aqueous environments at different pH values remain unclear at the molecular level [2,22,23]. Furthermore, it is difficult to precisely analyze the cell properties of fungi under pH stress and the interactions between chitin-containing drugs and the environment.
In recent decades, single-molecule force spectroscopy (SMFS) has shown its powerful ability in the investigation of the mechanical, conformational, and structural features of both biomacromolecules and synthetic polymers [24,25,26,27,28,29,30,31,32,33,34,35,36]. One of the most prominent features of SMFS is that measurements can be carried out in various conditions (in a liquid, in air, or in a vacuum) [37].
In this study, SMFS was combined with AFM imaging and molecular dynamic (MD) simulations [38] to investigate the single-molecule behaviors of chitin in aqueous environments with different pH levels. The results show that both molecular conformation and elasticity can be deeply affected by pH. Under acidic conditions, chitin shows a spreading free-chain conformation and an outstanding elasticity under low forces, while in alkaline solutions, chitin collapses into a hydrophobic globule and assumes a “stiff” mechanical character. It is believed that the strength of charge repulsion along the chain direction, which has a large influence on the number of water bridges between the adjacent saccharide rings of chitin and the assignment of H-bonds on chitin, is the key factor determining the state of a chitin molecule but shows no obvious influence on the elasticity of chitin.

2. Results and Discussion

2.1. Molecular Mechanical Properties of Chitin in DI Water

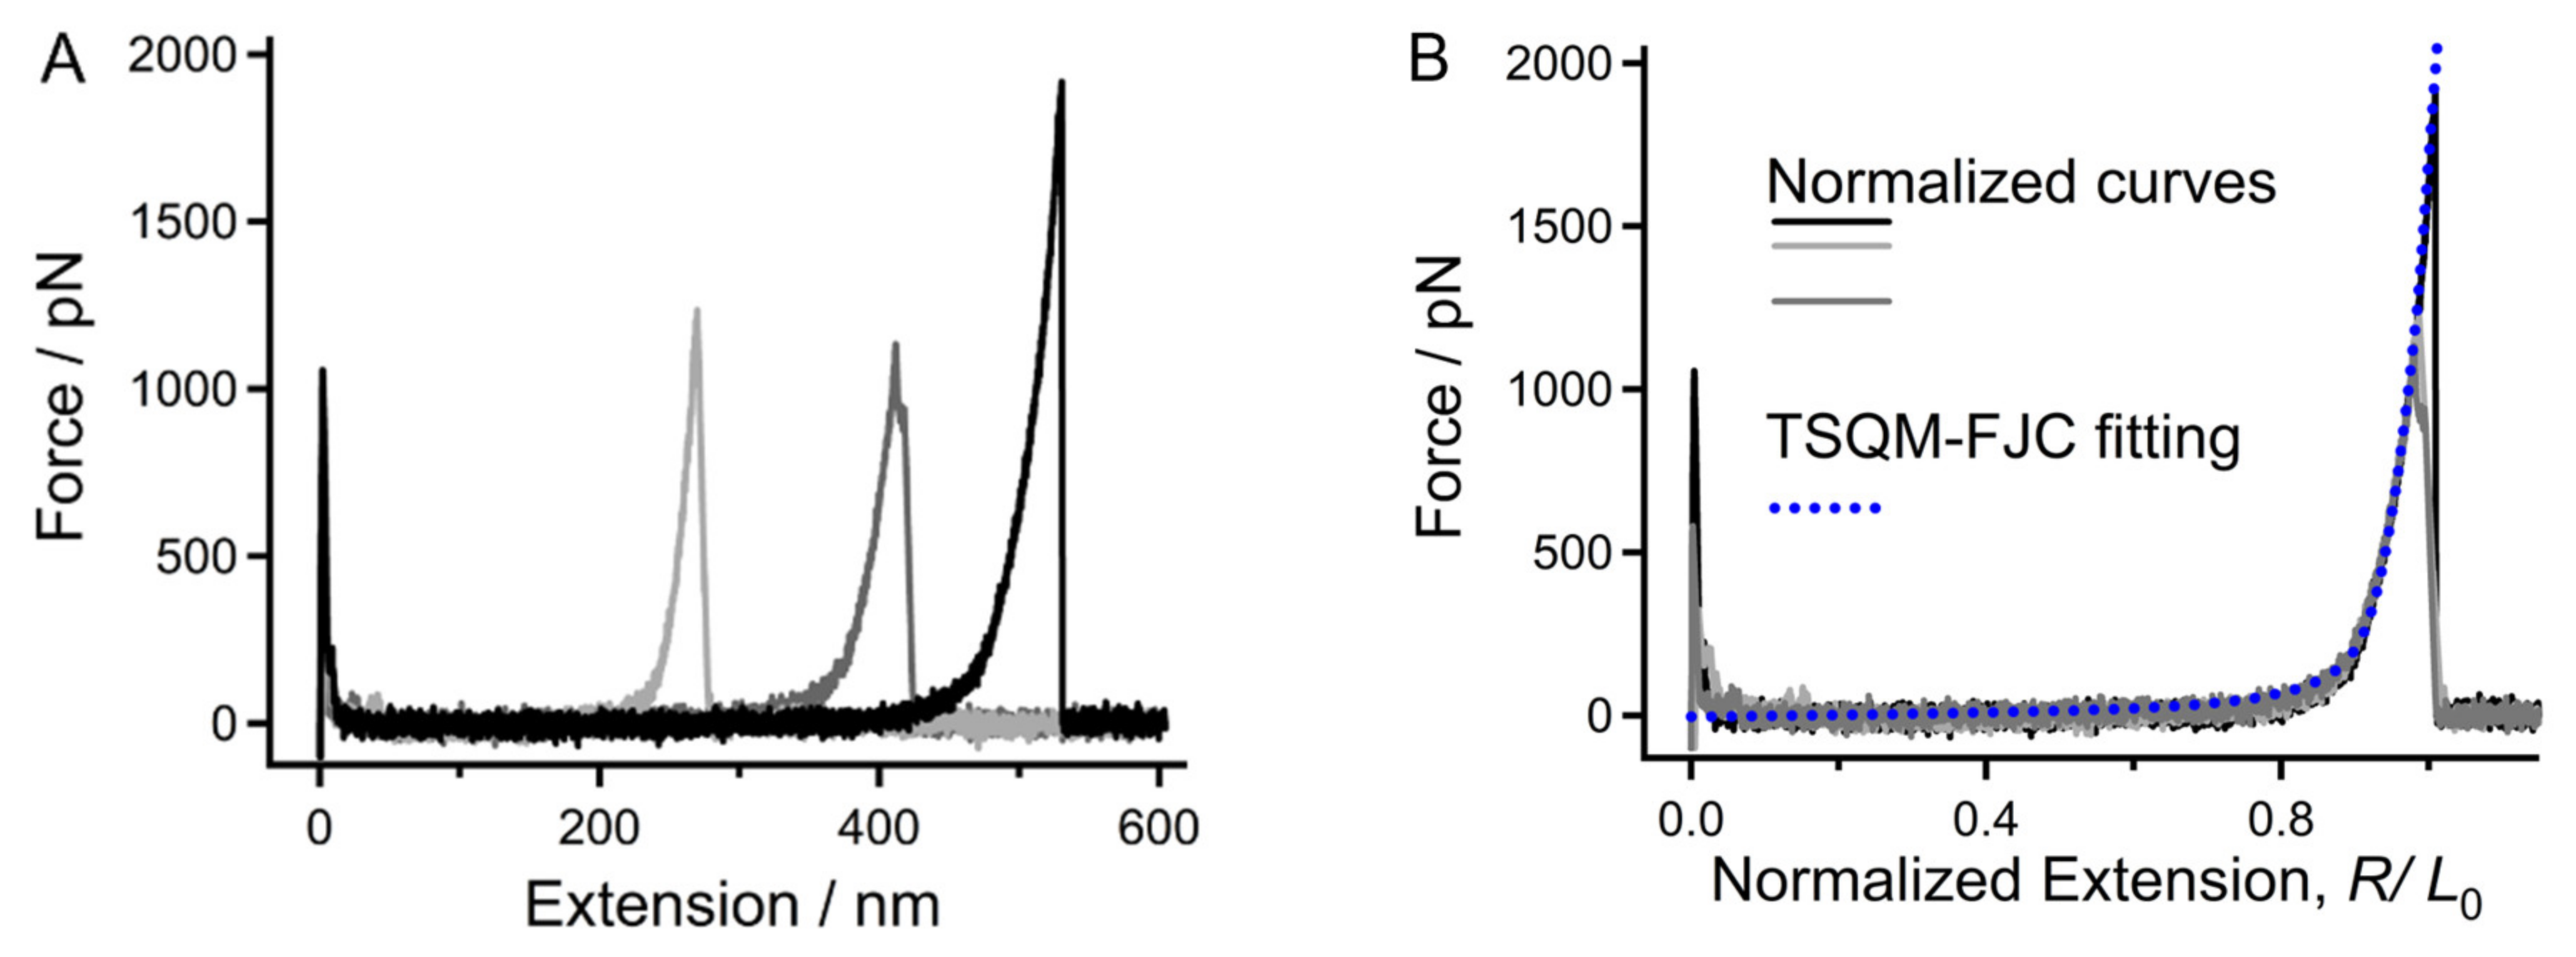
To facilitate the comparison of results from SMFS performed in aqueous conditions, we first investigated the single-molecule mechanical properties of chitin in deionized (DI) water. Figure 2A shows the typical force–extension (F-E) curves of single chitin chains measured via SMFS. The narrow force peak at the initial part of each curve corresponds to the adhesive effect when the AFM tip moves away from the substrate [39]. As the molecular chain is stretched from the free state to the extended state, the second force peak appears and rises gradually with the extension. Finally, the force reaches a maximum and drops to zero abruptly, indicating that the molecular bridge between AFM tip and the substrate has been broken [40,41]. Due to the variation in the molecular weight of each stretched chitin chain, the locations of the second force peak of the curves are different. To compare the elasticity directly, the F-E curves need to be further normalized.
The molecular elasticity of a polymer chain in an environment is provided by enthalpy and entropy. For chitin, a polymer linked by saccharide ring units, the elasticity along the chain direction under high force should be dominated by enthalpic elasticity from the ring strain. That is, the single-molecule elasticity of chitin can hardly be affected by environments under high forces. In general, the strength of strong non-covalent interactions (such intrachain H-bonds and π-π interactions) is not more than 1500 pN [29]. This means that a force region higher than 1500 pN reflects the inherent elasticity of a molecular chain, and the F-E curves of one polymer obtained in different environments should show a similar elasticity when the force is greater than 1500 pN. Therefore, the F-E curves shown in Figure 2A were normalized via their extension at 1500 pN, which is close to the strength of covalent bonds [42]. As shown in Figure 2B, the normalized experimental F-E curves can be overlapped neatly, suggesting that they have the same elasticity and should all be the stretching result of single chitin chains.
Chitin is a polysaccharide that is linked by 1,4-glycosidic bonds. The inherent elasticity of this kind of polysaccharide, in addition to others such as cellulose and amylose, was determined by Cui et al. through quantum-mechanical (QM) calculations [37]. Considering that there are many polar groups on its sidechain, one can conclude that water molecules can bind with chitin through H-bonds. By introducing the QM calculation results into the freely jointed chain (FJC) model (Equation (1)), which considered the kinetics of noncovalent interactions with two states, the new model (the TSQM-FJC model, Equation (2)) can be used to describe the elasticity of chitin under aqueous conditions [43]. The elastic modulus used in the QM-FJC model has been calculated previously based on the backbone of cellulose [44].
Z FJC = R L 0 = L F L 0 coth F l k k B T k B T / F l k
In Equation (1), ZFJC is the normalized extension of a chitin chain, and lk is the length of the Kuhn segment (0.514 nm for chitin); the stretching force F is the only free parameter.
z TS = R TS L 0 = L TS . z FJC N l u = l f e Δ G + F Δ L k B T + 1 + l u e Δ G F Δ L k B T + 1 . z FJC / l u  
In Equation (2), the value of lu is the length of a saccharide ring of chitin in a free state (0.45 nm), and lf is its length under a high force (0.54 nm). Because ΔL = lulf, there are only two free parameters, ΔG and lf. One can notice that the single-molecule elasticity of chitin obtained in DI water can be fitted adequately by the TSQM-FJC model with a given set of parameters, that is,  Δ G  = 1.50 kBT/unit = 3.75 kJ/(mol·unit), ΔL = 0.09 nm, lf = 0.54 nm, and lu = 0.45 nm (Figure 3B). These results indicate that the average strength of water bridges between adjacent saccharide units is 3.75 kJ/(mol·unit). Note that the ΔG of chitin in DI water is much lower than that of amylose (5.1 kBT/unit = 12.75 kJ/(mol·unit)) [45], a water-soluble polysaccharide that shares the same backbone elasticity with cellulose [44]. Considering that these two polysaccharides share nearly the same backbone structure and that chitin possesses even more polar groups than amylose, we suppose that a single chitin chain is relatively weak when hydrated in DI water.

2.2. Surprising Enhancement of Single-Molecule Elasticity Due to Strong Hydratability in Acid

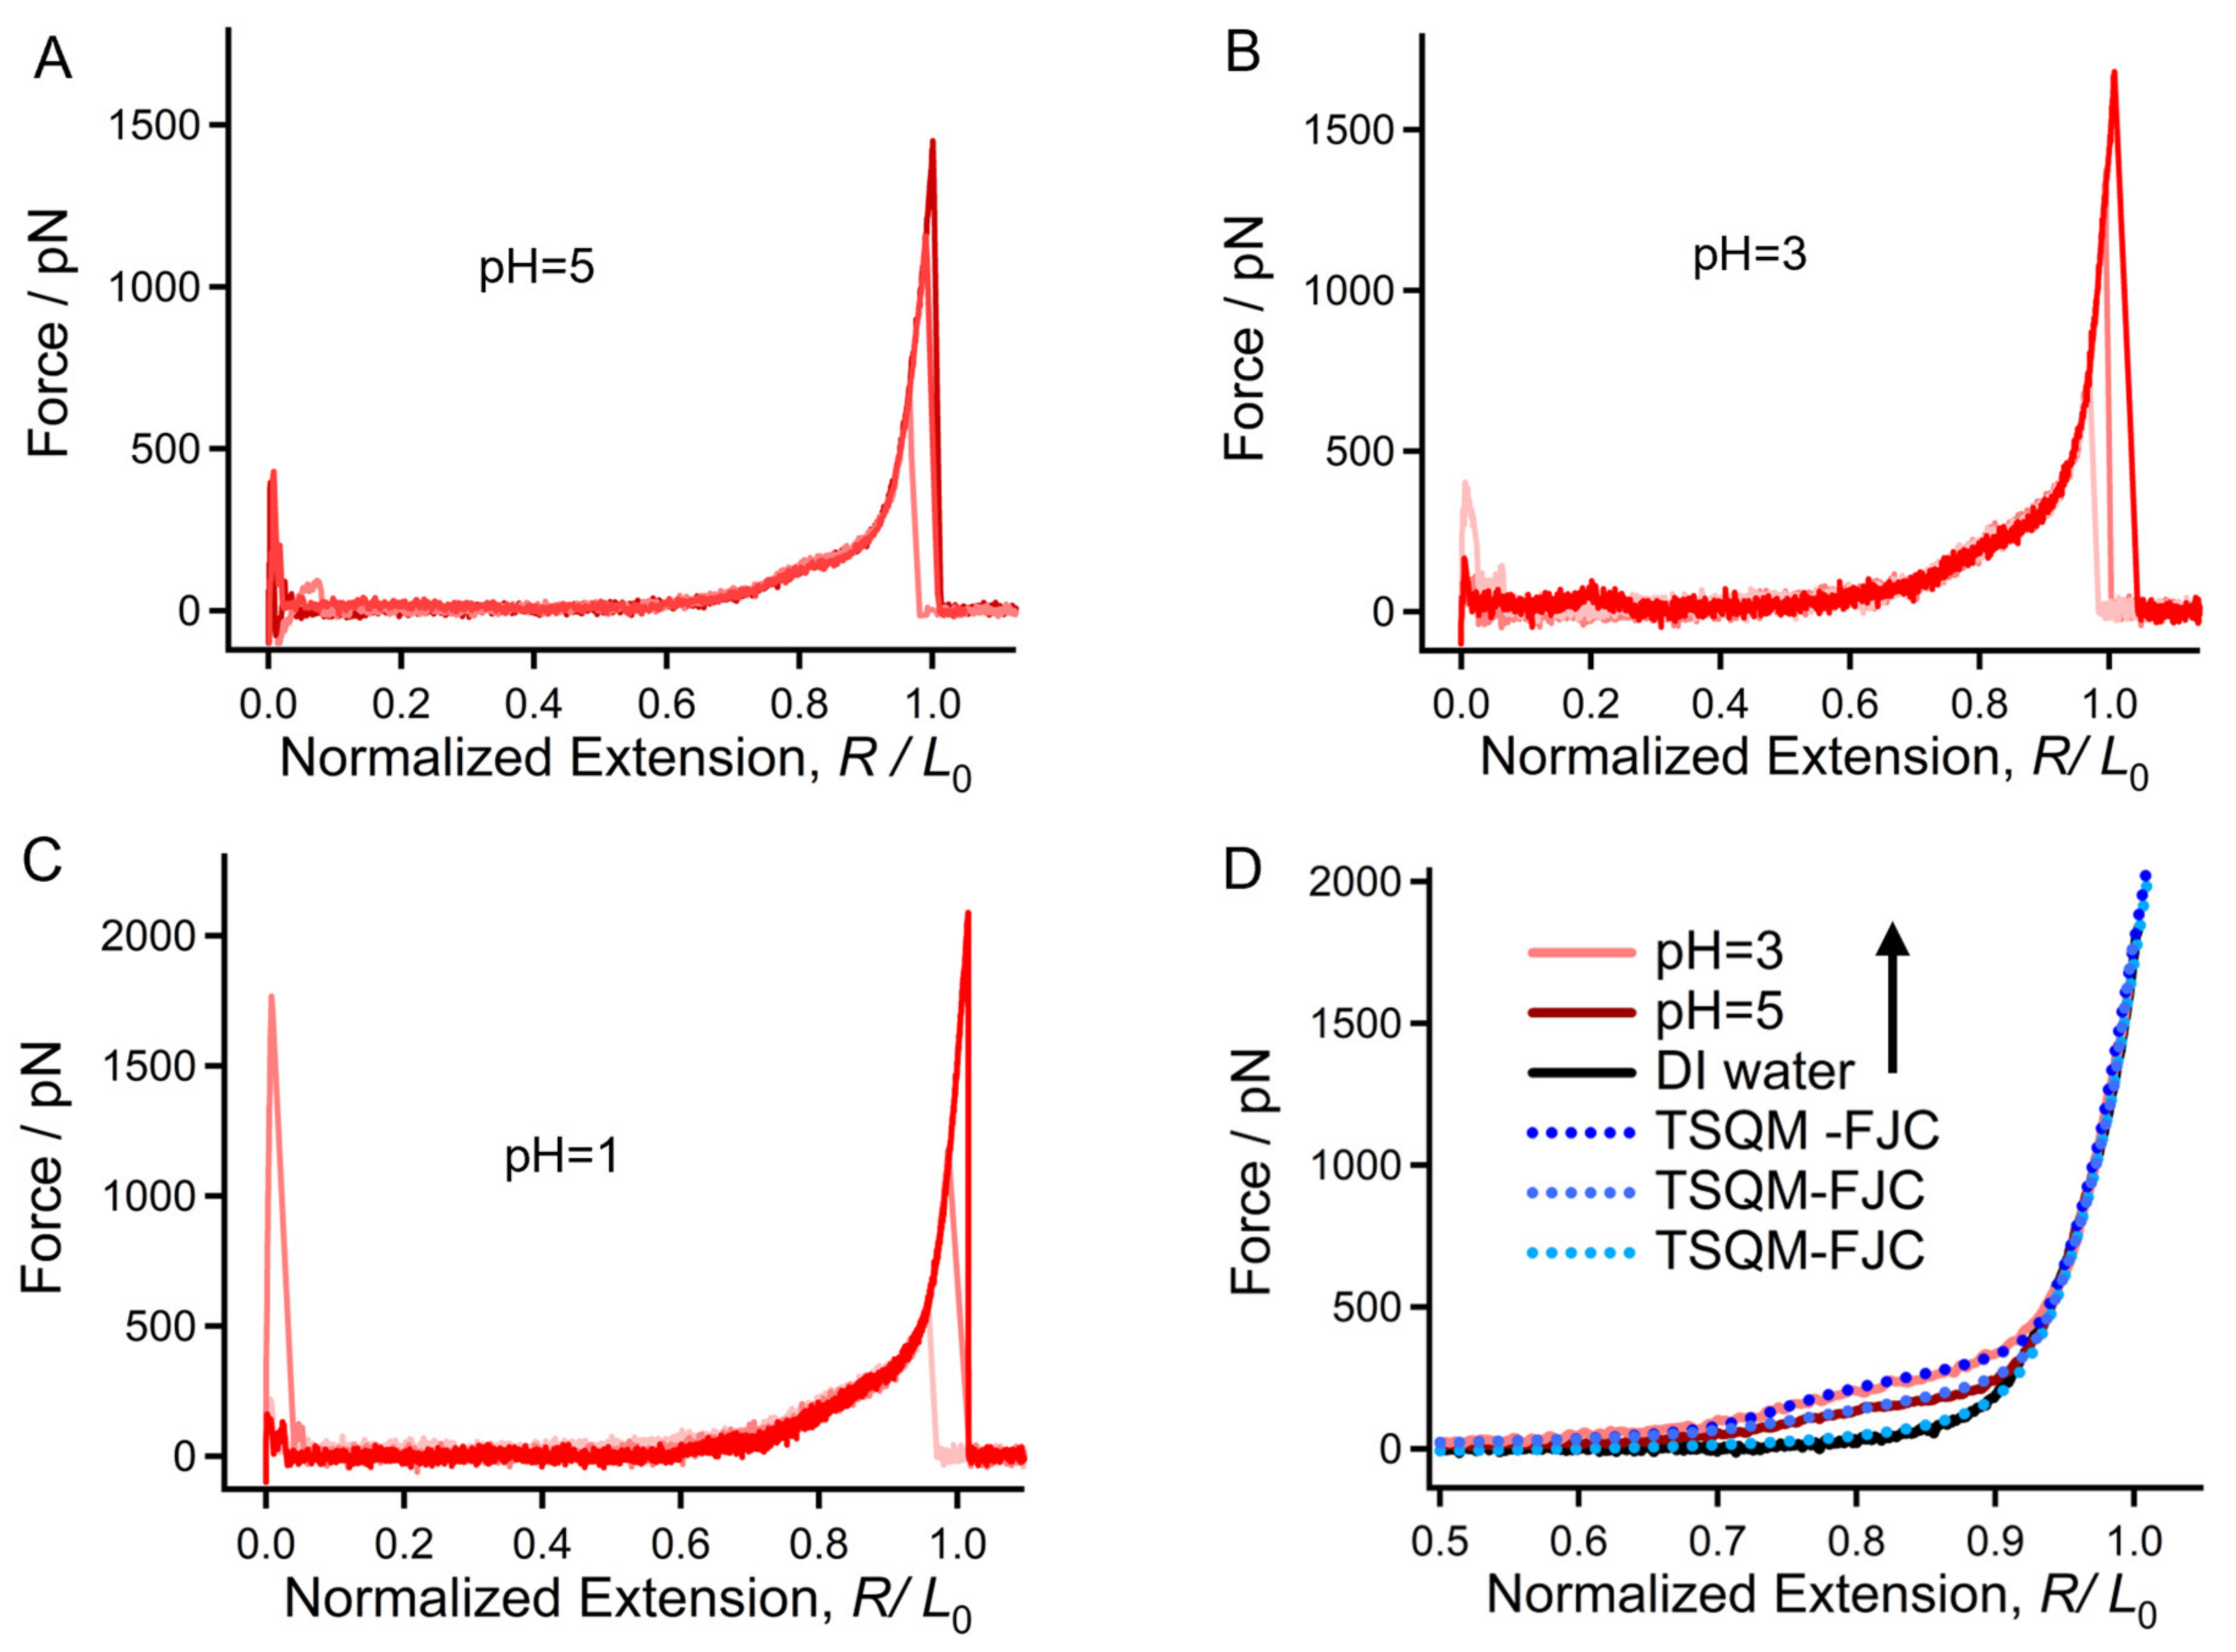
To the best of our knowledge, although many studies focus on the influence of pH on the expression of fungi and the basic performance of chitin materials and other glucose-derivatives (such as chitosan), the corresponding molecular mechanisms remain largely unknown due to the complexity of the systems [19,46]. Figure 3A–C show the F-E curves of chitin obtained in aqueous HCl solutions with different pH values. Interestingly, there is a noticeable shoulder-like force plateau on each curve at the low-force region (from about 150–250 pN), which is determined by the entropy of the elasticity of a polymer chain. When compared, the experimental F-E curves obtained in acidic conditions can be adequately overlapped with those obtained in DI water at the high-force region (over 500 pN), while showing a significant deviation at lower force levels. Compared to the F-E curve obtained in DI water, a gentle shoulder-like force plateau appears at about 150 pN, indicating that more bound water molecules are serving as bridges linking the adjacent saccharide units. The height of the shoulder-like force plateau rises to about 250 pN when the pH decreases to 3 and remains steady under lower pH conditions. The control experiments carried out in NaCl solutions with a concentration gradient (not exceeding 0.1 M) demonstrate that the presence of Cl- can hardly influence the elasticity of chitin in water. Therefore, we have reason to believe that the shoulder-like force plateau of the F-E curves obtained in acidic conditions is mainly determined by H+.
Herein, the TSQM-FJC model was used to quantitatively study the influence of H+ on the mechanical properties of chitin. It was found that the F-E curves obtained at pH = 3 (or pH = 1) can be fitted well by the model when  Δ G  = 5.53 kBT/unit = 13.83 kJ/(mol·unit). In addition, the energy difference between the pH = 3 and DI water was calculated to be 9.08 kJ/(mol·unit), which is remarkable for a natural or synthetic polymer in different aqueous environments [46]. In acid, many H+ can bind to water molecules to form H3O+ and further act as bridges between the adjacent sugar units of a molecular chain [47]. Compared to a common water bridge, the repulsive effect of the charges among the bound H3O+ aids the spreading of a molecular chain. Accordingly, more water bridges form on a chitin chain. When stretched under an external force, the bridges linked by H-bonds will be broken with the extension. The more water bridges, the larger the  Δ G  required, causing a higher shoulder-like force plateau in the F-E curve. Because the number of surviving water bridges is very limited under higher forces (over 500 pN), single chitin molecules being stretched in acidic conditions show similar elasticity in this force region. It is interesting to further discuss the conformational behavior of chitin under relatively mild conditions. The typical F-E curve of chitin obtained at pH = 5 shows obvious deviation from that obtained in DI water (Figure 3D in the manuscript). The  Δ G  required to stretch a chitin chain between the two states was calculated to be 8.53 kJ/(mol·unit) via TSQM-FJC fitting (Figure 3D), which is about 62% of the  Δ G  between pH = 3 and DI water (13.83 kJ/(mol·unit)). Considering that the value of  Δ G  shows a positive correlation with the amount of chain spreading under acidic conditions, we can make a rough prediction that the spreading degree of chitin at pH = 5 is 62% that of its final state under acidic conditions (pH ≤ 3). The pH-induced single-molecule mechanical transition at low-force regions may aid in the design of intelligent elastic chitin hydrogels.

2.3. Mechanical Properties of Chitin Chains in Alkaline Environments

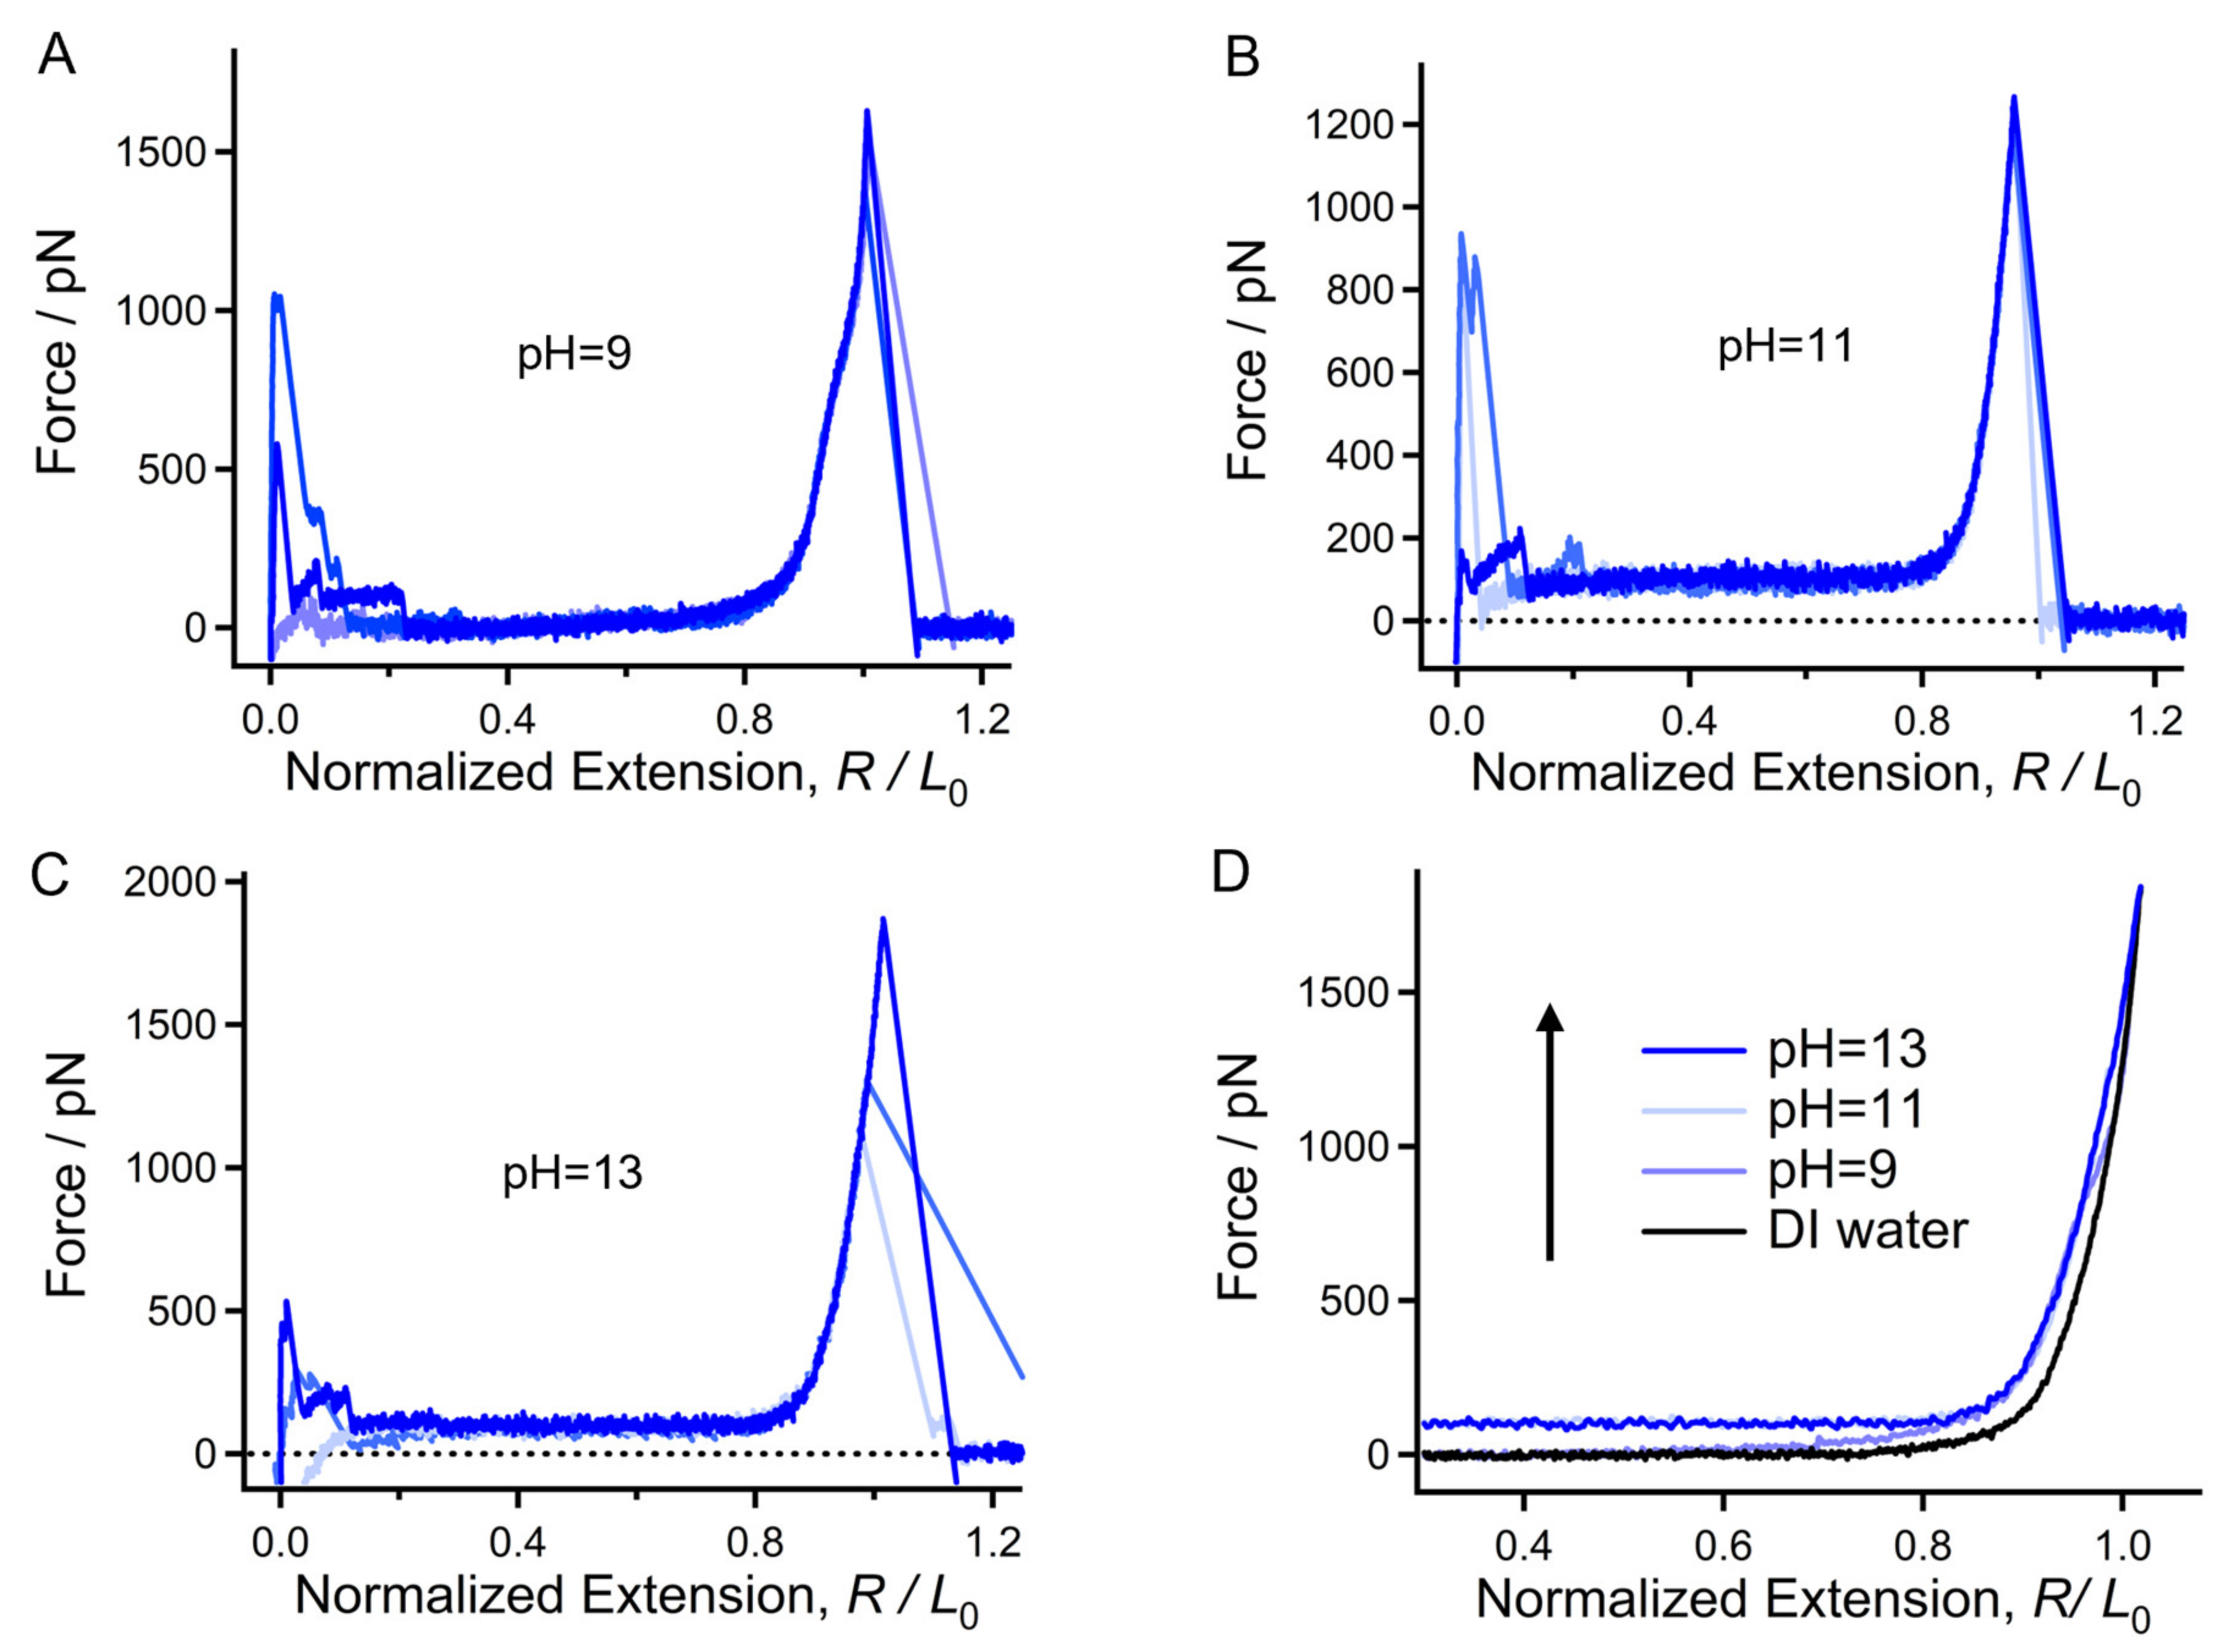
Previous studies have shown that alkali/urea systems aid in the dissolution of chitin and the design of chitin hydrogels [48]. However, there is a lack of molecular-level evidence regarding whether OH can improve the hydratability of chitin. The above SMFS studies conducted in acids indicate that hydratability can be reflected by mechanical variations. Figure 4 shows the normalized F-E curves of chitin obtained in NaOH solutions with different pH values. The elasticity of a polymer chain is provided by both covalent and noncovalent interactions. When the external force is large enough, the elasticity is mainly determined by covalent bonds [42,49]. Therefore, the typical F-E curves obtained in pH = 9, 11, 13 and DI water can be overlapped well under high forces (over 1500 pN) since they correspond to the stretching of a single chitin molecule (Figure 4D). Notably, the curves show significant deviation below 1500 pN. In this force region, the curve obtained at pH = 9 is above that obtained in DI water and shows a sharp shoulder-like force plateau at about 700 pN (Figure 4D). The force deviation becomes more obvious when the pH increases to 11 and remains steady under higher-pH conditions. The noncovalent interactions of chitin chains are dominated by intrachain and intermolecular H-bonds, which compete with each other and bring about low forces and a higher force region, respectively [45]. Therefore, when the number of intermolecular hydrogen bonds is dominant (i.e., the situation in acid), a shoulder-like force plateau appears in the low-force region (150–250 pN). The much higher shoulder-like force plateau (about 700 pN) at pH = 9 indicates that the intrachain nonbonding interaction is strengthened compared to that in acidic environments and DI water. These results demonstrate that the hydratability of the chitin molecule may be weakened by the presence of OH.

2.4. Origin of the Mechanical Deviation of Chitin in Acid, DI Water, and Alkali Medium in Relation to the Aspect of Molecular Morphology

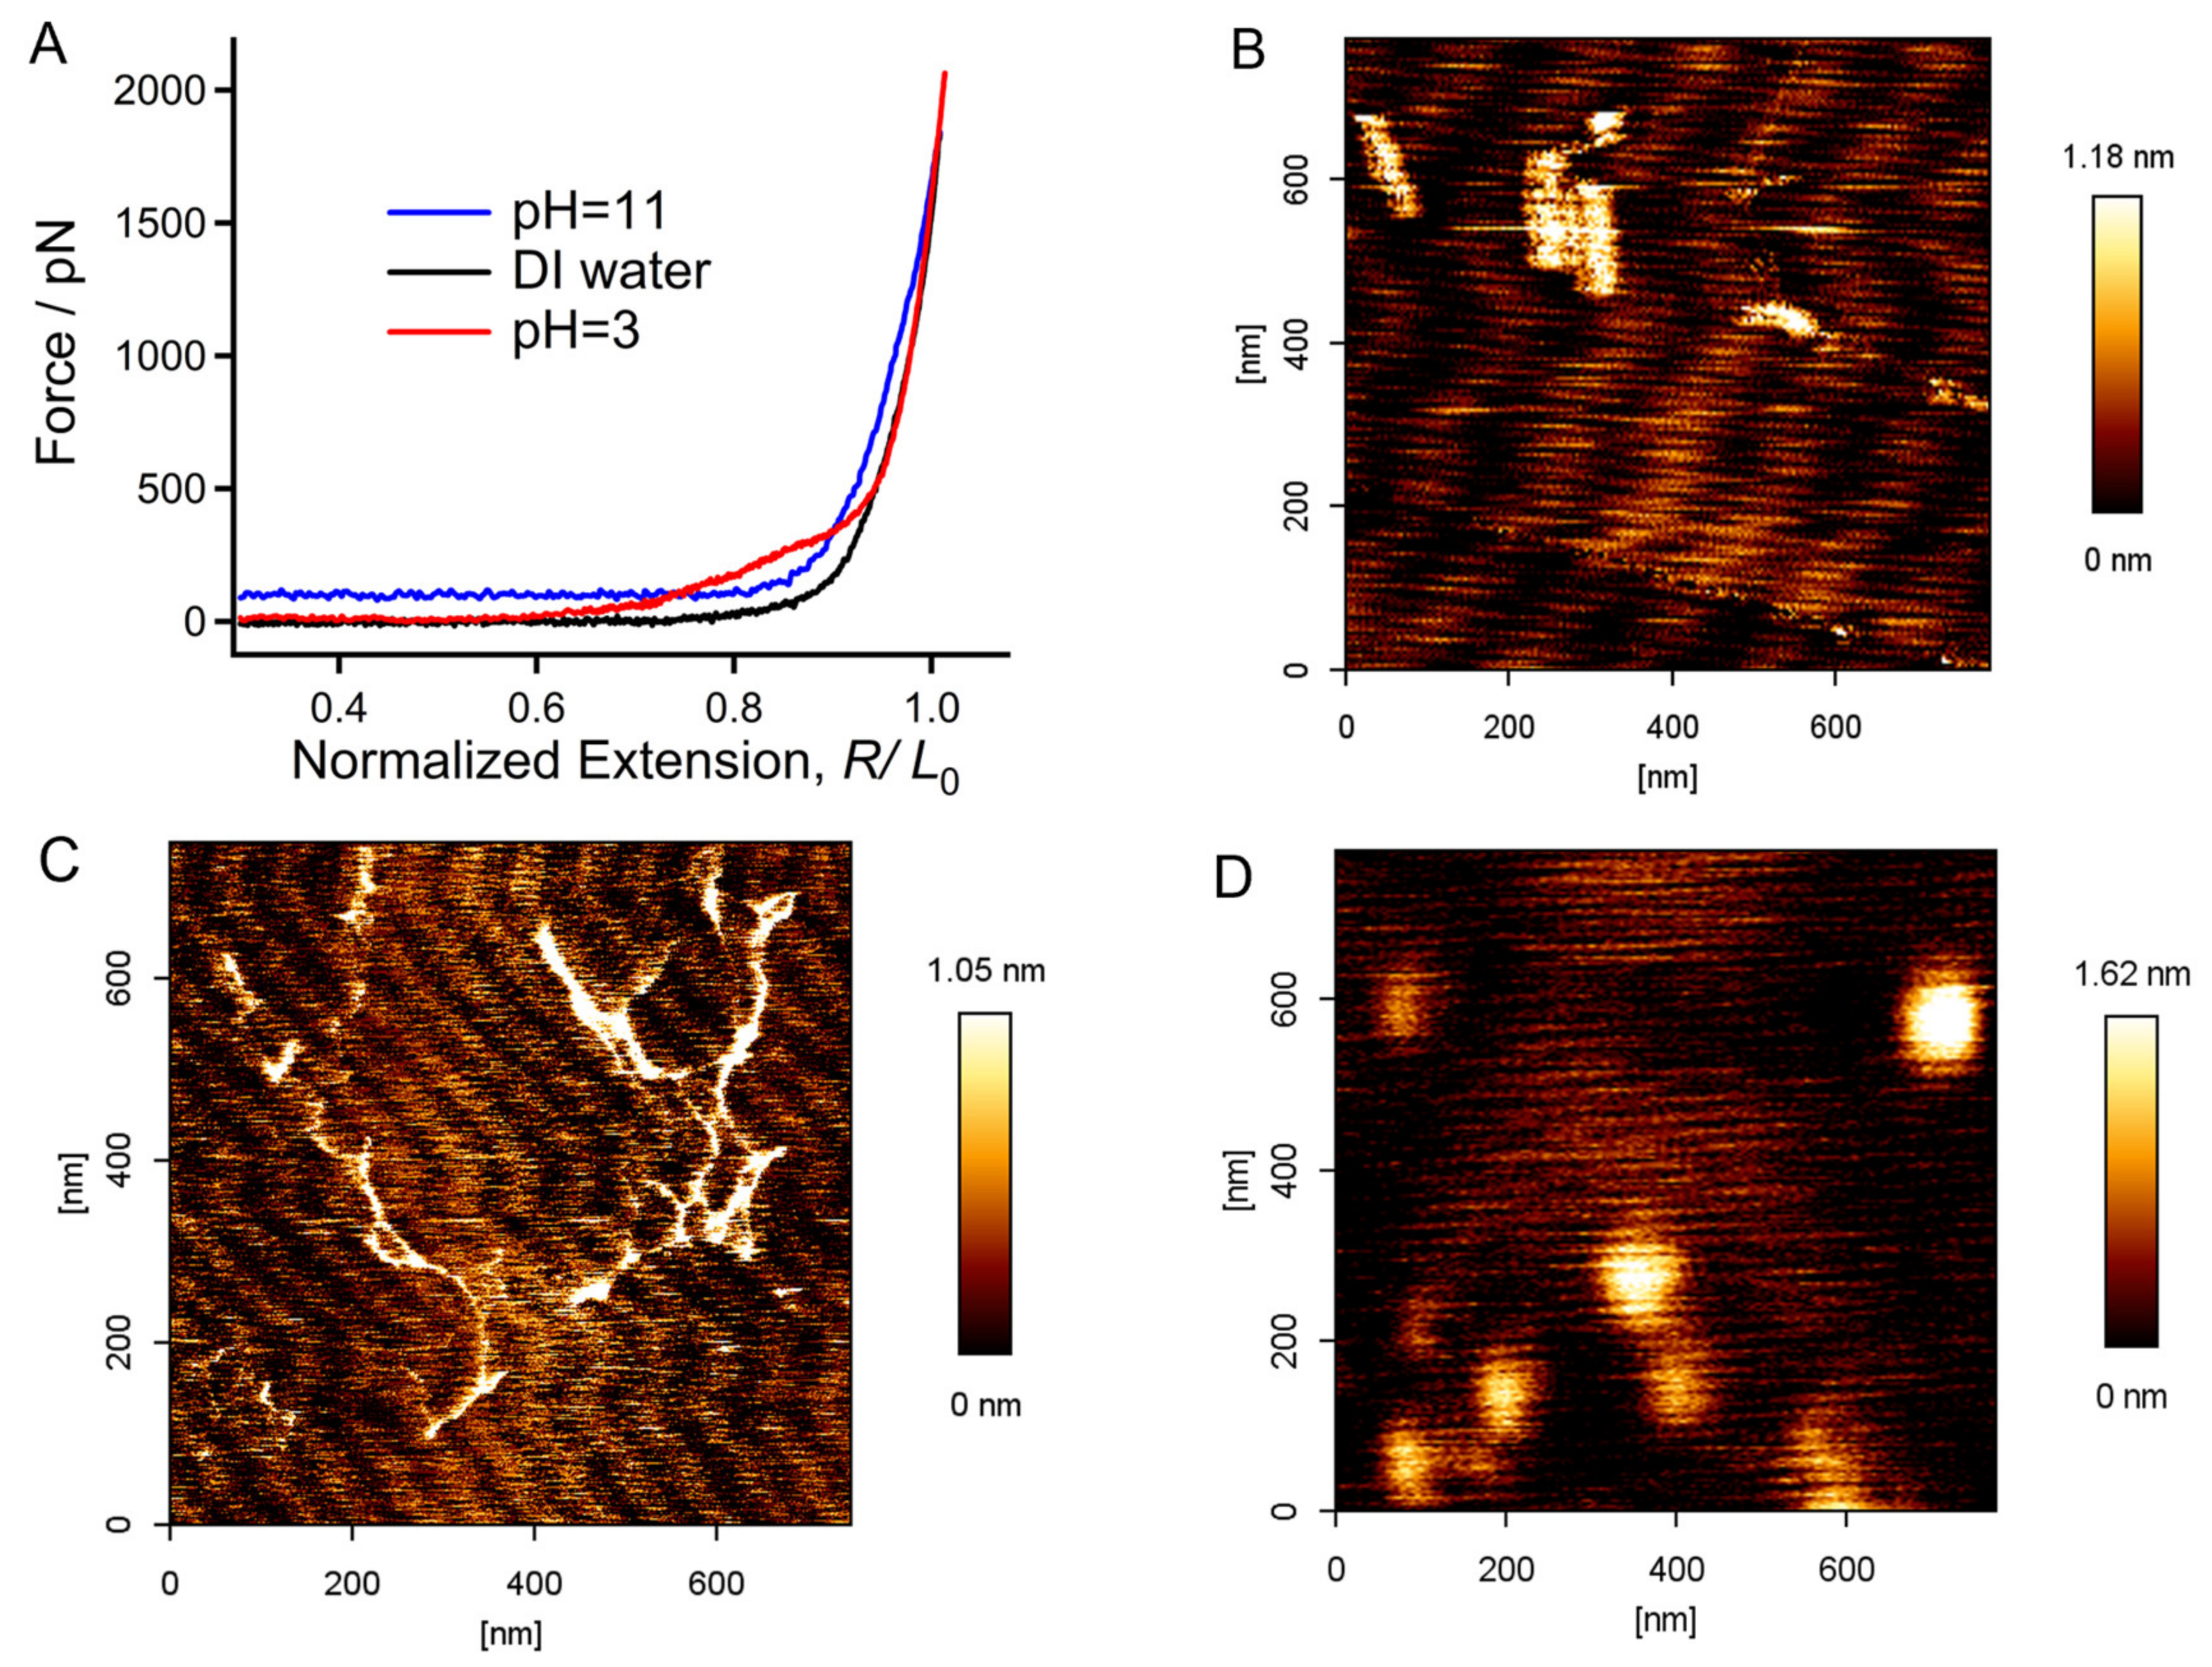
The F-E curves of chitin obtained at pH = 3, in DI water, and at pH = 11 were compared for a further analysis (Figure 5A). It is obvious that the curves show distinct divergence below 1500 pN. Compared to that in DI water, the stretching force of the chitin chain increases in both the acidic and alkaline environments. The difference is that the alkaline condition shows a greater influence in the higher force region, indicating that the molecule has become “stiff”, while the influence in the lower force region is more prominent under acidic conditions, which reflects the high elasticity of chitin under these conditions. The long stable force plateau that appears at about 100 pN before elastic stretching in the F-E curves obtained at pH = 11 (or 13) may correspond to the elongation of the chitin molecule in a hydrophobic globule state [37,50]. AFM imaging experiments of the extremely dilute chitin solution were carried out for confirmation. As shown in Figure 5B, the chitin molecules tended to form semi-collapsed structures in DI water, and this is consistent with their low ΔG (3.75 kJ/(mol·unit)) determined via TSQM-FJC fitting. Surprisingly, the molecules transform into spreading free chains when the pH was equal to 3, indicating that the molecules can be sufficiently hydrated in this environment, where they show remarkable hydration energy (ΔG = 13.83 kJ/(mol·unit)). Accumulated, collapsed globules were found to be the main morphology of chitin when the pH was increased to 11. Moreover, the thickness of chitin on the substrate increases with an increasing pH. The AFM imaging results confirmed that the long force plateaus at about 100 pN shown in Figure 4B,C were caused by the hydrophobic effect of chitin in alkaline conditions.

2.5. Analysis of the Single-Molecule Physical Properties of Chitin via MD Simulations

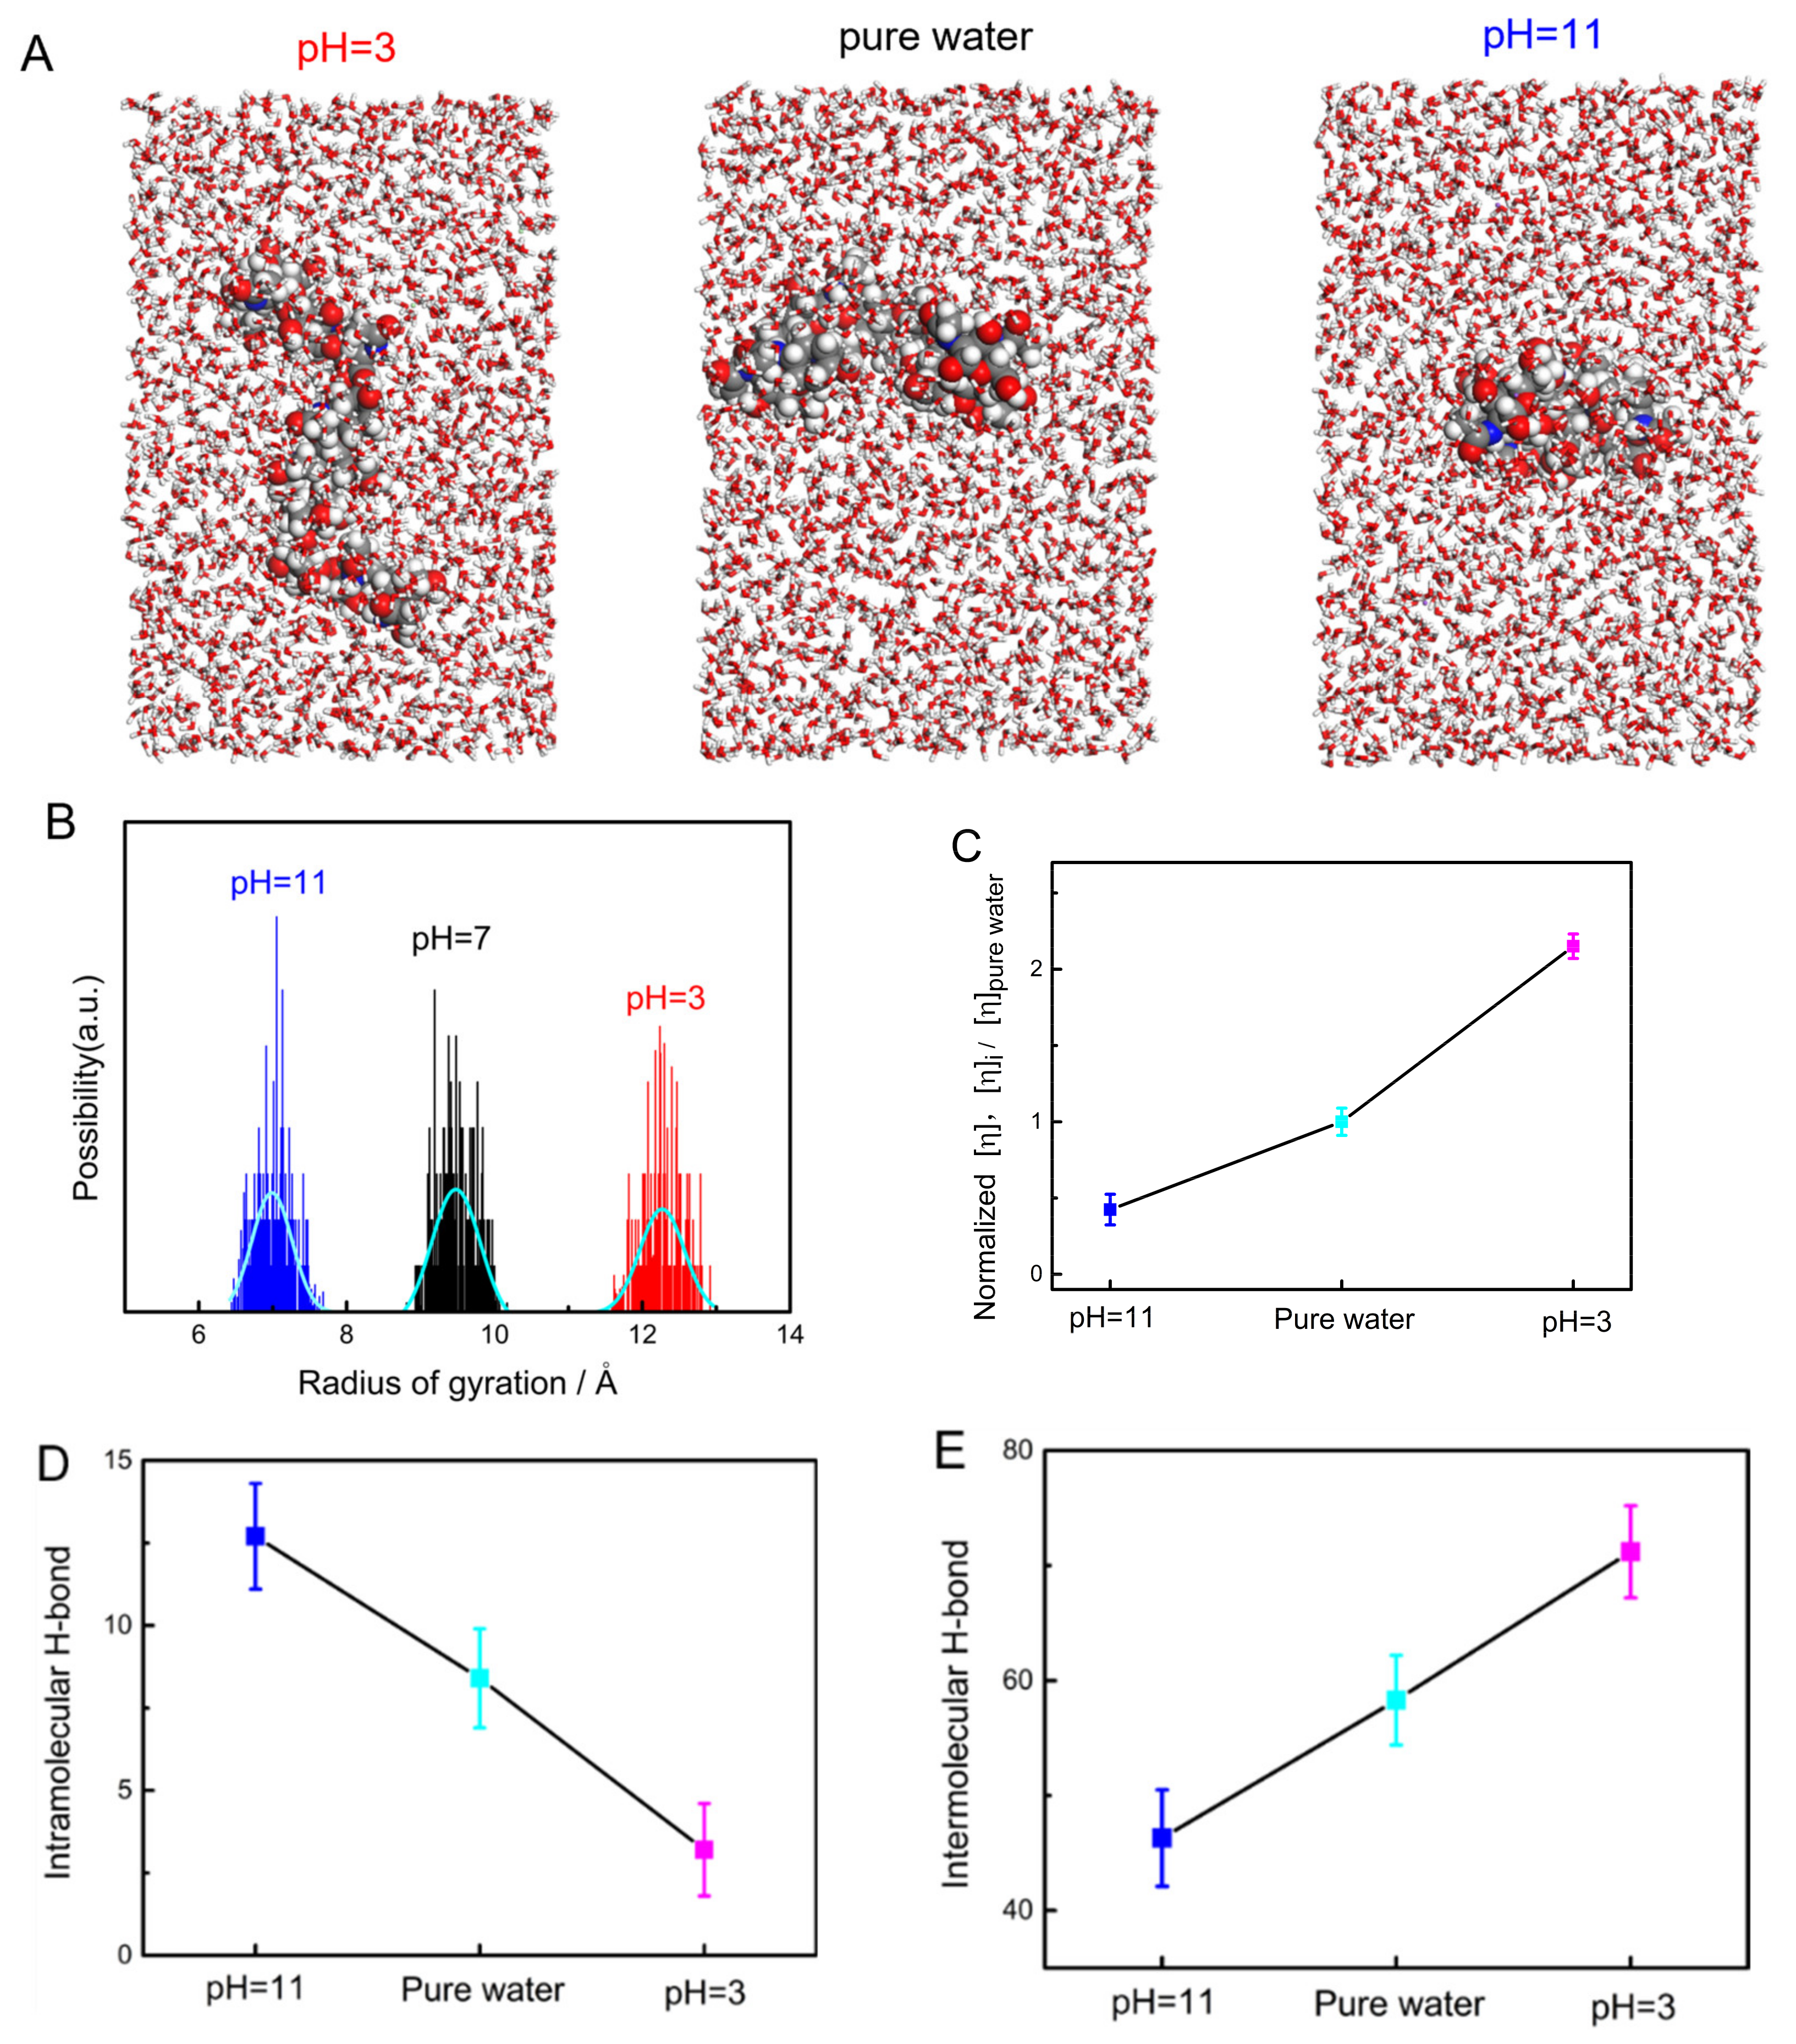
In order to investigate the kinetic principle of a chitin chain in environments with different pH levels, MD simulations were carried out in HCl solution (pH = 3), pure water, and NaOH solution (pH = 11). Typical pictures from the simulation animations at 20 ns show that the chitin molecules adopt a spreading conformation in acid, a relatively collapsed conformation in water, and a more collapsed globule conformation in alkaline conditions. These simulation results remarkably match the AFM-imaging results. The dynamic radius of gyration (Rg) is a parameter used to characterize molecular size that can reflect the microscopic properties of molecular chains in solution [51]. Rg can be written in the following form:
R g = i r i 2 m i i m i 1 / 2
Above, | m i | is the mass of the chitin chain at point i, and | r i | is the vector from point i to the center of mass of the chitin chain. The calculated Rg in this study is based on the MD results from 0–20 ns. As shown in Figure 6B, the  R g  values of a chitin chain are 9.48 ± 0.02 Å in pure water, 7 ± 0.02 Å in NaOH solution at pH = 11, and 12.27 ± 0.03 Å in HCl solution at pH = 3. The ratio of the Rg value at pH = 3 to that in pure water is 129%, and the ratio for this value at pH = 11 to that in pure water is 74%. Because a larger Rg value corresponds to a more intense spreading conformation, the ratios can intuitively reflect the conformation behavior of chitin in solutions with varying pH. This result is consistent with the tendency of the end–end distance of chitin in solutions with varying pH (Figure S10). This means that chitin shows a more relaxed conformation in acid and a comparatively more constrained (or collapsed) conformation in pure water. The simulation results are consistent with the results from the SMFS and AFM imaging.
Based on the value of  R g , the characteristic viscosity of a polymer chain can be obtained from Equation (4)
η = 10 π N A 3 R g / ρ 3 M
where  η  is the characteristic viscosity, which can reflect the viscous property of an extremely dilute polymer solution.  ρ  is the density of the cell (0.991 kg/L for the water/chitin solution, 0.989 kg/L for the NaOH/chitin aqueous solution at pH = 11, and 0.983 kg/L for the HCl/chitin aqueous solution at pH = 3) obtained via MD simulations using the NPT model. M is the molecular weight of the chitin chain with five repeating units. Figure 6C shows the calculated normalized  η  of a chitin chain under each condition, where the  η  in pure water was normalized to 1 as a standard. It is clear that the  η  in the alkali environment is relatively low (0.424 times that in pure water), while the value under the acidic condition suddenly rises to 2.151 times that in pure water. As the  η  is an important parameter that can reflect the viscosity and adhesion properties of polymers in solution, this result may aid in the design of novel chitin drugs [52,53].

2.6. The Intramolecular and Intermolecular H-Bonds of a Chitin Chain in Solution

As mentioned in the SMFS section, intramolecular and intermolecular H-bonds govern the noncovalent interactions of a chitin molecule in solution. In this section of our study, the ratio of the two types of H-bonds in each condition was analyzed based on the MD simulation results. As shown in Figure 6D,E, the ratio of intramolecular to intermolecular H-bonds on a chitin molecule shows a reverse trend between acidic and alkaline solutions. The number of intramolecular H-bonds increases with pH, while that of intermolecular H-bonds decreases with pH. According to the result, the ratios of intermolecular H-bonds/intramolecular H-bonds of chitin were calculated to be 24:1, 7:1, and 4:1 for pH = 3, pure water, and pH = 11, respectively. The high proportion of intermolecular H-bonds of chitin in acid agrees well with the large ΔG from TSQM-FJC fitting and the huge difference of the end–end distance of chitin under pH = 3 and 11 (Figure S10). This result is also a good explanation of why a chitin chain shows an unfolded free conformation and a large  η  value in acid (pH = 3). It is believed that the high ratio of intramolecular H-bonds is the direct driving force causing the molecular chain to collapse into a relatively hydrophobic globule conformation.

3. Materials and Methods

3.1. Materials and Chemicals

Chitin powder was purchased from Aladdin Biochemical technology Corp. (CAS No. 1398-61-4, Shanghai, China). The water mentioned in this study is deionized (DI) water (>18 MΩ·cm). Hydrochloric acid (1 mol/L), NaOH, and other analytically pure chemicals were purchased from Sigma-Aldrich Corp (St. Louis, MO, USA).

3.2. Details of SMFS

Chitin was dissolved in ionic liquid (at 23 °C with agitation concussion for 1 h) to obtain a very dilute solution (10 mg/L) [54]. Then, 20 μL of the solution was poured onto a clean quartz slide for 30 min. The sample was rinsed with an ample amount of environmental liquid for SMFS experiments (DI water, HCl, or NaOH aqueous solutions with different pH levels) and air-dried before being mounted on the AFM (MFP-3D, Asylum Research). Subsequently, a drop of environmental liquid was placed between the V-shaped Si3N4 AFM cantilever (Bruker Corp., Billerica, MA, USA) and the chitin sample. During the SMFS experiment, there was a molecular bridge between the AFM tip and the substrate (Figure 1B). When the AFM tip was attached to the single molecule chitin sample under a large loading force (4 nN in this study), the polar atoms of chitin (N and O) may link with those of the Si3N4 AFM tip (N atoms) through covalent bonds. At the same time, similar links may form between chitin and the hydroxylating polar substrate [37]. Therefore, the molecular bridge can gain the strength of covalent bonds (about 1500 pN). The molecular chain is stretched under an external force, and the force increases progressively at the elastic elongation region. When the molecular chain is sufficiently stretched, the molecular bridge breaks due to the high restoring force. The relationship between the extension distance and stretching force was recorded during experiment and subsequently converted into force–extension (F-E) curves. The data were collected during SMFS measurements and then converted into force–extension (F-E) curves. The spring constant of AFM cantilever obtained via thermos excitation ranged from 30 to 50 pN/nm. The stretching velocity was 2.0 μm/s. Three independent SMFS experiments were carried out in each condition to obtain more than 100 effective F-E curves. The raw SMFS F-E curves were analyzed using Igor Pro [55].

3.3. Details of AFM Imaging

All imaging experiments were carried out on the AFM mentioned above at RT and the standard atmospheric pressure. In order to present the molecular morphology as accurately as possible, highly oriented pyrolytic graphite (HOPG, Bruker Corp., Billerica, MA, USA) was used as the substrate for the physically adsorbed chitin solution. A total of 10 mL of environmental solution was poured between the HOPG surface and the AFM tip (SNL-10, Bruker Corp., Billerica, MA, USA). Tapping mode in solution was used in AFM imaging experiments. The spring constant of the AFM cantilever was ~0.35 N/m, and the cantilever resonance frequency was 28–35 KHz according to the composition of solution, which can influence the surface tension between the AFM tip surface and solution. The applied line rate in this study was relatively slow (0.8 Hz) to ensure the quality of AFM images. The images were analyzed using NanoScope Analysis 1.5 software [56]. No other processing was conducted on the images except flattening. Both SMFS and imaging experiments were carried out at room temperature (RT, 298 k).

3.4. Details of MD Simulations

All MD simulations of single-molecule chitin in different solutions were carried out using Material Studio 2020 software package. An amorphous cell that contained a chitin chain (5 repeating units and 10 saccharide rings in total), 1200 water molecules, and other components (HCl or NaOH) of a certain proportion was constructed. The size of the cell (about 30 Å × 30 Å × 50 Å) depended on the van der Waals radius of the system. The electrostatic and van der Waals interactions employed were Ewald and Atom-based. After the model had been constructed, the cell was geometrically optimized at an ultra-fine quality before analyzing dynamics. Subsequently, an equalization treatment was performed under NPT model for 5 ns to obtain the density (ρ) of the cell. After that, dynamic simulations under NVT were performed for 20 ns for data collection. All dynamic simulations were carried out at RT. The selected thermostat was Andersen. The number of hydrogen bonds (H-bonds) corresponds to the statistical results based on the dynamic simulation during the data collection step. COMPASSII was the chosen forcefield for all cases.

4. Conclusions

In summary, the pH sensitivity of chitin in aqueous solutions was systematically investigated at the single-molecule level in this study through SMFS, AFM imaging, and MD simulations. The results reveal that the pH value, especially the critical pH values (3 and 11), can profoundly influence both the elasticity and the molecular conformation of a chitin chain. Under acidic conditions, benefiting from the high ratio of intermolecular H-bonds, chitin exists in a spreading free chain conformation and shows dominant elasticity under low forces. Moreover, the characteristic viscosity  η  of chitin also significantly increases with the acidity. Chitin possesses a high ratio of intramolecular H-bonds in alkaline solutions (pH    11 ), helping the chain to form a hydrophobic molecular globule and possess a low  η . This basic research may not only be helpful for the design of intelligent chitin drugs and chitin–polymer hydrogels of different natures for tissue-engineering applications and the 3D printing of biomedical materials [57,58] but also provide an opportunity to investigate the properties of the cell walls of fungi under pH stress.

Supplementary Materials

The following supporting information can be downloaded at: https://www.mdpi.com/article/10.3390/molecules28196769/s1. Figure S1: Typical original F-E curves of chitin obtained at pH = 5; Figure S2: Typical original F-E curves of chitin obtained at pH = 3; Figure S3: Typical original F-E curves of chitin obtained at pH = 1; Figure S4: Typical original F-E curves of chitin obtained at pH = 9; Figure S5: Typical original F-E curves of chitin obtained at pH = 11; Figure S6: Typical original F-E curves of chitin obtained at pH = 13; Figure S7: Fitting results of TSQM-FJC and TSQM-FRC models on the F-E curves of chitin obtained in DI water. Obvious deviations can be noticed between the theoretical curves and the experiment curve; Figure S8: The area difference of chitin in alkaline solutions compared to that in DI water; Figure S9: MFJC model fitting on the F-E curves of chitin at pH = 3 and 11; Figure S10: Statistical result of the end-end distance of chitin at pH = 3, pure water and pH = 11. Reference [59] is cited in the supplementary materials.

Author Contributions

Conceptualization, S.Z.; methodology, L.Q. and H.Z.; validation, S.Z., H.Z. and L.Q.; investigation, S.Z., M.Y., G.Z., G.H., Y.J. and J.D.; data curation, S.Z., H.Z. and L.Q.; writing—original draft preparation, S.Z.; writing—review and editing, L.Q., H.Z. and S.Z.; funding acquisition, S.Z. and H.Z. All authors have read and agreed to the published version of the manuscript.

Funding

This work was supported by the National Natural Science Foundation of China (22262020), the Scientific Research Project of the Education Department of Guizhou province ([2022]410), and the Research Foundation for Scientific Scholars of Moutai Institute (mygccrc [2022]076, mygccrc [2022]081).

Data Availability Statement

All the relevant data used in this study have been provided in the form of figures and tables in the published article, and all data provided in the present manuscript are available to whom they may concern.

Conflicts of Interest

The authors declare no conflict of interest.

Sample Availability

Samples of the compounds (including chitin, hydrochloric acid and NaOH) are available from the authors.

References

  1. Chen, C.; Li, D.; Yano, H.; Abe, K. Insect cuticle-mimetic hydrogels with high mechanical properties achieved via the combination of chitin nanofiber and gelatin. J. Agric. Food Chem. 2019, 67, 5571–5578. [Google Scholar] [CrossRef]
  2. Ma, M.; Zhong, Y.; Jiang, X. Thermosensitive and pH-responsive tannin-containing hydroxypropyl chitin hydrogel with long-lasting antibacterial activity for wound healing. Carbohydr. Polym. 2020, 236, 116096. [Google Scholar] [CrossRef]
  3. Cho, Y.-W.; Cho, Y.-N.; Chung, S.-H.; Yoo, G.; Ko, S.-W. Water-soluble chitin as a wound healing accelerator. Biomaterials 1999, 20, 2139–2145. [Google Scholar] [CrossRef]
  4. Izumi, R.; Komada, S.; Ochi, K.; Karasawa, L.; Osaki, T.; Murahata, Y.; Tsuka, T.; Imagawa, T.; Itoh, N.; Okamoto, Y. Favorable effects of superficially deacetylated chitin nanofibrils on the wound healing process. Carbohydr. Polym. 2015, 123, 461–467. [Google Scholar] [CrossRef]
  5. Xu, H.; Fang, Z.; Tian, W.; Wang, Y.; Ye, Q.; Zhang, L.; Cai, J. Green fabrication of amphiphilic quaternized β-chitin derivatives with excellent biocompatibility and antibacterial activities for wound healing. Adv. Mater. 2018, 30, 1801100. [Google Scholar] [CrossRef]
  6. Liao, J.; Hou, B.; Huang, H. Preparation, properties and drug controlled release of chitin-based hydrogels: An updated review. Carbohydr. Polym. 2022, 283, 119177. [Google Scholar] [CrossRef]
  7. Fan, Z.; Wang, L.; Qin, Y.; Li, P. Activity of chitin/chitosan/chitosan oligosaccharide against plant pathogenic nematodes and potential modes of application in agriculture: A review. Carbohydr. Polym. 2023, 306, 120592. [Google Scholar] [CrossRef]
  8. Shen, X.; Shamshina, J.L.; Berton, P.; Gurau, G.; Rogers, R.D. Hydrogels based on cellulose and chitin: Fabrication, properties, and applications. Green Chem. 2016, 18, 53–75. [Google Scholar] [CrossRef]
  9. Yu, Y.; Gim, S.; Kim, D.; Arnon, Z.A.; Gazit, E.; Seeberger, P.H.; Delbianco, M. Oligosaccharides self-assemble and show intrinsic optical properties. J. Am. Chem. Soc. 2019, 141, 4833–4838. [Google Scholar] [CrossRef]
  10. Xue, C.; You, J.; Zhang, H.; Xiong, S.; Yin, T.; Huang, Q. Capacity of myofibrillar protein to adsorb characteristic fishy-odor compounds: Effects of concentration, temperature, ionic strength, pH and yeast glucan addition. Food Chem. 2021, 363, 130304. [Google Scholar] [CrossRef]
  11. Walker, G.M.; Basso, T.O. Mitigating stress in industrial yeasts. Fungal Biol. 2020, 124, 387–397. [Google Scholar] [CrossRef]
  12. Abdel Latef, A.A.H.; Mostofa, M.G.; Rahman, M.M.; Abdel-Farid, I.B.; Tran, L.-S.P. Extracts from yeast and carrot roots enhance maize performance under seawater-induced salt stress by altering physio-biochemical characteristics of stressed plants. J. Plant Growth Regul. 2019, 38, 966–979. [Google Scholar] [CrossRef]
  13. Suryawanshi, N.; Eswari, J.S. Chitin from seafood waste: Particle swarm optimization and neural network study for the improved chitinase production. J. Chem. Technol. Biotechnol. 2022, 97, 509–519. [Google Scholar] [CrossRef]
  14. Sherrington, S.L.; Sorsby, E.; Mahtey, N.; Kumwenda, P.; Lenardon, M.D.; Brown, I.; Ballou, E.R.; MacCallum, D.M.; Hall, R.A. Adaptation of Candida albicans to environmental pH induces cell wall remodelling and enhances innate immune recognition. PLoS Pathog. 2017, 13, e1006403. [Google Scholar] [CrossRef] [PubMed]
  15. Jayakumar, R.; Nair, A.; Rejinold, N.S.; Maya, S.; Nair, S. Doxorubicin-loaded pH-responsive chitin nanogels for drug delivery to cancer cells. Carbohydr. Polym. 2012, 87, 2352–2356. [Google Scholar] [CrossRef]
  16. Valdivieso, H.; Durán, A.; Roncero, C.J.E. Chitin synthases in yeast and fungi. Exs 1999, 87, 55–69. [Google Scholar]
  17. Cabib, E.; Arroyo, J. How carbohydrates sculpt cells: Chemical control of morphogenesis in the yeast cell wall. Nat. Rev. Microbiol. 2013, 11, 648–655. [Google Scholar] [CrossRef] [PubMed]
  18. Imai, T.; Nakajima, I.; Ohno, T. Development of a new method for evaluation of yeast vitality by measuring intracellular pH. J. Am. Soc. Brew. Chem. 1994, 52, 5–8. [Google Scholar] [CrossRef]
  19. Heilmann, C.J.; Sorgo, A.G.; Mohammadi, S.; Sosinska, G.J.; de Koster, C.G.; Brul, S.; de Koning, L.J.; Klis, F.M. Surface stress induces a conserved cell wall stress response in the pathogenic fungus Candida albicans. Eukaryot. Cell 2013, 12, 254–264. [Google Scholar] [CrossRef]
  20. Jayakumar, R.; Prabaharan, M.; Nair, S.; Tokura, S.; Tamura, H.; Selvamurugan, N. Novel carboxymethyl derivatives of chitin and chitosan materials and their biomedical applications. Prog. Mater. Sci 2010, 55, 675–709. [Google Scholar] [CrossRef]
  21. Wang, X.; Zhou, P.; Lv, X.; Liang, Y. Insight into the structure-function relationships of the solubility of chitin/chitosan in natural deep eutectic solvents. Mater. Today Commun. 2021, 27, 102374. [Google Scholar] [CrossRef]
  22. Hou, F.; He, L.; Ma, X.; Wang, D.; Ding, T.; Ye, X.; Liu, D. Ultrasound enhanced the binding ability of chitinase onto chitin: From an AFM insight. Ultrason. Sonochem. 2020, 67, 105117. [Google Scholar] [CrossRef] [PubMed]
  23. Sánchez-Vallet, A.; Tian, H.; Rodriguez-Moreno, L.; Valkenburg, D.-J.; Saleem-Batcha, R.; Wawra, S.; Kombrink, A.; Verhage, L.; de Jonge, R.; van Esse, H.P. A secreted LysM effector protects fungal hyphae through chitin-dependent homodimer polymerization. PLoS Pathog. 2020, 16, e1008652. [Google Scholar] [CrossRef] [PubMed]
  24. Zhang, Q.M.; Jaroniec, J.; Lee, G.; Marszalek, P.E. Direct detection of inter-residue hydrogen bonds in polysaccharides by single-molecule force spectroscopy. Angew. Chem. Int. Edit. 2005, 44, 2723–2727. [Google Scholar] [CrossRef] [PubMed]
  25. Pfitzner, E.; Wachauf, C.; Kilchherr, F.; Pelz, B.; Shih, W.M.; Rief, M.; Dietz, H. Rigid DNA beams for high-resolution single-molecule mechanics. Angew. Chem. Int. Edit. 2013, 52, 7766–7771. [Google Scholar] [CrossRef]
  26. Li, H.; Rief, M.; Oesterhelt, F.; Gaub, H.E.; Zhang, X.; Shen, J. Single-molecule force spectroscopy on polysaccharides by AFM–nanomechanical fingerprint of α-(1, 4)-linked polysaccharides. Chem. Phys. Lett. 1999, 305, 197–201. [Google Scholar] [CrossRef]
  27. Cai, W.; Bullerjahn, J.T.; Lallemang, M.; Kroy, K.; Balzer, B.N.; Hugel, T. Angle-dependent strength of a single chemical bond by stereographic force spectroscopy. Chem. Sci. 2022, 13, 5734–5740. [Google Scholar] [CrossRef]
  28. Cai, W.; Jäger, M.; Bullerjahn, J.T.; Hugel, T.; Wolf, S.; Balzer, B.N. Anisotropic Friction in a Ligand-Protein Complex. Nano Lett. 2023, 23, 4111–4119. [Google Scholar] [CrossRef]
  29. Cai, W.; Trefs, J.L.; Hugel, T.; Balzer, B.N. Anisotropy of π–π Stacking as Basis for Superlubricity. ACS Mater. Lett. 2022, 5, 172–179. [Google Scholar] [CrossRef]
  30. Lei, H.; Zhang, J.; Li, Y.; Wang, X.; Qin, M.; Wang, W.; Cao, Y. Histidine-specific bioconjugation for single-molecule force spectroscopy. ACS Nano 2022, 16, 15440–15449. [Google Scholar] [CrossRef]
  31. Milles, L.F.; Gaub, H.E. Extreme mechanical stability in protein complexes. Curr. Opin. Struct. Biol. 2020, 60, 124–130. [Google Scholar] [CrossRef] [PubMed]
  32. Sun, Y.; Di, W.; Li, Y.; Huang, W.; Wang, X.; Qin, M.; Wang, W.; Cao, Y. Mg2+-Dependent High Mechanical Anisotropy of Three-Way-Junction pRNA as Revealed by Single-Molecule Force Spectroscopy. Angew. Chem. Int. Ed. 2017, 56, 9376–9380. [Google Scholar] [CrossRef]
  33. Müller, D.J.; Gaub, H.E. Membrane proteins scrambling through a folding landscape. Science 2017, 355, 907–908. [Google Scholar] [CrossRef] [PubMed]
  34. Baumann, F.; Bauer, M.S.; Milles, L.F.; Alexandrovich, A.; Gaub, H.E.; Pippig, D.A. Monovalent Strep-Tactin for strong and site-specific tethering in nanospectroscopy. Nat. Nanotechnol. 2016, 11, 89–94. [Google Scholar] [CrossRef] [PubMed]
  35. Juan, M.L.; Righini, M.; Quidant, R. Plasmon nano-optical tweezers. Nat. Photonics 2011, 5, 349–356. [Google Scholar] [CrossRef]
  36. Neuman, K.C.; Nagy, A. Single-molecule force spectroscopy: Optical tweezers, magnetic tweezers and atomic force microscopy. Nat. Methods 2008, 5, 491–505. [Google Scholar] [CrossRef] [PubMed]
  37. Bao, Y.; Luo, Z.; Cui, S. Environment-dependent single-chain mechanics of synthetic polymers and biomacromolecules by atomic force microscopy-based single-molecule force spectroscopy and the implications for advanced polymer materials. Chem. Soc. Rev. 2020, 49, 2799–2827. [Google Scholar] [CrossRef]
  38. Hospital, A.; Goñi, J.R.; Orozco, M.; Gelpí, J.L. Molecular dynamics simulations: Advances and applications. Adv. Appl. Bioinform. 2015, 19, 37–47. [Google Scholar]
  39. Qian, L.; Guo, X.; Zhang, K.; Yu, M. Effects of hydrogen bonds on the single-chain mechanics of chitin. Phys. Chem. Chem. 2022, 24, 24535–24541. [Google Scholar] [CrossRef]
  40. Yang, P.; Song, Y.; Feng, W.; Zhang, W. Unfolding of a single polymer chain from the single crystal by air-phase single-molecule force spectroscopy: Toward better force precision and more accurate description of molecular behaviors. Macromolecules 2018, 51, 7052–7060. [Google Scholar] [CrossRef]
  41. Zhang, T.; Mahgsoudy-Louyeh, S.; Tittmann, B.; Cosgrove, D.J. Visualization of the nanoscale pattern of recently-deposited cellulose microfibrils and matrix materials in never-dried primary walls of the onion epidermis. Cellulose 2014, 21, 853–862. [Google Scholar] [CrossRef]
  42. Zhang, S.; Li, Z.; Bao, Y.; Lu, S.; Gong, Z.; Qian, H.-J.; Lu, Z.-Y.; Cui, S. Nanoscopic Characterization Reveals that Bulk Amorphous Elementary Boron Is Composed of a Ladder-like Polymer with B4 as the Structural Unit. ACS Nano 2023, 17, 10958–10964. [Google Scholar] [CrossRef] [PubMed]
  43. Lostao, A.; Lim, K.; Pallarés, M.C.; Ptak, A.; Marcuello, C. Recent advances in sensing the inter-biomolecular interactions at the nanoscale–A comprehensive review of AFM-based force spectroscopy. Int. J. Biol. Macromol. 2023, 238, 124089. [Google Scholar] [CrossRef]
  44. Edwards, D.T.; LeBlanc, M.-A.; Perkins, T.T. Modulation of a protein-folding landscape revealed by AFM-based force spectroscopy notwithstanding instrumental limitations. Proc. Natl. Acad. Sci. USA 2021, 118, e2015728118. [Google Scholar] [CrossRef]
  45. Yi, Y.; Xu, H.; Wang, L.; Cao, W.; Zhang, X. A New Dynamic Covalent Bond of Se—N: Towards Controlled Self-Assembly and Disassembly. Chem. Eur. J. 2013, 19, 9506–9510. [Google Scholar] [CrossRef] [PubMed]
  46. Cai, W.; Lu, S.; Wei, J.; Cui, S. Single-chain polymer models incorporating the effects of side groups: An approach to general polymer models. Macromolecules 2019, 52, 7324–7330. [Google Scholar] [CrossRef]
  47. Bao, Y.; Qian, H.-J.; Lu, Z.-Y.; Cui, S. The unexpected flexibility of natural cellulose at a single-chain level and its implications to the design of nano materials. Nanoscale 2014, 6, 13421–13424. [Google Scholar] [CrossRef]
  48. Qian, L.; Cai, W.; Xu, D.; Bao, Y.; Lu, Z.-Y.; Cui, S. Single-molecule studies reveal that water is a special solvent for amylose and natural cellulose. Macromolecules 2019, 52, 5006–5013. [Google Scholar] [CrossRef]
  49. Milião, G.L.; de Souza Soares, L.; Balbino, D.F.; Barbosa, É.d.A.A.; Bressan, G.C.; de Carvalho Teixeira, A.V.N.; dos Reis Coimbra, J.S.; de Oliveira, E.B. pH influence on the mechanisms of interaction between chitosan and ovalbumin: A multi-spectroscopic approach. Food Hydrocoll. 2022, 123, 107137. [Google Scholar] [CrossRef]
  50. Cao, N.; Zhao, Y.; Chen, H.; Huang, J.; Yu, M.; Bao, Y.; Wang, D.; Cui, S. Poly (ethylene glycol) becomes a supra-polyelectrolyte by capturing hydronium ions in water. Macromolecules 2022, 55, 4656–4664. [Google Scholar] [CrossRef]
  51. Huang, J.; Zhong, Y.; Zhang, L.; Cai, J. Distinctive viewpoint on the rapid dissolution mechanism of α-chitin in aqueous potassium hydroxide–urea solution at low temperatures. Macromolecules 2020, 53, 5588–5598. [Google Scholar] [CrossRef]
  52. Zhang, S.; Qian, H.J.; Liu, Z.H.; Ju, H.Y.; Lu, Z.Y.; Zhang, H.M.; Chi, L.F.; Cui, S.X. Towards unveiling the exact molecular structure of amorphous red phosphorus by single-molecule studies. Angew. Chem. Int. Ed. 2019, 58, 1659–1663. [Google Scholar] [CrossRef]
  53. Bao, Y.; Qian, H.J.; Lu, Z.Y.; Cui, S. Revealing the hydrophobicity of natural cellulose by single-molecule experiments. Macromolecules 2015, 48, 3685–3690. [Google Scholar] [CrossRef]
  54. Yamamoto, E.; Akimoto, T.; Mitsutake, A.; Metzler, R. Universal relation between instantaneous diffusivity and radius of gyration of proteins in aqueous solution. Phys. Rev. Lett. 2021, 126, 128101. [Google Scholar] [CrossRef] [PubMed]
  55. Jayakumar, R.; Prabaharan, M.; Kumar, P.S.; Nair, S.; Tamura, H. Biomaterials based on chitin and chitosan in wound dressing applications. Biotechnol. Adv. 2011, 29, 322–337. [Google Scholar] [CrossRef]
  56. Hao, L.T.; Park, S.; Choy, S.; Kim, Y.-M.; Lee, S.-W.; Ok, Y.S.; Koo, J.M.; Hwang, S.Y.; Hwang, D.S.; Park, J. Strong, multifaceted guanidinium-based adhesion of bioorganic nanoparticles to wet biological tissue. JACS Au 2021, 1, 1399–1411. [Google Scholar] [CrossRef] [PubMed]
  57. Pele, K.G.; Amaveda, H.; Mora, M.; Marcuello, C.; Lostao, A.; Alamán-Díez, P.; Pérez-Huertas, S.; Ángeles Pérez, M.; García-Aznar, J.M.; García-Gareta, E. Hydrocolloids of Egg White and Gelatin as a Platform for Hydrogel-Based Tissue Engineering. Gels 2023, 9, 505. [Google Scholar] [CrossRef] [PubMed]
  58. Köhler, M.; Karner, A.; Leitner, M.; Hytönen, V.P.; Kulomaa, M.; Hinterdorfer, P.; Ebner, A. pH-dependent deformations of the energy landscape of avidin-like proteins investigated by single molecule force spectroscopy. Molecules 2014, 19, 12531–12546. [Google Scholar] [CrossRef]
  59. Zhang, F.; Gong, Z.; Cai, W.; Qian, H.-J.; Lu, Z.-Y.; Cui, S. Single-chain mechanics of cis-1, 4-polyisoprene and polysulfide. Polymer 2022, 240, 124473. [Google Scholar] [CrossRef]
Figure 1. (A) The chemical structure of chitin. (B) A schematic drawing of the working principle of SMFS.
Molecules 28 06769 g001
Figure 2. Typical F-E curves of chitin obtained in DI water. (A) Original F-E curve. (B) Normalized effect of those shown in (A), and the fitting result obtained using the TSQM-FJC model.
Molecules 28 06769 g002
Figure 3. Typical normalized F-E curves of chitin obtained in HCl aqueous solutions of pH = 5 (A), pH = 3 (B), and pH = 1 (C). (D) Direct comparison of the F-E curves of chitin obtained in acidic conditions and the fitting result obtained using the TSQM-FJC model.
Molecules 28 06769 g003
Figure 4. (AC) Typical normalized F-E curves of chitin obtained in NaOH solutions with different pH values. (D) Direct comparison of the typical F-E curves shown in (AC).
Molecules 28 06769 g004
Figure 5. (A) Direct comparison of the F-E curves of chitin obtained at pH = 3, in DI water, and at pH = 11. (BD) Molecular morphology of chitin obtained in DI water, at pH = 3, and at pH = 11, respectively.
Molecules 28 06769 g005
Figure 6. MD simulation results of chitin in aqueous solutions with different pH levels. (A) The typical molecular conformation of chitin under the tested conditions. (B) The Rg of a chitin chain under different conditions (blue: pH = 11, black: pure water, and red: pH = 3). (CE) The normalized  η  and the total number of intramolecular and intermolecular H-bonds of a chitin chain under different conditions, respectively (blue: pH = 11, cyan: pure water, and pink: pH = 3).
Molecules 28 06769 g006
Disclaimer/Publisher’s Note: The statements, opinions and data contained in all publications are solely those of the individual author(s) and contributor(s) and not of MDPI and/or the editor(s). MDPI and/or the editor(s) disclaim responsibility for any injury to people or property resulting from any ideas, methods, instructions or products referred to in the content.