
Analyzing the Material Basis of Anti-RSV Efficacy of Lonicerae japonicae Flos Based on the PK-PD Model

Abstract
:
1. Introduction
2. Results
2.1. Selection of 15 Compounds for Pharmacokinetic Study
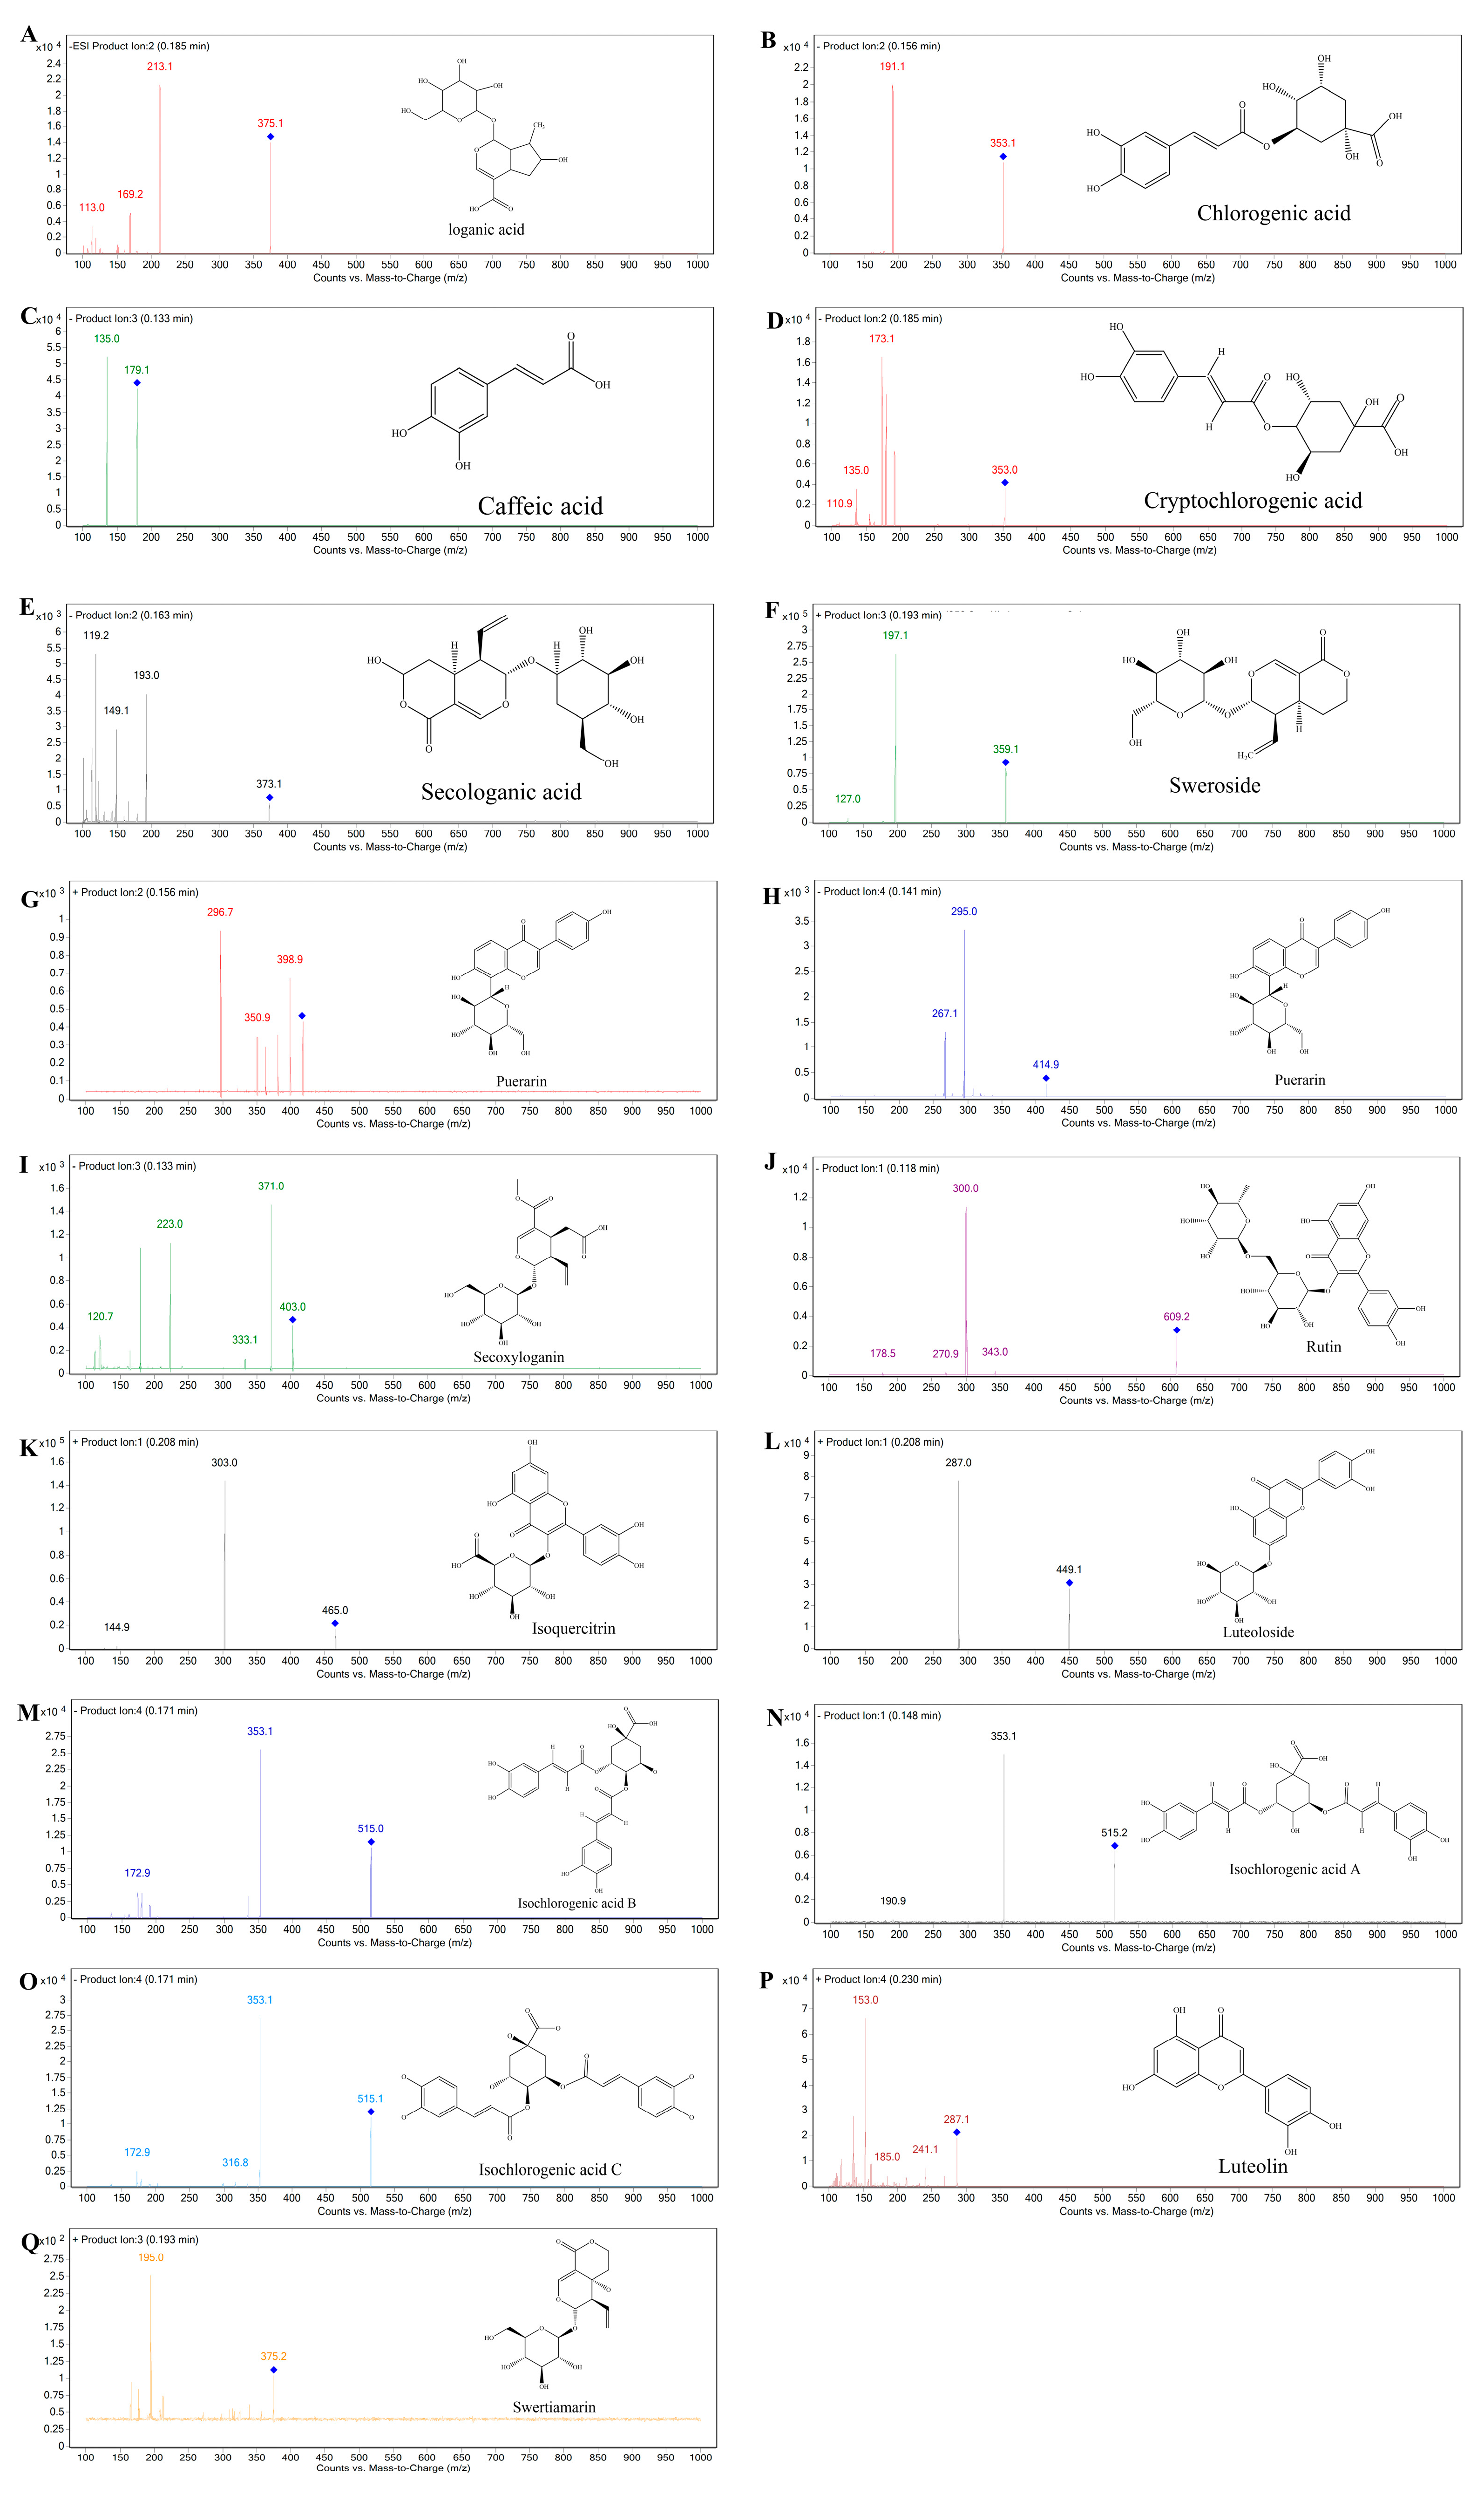
2.2. Optimization of Mass Spectrometry Conditions
2.3. Method Validation
2.3.1. Specificity
2.3.2. Linearity and Lower Limit of Quantification (LLOQ)
2.3.3. Accuracy and Precision
2.3.4. Matrix Effects and Extraction Recovery
2.3.5. Stability
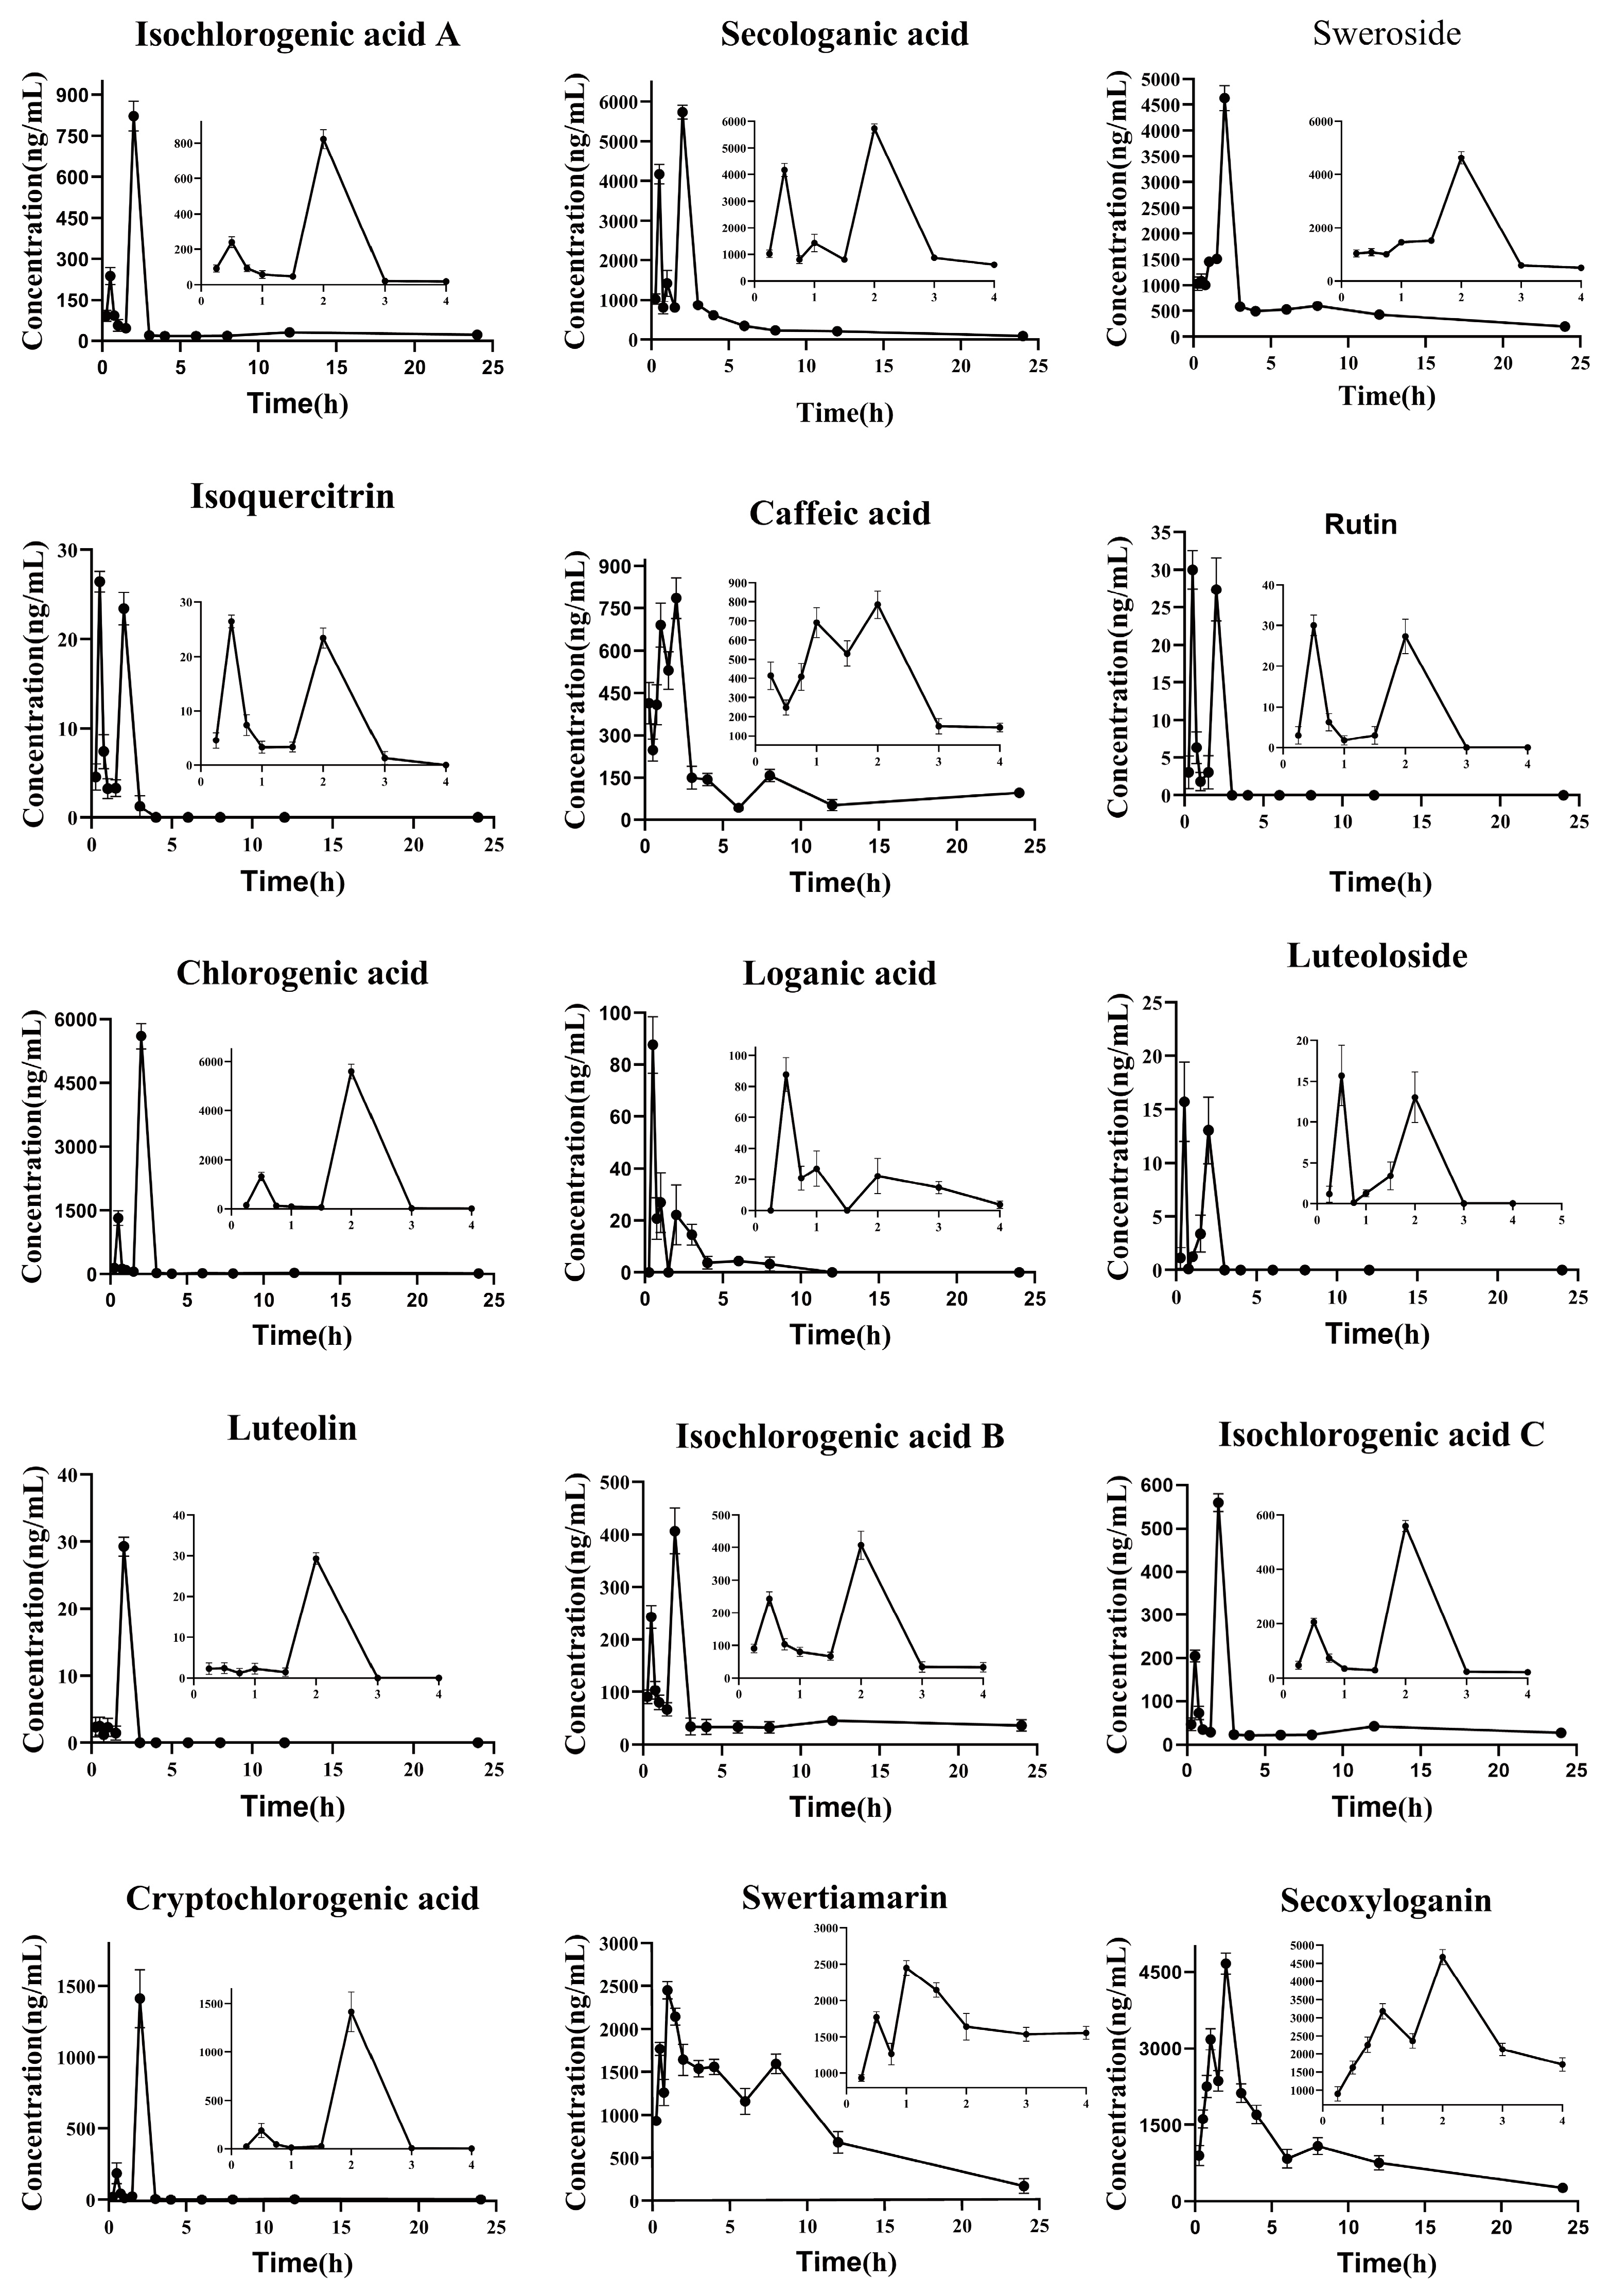
2.4. Pharmacokinetics Study
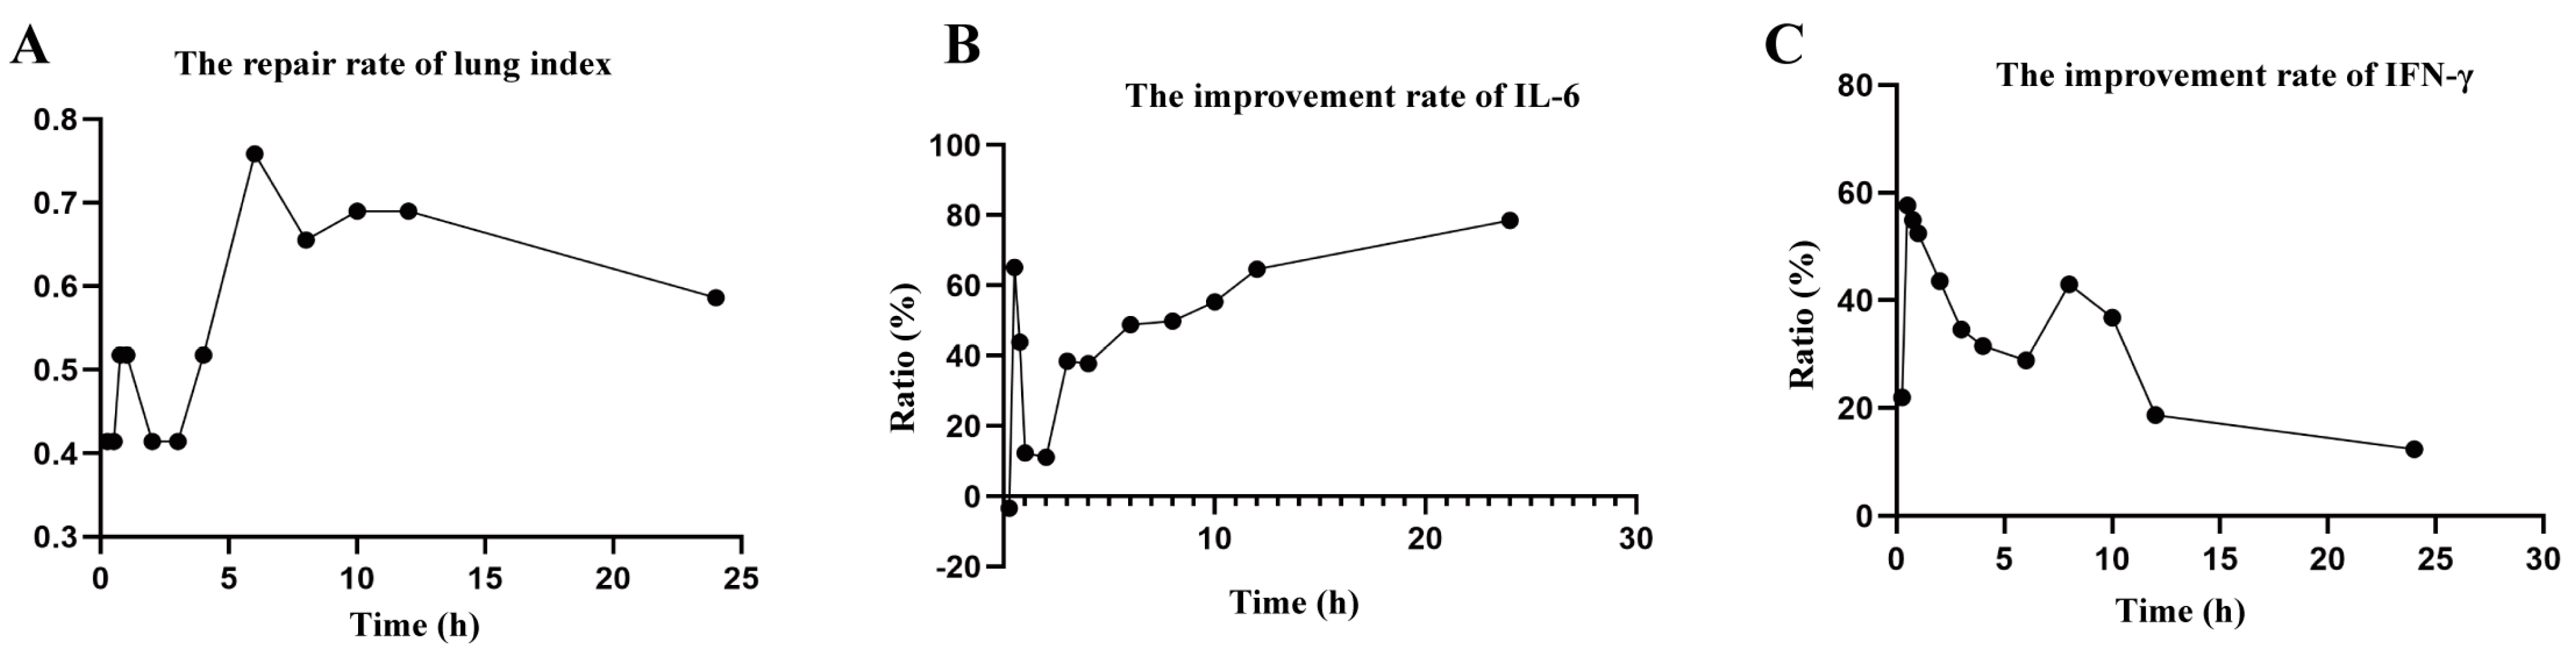
2.5. Pharmacodynamic Experiment
2.6. Correlation Analysis
2.6.1. Comprehensive Weight Score of Pharmacodynamic Indexes
2.6.2. Spearman Correlation Analysis
2.6.3. Grey Relation Analysis
3. Discussion
4. Materials and Methods
4.1. Materials and Chemicals
4.2. Animals
4.3. Pharmacokinetic Study
4.3.1. Preparation of Sample Solutions
4.3.2. Establishment of Animal Model and Drug Treatment
4.3.3. Preparation of Standard Solutions and Quality Control (QC) Samples
4.3.4. Preparation of Plasma Samples
4.3.5. Instruments and Analytical Conditions
4.3.6. Method Validation
4.3.7. Data Analysis of the Pharmacokinetic Study
4.4. Pharmacodynamic Experiment
Pharmacodynamic Index–Time Curve Drawing
4.5. Correlation Analysis
4.5.1. Comprehensive Weight Score of Efficacy Index
4.5.2. Spearman Correlation Analysis
4.5.3. Grey Relation Analysis
5. Conclusions
Supplementary Materials
Author Contributions
Funding
Institutional Review Board Statement
Informed Consent Statement
Data Availability Statement
Conflicts of Interest
Sample Availability
References
- Borchers, A.T.; Chang, C.; Gershwin, M.E.; Gershwin, L.J. Respiratory Syncytial Virus—A Comprehensive Review. Clin. Rev. Allerg. Immunol. 2021, 45, 331–379. [Google Scholar] [CrossRef]
- Jartti, T.; Bønnelykke, K.; Elenius, V.; Feleszko, W. Role of Viruses in Asthma. Semin. Immunopathol. 2020, 42, 61–74. [Google Scholar] [CrossRef] [PubMed]
- Jartti, T.; Gern, J.E. Role of Viral Infections in the Development and Exacerbation of Asthma in Children. J. Allergy Clin. Immunol. 2017, 140, 895–906. [Google Scholar] [CrossRef]
- Nam, H.H.; Ison, M.G. Respiratory Syncytial Virus Infection in Adults. BMJ 2019, 366, l5021. [Google Scholar] [CrossRef] [PubMed]
- Chen, W.; Chen, Y.-H.; Liao, Y.-C.; Huang, X.-W.; Lu, T.-J.; Shih, S.-R. Effect of Hot Water Extracts of Arthrospira Maxima (Spirulina) against Respiratory Syncytial Virus. Phytomedicine 2023, 110, 154611. [Google Scholar] [CrossRef]
- Stephens, L.M.; Varga, S.M. Function and Modulation of Type I Interferons during Respiratory Syncytial Virus Infection. Vaccines 2020, 8, 177. [Google Scholar] [CrossRef]
- Mao, Y.; Bajinka, O.; Tang, Z.; Qiu, X.; Tan, Y. Lung-Brain Axis: Metabolomics and Pathological Changes in Lungs and Brain of Respiratory Syncytial Virus-Infected Mice. J. Med. Virol. 2022, 94, 5885–5893. [Google Scholar] [CrossRef]
- Yang, X.; Liu, Y.; Hou, A.; Yang, Y.; Tian, X.; He, L. Systematic Review for Geo-Authentic Lonicerae japonicae Flos. Front. Med. 2017, 11, 203–213. [Google Scholar] [CrossRef]
- Li, Y.; Li, W.; Fu, C.; Song, Y.; Fu, Q. Lonicerae japonicae Flos and Lonicerae Flos: A Systematic Review of Ethnopharmacology, Phytochemistry and Pharmacology. Phytochem. Rev. 2020, 19, 1–61. [Google Scholar] [CrossRef]
- Ma, S.-C.; Du, J.; But, P.P.-H.; Deng, X.-L.; Zhang, Y.-W.; Ooi, V.E.-C.; Xu, H.-X.; Lee, S.H.-S.; Lee, S.F. Antiviral Chinese Medicinal Herbs against Respiratory Syncytial Virus. J. Ethnopharmacol. 2021, 79, 205–211. [Google Scholar] [CrossRef]
- Du, J. Regulation effect of chlorogenic acid on TLR3 signal transduction pathway in RAW264.7 cells infected with RSV. J. Qiqihar Univ. Med. 2017, 38, 626–628. [Google Scholar]
- Ding, J.; Yan, G.; Yang, P.; Zhang, Y.; Liu, Y. Study on Fingerprint and in vitro Antiviral Activity of Lonicera japonica Polysaccharide. China Pharm. 2020, 31, 1061–1067. [Google Scholar] [CrossRef]
- Li, J.-M.; Huang, A.-X.; Yang, L.; Li, P.; Gao, W. A Sensitive LC-MS/MS Method-Based Pharmacokinetic Study of Fifteen Active Ingredients of Yindan Xinnaotong Soft Capsule in Rats and Its Potential Mechanism in the Treatment of Cardiovascular Diseases. J. Chromatogr. B 2023, 1220, 123663. [Google Scholar] [CrossRef] [PubMed]
- Cuzick, J. Rank Tests for Association with Right Censored Data. Biometrika 1982, 69, 351–364. [Google Scholar] [CrossRef]
- Ju-Long, D. Control Problems of Grey Systems. Syst. Control Lett. 1982, 1, 288–294. [Google Scholar] [CrossRef]
- Li, C.; Lv, J.; Yang, L.; Zhao, B.; Gao, Y. Integrate Network Pharmacology Toexplore the Anti-RSV Pneumonia Mechanism of Lonicera japonica Thunb. Based upon UPLC-Q-Exactive-Orbitrap-MS. Chin. J. Hosp. Pharm. 2021, 41, 769–776. [Google Scholar]
- Li, Z.; Wen, R.; Du, Y.; Zhao, S.; Zhao, P.; Jiang, H.; Rong, R.; Lv, Q. Simultaneous Quantification of Fifteen Compounds in Rat Plasma by LC-MS/MS and Its Application to a Pharmacokinetic Study of Chaihu-Guizhi Decoction. J. Chromatogr. B 2019, 1105, 15–25. [Google Scholar] [CrossRef]
- Zhou, W.; Tam, K.Y.; Meng, M.; Shan, J.; Wang, S.; Ju, W.; Cai, B.; Di, L. Pharmacokinetics Screening for Multi-Components Absorbed in the Rat Plasma after Oral Administration of Traditional Chinese Medicine Flos Lonicerae japonicae–Fructus Forsythiae Herb Couple by Sequential Negative and Positive Ionization Ultra-High-Performance Liquid Chromatography/Tandem Triple Quadrupole Mass Spectrometric Detection. J. Chromatogr. A 2015, 1376, 84–97. [Google Scholar] [CrossRef]
- Konishi, Y.; Kobayashi, S. Transepithelial Transport of Chlorogenic Acid, Caffeic Acid, and Their Colonic Metabolites in Intestinal Caco-2 Cell Monolayers. J. Agric. Food Chem. 2004, 52, 2518–2526. [Google Scholar] [CrossRef]
- Zhou, J.; Ma, H.; Fan, X.; Xiao, W.; Wang, T. Molecular docking of chlorogenic acid,3,4-di-O-caffeoylquinic acid and 3,5-di-O-caffeoylquinic acid with human serum albumin. J. Chin. Integr. Med. 2012, 10, 1149–1154. [Google Scholar] [CrossRef]
- Luo, Y.-D.; Chen, J.; Cao, J.; Wen, X.-D.; Li, P. Determination of Sweroside in Rat Plasma and Bile for Oral Bioavailability and Hepatobiliary Excretion. Chem. Pharm. Bull. 2009, 57, 79–83. [Google Scholar] [CrossRef] [PubMed]
- Zhang, Y.-D. Study on the Chemical Markers of Caulis Lonicerae japonicae for Quality Control by HPLC-QTOF/MS/MS and Chromatographic Fingerprints Combined with Chemometrics Methods. Anal. Methods 2015, 7, 2064–2076. [Google Scholar] [CrossRef]
- Xiong, L.; Zhao, H.; Wang, Y.; Liu, Y.; Jin, Y.; Zhang, L.; Zhang, Y. Study on Phenolic Acids of Lonicerae japonicae Flos Based on Ultrahigh Performance Liquid Chromatography-Tandem Mass Spectrometry Combined with Multivariate Statistical Analysis. J. Sep. Sci. 2022, 45, 2239–2251. [Google Scholar] [CrossRef] [PubMed]
- Ge, L.; Xiao, L.; Wan, H.; Li, J.; Lv, K.; Peng, S.; Zhou, B.; Li, T.; Zeng, X. Chemical Constituents from Lonicera japonica Flower Buds and Their Anti-Hepatoma and Anti-HBV Activities. Bioorg. Chem. 2019, 92, 103198. [Google Scholar] [CrossRef]
- Liu, Y.; Wang, G. Effect of Flos Lonicerae Extracts on Herpes Simplex Keratitis. Her. Med. 2011, 30, 1421–1424. [Google Scholar]
- Yeh, Y.-C.; Doan, L.H.; Huang, Z.-Y.; Chu, L.-W.; Shi, T.-H.; Lee, Y.-R.; Wu, C.-T.; Lin, C.-H.; Chiang, S.-T.; Liu, H.-K.; et al. Honeysuckle (Lonicera japonica) and Huangqi (Astragalus membranaceus) Suppress SARS-CoV-2 Entry and COVID-19 Related Cytokine Storm in Vitro. Front. Pharmacol. 2022, 12, 765553. [Google Scholar] [CrossRef]
- Xie, X.; Gu, L.; Xu, W.; Yu, X.; Yin, G.; Wang, J.; Jin, Y.; Wang, L.; Wang, B.; Wang, T. Integrating Anti-Influenza Virus Activity and Chemical Pattern Recognition to Explore the Quality Evaluation Method of Lonicerae japonicae Flos. Molecules 2022, 27, 5789. [Google Scholar] [CrossRef]
- Huang, C.-Y.; Lin, Y.-C.; Lu, Y.-C.; Chen, C.-I. Application of Grey Relational Analysis to Predict Dementia Tendency by Cognitive Function, Sleep Disturbances, and Health Conditions of Diabetic Patients. Brain Sci. 2022, 12, 1642. [Google Scholar] [CrossRef]
- Liu, X.; Zhang, W.; Wang, H.; Zhu, L.; Xu, K. Decreased Expression of ACADSB Predicts Poor Prognosis in Clear Cell Renal Cell Carcinoma. Front. Oncol. 2022, 11, 762629. [Google Scholar] [CrossRef]
- Li, Y.; But, P.P.H.; Ooi, V.E.C. Antiviral Activity and Mode of Action of Caffeoylquinic Acids from Schefflera heptaphylla (L.) Frodin. Antivir. Res. 2005, 68, 1–9. [Google Scholar] [CrossRef]
- Zhang, H.; Rothwangl, K.; Mesecar, A.D.; Sabahi, A.; Rong, L.; Fong, H.H.S. Lamiridosins, Hepatitis C Virus Entry Inhibitors from Lamium album. J. Nat. Prod. 2009, 72, 2158–2162. [Google Scholar] [CrossRef]
- National Commission of Chinese Pharmacopoeia. Pharmacopoeia of the People’s Republic of China; Chinese Medical Science and Technology Press: Beijing, China, 2020. [Google Scholar]


| Compound | Formula | Precursor Ion (m/z) | tR (min) | Fragment Ions (m/z) |
|---|---|---|---|---|
| Secologanic acid | C16H22O10 | 373.1143 [M − H]− | 3.99 | 179.0549, 149.0595, 123.0438, 59.0122 |
| Sweroside | C16H22O9 | 359.1336 [M + H]+ | 4.72 | 127.0393, 179.0705, 197.0811, 151.0757, 111.0810 |
| Chlorogenic acid | C16H18O9 | 353.0883 [M − H]− | 3.55 | 191.0553, 135.0439, 173.0445 |
| Cryptochlorogenic acid | C16H18O9 | 353.0880 [M − H]− | 3.91 | 191.0553, 135.0438, 173.0445, 93.0330, 85.0279 |
| Luteoloside | C21H20O11 | 447.0955 [M − H]− | 7.9 | 151.0024, 447.0955 |
| Isochlorogenic acid B | C25H24O12 | 515.1198 [M − H]− | 6.13 | 353.0882, 191.0553, 173.0445, 135.0438, 93.0330 |
| Isochlorogenic acid A | C25H24O12 | 515.1201 [M − H]− | 7.37 | 353.0882, 191.0553, 173.0445, 135.0438 |
| Isochlorogenic acid C | C25H24O12 | 515.1201 [M − H]− | 8.1 | 353.0883, 191.0554, 173.0446, 135.0439 |
| Swertiamarin | C16H22O10 | 373.1143 [M − H]− | 3.99 | 373.1143, 193.0499, 149.0595, 97.0279 |
| Luteolin | C15H10O6 | 287.0552 [M + H]+ | 10.07 | 153.0184, 135.0443 |
| Isoquercitrin | C21H20O12 | 463.0890 [M − H]− | 6.68 | 151.0025, 301.0349 |
| Secoxyloganin | C17H24O11 | 403.1252 [M − H]− | 5.39 | 139.0025, 121.0281, 223.0609 |
| Caffeic acid | C9H8O4 | 179.0340 [M − H]− | 4.09 | 135.0439 |
| Rutin | C27H30O16 | 609.1461 [M − H]− | 6.43 | 300.0279 |
| Components | Precursor Ion (m/z) | Product Ion (m/z) | Fragmentor (V) | Collision Energy (V) | Detected Ion |
|---|---|---|---|---|---|
| Secologanic acid | 373.1 | 192.9 | 245 | 15 | [M − H]− |
| Sweroside | 359.1 | 197.1 | 70 | 2 | [M + H]+ |
| Cryptochlorogenic acid | 353.1 | 173.1 | 230 | 10 | [M − H]− |
| Luteoloside | 449.0 | 287.1 | 105 | 10 | [M + H]+ |
| Isochlorogenic acid B | 515.1 | 353.0 | 140 | 18 | [M − H]− |
| Swertiamarin | 375.0 | 194.9 | 70 | 7 | [M + H]+ |
| Luteolin | 287.0 | 153.0 | 185 | 30 | [M + H]+ |
| Isoquercitrin | 465.1 | 303.1 | 95 | 4 | [M + H]+ |
| Isochlorogenic acid C | 515.1 | 353.0 | 140 | 10 | [M − H]− |
| Secoxyloganin | 403.0 | 371.3 | 230 | 9 | [M − H]− |
| Caffeic acid | 179.1 | 135.0 | 105 | 9 | [M − H]− |
| Chlorogenic acid | 353.2 | 191.1 | 210 | 8 | [M − H]− |
| Loganic acid | 375.1 | 213.1 | 270 | 15 | [M − H]− |
| Isochlorogenic acid A | 515.1 | 353.0 | 140 | 8 | [M − H]− |
| Rutin | 609.1 | 300.0 | 230 | 32 | [M − H]− |
| Puerarin | 417.3 | 296.9 | 140 | 25 | [M + H]+ |
| Puerarin | 415.1 | 295.1 | 195 | 20 | [M − H]− |
| Components | Calibration Curve | (Correlation Coefficient) R2 | Linear Range (ng/mL) | LLOQ (ng/mL) |
|---|---|---|---|---|
| Secologanic acid | y = 0.0001x − 0.1336 | 0.9967 | 40,000.000–50.000 | 50.000 |
| Sweroside | y = 0.0196x + 4.4734 | 0.9969 | 25,000.000–3.125 | 3.125 |
| Cryptochlorogenic acid | y = 0.0007x + 0.0249 | 0.9982 | 2.500–5000.000 | 2.500 |
| Luteoloside | y = 0.0256x + 0.0725 | 0.9998 | 1.250–1000.000 | 1.250 |
| Isochlorogenic acid B | y = 0.0042x − 2.6816 | 0.996 | 25.000–25,000.000 | 25.000 |
| Swertiamarin | y = 0.00008 + 0.0219 | 0.9939 | 50.000–20,000.000 | 50.000 |
| Luteolin | y = 0.0194x + 0.1584 | 0.9935 | 1.250–4000.000 | 1.250 |
| Isoquercitrin | y = 0.0132x − 0.1004 | 0.9991 | 2.500–4000.000 | 2.500 |
| Isochlorogenic acid C | y = 0.0093x − 1.7728 | 0.9918 | 12.500–10,000.000 | 12.500 |
| Secoxyloganin | y = 0.0008x − 0.202 | 0.9994 | 5.000–40,000.000 | 5.000 |
| Caffeic acid | y = 0.0092x − 0.3147 | 0.9949 | 50.000–20,000.000 | 50.000 |
| Chlorogenic acid | y = 0.0019x + 0.0455 | 0.9994 | 1.875–7500.000 | 1.875 |
| Loganic acid | y = 0.0003x + 0.0243 | 0.9971 | 2.500–10,000.000 | 2.500 |
| Isochlorogenic acid A | y = 0.0069x − 2.1725 | 0.9989 | 5.000–20,000.000 | 5.000 |
| Rutin | y = 0.0050x − 0.0593 | 1.0000 | 2.500–4000.000 | 2.500 |
| Components | Concentration (ng/mL) | Inter-Day | Intra-Day | ||
|---|---|---|---|---|---|
| Accuracy (RE%) | Precision (RSD%) | Accuracy (RE%) | Precision (RSD%) | ||
| Secologanic acid | 100.00 | −6.10 | 4.60 | −6.30 | 5.40 |
| 8000.00 | −7.30 | 5.30 | −7.80 | 6.70 | |
| 30,000.00 | −5.50 | 6.80 | −5.40 | 6.30 | |
| Sweroside | 6.25 | −7.40 | 8.10 | −7.10 | 3.40 |
| 5000.00 | −6.05 | 4.90 | −8.30 | 5.90 | |
| 18,750.00 | −4.30 | 5.20 | −7.90 | 3.60 | |
| Cryptochlorogenic acid | 6.25 | −5.60 | 5.40 | −2.40 | 7.80 |
| 2000.00 | −6.30 | 4.70 | −5.50 | 9.10 | |
| 5000.00 | −4.80 | 7.20 | −4.90 | 8.20 | |
| Luteoloside | 6.25 | −9.60 | 7.50 | −7.20 | 4.70 |
| 100.00 | −10.20 | 5.80 | −6.80 | 5.20 | |
| 1000.00 | −8.90 | 6.60 | −5.70 | 9.40 | |
| Isochlorogenic acid B | 500.00 | −6.70 | 5.70 | −5.20 | 7.10 |
| 5000.00 | −10.30 | 2.90 | −6.40 | 8.50 | |
| 18,750.00 | −2.10 | 3.80 | −7.10 | 4.30 | |
| Swertiamarin | 400.00 | −8.90 | 6.80 | −2.60 | 7.80 |
| 4000.00 | −7.60 | 6.40 | −9.80 | 10.20 | |
| 15,000.00 | −9.70 | 4.50 | −7.30 | 9.80 | |
| Luteolin | 6.25 | −2.90 | 3.90 | −4.90 | 2.10 |
| 200.00 | −6.30 | 3.10 | −5.60 | 1.80 | |
| 3000.00 | −6.70 | 8.60 | −1.90 | 3.20 | |
| Isoquercitrin | 50.00 | −8.20 | 6.60 | −3.80 | 10.90 |
| 200.00 | −7.30 | 5.40 | −6.20 | 7.30 | |
| 3000.00 | −4.80 | 7.20 | −5.30 | 6.40 | |
| Isochlorogenic acid C | 200.00 | −10.60 | 2.40 | −4.50 | 2.70 |
| 4000.00 | −4.80 | 4.50 | −2.90 | 3.80 | |
| 7500.00 | 5.20 | 5.70 | −5.80 | 1.60 | |
| Secoxyloganin | 10.00 | −4.30 | 6.80 | −6.10 | 5.10 |
| 400.00 | −4.80 | 6.60 | −5.50 | 3.50 | |
| 30,000.00 | −7.40 | 8.40 | −5.70 | 6.70 | |
| Caffeic acid | 400.00 | −6.80 | 10.70 | −4.30 | 8.30 |
| 4000.00 | −7.60 | 5.80 | −4.10 | 6.10 | |
| 15,000.00 | −9.80 | 3.40 | −2.60 | 4.90 | |
| Chlorogenic acid | 3.75 | −8.10 | 8.80 | −5.30 | 6.10 |
| 300.00 | −7.60 | 6.40 | −8.10 | 5.20 | |
| 5625.00 | −6.40 | 9.30 | −6.90 | 7.10 | |
| Loganic acid | 100.00 | −5.80 | 5.10 | −5.40 | 5.90 |
| 2000.00 | −7.20 | 6.70 | −6.00 | 9.20 | |
| 7500.00 | −3.40 | 7.50 | −3.70 | 5.60 | |
| Isochlorogenic acid A | 400.00 | −5.60 | 5.60 | −4.20 | 8.10 |
| 5000.00 | −8.10 | 2.70 | −4.30 | 4.70 | |
| 15,000.00 | −5.40 | 5.40 | −8.90 | 6.30 | |
| Rutin | 5.00 | −5.30 | 3.90 | −8.40 | 5.40 |
| 200.00 | −6.10 | 9.10 | −6.50 | 4.60 | |
| 3000.00 | −3.70 | 7.20 | −5.70 | 6.30 | |
| Components | Concentration | Recovery (%) | Matrix Effect (%) |
|---|---|---|---|
| (ng/mL) | (Mean ± SD) | (Mean ± SD) | |
| Secologanic acid | 100 | 86.1 ± 5.3 | 88.6 ± 6.3 |
| 8000 | 87.3 ± 4.5 | 92.0 ± 2.8 | |
| 30,000 | 92.5 ± 6.1 | 86.7 ± 7.4 | |
| Sweroside | 6.25 | 87.4 ± 2.9 | 87.2 ± 5.1 |
| 5000 | 91.5 ± 5.2 | 96.1 ± 4.3 | |
| 18,750 | 92.3 ± 6.1 | 87.9 ± 6.4 | |
| Cryptochlorogenic acid | 6.25 | 88.6 ± 7.4 | 92.4 ± 3.8 |
| 2000 | 86.3 ± 8.2 | 91.5 ± 5.7 | |
| 5000 | 92.8 ± 5.8 | 85.9 ± 6.3 | |
| Luteoloside | 6.25 | 89.6 ± 5.2 | 87.3 ± 7.2 |
| 100 | 90.2 ± 6.5 | 96.4 ± 5.7 | |
| 1000 | 88.9 ± 7.1 | 95.5 ± 7.3 | |
| Isochlorogenic acid B | 500 | 86.7 ± 3.6 | 85.2 ± 6.1 |
| 5000 | 91.3 ± 8.4 | 93.5 ± 7.3 | |
| 18,750 | 92.1 ± 5.8 | 87.1 ± 4.5 | |
| Swertiamarin | 400 | 88.9 ± 6.7 | 92.6 ± 5.3 |
| 4000 | 87.6 ± 5.2 | 89.8 ± 5.1 | |
| 15,000 | 89.7 ± 5.4 | 87.3 ± 6.3 | |
| Luteolin | 6.25 | 92.5 ± 6.1 | 94.2 ± 7.2 |
| 200 | 88.3 ± 4.9 | 85.7 ± 5.4 | |
| 3000 | 89.5 ± 5.4 | 91.3 ± 6.8 | |
| Isoquercitrin | 50 | 88.2 ± 6.5 | 93.8 ± 7.2 |
| 200 | 87.3 ± 6.4 | 96.2 ± 3.7 | |
| 3000 | 92.3 ± 5.8 | 95.3 ± 4.8 | |
| Isochlorogenic acid C | 200 | 90.6 ± 7.3 | 87.5 ± 6.1 |
| 4000 | 91.8 ± 4.9 | 92.2 ± 5.2 | |
| 7500 | 92.2 ± 7.2 | 87.5 ± 3.9 | |
| Secoxyloganin | 10 | 91.6 ± 8.4 | 96.1 ± 4.7 |
| 400 | 92.8 ± 9.2 | 85.5 ± 6.4 | |
| 30,000 | 87.4 ± 2.5 | 95.2 ± 3.8 | |
| Caffeic acid | 400 | 86.8 ± 5.3 | 87.3 ± 6.4 |
| 4000 | 87.6 ± 6.1 | 94.1 ± 5.3 | |
| 15,000 | 89.8 ± 7.4 | 92.2 ± 2.5 | |
| Chlorogenic acid | 3.75 | 88.1 ± 5.6 | 95.3 ± 5.6 |
| 300 | 87.6 ± 7.3 | 90.0 ± 4.2 | |
| 5625 | 90.4 ± 8.2 | 86.9 ± 7.8 | |
| Loganic acid | 100 | 93.8 ± 5.8 | 92.4 ± 5.4 |
| 2000 | 87.2 ± 5.3 | 86.0 ± 6.2 | |
| 7500 | 93.0 ± 8.9 | 93.0 ± 5.1 | |
| Isochlorogenic acid A | 400 | 91.6 ± 6.4 | 86.9 ± 8.3 |
| 5000 | 88.1 ± 5.6 | 92.3 ± 7.2 | |
| 15,000 | 87.5 ± 4.8 | 88.9 ± 5.2 | |
| Rutin | 5 | 89.3 ± 5.2 | 88.4 ± 6.1 |
| 200 | 93.1 ± 4.3 | 86.5 ± 6.2 | |
| 3000 | 92.7 ± 7.8 | 85.7 ± 8.1 |
| Components | AUC(0–t)/mg/L*h | AUC(0–∞)/mg/L*h | T1/2/h | Tmax/h | Cmax/mg/L | MRT(0–t)/h |
|---|---|---|---|---|---|---|
| Secologanic acid | 1.21 × 10⁴ ± 305 | 1.35 × 10⁴ ± 293 | 10.9 ± 2.46 | 2.00 ± 0.00 | 5.73 × 10³ ± 173 | 4.88 ± 0.0632 |
| Rutin | 31.3 ± 4.34 | 34.3 ± 3.33 | 2.03 ± 1.10 | 0.500 ± 0.00 | 30.0 ± 2.54 | 1.51 ± 0.0291 |
| Isochlorogenic acid A | 1.07 × 10³ ± 36.3 | 1.45 × 10³ ± 145 | 26.6 ± 4.52 | 2.00 ± 0.00 | 822 ± 53.9 | 4.64 ± 0.289 |
| Loganic acid | 84.9 ± 12.8 | 99.3 ± 18.4 | 2.33 ± 0.429 | 0.500 ± 0.00 | 87.6 ± 10.9 | 2.29 ± 0.337 |
| Chlorogenic acid | 5.19 × 10³ ± 290 | 5.90 × 10³ ± 458 | 26.1 ± 9.42 | 2.00 ± 0.00 | 5.60 × 10³ ± 299 | 2.95 ± 0.0749 |
| Caffeic acid | 2.92 × 10³ ± 100 | 3.28 × 10³ ± 112 | 7.92 ± 1.10 | 2.00 ± 0.00 | 779 ± 19.2 | 5.92 ± 0.239 |
| Secoxyloganin | 2.44 × 10 ± 707 | 2.77 × 10⁴ ± 1.50 × 10³ | 8.14 ± 1.28 | 2.00 ± 0.00 | 4.67 × 10³ ± 207 | 7.19 ± 0.139 |
| Isochlorogenic acid C | 926 ± 39.0 | 1.45 × 10³ ± 118 | 26.9 ± 3.16 | 2.00 ± 0.00 | 560 ± 20.7 | 6.39 ± 0.337 |
| Isoquercitrin | 26.5 ± 1.19 | 39.6 ± 8.47 | 2.95 ± 1.72 | 0.500 ± 0.00 | 26.5 ± 1.16 | 1.50 ± 0.0366 |
| Luteolin | 20.9 ± 5.37 | 21.3 ± 5.32 | 1.96 ± 0.746 | 2.00 ± 0.00 | 19.6 ± 6.11 | 2.12 ± 0.149 |
| Swertiamarin | 2.15 × 10⁴ ± 1.67 × 10³ | 2.29 × 10⁴ ± 2.56 × 10³ | 5.15 ± 1.52 | 1.00 ± 0.00 | 2.45 × 10³ ± 101 | 7.37 ± 0.540 |
| Isochlorogenic acid B | 1.10 × 10³ ± 22.4 | 1.74 × 10³ ± 97.5 | 24.4 ± 2.72 | 2.00 ± 0.00 | 415 ± 4.69 | 7.35 ± 0.170 |
| Luteoloside | 15.8 ± 0.991 | 15.9 ± 1.01 | 0.343 ± 0.0915 | 0.500 ± 0.00 | 16.5 ± 1.97 | 1.50 ± 0.0928 |
| Cryptochlorogenic acid | 1.26 × 10³ ± 149 | 1.32 × 10³ ± 140 | 13.5 ± 2.98 | 2.00 ± 0.00 | 1.41 × 10³ ± 204 | 2.79 ± 0.225 |
| Sweroside | 1.42 × 10⁴ ± 729 | 1.72 × 10⁴ ± 1.61 × 10³ | 10.1 ± 2.25 | 2.00 ± 0.00 | 4.63 × 10³ ± 243 | 7.17 ± 0.274 |
| Group | Lung Index (%) | Repair Rate (%) | IL-6 (pg/mL) | Improvement Rate (%) | IFN-γ (pg/mL) | Improvement Rate (%) |
|---|---|---|---|---|---|---|
| C | 0.78 ± 0.03 | 8.917 ± 1.79 | 20.01 ± 0.98 | |||
| M | 1.07 ± 0.07 ## | 20.19 ± 1.65 ## | 8.36 ± 0.85 ## | |||
| 0.25 h | 0.99 ± 0.04 * | 0.27 | 20.57 ± 1.53 | −3.37 | 10.92 ± 0.77 ** | 21.95 |
| 0.5 h | 0.92 ± 0.06 * | 0.51 | 12.85 ± 1.03 ** | 65.11 | 15.10 ± 0.83 ** | 57.63 |
| 0.75 h | 0.94 ± 0.07 * | 0.44 | 15.25 ± 0.78 ** | 43.82 | 14.76 ± 0.92 ** | 54.88 |
| 1 h | 0.94 ± 0.08 ** | 0.44 | 18.80 ± 1.45 | 12.33 | 14.47 ± 0.90 ** | 52.40 |
| 1.5 h | 0.95 ± 0.05 ** | 0.41 | 18.93 ± 1.51 | 11.17 | 13.44 ± 0.86 ** | 43.56 |
| 2 h | 0.95 ± 0.04 * | 0.41 | 15.85 ± 1.50 ** | 38.49 | 12.38 ± 0.77 ** | 34.56 |
| 3 h | 0.92 ± 0.08 * | 0.51 | 15.93 ± 1.08 ** | 37.78 | 12.07 ± 0.93 ** | 31.47 |
| 4 h | 0.85 ± 0.02 ** | 0.75 | 14.68 ± 0.54 ** | 48.87 | 11.70 ± 0.95 ** | 28.81 |
| 6 h | 0.88 ± 0.07 ** | 0.65 | 14.57 ± 0.88 ** | 49.85 | 13.38 ± 0.87 ** | 42.96 |
| 8 h | 0.87 ± 0.03 ** | 0.69 | 13.95 ± 1.13 ** | 55.35 | 12.65 ± 0.99 ** | 36.79 |
| 12 h | 0.87 ± 0.05 ** | 0.69 | 12.90 ± 0.44 ** | 64.66 | 10.51 ± 1.09 ** | 18.69 |
| 24 h | 0.90 ± 0.07 ** | 0.58 | 11.34 ± 1.56 ** | 78.50 | 9.80 ± 0.87 * | 12.34 |
| Components | Correlation (S) | ||
|---|---|---|---|
| No. | R | p | |
| Secologanic acid | 1 | −0.0139 | 0.9739 |
| Sweroside | 2 | −0.2098 | 0.5137 |
| Cryptochlorogenic acid | 3 | −0.0699 | 0.8346 |
| Luteoloside | 4 | −0.2378 | 0.4573 |
| Isochlorogenic acid B | 5 | 0.2098 | 0.5137 |
| Swertiamarin | 6 | −0.2308 | 0.4708 |
| Luteolin | 7 | −0.1049 | 0.7493 |
| Isoquercitrin | 8 | −0.1818 | 0.5731 |
| Isochlorogenic acid C | 9 | 0.1678 | 0.6039 |
| Secoxyloganin | 10 | 0.0769 | 0.8171 |
| Caffeic acid | 11 | 0 | 0.9999 |
| Chlorogenic acid | 12 | 0.0559 | 0.8692 |
| Loganic acid | 13 | 0.2491 | 0.4308 |
| Isochlorogenic acid A | 14 | 0.1538 | 0.6353 |
| Rutin | 15 | −0.1088 | 0.7401 |
| Components | No. | Correlation (S) |
|---|---|---|
| R | ||
| Secologanic acid | 1 | 0.9975 |
| Sweroside | 2 | 0.9980 |
| Cryptochlorogenic acid | 3 | 0.9962 |
| Luteoloside | 4 | 0.9961 |
| Isochlorogenic acid B | 5 | 0.9978 |
| Swertiamarin | 6 | 0.9986 |
| Luteolin | 7 | 0.9966 |
| Isoquercitrin | 8 | 0.9972 |
| Isochlorogenic acid C | 9 | 0.9973 |
| Secoxyloganin | 10 | 0.9986 |
| Caffeic acid | 11 | 0.9981 |
| Chlorogenic acid | 12 | 0.9962 |
| Loganic acid | 13 | 0.9977 |
| Isochlorogenic acid A | 14 | 0.8414 |
| Rutin | 15 | 0.9867 |
Disclaimer/Publisher’s Note: The statements, opinions and data contained in all publications are solely those of the individual author(s) and contributor(s) and not of MDPI and/or the editor(s). MDPI and/or the editor(s) disclaim responsibility for any injury to people or property resulting from any ideas, methods, instructions or products referred to in the content. |
© 2023 by the authors. Licensee MDPI, Basel, Switzerland. This article is an open access article distributed under the terms and conditions of the Creative Commons Attribution (CC BY) license (https://creativecommons.org/licenses/by/4.0/).
Share and Cite
Liang, Y.; Liu, M.; Wang, Y.; Liu, L.; Gao, Y. Analyzing the Material Basis of Anti-RSV Efficacy of Lonicerae japonicae Flos Based on the PK-PD Model. Molecules 2023, 28, 6437. https://doi.org/10.3390/molecules28186437
Liang Y, Liu M, Wang Y, Liu L, Gao Y. Analyzing the Material Basis of Anti-RSV Efficacy of Lonicerae japonicae Flos Based on the PK-PD Model. Molecules. 2023; 28(18):6437. https://doi.org/10.3390/molecules28186437
Chicago/Turabian StyleLiang, Yuting, Mingjun Liu, Yanghai Wang, Lu Liu, and Yan Gao. 2023. "Analyzing the Material Basis of Anti-RSV Efficacy of Lonicerae japonicae Flos Based on the PK-PD Model" Molecules 28, no. 18: 6437. https://doi.org/10.3390/molecules28186437
APA StyleLiang, Y., Liu, M., Wang, Y., Liu, L., & Gao, Y. (2023). Analyzing the Material Basis of Anti-RSV Efficacy of Lonicerae japonicae Flos Based on the PK-PD Model. Molecules, 28(18), 6437. https://doi.org/10.3390/molecules28186437