Abstract
Industrial activity has raised significant concerns regarding the widespread pollution caused by metal ions, contaminating ecosystems and causing adverse effects on human health. Therefore, the development of sensors for selective and sensitive detection of these analytes is extremely important. In this regard, an azo dye, Dabcyl 2, was synthesised and investigated for sensing metal ions with environmental and industrial relevance. The cation binding character of 2 was evaluated by colour changes as seen by the naked eye, UV-Vis and 1H NMR titrations in aqueous mixtures of SDS (0.02 M, pH 6) solution with acetonitrile (99:1, v/v). Out of the several cations tested, chemosensor 2 had a selective response for Pd2+, Sn2+ and Fe3+, showing a remarkable colour change visible to the naked eye and large bathochromic shifts in the UV-Vis spectrum of 2. This compound was very sensitive for Pd2+, Sn2+ and Fe3+, with a detection limit as low as 5.4 × 10⁻⁸ M, 1.3 × 10⁻⁷ M and 5.2 × 10⁻⁸ M, respectively. Moreover, comparative studies revealed that chemosensor 2 had high selectivity towards Pd2+ even in the presence of other metal ions in SDS aqueous mixtures.
1. Introduction
The extensive use of metal ions in many industries has led to their accumulation in the environment, thus emerging as a considerable source of pollution and a significant threat to human health and other living organisms. Palladium, for instance, is widely applied in various materials, including electric and electronic equipment, fuel cells, dental appliances, jewellery and catalysts [1]. The highest demand for palladium has been in the automotive sector, due to its use in vehicle exhaust catalysts (VECs) to convert noxious gases emitted from automobile exhaust into less harmful substances. However, the extensive use of this metal in VECs has resulted in the release of palladium particles into the environment. Consequently, the dispersion of these particles through road dust has increased the palladium concentration in various environmental matrices, including soil, water sources, air and plants [2,3,4,5].
On the other hand, palladium-catalysed reactions are indispensable in the pharmaceutical industry, particularly in the preparation of complex drugs. Residual palladium may be found in final products, presenting a potential health hazard [6]. It has been reported that palladium is capable of binding to thiol-containing amino acids, proteins, DNA and other macromolecules and thereby may seriously disturb numerous cellular processes [1,2]. Very recent reports on new sensors for palladium confirm the interest in its detection [7,8,9].
Tin is also widely employed in a variety of industries. Sn(II) as a fluoride, chloride, or citrate complex is commonly found in different products, such as toothpaste, mouthwash, food and beverage cans, food additives and biocides. Additionality, SnCl2 is an extremely useful catalyst and reducing agent in the preparation of indole and coumarin derivatives. Although tin is an essential trace element for human beings, involved in human growth factors and cancer prevention, an excessive accumulation of Sn ions can result in adverse effects on the respiratory, digestive and nervous systems [10,11,12].
Among the transition metal ions, iron is the most abundant essential trace element in the human body, playing crucial roles in various cellular processes, including metabolism, electron transport, and DNA synthesis. Its deficiency or overload has a toxic effect on human health and is related to various disorders, including anaemia, hemochromatosis, and neurodegenerative diseases such as Alzheimer’s and Parkinson’s [13,14,15].
Despite the importance of the above-mentioned cations in biological processes and industrial fields, their wide use and improper disposal have resulted in various detrimental effects on ecosystems and human well-being. Hence, the development of effective and accurate methods for metal ion detection is of utmost importance.
Nowadays, colorimetric sensing methods are extremely attractive for biological and environmental applications due to their low cost, simplicity, high sensitivity and selectivity, as well as real-time response, without requiring advanced equipment. Colorimetric chemosensors allow qualitative detection of the target analyte by naked-eye-perceivable colour changes, while quantification can be performed using spectrophotometric analysis [16,17]. Their use provides a versatile and practical approach for diverse areas, including environmental monitoring, biomedical diagnostics, and food safety testing [18,19,20].
Among the colorimetric chemosensors, azo dyes play a crucial role due to their unique optical and structural properties. Their simple and cost-effective preparation methods, along with their ability to undergo noticeable colour changes, make them accessible and valuable probes for analyte sensing [21,22]. Additionally, the structural versatility of azo dyes allows the design and synthesis of chemosensors with tailored properties for specific analytes, enhancing their performance and applicability in various fields [17].
Dabcyl, a well-known azo dye (4-[[4′-(N,N-dimethylamino)phenyl]diazenyl]benzoic acid), has been employed in various biomolecular applications as a dark quencher in FRET-labelled probes [23,24,25]. This para-substituted azobenzene derivative exhibits a push–pull structure, which makes it highly promising for colorimetric sensing. So far, we have used Dabcyl in the synthesis of FRET-based probes to monitor protease activity [26], but herein we report the evaluation of Dabcyl 2 as a colorimetric chemosensor for industrially and environmentally important metal ions in aqueous medium. The interaction of this compound with various cations was studied by naked-eye-visible colour changes, UV-Vis absorption and 1H NMR spectroscopy in aqueous mixtures.
2. Results and Discussion
2.1. Synthesis
Dye 2 was prepared by an azo coupling reaction between the diazonium salt of 4-aminobenzoic acid 1 and N,N-dimethylaniline, as previously published by us (Scheme 1) [27]. This compound was obtained by precipitation as a dark red solid in high yield (92%), without further purification. The structure of Dabcyl 2 was confirmed by 1H and 13C NMR spectroscopy (Figures S1 and S2), which was in agreement with the previously reported assignment [27].

Scheme 1.
Synthetic route to Dabcyl 2.
2.2. Preliminary Chemosensing Tests
The need for detection and control of metal ions in environmental and industrial samples has increased in recent years; thus, the development of water-soluble probes is highly desired. Although Dabcyl 2 was poorly soluble in pure water, it was completely solubilised in the presence of the anionic surfactant sodium dodecyl sulphate (SDS). According to the literature, in aqueous media containing SDS, optical chemosensors and target ions can be organised inside the inner hydrophobic core of the SDS micelles, thereby ensuring chemosensor solubilisation as well as improving the sensing properties [28,29]. Therefore, the chromogenic behaviour of Dabcyl 2 was evaluated in aqueous mixtures of SDS with acetonitrile, namely in SDS (0.02 M, pH 6)–acetonitrile (99:1, v/v) solution.
Firstly, the sensing ability of 2 towards various metal ions was qualitatively investigated by naked-eye-perceivable colour changes, through the addition of 10 equivalents of each cation to the solution of 2. Among the 21 tested metal ions, chemosensor 2 responded selectively to Pd2+, Sn2+ and Fe3+, with a marked colour change from yellow to purple in the case of Pd2+ and from yellow to magenta after interaction with Sn2+ and Fe3+ (Figure 1). No obvious colorimetric response could be observed in the presence of other cations. Interestingly, the organotin cation (tributyltin, TBT) did not induce a colour change.

Figure 1.
Colorimetric responses of 2 in SDS (0.02 M, pH 6)–acetonitrile 99:1 (v/v) solution (2 × 10⁻⁵ M) before and after the addition of 10 equiv. of various ions.
To further confirm the selectivity of 2, UV-Vis absorption spectra were obtained before and after the addition of 10 equivalents of the selected cations (Figure 2). It was found that the ion-free solution exhibited a weak band at 278 nm (π-π*, εmax = 6900 M−1 cm−1) and an intense absorption band at 462 nm (n-π*, εmax = 19,000 M−1 cm−1). The latter is responsible for the yellow colour solution of Dabcyl 2 and could be ascribed to the intramolecular charge transfer (ICT) transition resulting from the push–pull effect between the electron-donating dimethylamino group and the carboxylic acid electron acceptor group. The absorption spectrum of 2 was altered upon interaction with Pd2+, Sn2+ and Fe3+, while other metal ions did not induce relevant changes. Notably, the addition of such ions resulted in large bathochromic shifts in the ICT band of 2, from 462 nm to 555 nm (∆λ = 93 nm) in the case of Pd2+, and from 462 nm to 515 nm (∆λ = 53 nm) for Sn2+ and Fe3+. According to the large bathochromic shifts and concomitant naked-eye-visible colour changes, dye 2 could find application as a colorimetric chemosensor for Pd2+, Sn2+ and Fe3+ in aqueous mixtures.
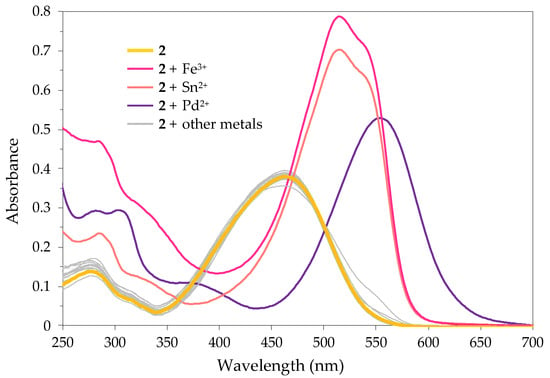
Figure 2.
UV-Vis spectra of 2 in SDS (0.02 M, pH 6)–acetonitrile 99:1 (v/v) solution (2 × 10⁻⁵ M) before and after the addition of 10 equiv. of Ag+, K+, Li+, Na+, Cu+, TBT+, Hg2+, Ca2+, Co2+, Pb2+, Mn2+, Fe2+, Zn2+, Ni2+, Cd2+, Cu2+, Pd2+, Cs2+, Sn2+, Fe3+ and Al3+.
2.3. The Detection of Pd2+ in SDS Aqueous Solution
2.3.1. UV-Vis Titrations
Given the preliminary sensing results, the colorimetric response of chemosensor 2 in the presence of Pd2+ was evaluated in more detail by UV-Vis titrations in SDS (0.02 M, pH 6)–acetonitrile 99:1 (v/v) solution. Upon incremental addition of Pd2+, the absorption band at 462 nm decreased, while a new band appeared at 555 nm (Figure 3a, the colours of the curves relate to the colours of the solutions). The sensitivity of 2 towards Pd2+ was evident, since the addition of only five equivalents of cation was sufficient to achieve the maximal optical change (Figure 3b). The molar extinction coefficients were calculated at the wavelengths of maximum absorption for Dabcyl 2 (462 nm) and the complex Dabcyl–Pd (555 nm) and found to be ε462 = 19,300 M−1 cm−1 and ε555 = 1150 M−1 cm−1 (for 2) and ε462 = 3700 M−1 cm−1 and ε555 = 26,450 M−1 cm−1 (for the complex).
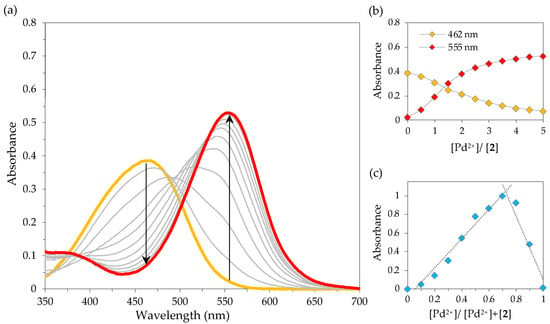
Figure 3.
Absorption spectral changes of 2 with Pd2+ in SDS (0.02 M, pH 6)–acetonitrile 99:1 (v/v) solution (2 × 10⁻⁵ M): (a) UV-Vis titration of 2 upon gradual addition of Pd2+; (b) absorbance at 462 and 555 nm as a function of added Pd2+ equiv.; (c) Job’s plot for the complexation of 2 with Pd2+ at 555 nm.
In order to investigate the stoichiometry of complexation between chemosensor 2 and Pd2+, a Job’s plot analysis was performed in SDS aqueous solution. As can be seen in Figure 3c, a maximum absorbance was identified when the mole fraction of Pd2+ was ca. 0.7, indicating the formation of a complex with a ligand to metal 1:2 stoichiometry.
Based on the UV-Vis data, the detection limit (DL) of 2 for Pd2+ was determined using the equation DL = 3σ/S, where σ is the standard deviation of a blank solution and S is the slope between absorbance and Pd2+ concentration [30]. The DL for Pd2+ was found to be 5.4 × 10⁻⁸ M, which is lower than the WHO limit for palladium content in drugs (4.7 × 10⁻⁵ M (5 ppm) to 9.4 × 10⁻⁵ M (10 ppm)) [31]. The obtained DL is highly promising, as it demonstrates a close similarity to chemosensors reported in the literature for Pd2+ (Table 1). All the above results suggest that dye 2 could detect Pd2+ both qualitatively (naked eye) and quantitatively (UV-Vis spectroscopy) with high sensitivity in solutions containing large amounts of water.

Table 1.
Comparison of 2 with reported chemosensors for Pd2+ detection.
2.3.2. 1H NMR Studies
The binding mode between chemosensor 2 and Pd2+ was further investigated by recording the 1H NMR spectra before and after the sequential addition of palladium. Due to the low solubility of Dabcyl 2 in pure D2O, this study was performed in DMSO-d6 solution. In the absence of Pd2+, the 1H NMR spectrum of Dabcyl showed a singlet signal at 3.07 ppm, corresponding to the protons of the dimethylamino group, and the phenyl protons at 6.84, 7.81 and 8.05 ppm (Figure 4a). No noticeable shifts were found for these protons upon incremental addition of Pd2+, but new signals appeared at 6.69, 7.33 and 7.67 ppm, along with two new singlets at 3.11 and 3.20 ppm (Figure 4b, Figures S3 and S4).
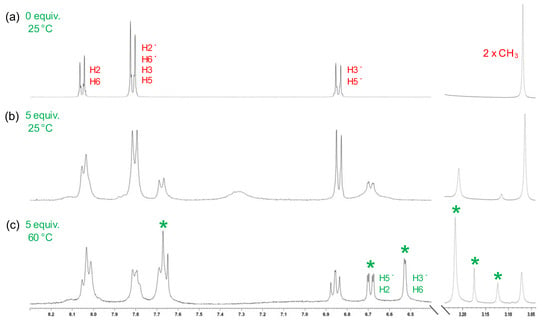
Figure 4.
Partial 1H NMR spectra of 2 with the addition of Pd2+ (5 equiv.) in DMSO-d6 at 25 and 60 °C (* indicates the new signals of the formed complex).
This behaviour is close to that obtained by Babić et al. in the preparation of dicyclopalladated azobenzene derivatives [37]. In the cyclopalladation of azobenzene, the ligand binds to palladium through a coordinative bond from the lone electron pair of a nitrogen atom in the azo group. Then, a Pd-C bond is formed between the metal and an ortho carbon of the phenyl ring, resulting in a five-membered palladacycle [38,39]. Therefore, the appearance of the new aromatic signals in the 1H NMR spectrum of 2 could be ascribed to a loss of the ortho proton from each phenyl ring of 2 upon dicyclopalladation. As a result, the signals corresponding to the ortho and meta protons are shifted compared to the ion-free signal. These shifts are clearly visible when the 1H NMR spectrum is recorded at higher temperatures, where the meta protons H3′ and H6 appear at 6.53 ppm, and the H5′ and H2 protons at 6.69 ppm (Figure 4c). In addition, there is an increase in the proportion of a new complex with the increase in temperature, exhibiting a 1:1 ratio in the 1H NMR spectrum at 60 °C.
In the case of the palladium tetrafluoroborate salt, fluoride abstraction from the tetrafluoroborate anion can also occur during cyclopalladation [40], suggesting the formation of a new complex, such as 3 (Figure 5), in DMSO-d6 solution.
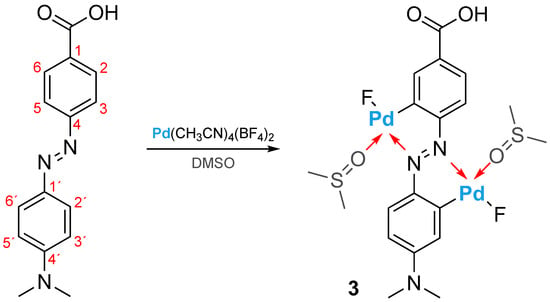
Figure 5.
Suggested structure for complex 3 in DMSO solution.
Furthermore, the shift observed in the methyl protons also indicates the coordination of palladium with the dimethylamino nitrogen. The protonation of this nitrogen atom decreases its donor strength, causing a downfield shift of the methyl signal. This result, along with the undefined isosbestic point observed in the UV-Vis titrations, suggests the presence of two protonation equilibria for chemosensor 2, due to the coordination of palladium with the aniline nitrogen atom and the nitrogen atoms of the azo group.
On the other hand, it has been reported that azobenzene-based palladium (II) complexes can also form more complex structures in aqueous media [41,42]. For example, Luty-Błocho et al. demonstrated that methyl orange initially formed a palladacycle, which in time transformed into a H-shaped chloro-bridged dimer with a maximum in the UV-Vis spectrum at 559 nm and broad band between 600 and 800 nm (λmax = 708 nm) in Britton-Robinson buffer solutions (pH = 4.1) [41].
To better understand the complexation of 2 with Pd2+ in aqueous media, a similar study was conducted. Solutions of 2 (2 × 10⁻⁵ M) with different concentrations of Pd2+ (0–5 equivalents) were prepared, and the colour of the solutions, as well as the absorption spectra, were monitored over time. With time, there was a remarkable colour change in the solutions. Consequently, a new absorption band appeared at wavelengths 550–800 nm (λmax = 674 nm) (Figure 6, the colours of the curves relate to the colours of the solutions). These results are close to those described in the literature [40,41,42]; thus, a difluoride-bridged palladium complex, 4, was proposed for the interaction of 2 with Pd2+ in aqueous media (Figure 7). Also, the changes in absorbance of a solution of Dabcyl 2 with five equivalents of Pd2+ were monitored at different wavelengths (462, 555 and 674 nm) over a period of 7 days, and there seemed to be a stabilization 48 h after the addition of palladium (Figure S4).
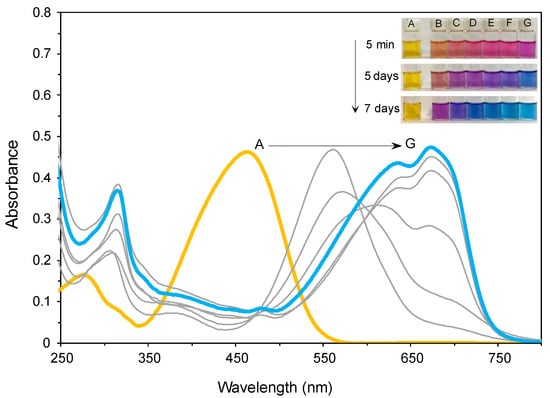
Figure 6.
Absorption spectra of 2 in SDS (0.02 M, pH 6)–acetonitrile 99:1 (v/v) solution (2 × 10⁻⁵ M) after 7 days at different concentrations of Pd2+ (A: 0 equiv.; B: 0.5 equiv.; C: 1 equiv.; D: 2 equiv.; E: 3 equiv.; F: 4 equiv.; G: 5 equiv.).
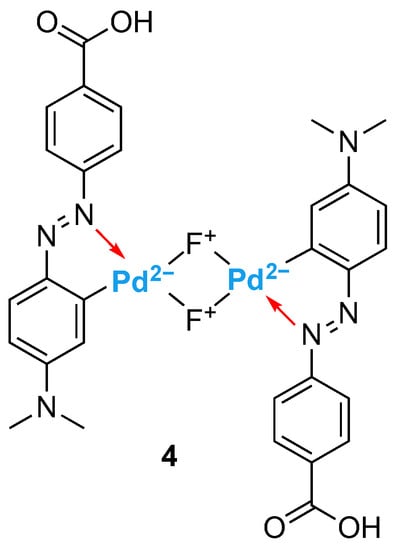
Figure 7.
Suggested structure for complex 4.
2.3.3. The Influence of pH
In order to investigate the effect of pH on the sensing properties of 2 for Pd2+, colorimetric studies were performed in SDS aqueous solutions (2 × 10⁻⁵ M) within the pH range of 2–10. In the absence of palladium, the Dabcyl solution showed a pink colour at pH 2 and 4 and a yellow colour at pH 6–10, confirming its pH-sensitive nature (Figure 8a). Remarkably, upon the addition of Pd2+ to these solutions, significant bathochromic shifts occurred in the ICT band of 2, leading to noticeable colour changes visible to the naked eye (Figure 8b). As expected, this behaviour was enhanced over time, and although 2 was slightly more sensitive to Pd2+ at pH 4, there was no response to Sn2+ and Fe3+ at this pH level (see Section 2.4.3). These studies revealed that chemosensor 2 is very sensitive to palladium, even at different pH levels.
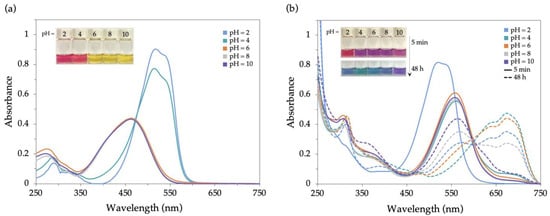
Figure 8.
UV-Vis spectra and colour changes of 2 in SDS (0.02 M)–acetonitrile 99:1 (v/v) solution (2 × 10⁻⁵ M) in pH levels from 2 to 10 (a) before and (b) after 5 min (full line) and 48 h (broken line) upon the addition of 10 equiv. of Pd2+.
2.3.4. Competition Assays
Competition studies were conducted to evaluate the discrimination of chemosensor 2 to Pd2+ in the presence of other metal ions. As can be seen in Figure 9, the ratio between absorbance at 555 nm (λmax for Pd2+-2 complex) and at 462 nm (λmax for free 2) was plotted, and the spectral responses of 2 containing Pd2+ with the selected cations were similar to those of the sensor with only Pd2+, indicating that the presence of other ions does not interfere significantly with the complexation of 2 with Pd2+.
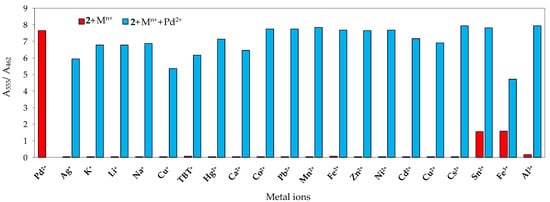
Figure 9.
Absorbance ratio (A555/A462) of 2 (2 × 10⁻⁵ M) before and after the addition of 5 equiv. of Pd2+ in the presence of 10 equiv. background cations in SDS (0.02 M, pH 6)–acetonitrile 99:1 (v/v) solution.
2.4. The Detection of Sn2+ and Fe3+ in SDS Aqueous Solution
2.4.1. UV-Vis Titrations
The response of chemosensor 2 towards Sn2+ and Fe3+ was also evaluated by UV-Vis titrations in SDS (0.02 M, pH 7.5)–acetonitrile 99:1 (v/v) solution. Notably, the gradual addition of Sn2+ and Fe3+ ions induced a similar response in the UV-Vis spectrum of chemosensor 2: the absorption band at 462 nm slightly decreased, while a new peak at 515 nm increased significantly, with an isosbestic point at 472 nm (Figure 10a and Figure 11a, the colours of the curves relate to the colours of the solutions).
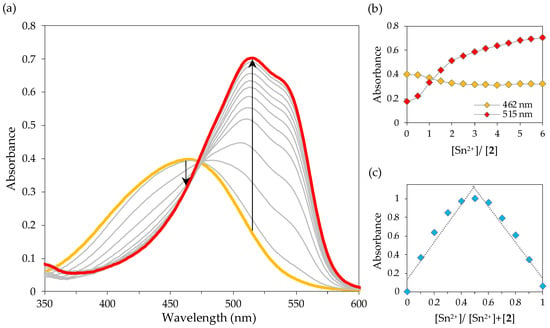
Figure 10.
Absorption spectral changes of 2 with Sn2+ in SDS (0.02 M, pH 6)–acetonitrile 99:1 (v/v) solution (2 × 10⁻⁵ M): (a) UV-Vis titration of 2 upon gradual addition of Sn2+; (b) absorbance at 462 and 515 nm as a function of added Sn2+ equiv.; (c) Job’s plot for the complexation of 2 with Sn2+ at 515 nm.
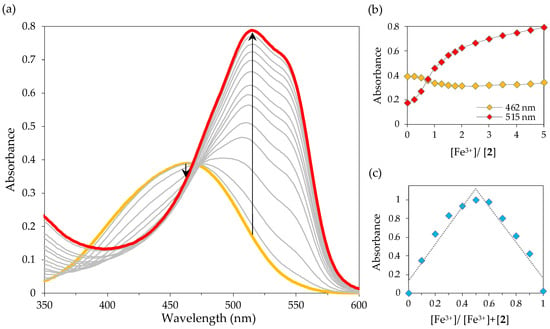
Figure 11.
Absorption spectral changes of 2 with Fe3+ in SDS (0.02 M, pH 6)–acetonitrile 99:1 (v/v) solution (2 × 10⁻⁵ M): (a) UV-Vis titration of 2 upon gradual addition of Fe3+; (b) absorbance at 462 and 515 nm as a function of added Fe3+ equiv.; (c) Job’s plot for the complexation of 2 with Fe3+ at 515 nm.
The addition of five equivalents of Fe3+ resulted in a higher increase of the absorbance at 515 nm compared to that observed upon interaction with six equivalents of Sn2+, indicating that chemosensor 2 is more sensitive to iron (Figure 10b and Figure 11b). In fact, the detection limit for Sn2+ was found to be 1.3 × 10⁻⁷ M, while the DL for Fe3+ was estimated to be 5.2 × 10⁻⁸ M. These values are below the WHO limits for tin and iron in drinking water (8 × 10⁻⁴ M to 8 × 10⁻³ M and 5.4 × 10⁻⁶ M, respectively) [11,43] and the maximum acceptable level of tin (2.1 × 10⁻⁶ M) in canned food [44]. In addition, the detection limits obtained for Sn2+ and Fe3+ are quite comparable to the sensors described in the literature for these metal ions (Table 2).

Table 2.
Comparison of 2 with reported chemosensors for Sn2+ and Fe3+ detection.
2.4.2. 1H NMR Studies
To better understand the complexation of 2 with Sn2+, 1H NMR titrations were conducted in a DMSO-d6 solution. As mentioned above, in the 1H NMR spectrum of Dabcyl 2, the signal of the methyl groups was observed at 3.07 ppm, and the aromatic signals at 6.84, 7.81 and 8.05 ppm. Upon incremental addition of Sn2+, new peaks appeared at 2.91, 6.52, 7.02 and 7.59 ppm (Figure 12). These results suggest that each nitrogen atom of the azo moiety could be coordinating with the tin atom through a mechanism similar to that described for the complexation of Dabcyl with Pd2+. The appearance of new signals in the NMR titration with Sn2+ at lower chemical shifts than those observed in the NMR titration with Pd2+ (6.60, 7.33 and 7.67 ppm) strongly indicate that tin complexation only takes place at the azo moiety and does not affect the aniline nitrogen. Due to the paramagnetic nature of Fe3+, 1H NMR titrations were not performed for this metal ion.
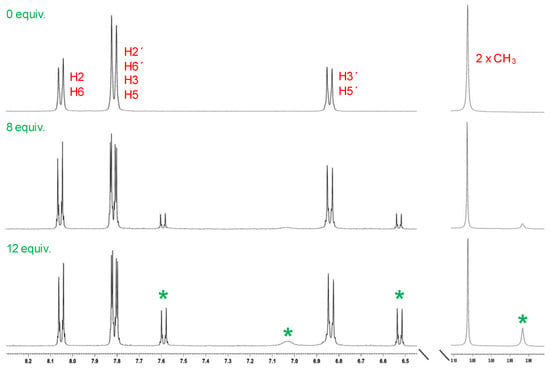
Figure 12.
Partial 1H NMR spectra of 2 with Sn2+ in DMSO-d6 at 25 °C (* indicates the new signals).
2.4.3. The Influence of pH
The effect of pH on the sensing ability of 2 towards Sn2+ and Fe3+ was also investigated in SDS aqueous solutions in the pH range of 2–10. Upon the addition of these cations, the absorbance of chemosensor 2 remained almost unchanged at pH < 4 and pH = 10 (Figures S5 and S6). However, we observed a slightly bathochromic shift in the UV-Vis spectrum of 2 at pH 8. As expected, the absorbance at 515 nm significantly increased at pH 6, accompanied by a remarkable colour change from yellow to magenta. These results confirmed that chemosensor 2 exhibits sensitivity for Sn2+ and Fe3+ at pH 6. Overall, when comparing to the results for Pd2+ (see Figure 8), the most naked-eye-perceptible change occurs for Pd2+, from yellow to greenish-blue.
2.4.4. Competition Assays
To further confirm the interaction of chemosensor 2 with Sn2+ and Fe3+, competition experiments were performed by recording the absorption spectra of chemosensor 2 in the presence of five equivalents of Sn2+ and Fe3+ ions with 10 equivalents of the other metal ions. The ratio between absorbance at 515 nm (λmax for Sn2+-2 complex and Fe3+-2 complex) and at 462 nm (λmax for free 2) was plotted, and, not surprisingly, a selective colorimetric behaviour was seen for Pd2+ (Figure 13 and Figure 14). The other ions exhibited a similar absorbance ratio A515/A462 to those of 2 in the presence of Sn2+ and Fe3+. Therefore, it was confirmed that chemosensor 2 had high selectivity towards Pd2+ over other metal ions in SDS aqueous mixtures.
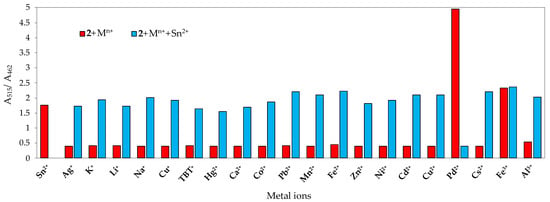
Figure 13.
Absorbance ratio (A515/A462) of 2 (2 × 10⁻⁵ M) before and after the addition of 5 equiv. of Sn2+ in the presence of 10 equiv. background metal ions in SDS (0.02 M, pH 6)–acetonitrile 99:1 (v/v) solution.
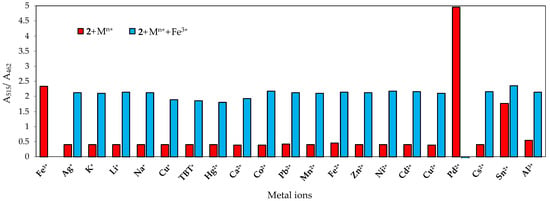
Figure 14.
Absorbance ratio (A515/A462) of 2 (2 × 10⁻⁵ M) before and after the addition of 5 equiv. of Fe3+ in the presence of 10 equiv. background metal ions in SDS (0.02 M, pH 6)–acetonitrile 99:1 (v/v) solution.
3. Materials and Methods
3.1. Materials and Instruments
All the chemicals and solvents were purchased from Acros Organics (Geel, Belgium) and Sigma-Aldrich (St. Louis, MO, USA) and were used as received. The synthesis and structural characterization of Dabcyl acid 2 has been reported by us elsewhere [27]. UV-Vis absorption spectra were collected using a Shimadzu UV/2501PC spectrophotometer (Shimadzu Europa GmbH, Duisburg, Germany) in standard quartz cuvettes with a 1 cm optical path. NMR spectra were recorded on a Bruker Avance III 400 at an operating frequency of 400 MHz for 1H and 100.6 MHz for 13C, using the solvent peak as the internal reference at 25 °C; the chemical shift values (δ relative to TMS) are given in ppm.
3.2. Stock Solutions
Stock solutions (1 × 10⁻² M) of the hydrated tetrafluorborate salts (Li+, Cu+, Co2+ and Pd2+), chloride salts (TBT+ and Sn2+) and hydrated perchlorate salts (Ag+, K+, Na+, Hg2+, Ca2+, Pb2+, Mn2+, Fe2+, Zn2+, Ni2+, Cd2+, Cu2+, Cs2+, Fe3+ and Al3+) were prepared in UV-grade acetonitrile. A solution of compound 2 (2 × 10⁻⁵ M) was prepared in SDS (0.02 M, pH 6)–acetonitrile 99:1 (v/v).
3.3. Preliminary Chemosensing Tests and UV-Vis Titrations
Preliminary chemosensing studies were performed by the addition of 10 equivalents of each cation to the solution of compound 2, and the colorimetric responses were evaluated by the naked eye and by recording the UV-Vis spectra of these solutions. UV-Vis titrations were carried out by the gradual addition of each cation to the solution of 2 (3 mL), and the absorption spectra were recorded until reaching the maximum optical change. Scans were collected after 3 min of each cation addition.
3.4. Determination of the Detection Limit (DL)
The absorption spectrum of 2 was measured five times to obtain the standard division of the absorbance. Then, the detection limit (DL) was calculated using the equation DL = 3σ/S, where σ is the standard division of the blank solution measurement mentioned above and S is the slope of the linear plot of the concentration-dependent absorbance response [30].
3.5. Binding Studies
Job’s plots were determined by recording the absorbance of various mole fractions of 2 and the corresponding cation at 515 nm (for Sn2+ and Fe3+) and 555 nm (for Pd2+). The signal was plotted as a function of the molar ratio [Mn+]/[Mn+] + [2]. The total concentration of 2 and the cations under study was 2 × 10—5 M. NMR titrations were carried out by gradual addition of each cation (6 × 10⁻¹ M) to the solution of 2 (1 × 10⁻² M) in DMSO-d6 at 25, 40 and 60 °C.
4. Conclusions
In summary, we report that an azo dye-based chemosensor 2 for metal ions showed various advantageous properties as a colorimetric chemosensor, such as a high molar absorption coefficient (εmax = 19,000 M—1 cm—1) at 462 nm in SDS aqueous mixtures at pH 6; a remarkable colour change visible to the naked eye, from yellow to purple (after 5 min) or greenish-blue (after 48 h) for Pd2+ and from yellow to magenta in the case of Sn2+ and Fe3+); high sensitivity for Pd2+, Sn2+ and Fe3+, with low detection limits (5.4 × 10⁻⁸ M, 1.3 × 10⁻⁷ M and 5.2 × 10⁻⁸ M, respectively); and the ability to monitor such ions even in the presence of other cations. Therefore, compound 2 could be used as an efficient colorimetric chemosensor for the detection of Pd2+, Sn2+ and Fe3+ in industrial and environmental samples containing other metal ions in aqueous media.
Supplementary Materials
The following supporting information can be downloaded at: https://www.mdpi.com/article/10.3390/molecules28166111/s1, Figure S1: 1H NMR spectrum of compound 2 (DMSO-d6, 400 MHz, 25 °C). Figure S2: 13C NMR spectrum of compound 2 (DMSO-d6, 100.6 MHz, 25 °C). Figure S3: Partial 1H NMR spectra of compound 2 with increasing number of equivalents of Pd2+ (DMSO-d6, 400 MHz, 25 °C). Figure S4: Changes in absorbance at diferent wavelengths (462, 555 and 674 nm) over time for the interaction of Dabcyl 2 (2 × 10⁻⁵ M) with Pd2+ (5 equiv.) in SDS (0.02 M, pH 6)-acetonitrile 99:1 (v/v). Figure S5: Spectral (a) and colorimetric (b) changes of 2 with Sn2+ (10 equiv.) in SDS aqueous solution (2 × 10⁻⁵ M) with a variation of pH from 2 to 10. Figure S6: Spectral (a) and colorimetric (b) changes of 2 with Fe3+ (10 equiv.) in SDS aqueous solution (2 × 10⁻⁵ M) with a variation of pH from 2 to 10.
Author Contributions
Conceptualization, C.D.F.M. and S.P.G.C.; methodology, C.D.F.M. and S.P.G.C.; validation, S.P.G.C. and M.M.M.R.; formal analysis, C.D.F.M., M.M.M.R. and S.P.G.C.; investigation, C.D.F.M.; resources, S.P.G.C. and M.M.M.R.; writing—original draft preparation, C.D.F.M.; writing—review and editing, C.D.F.M., M.M.M.R. and S.P.G.C.; supervision, S.P.G.C. and M.M.M.R.; project administration, S.P.G.C. and M.M.M.R.; funding acquisition, S.P.G.C. and M.M.M.R. All authors have read and agreed to the published version of the manuscript.
Funding
This research was funded by the Foundation for Science and Technology (FCT) for financial support to CQ-UM (UID/QUI/00686/2020) and project PTDC/QUI-COL/28052/2017 and a PhD grant to C.D.F. Martins (SFRH/BD/05277/2020). The NMR spectrometer Bruker Avance III 400 is part of the National NMR Network and was purchased within the framework of the National Program for Scientific Re-equipment, contract REDE/1517/RMN/2005, with funds from POCI 2010 (FEDER) and FCT.
Institutional Review Board Statement
Not applicable.
Informed Consent Statement
Not applicable.
Data Availability Statement
Not applicable.
Conflicts of Interest
The authors declare no conflict of interest.
Sample Availability
Not applicable.
References
- Balamurugan, R.; Liu, J.-H.; Liu, B.-T. A review of recent developments in fluorescent sensors for the selective detection of palladium ions. Coord. Chem. Rev. 2018, 376, 196–224. [Google Scholar] [CrossRef]
- Kielhorn, J.; Melber, C.; Keller, D.; Mangelsdorf, I. Palladium—A review of exposure and effects to human health. Int. J. Hyg. Environ. Health 2002, 205, 417–432. [Google Scholar] [CrossRef] [PubMed]
- Wiseman, C.L.S.; Zereini, F. Airborne particulate matter, platinum group elements and human health: A review of recent evidence. Sci. Total Environ. 2009, 407, 2493–2500. [Google Scholar] [CrossRef] [PubMed]
- Prichard, H.M.; Fisher, P.C. Identification of platinum and palladium particles emitted from vehicles and dispersed into the surface environment. Environ. Sci. Technol. 2012, 46, 3149–3154. [Google Scholar] [CrossRef]
- Aarzoo; Nidhi; Samim, M. Palladium nanoparticles as emerging pollutants from motor vehicles: An in-depth review on distribution, uptake and toxicological effects in occupational and living environment. Sci. Total Environ. 2022, 823, 153787. [Google Scholar] [CrossRef]
- Magano, J.; Dunetz, J.R. Large-scale applications of transition metal-catalyzed couplings for the synthesis of pharmaceuticals. Chem. Rev. 2011, 111, 2177–2250. [Google Scholar] [CrossRef]
- Lai, Y.-L.; Zhang, H.-J.; Su, J.; Wang, X.-Z.; Luo, D.; Liu, J.-X.; Zhou, X.-P.; Li, D. Self-assembly of a quadrangular prismatic covalent cage templated by zinc ions: A selective fluorescent sensor for palladium ions. Chin. Chem. Lett. 2023, 34, 107686. [Google Scholar] [CrossRef]
- Tirri, B.; Turelli, M.; Boissonnat, G.; Ciofini, I.; Adamo, C. Protocols for the in-silico screening of the perceived color of industrial dyes: Anthraquinones and indigos as study cases. Dye. Pigment. 2022, 208, 110826. [Google Scholar] [CrossRef]
- Gao, Z.; Qiu, S.; Yan, M.; Lu, S.; Liu, H.; Lian, H.; Zhang, P.; Zhu, J.; Jin, M. A highly selective turn-on fluorescence probe with large Stokes shift for detection of palladium and its applications in environment water and living cells. Spectrochim. Acta A Mol. Biomol. Spectrosc. 2022, 267, 120500. [Google Scholar] [CrossRef]
- Adhikari, S.; Ghosh, A.; Guria, S.; Sahana, A. Through bond energy transfer based ratiometric probe for fluorescent imaging of Sn2+ ions in living cells. RSC Adv. 2016, 6, 39657–39662. [Google Scholar] [CrossRef]
- Ravichandiran, P.; Prabakaran, D.S.; Bella, A.P.; Boguszewska-Czubara, A.; Masłyk, M.; Dineshkumar, K.; Johnson, P.M.; Park, B.-H.; Han, M.-K.; Kim, H.G.; et al. Naphthoquinone-dopamine linked colorimetric and fluorescence chemosensor for selective detection of Sn2+ ion in aqueous medium and its bio-imaging applications. ACS Sustain. Chem. Eng. 2020, 8, 10947–10958. [Google Scholar] [CrossRef]
- Manna, S.K.; Mondal, S.; Jana, B.; Samanta, K. Recent advances in tin ion detection using fluorometric and colorimetric chemosensors. New J. Chem. 2022, 46, 7309–7328. [Google Scholar] [CrossRef]
- Carter, K.P.; Young, A.M.; Palmer, A.E. Fluorescent sensors for measuring metal ions in living systems. Chem. Rev. 2014, 114, 4564–4601. [Google Scholar] [CrossRef]
- Barnham, K.J.; Masters, C.L.; Bush, A.I. Neurodegenerative diseases and oxidative stress. Nat. Rev. Drug Discov. 2004, 3, 205–214. [Google Scholar] [CrossRef] [PubMed]
- Ward, R.J.; Zucca, F.A.; Duyn, J.H.; Crichton, R.R.; Zecca, L. The role of iron in brain ageing and neurodegenerative disorders. Lancet Neurol. 2014, 13, 1045–1060. [Google Scholar] [CrossRef] [PubMed]
- Kaur, B.; Kaur, N.; Kumar, S. Colorimetric metal ion sensors—A comprehensive review of the years 2011–2016. Coord. Chem. Rev. 2018, 358, 13–69. [Google Scholar] [CrossRef]
- Sareen, D.; Kaur, P.; Singh, K. Strategies in detection of metal ions using dyes. Coord. Chem. Rev. 2014, 265, 125–154. [Google Scholar] [CrossRef]
- Yin, P.; Niu, Q.; Liu, J.; Wei, T.; Hu, T.; Li, T.; Qin, X.; Chen, J. A new AIEE-active carbazole based colorimetric/fluorimetric chemosensor for ultra-rapid and nano-level determination of Hg2+ and Al3+ in food/environmental samples and living cells. Sens. Actuators B Chem. 2021, 331, 129418. [Google Scholar] [CrossRef]
- Anslyn, E.V. Supramolecular analytical chemistry. J. Org. Chem. 2007, 72, 687–699. [Google Scholar] [CrossRef]
- Memon, S.S.; Nafady, A.; Solangi, A.R.; Al-Enizi, A.M.; Sirajuddin; Shah, M.R.; Sherazi, S.T.H.; Memon, S.; Arain, M.; Abro, M.I.; et al. Sensitive and selective aggregation based colorimetric sensing of Fe3+ via interaction with acetyl salicylic acid derived gold nanoparticles. Sens. Actuators B Chem. 2018, 259, 1006–1012. [Google Scholar] [CrossRef]
- Ábalos, T.; Moragues, M.; Royo, S.; Jiménez, D.; Martínez-Máñez, R.; Soto, J.; Sancenón, F.; Gil, S.; Cano, J. Dyes that bear thiazolylazo groups as chromogenic chemosensors for metal cations. Eur. J. Inorg. Chem. 2012, 2012, 76–84. [Google Scholar] [CrossRef]
- Khan, S.; Chen, X.; Almahri, A.; Allehyani, E.S.; Alhumaydhi, F.A.; Ibrahim, M.M.; Ali, S. Recent developments in fluorescent and colorimetric chemosensors based on Schiff bases for metallic cations detection: A review. J. Environ. Chem. Eng. 2021, 9, 106381. [Google Scholar] [CrossRef]
- Kempf, O.; Kempf, K.; Schobert, R.; Bombarda, E. Hydrodabcyl: A superior hydrophilic alternative to the dark fluorescence quencher Dabcyl. Anal. Chem. 2017, 89, 11893–11897. [Google Scholar] [CrossRef]
- Wu, L.; Huang, C.; Emery, B.P.; Sedgwick, A.C.; Bull, S.D.; He, X.-P.; Tian, H.; Yoon, J.; Sessler, J.L.; James, T.D. Förster resonance energy transfer (FRET)-based small-molecule sensors and imaging agents. Chem. Soc. Rev. 2020, 49, 5110–5139. [Google Scholar] [CrossRef]
- Zheng, J.; Yang, R.; Shi, M.; Wu, C.; Fang, X.; Li, Y.; Li, J.; Tan, W. Rationally designed molecular beacons for bioanalytical and biomedical applications. Chem. Soc. Rev. 2015, 44, 3036–3055. [Google Scholar] [CrossRef]
- Martins, C.D.F.; Raposo, M.M.M.; Costa, S.P.G. A new fluorogenic substrate for granzyme B based on fluorescence resonance energy transfer. Chem. Proc. 2021, 3, 6. [Google Scholar]
- Martins, C.D.F.; Raposo, M.M.M.; Costa, S.P.G. Synthesis and evaluation of an azo dye for the chromogenic detection of metal cations. Chem. Proc. 2022, 12, 26. [Google Scholar]
- Batista, P.M.R.; Martins, C.D.F.; Raposo, M.M.M.; Costa, S.P.G. Novel crown ether amino acids as fluorescent reporters for metal ions. Molecules 2023, 28, 3326. [Google Scholar] [CrossRef]
- Liu, B.; Chen, W.; Liu, D.; Wang, T.; Pan, C.; Liu, D.; Wang, L.; Bai, R. Detection of trace levels of Pd2+ in pure water using a fluorescent probe assisted by surfactants. Sens. Actuators B Chem. 2016, 237, 899–904. [Google Scholar] [CrossRef]
- Hu, C.; Sun, W.; Cao, J.; Gao, P.; Wang, J.; Fan, J.; Song, F.; Sun, S.; Peng, X. A ratiometric near-infrared fluorescent probe for hydrazine and its in vivo applications. Org. Lett. 2013, 15, 4022–4025. [Google Scholar] [CrossRef]
- Garrett, C.E.; Prasad, K. The art of meeting palladium specifications in active pharmaceutical ingredients produced by Pd-catalyzed reactions. Adv. Synth. Catal. 2004, 346, 889–900. [Google Scholar] [CrossRef]
- Zhou, Y.; Zhang, J.; Zhou, H.; Zhang, Q.; Ma, T.; Niu, J. A highly sensitive and selective “off–on” chemosensor for the visual detection of Pd2+ in aqueous media. Sens. Actuators B Chem. 2012, 171–172, 508–514. [Google Scholar] [CrossRef]
- Kumar, A.; Virender; Mohan, B.; Solovev, A.A.; Saini, M.; Sharma, H.K. Development of 2-hydroxy-naphthaldehyde functionalized Schiff base chemosensor for spectroscopic and colorimetric detection of Cu2+ and Pd2+ ions. Microchem. J. 2022, 180, 107561. [Google Scholar] [CrossRef]
- Wang, M.; Liu, X.; Lu, H.; Wang, H.; Qin, Z. Highly selective and reversible chemosensor for Pd2+ detected by fluorescence, colorimetry, and test paper. ACS Appl. Mater. Interfaces 2015, 7, 1284–1289. [Google Scholar] [CrossRef] [PubMed]
- Mahapatra, A.K.; Manna, S.K.; Maiti, K.; Mondal, S.; Maji, R.; Mandal, D.; Mandal, S.; Uddin, M.R.; Goswami, S.; Quah, C.K.; et al. An azo dye–rhodamine-based fluorescent and colorimetric probe specific for the detection of Pd2+ in aqueous ethanolic solution: Synthesis, XRD characterization, computational studies and imaging in live cells. Analyst 2015, 140, 1229–1236. [Google Scholar] [CrossRef] [PubMed]
- Chen, X.; Wang, H.; Ma, X.; Wang, M.; Zhang, Y.; Gao, G.; Liu, J.; Hou, S. Colorimetric and fluorescent probe for real-time detection of palladium (II) ion in aqueous medium and live cell imaging. Dye. Pigment. 2018, 148, 286–291. [Google Scholar] [CrossRef]
- Babić, D.; Ćurić, M.; Molčanov, K.; Ilc, G.; Plavec, J. Synthesis and characterization of dicylopalladated complexes of azobenzene derivatives by experimental and computational methods. Inorg. Chem. 2008, 47, 10446–10454. [Google Scholar] [CrossRef]
- Dupont, J.; Consorti, C.S.; Spencer, J. The potential of palladacycles: More than just precatalysts. Chem. Rev. 2005, 105, 2527–2571. [Google Scholar] [CrossRef]
- Hirade, T.; Okui, Y.; Han, M. A design strategy for stable light-sensitive palladium complexes. J. Mater. Chem. C 2013, 1, 2672–2679. [Google Scholar] [CrossRef]
- Tomat, E.; Cuesta, L.; Lynch, V.M.; Sessler, J.L. Binuclear fluoro-bridged zinc and cadmium complexes of a Schiff base expanded porphyrin: Fluoride abstraction from the tetrafluoroborate anion. Inorg. Chem. 2007, 46, 6224–6226. [Google Scholar] [CrossRef]
- Luty-Błocho, M.; Podborska, A.; Musielak, B.; Hessel, V. The specialized twin-solution method for selective Pd(II) ions determination and methyl orange removal. J. Mol. Liq. 2021, 340, 116884. [Google Scholar] [CrossRef]
- Pach, A.; Podborska, A.; Csapo, E.; Luty-Błocho, M. Tropaeolin OO as a chemical sensor for a trace amount of Pd(II) ions determination. Molecules 2022, 27, 4511. [Google Scholar] [CrossRef] [PubMed]
- Berhanu, A.L.; Gaurav; Mohiuddin, I.; Malik, A.K.; Aulakh, J.S.; Kumar, V.; Kim, K.-H. A review of the applications of Schiff bases as optical chemical sensors. Trends Anal. Chem. 2019, 116, 74–91. [Google Scholar] [CrossRef]
- Blunden, S.; Wallace, T. Tin in canned food: A review and understanding of occurrence and effect. Food Chem. Toxicol. 2003, 41, 1651–1662. [Google Scholar] [CrossRef] [PubMed]
- Dongare, P.R.; Gore, A.H.; Ajalkar, B.D. A dual colorimetric chemosensor based on Schiff base for highly selective and simultaneous recognition of CN− and Sn2+. Inorganica Chim. Acta 2020, 502, 119372. [Google Scholar] [CrossRef]
- Yan, Z.; Wei, G.; Guang, S.; Xu, M.; Ren, X.; Wu, R.; Zhao, G.; Ke, F.; Xu, H. A multidentate ligand chromophore with rhodamine-triazole-pyridine units and its acting mechanism for dual-mode visual sensing trace Sn2+. Dye. Pigment. 2018, 159, 542–550. [Google Scholar] [CrossRef]
- Cheah, P.W.; Heng, M.P.; Izati, A.; Ng, C.H.; Tan, K.W. Rhodamine B conjugate for rapid colorimetric and fluorimetric detection of aluminium and tin ions and its application in aqueous media. Inorganica Chim. Acta 2020, 512, 119901. [Google Scholar] [CrossRef]
- Ravichandiran, P.; Kaliannagounder, V.K.; Bella, A.P.; Boguszewska-Czubara, A.; Masłyk, M.; Kim, C.S.; Park, C.H.; Johnson, P.M.; Park, B.-H.; Han, M.-K.; et al. Simple colorimetric and fluorescence chemosensing probe for selective detection of Sn2+ ions in an aqueous solution: Evaluation of the novel sensing mechanism and its bioimaging applications. Anal. Chem. 2021, 93, 801–811. [Google Scholar] [CrossRef]
- Adhikari, S.; Mandal, S.; Ghosh, A.; Guria, S.; Das, D. Sn(II) induced concentration dependent dynamic to static excimer conversion of a conjugated naphthalene derivative. Dalton Trans. 2015, 44, 14388–14393. [Google Scholar] [CrossRef]
- Akram, D.; Elhaty, I.A.; AlNeyadi, S.S. Synthesis and antibacterial activity of rhodanine-based azo dyes and their use as spectrophotometric chemosensor for Fe3+ ions. Chemosensors 2020, 8, 16. [Google Scholar] [CrossRef]
- Murugan, A.S.; Vidhyalakshmi, N.; Ramesh, U.; Annaraj, J. In vivo bio-imaging studies of highly selective, sensitive rhodamine based fluorescent chemosensor for the detection of Cu2+/Fe3+ ions. Sens. Actuators B Chem. 2018, 274, 22–29. [Google Scholar] [CrossRef]
- Ghule, N.V.; Bhosale, R.S.; Puyad, A.L.; Bhosale, S.V.; Bhosale, S.V. Naphthalenediimide amphiphile based colorimetric probe for recognition of Cu2+ and Fe3+ ions. Sens. Actuators B Chem. 2016, 227, 17–23. [Google Scholar] [CrossRef]
- Saremi, M.; Kakanejadifard, A.; Adeli, M. A ratiometric fluorescent sensor based azo compound of 4-(4-dimethylamino-phenylazo)-N-pyridin-2-ylmethyl-benzamide for rapid and selective detection of Fe3+ ion. J. Mol. Liq. 2022, 358, 119168. [Google Scholar] [CrossRef]
- Yin, Z.-Y.; Hu, J.-H.; Gui, K.; Fu, Q.-Q.; Yao, Y.; Zhou, F.-L.; Ma, L.-L.; Zhang, Z.-P. AIE based colorimetric and “turn-on” fluorescence Schiff base sensor for detecting Fe3+ in an aqueous media and its application. J. Photochem. Photobiol. A 2020, 396, 112542. [Google Scholar] [CrossRef]
Disclaimer/Publisher’s Note: The statements, opinions and data contained in all publications are solely those of the individual author(s) and contributor(s) and not of MDPI and/or the editor(s). MDPI and/or the editor(s) disclaim responsibility for any injury to people or property resulting from any ideas, methods, instructions or products referred to in the content. |
© 2023 by the authors. Licensee MDPI, Basel, Switzerland. This article is an open access article distributed under the terms and conditions of the Creative Commons Attribution (CC BY) license (https://creativecommons.org/licenses/by/4.0/).