
Effect of Cd2+ Substitution on Structural–Magnetic and Dielectric Properties of Ni–Cu–Zn Spinel Ferrite Nanomaterials by Sol–Gel


Abstract
:1. Introduction
2. Results and Discussion
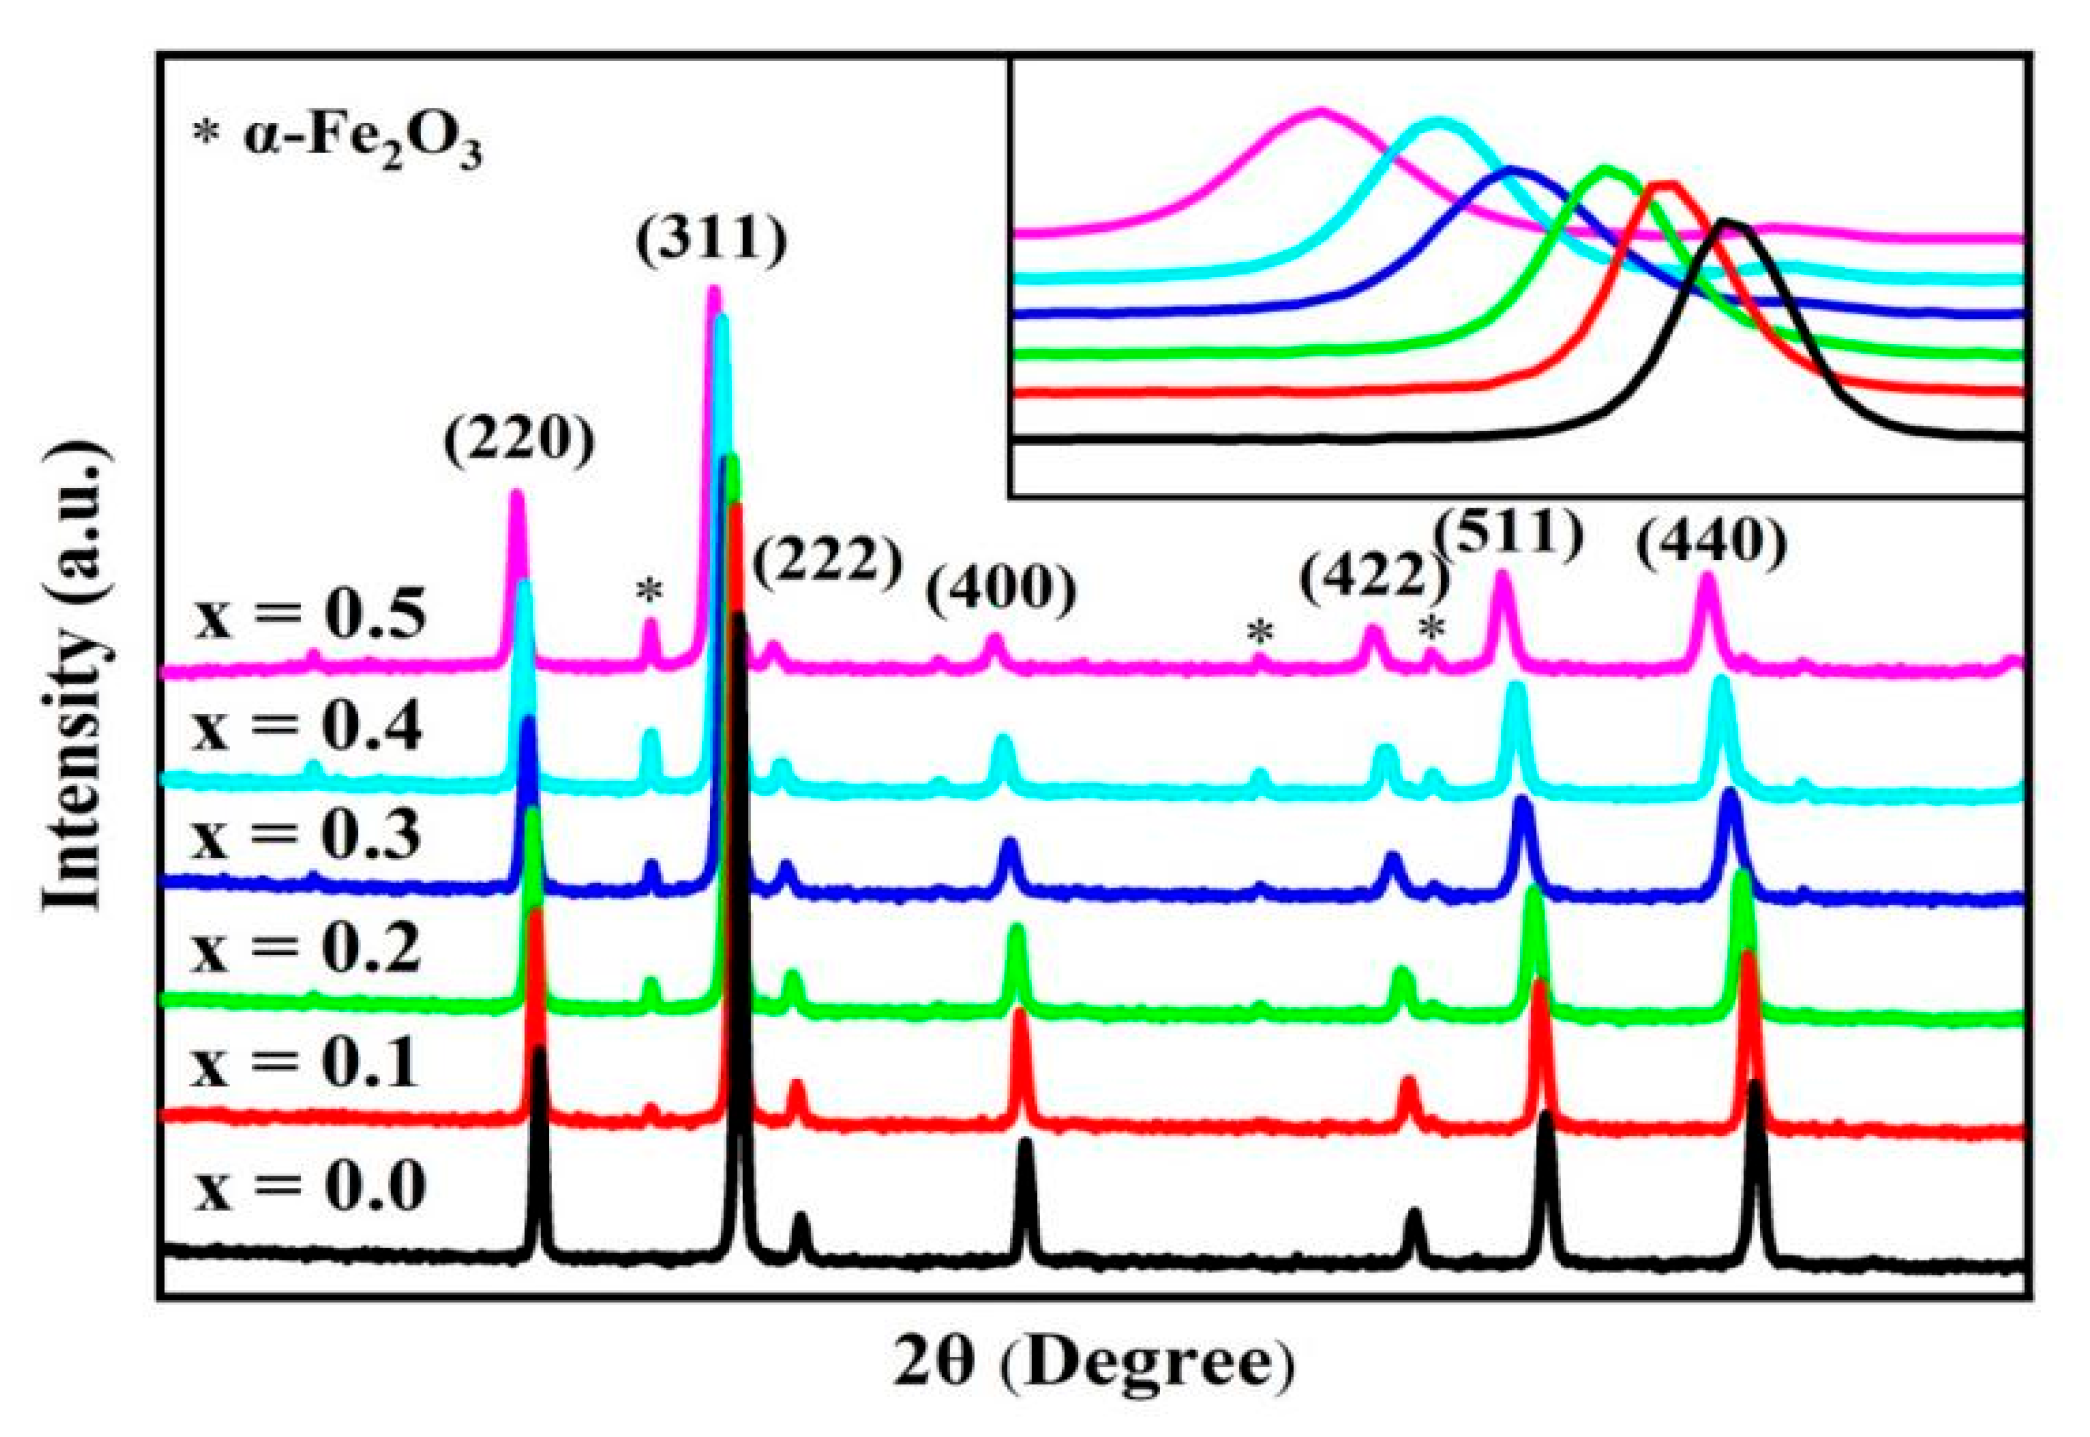
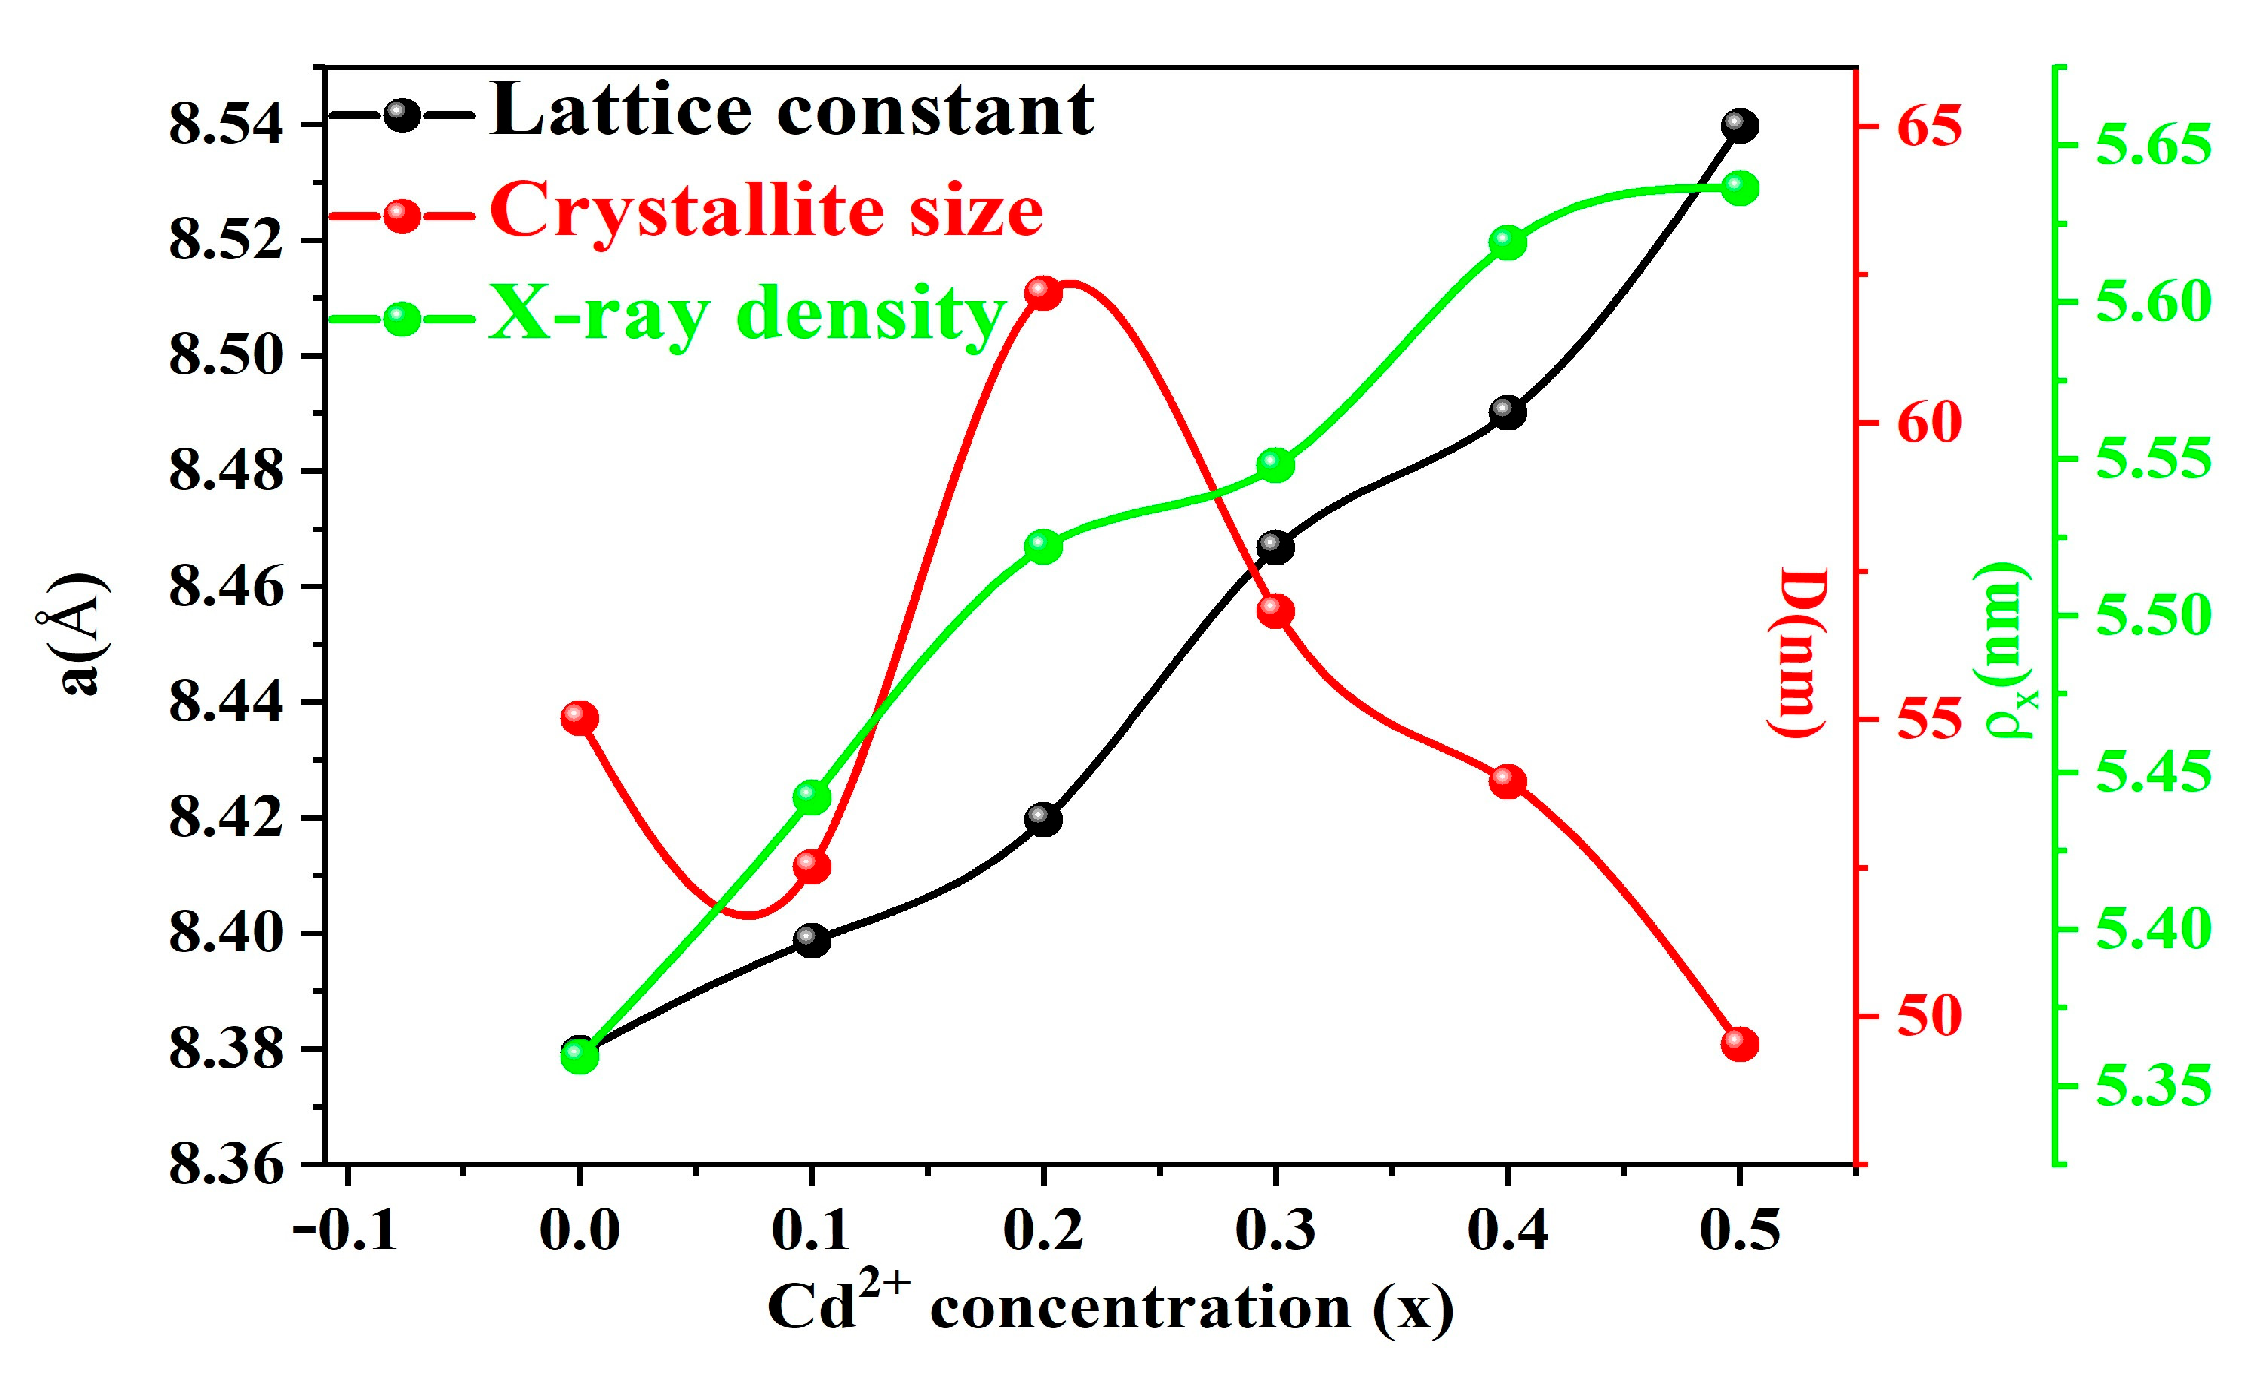
2.1. XRD Analysis
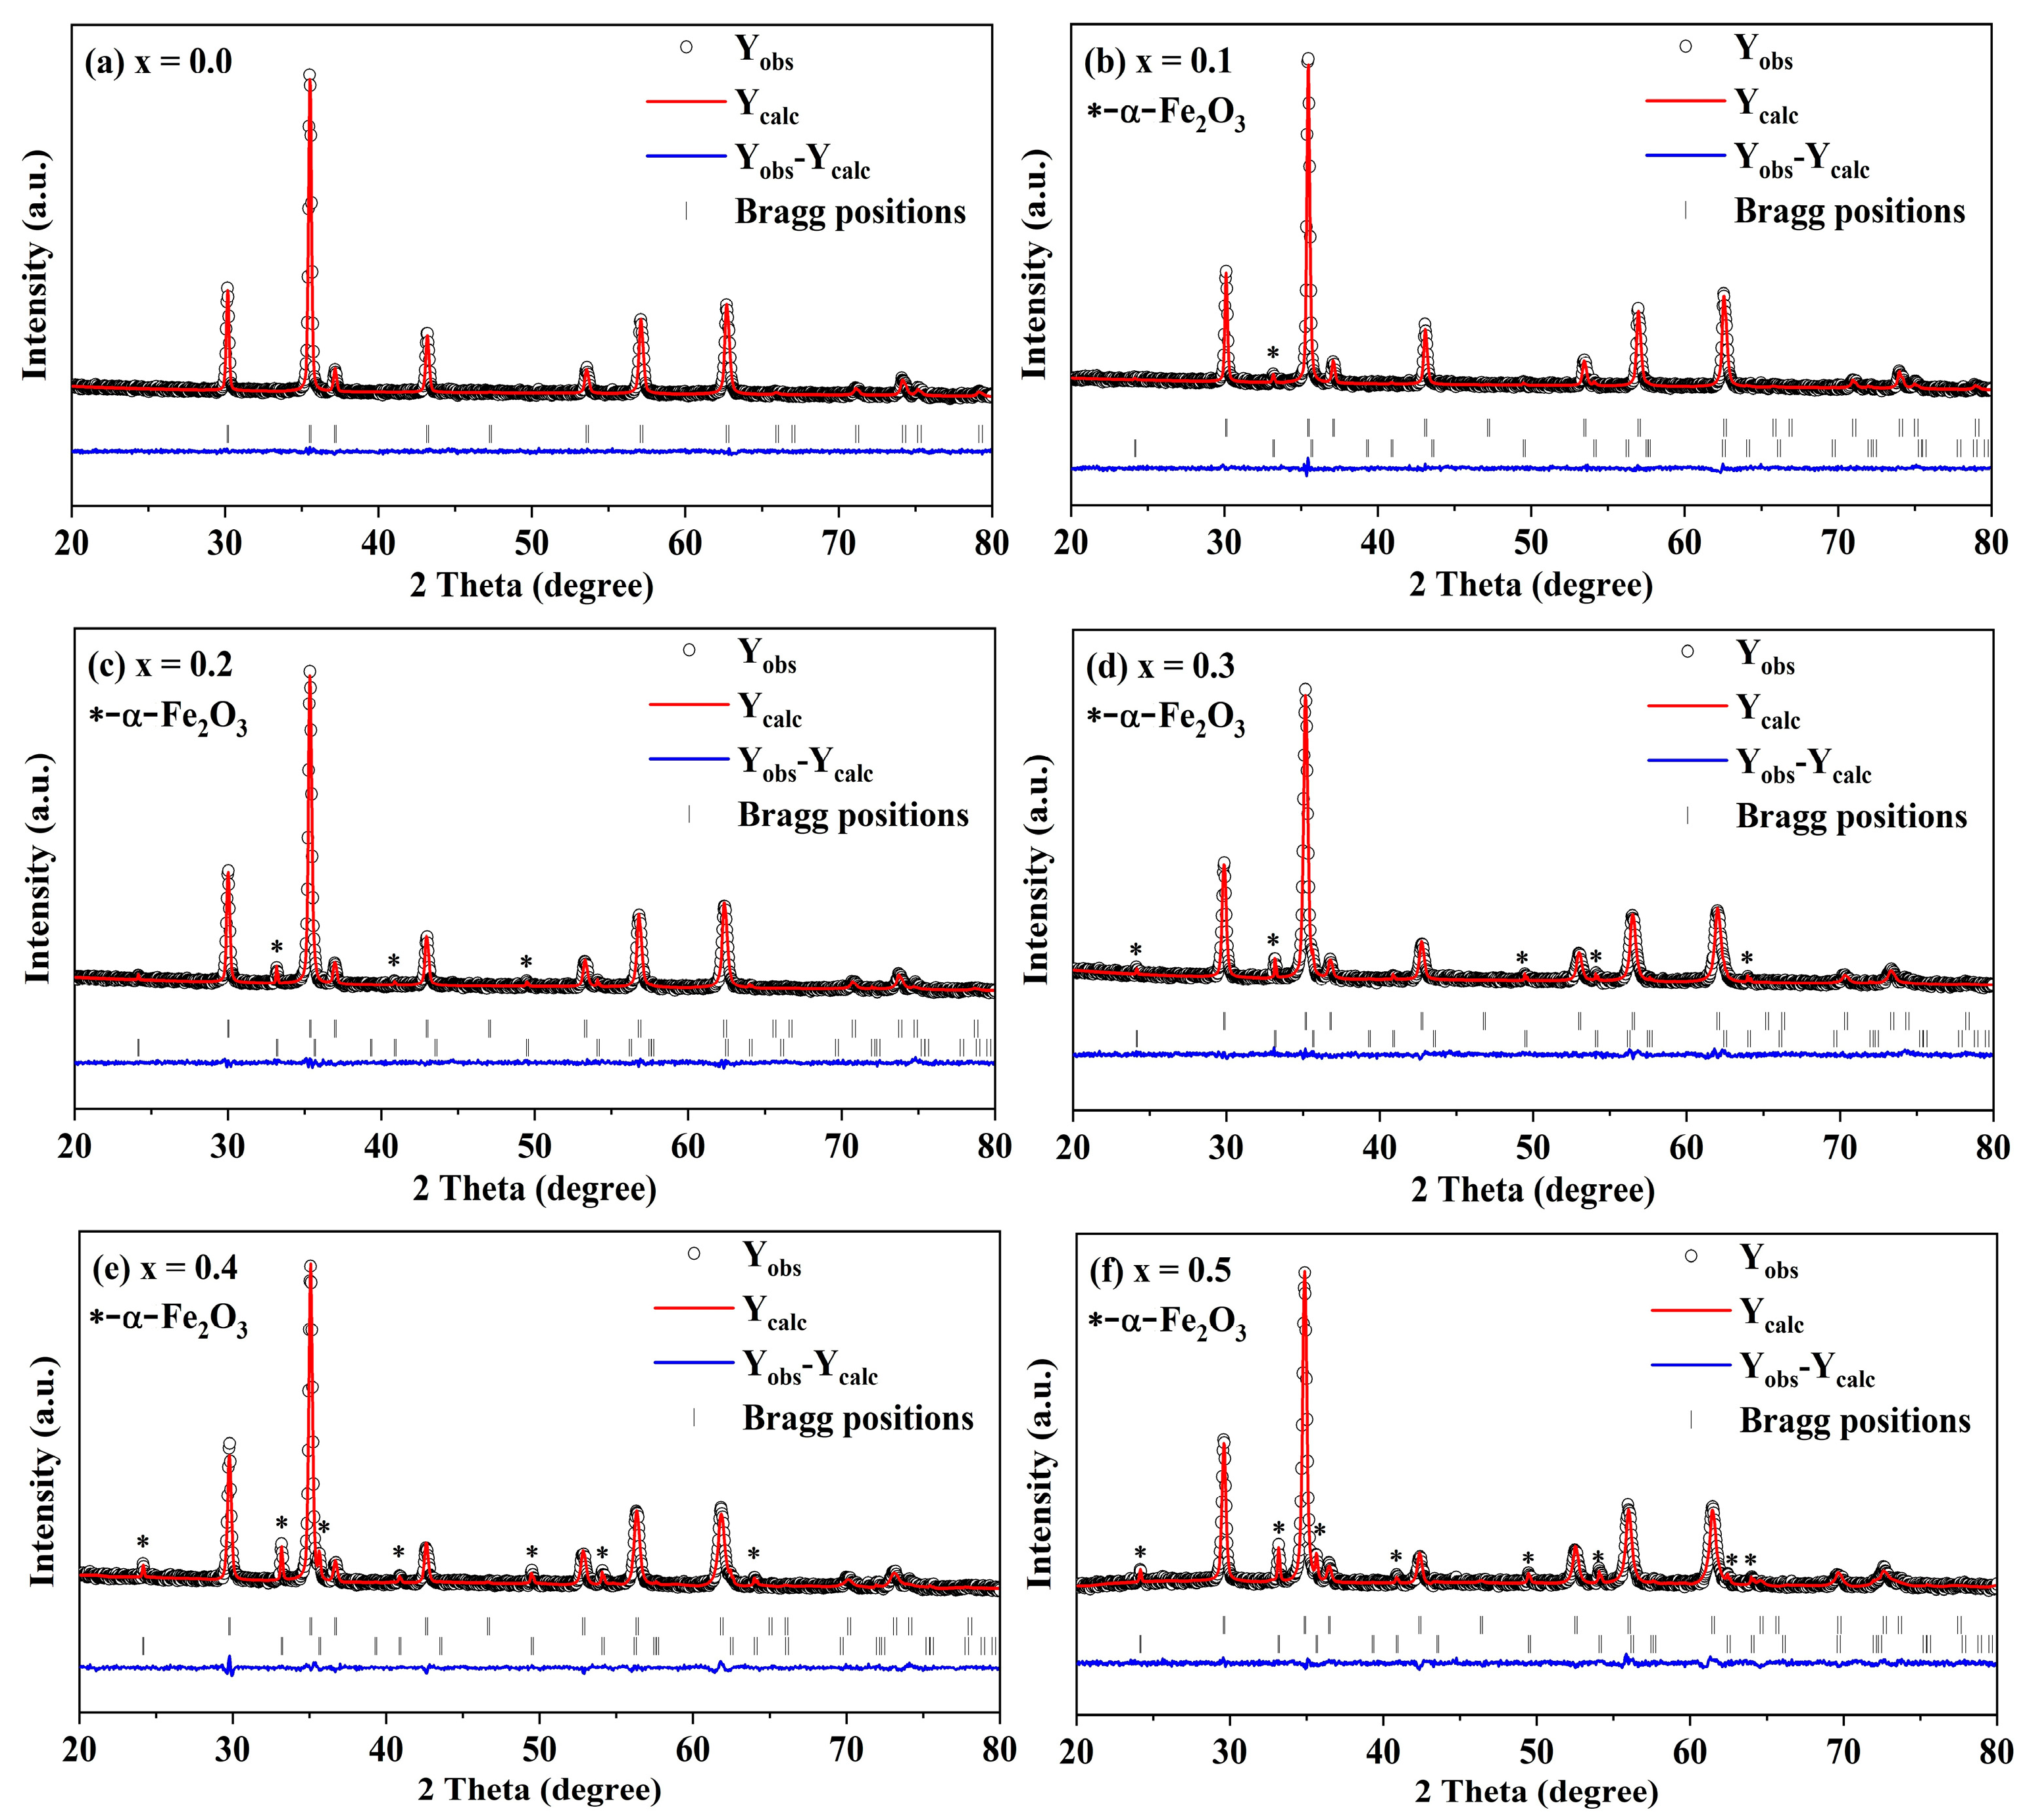
2.2. XRD Rietveld Refinement
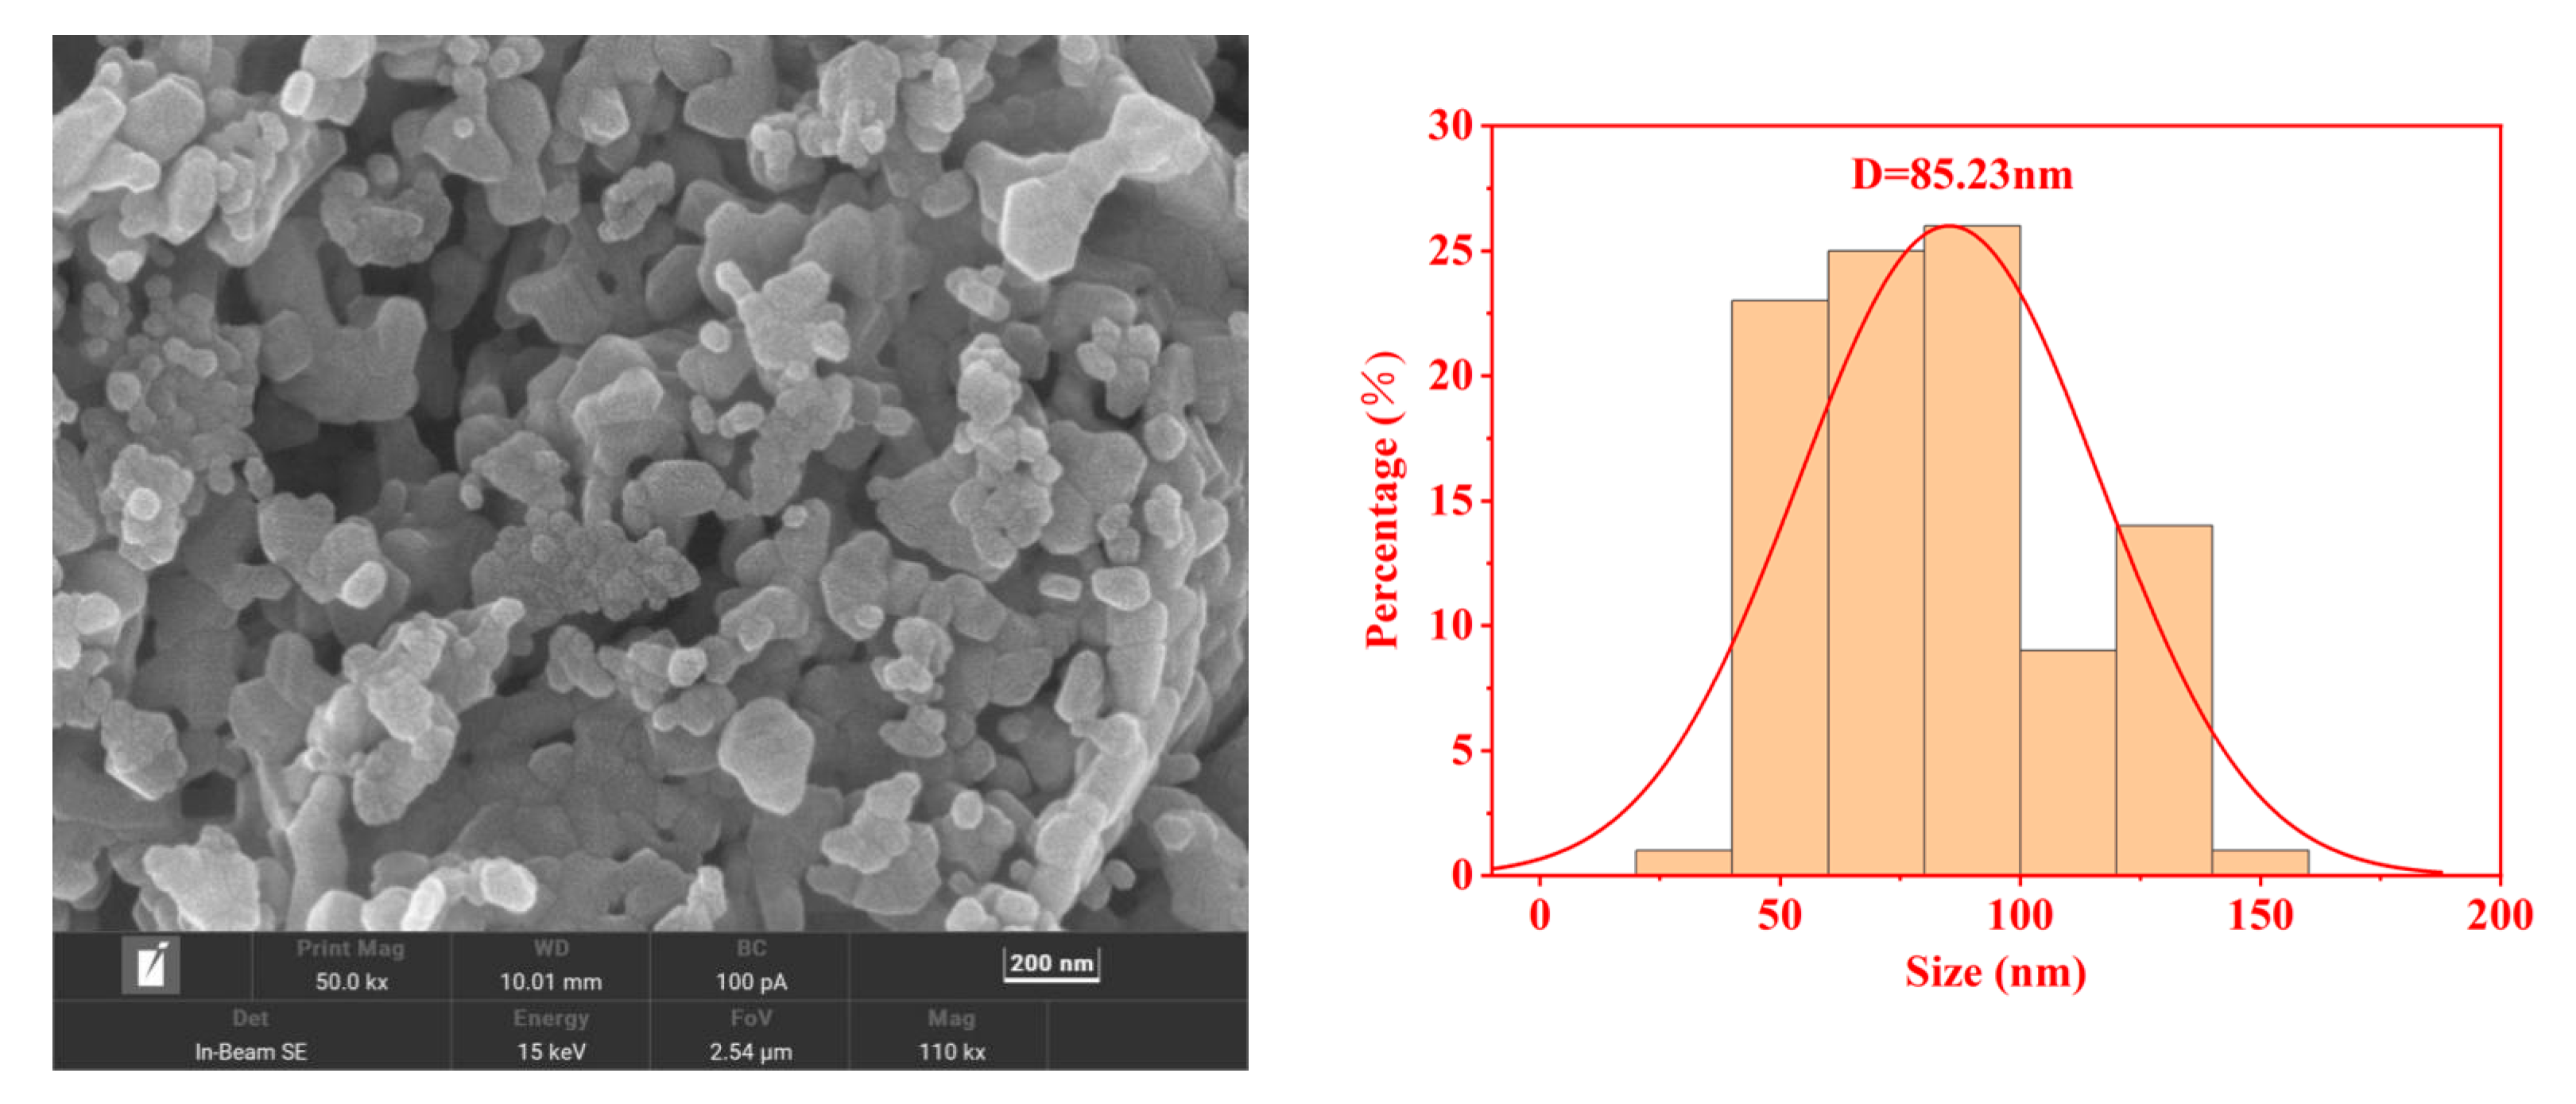
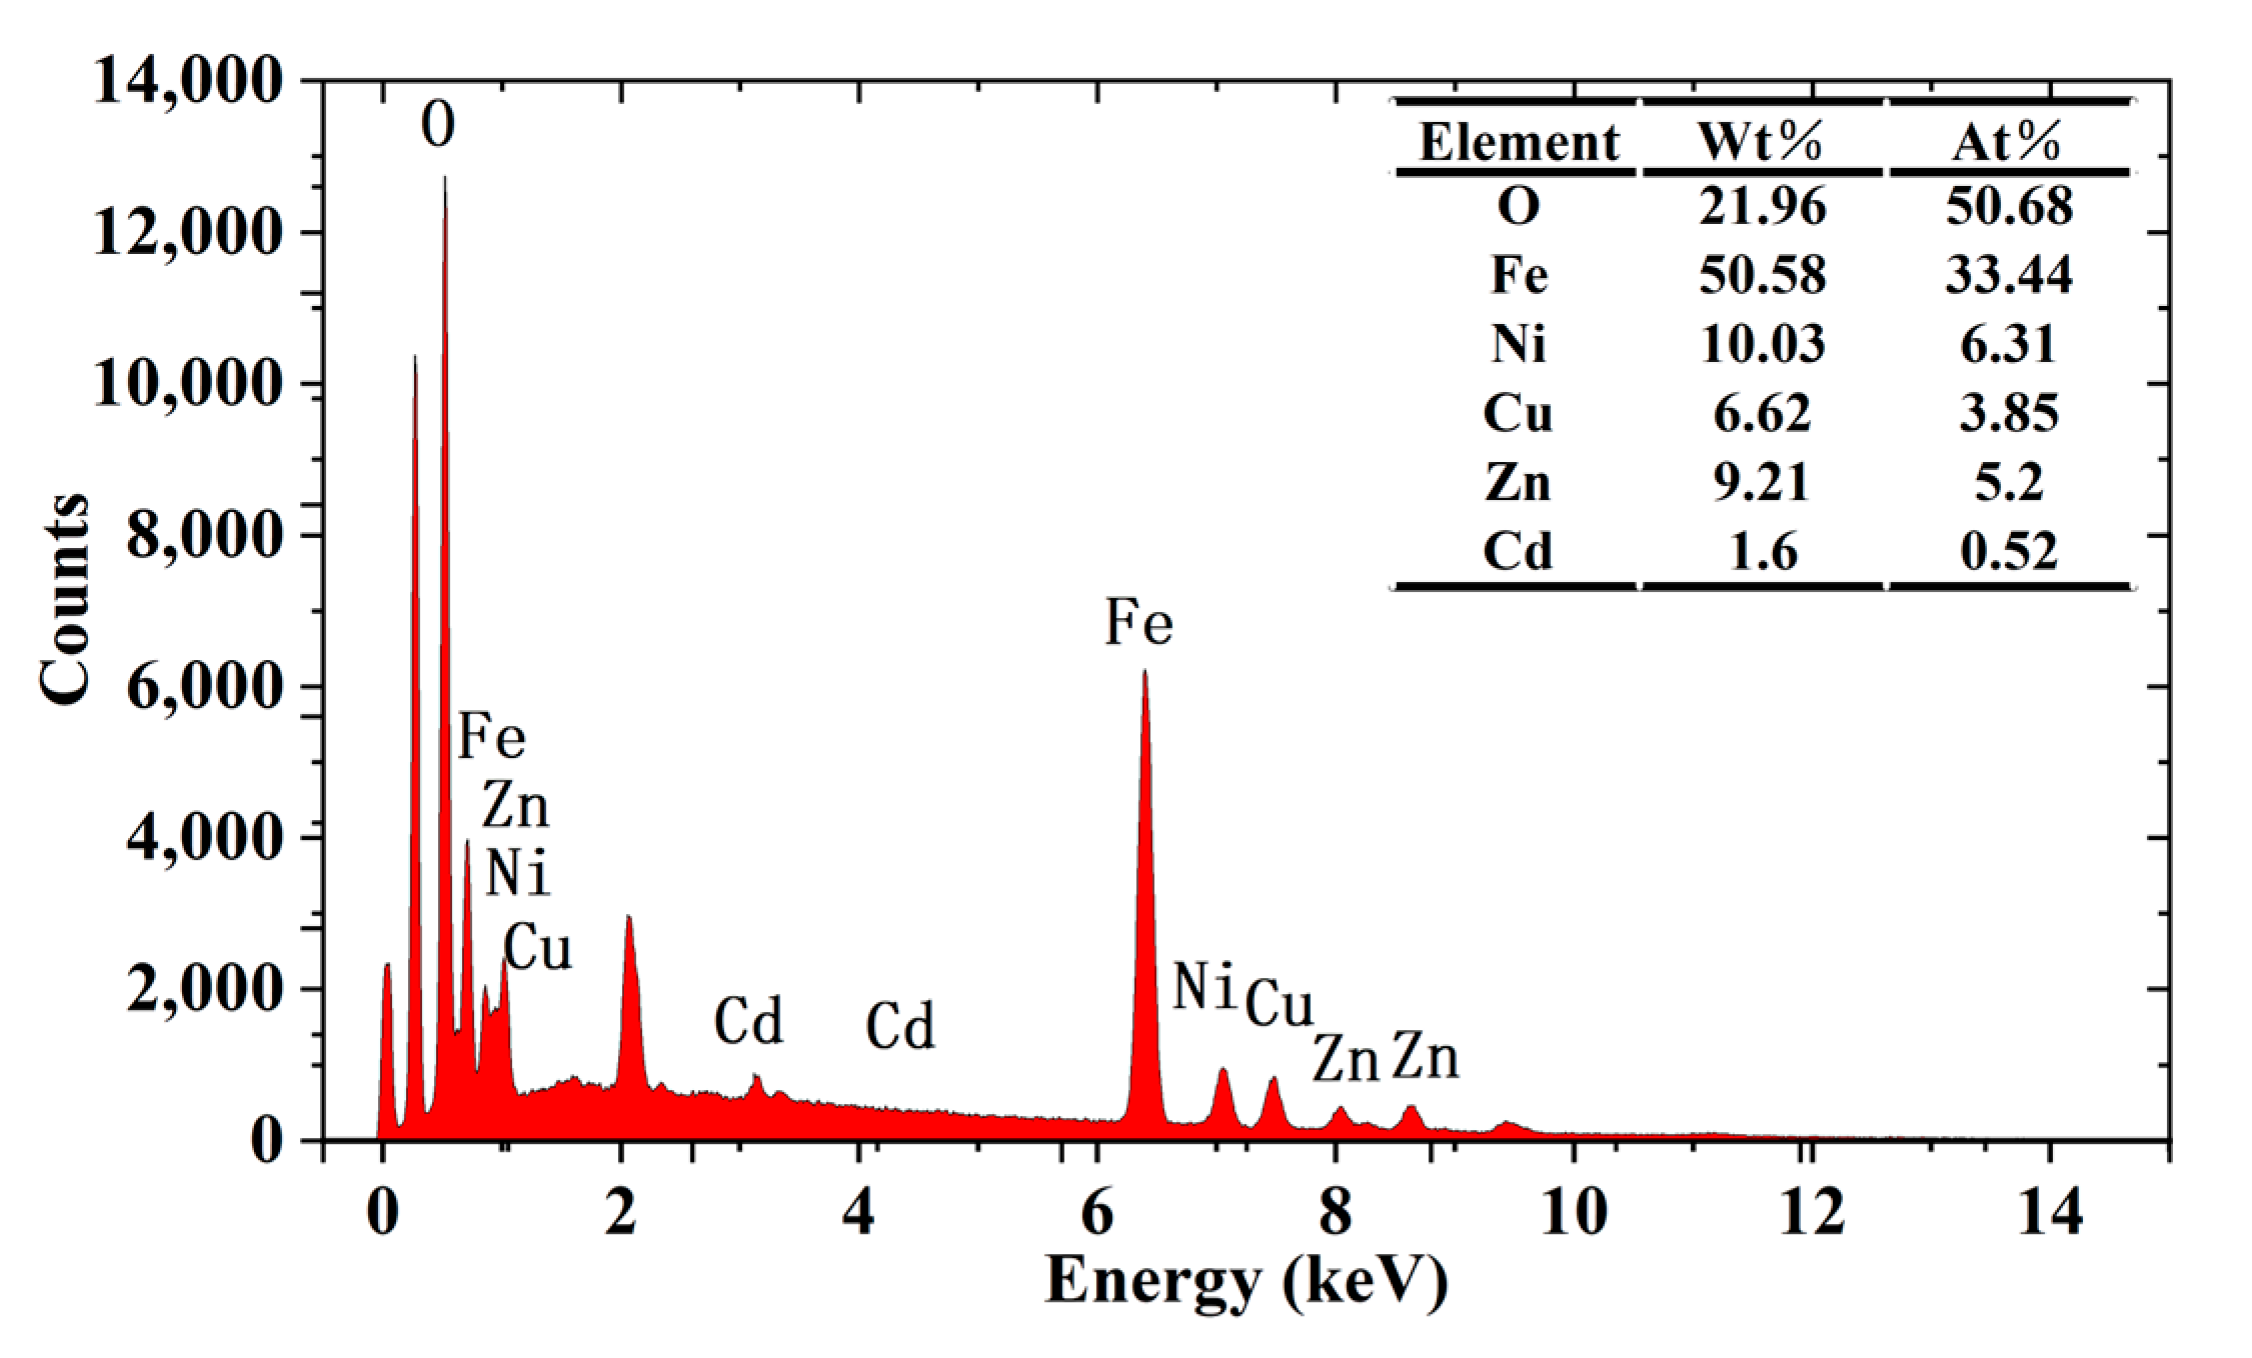
2.3. SEM Analysis
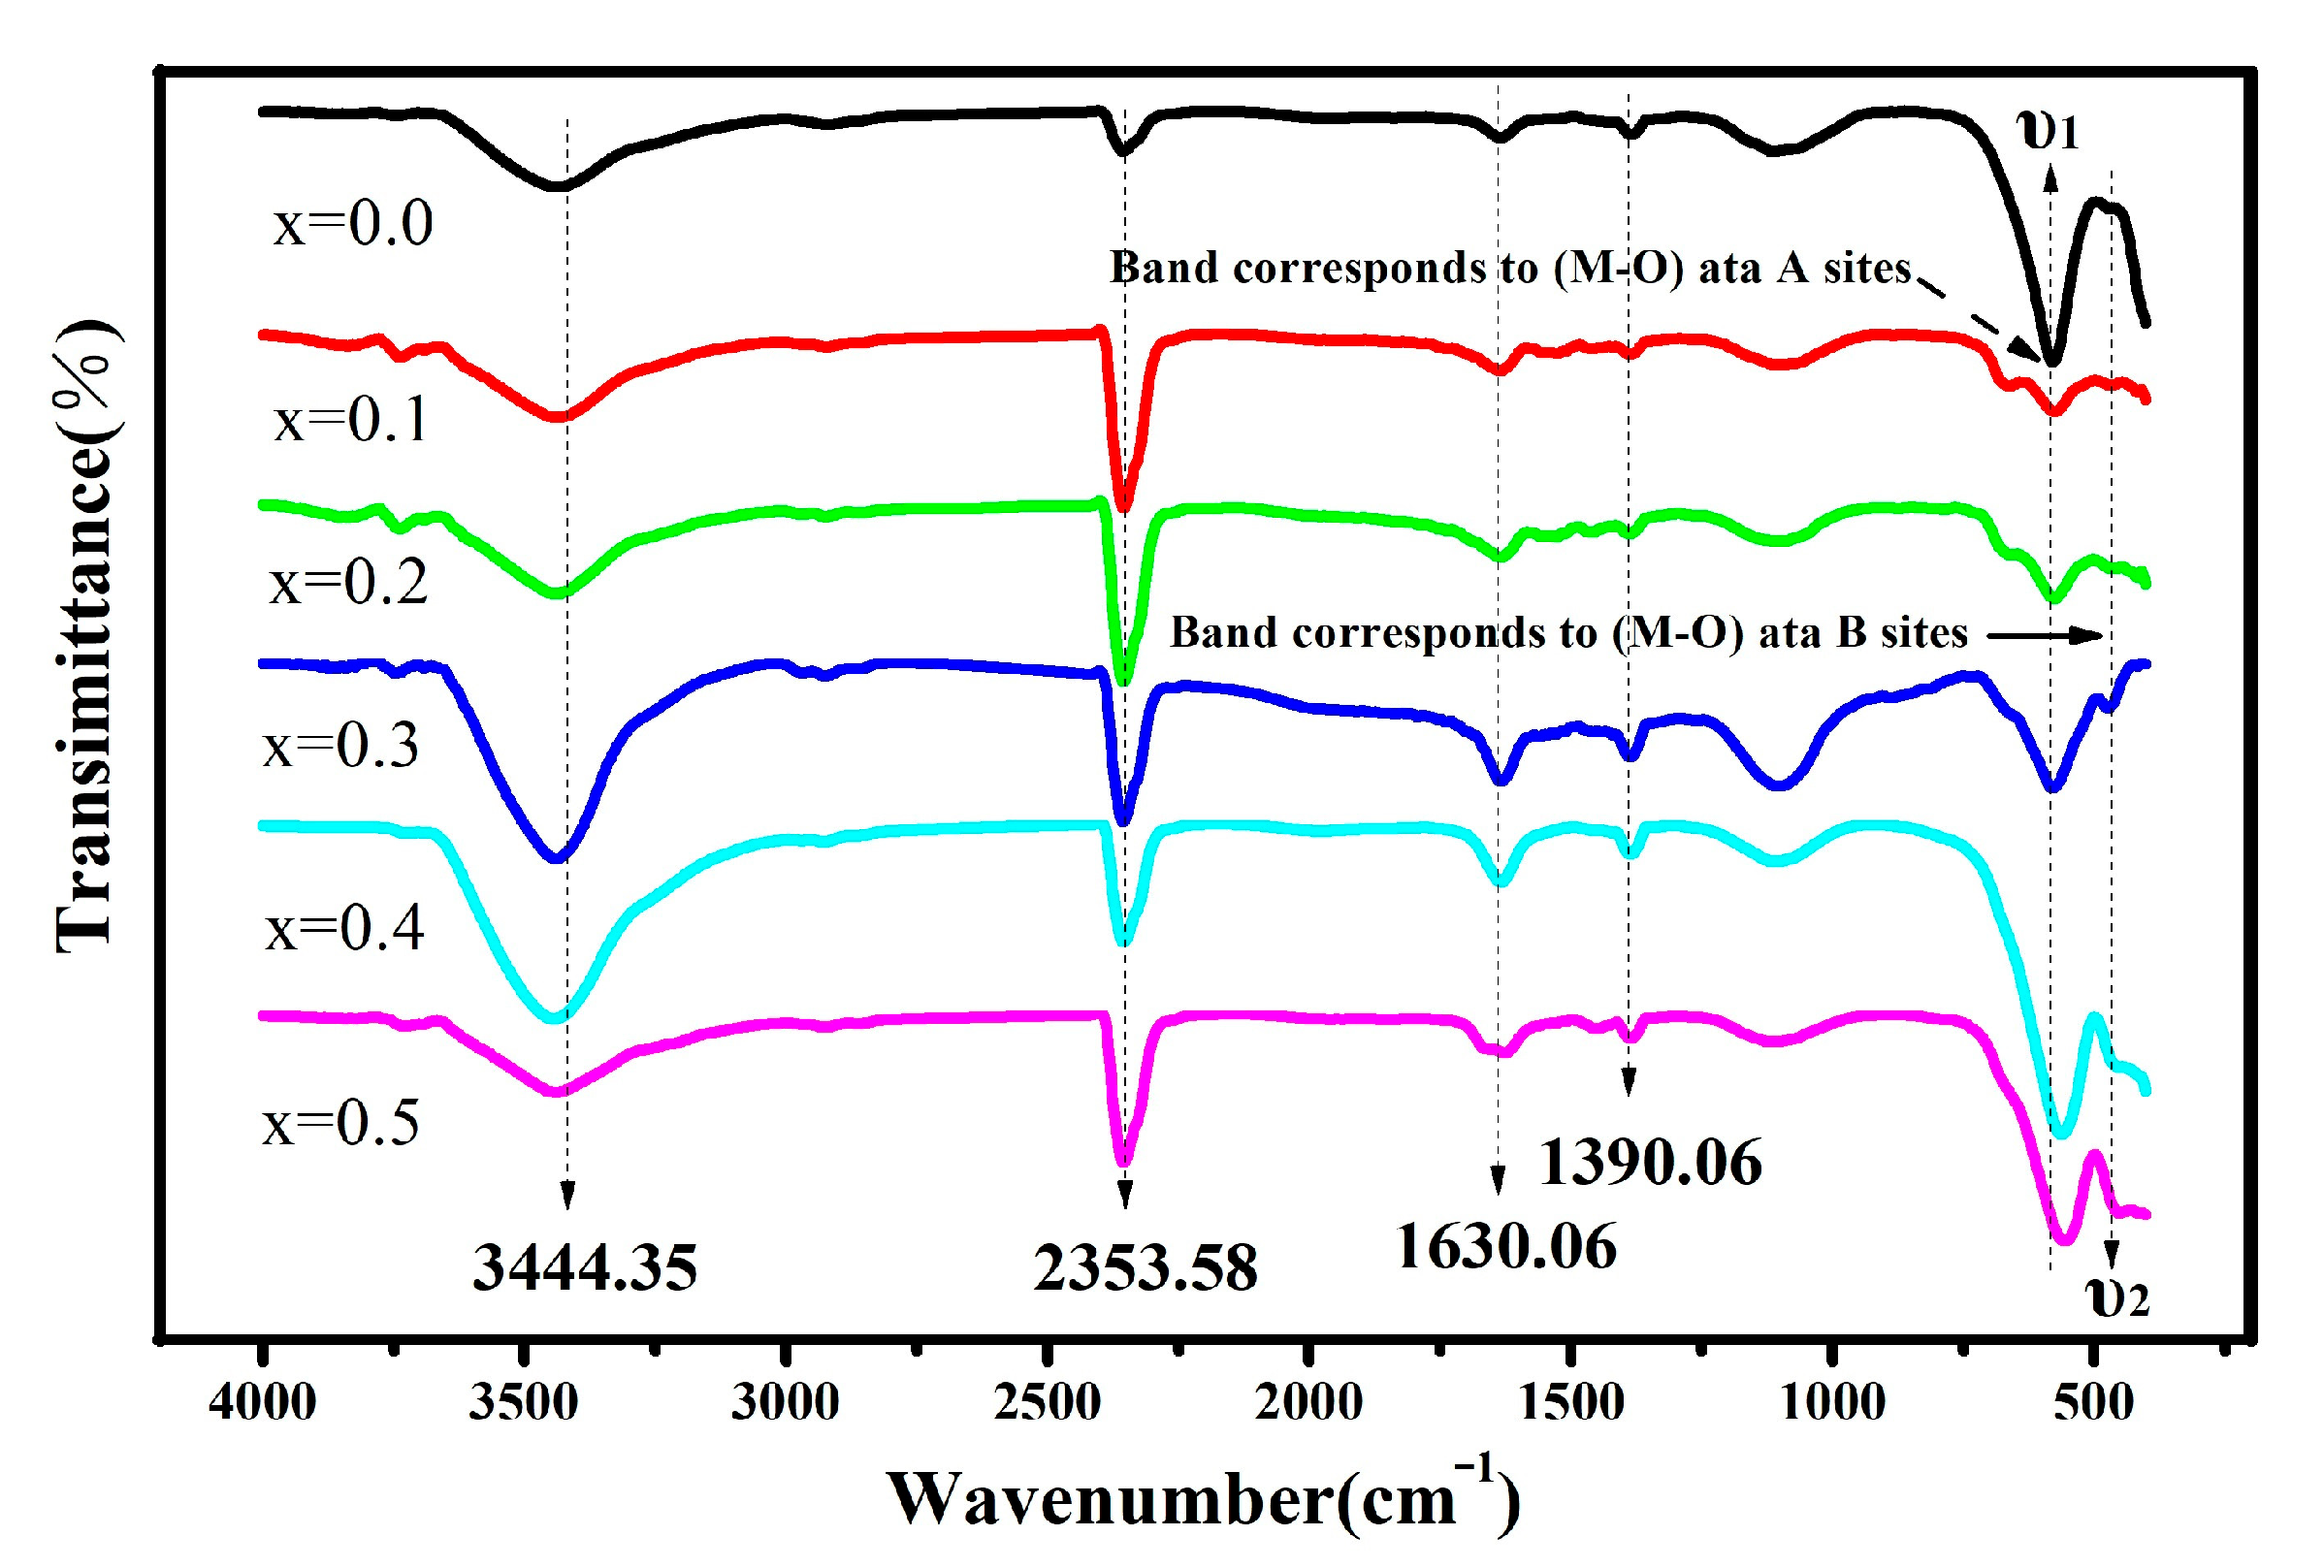
2.4. FTIR Analysis
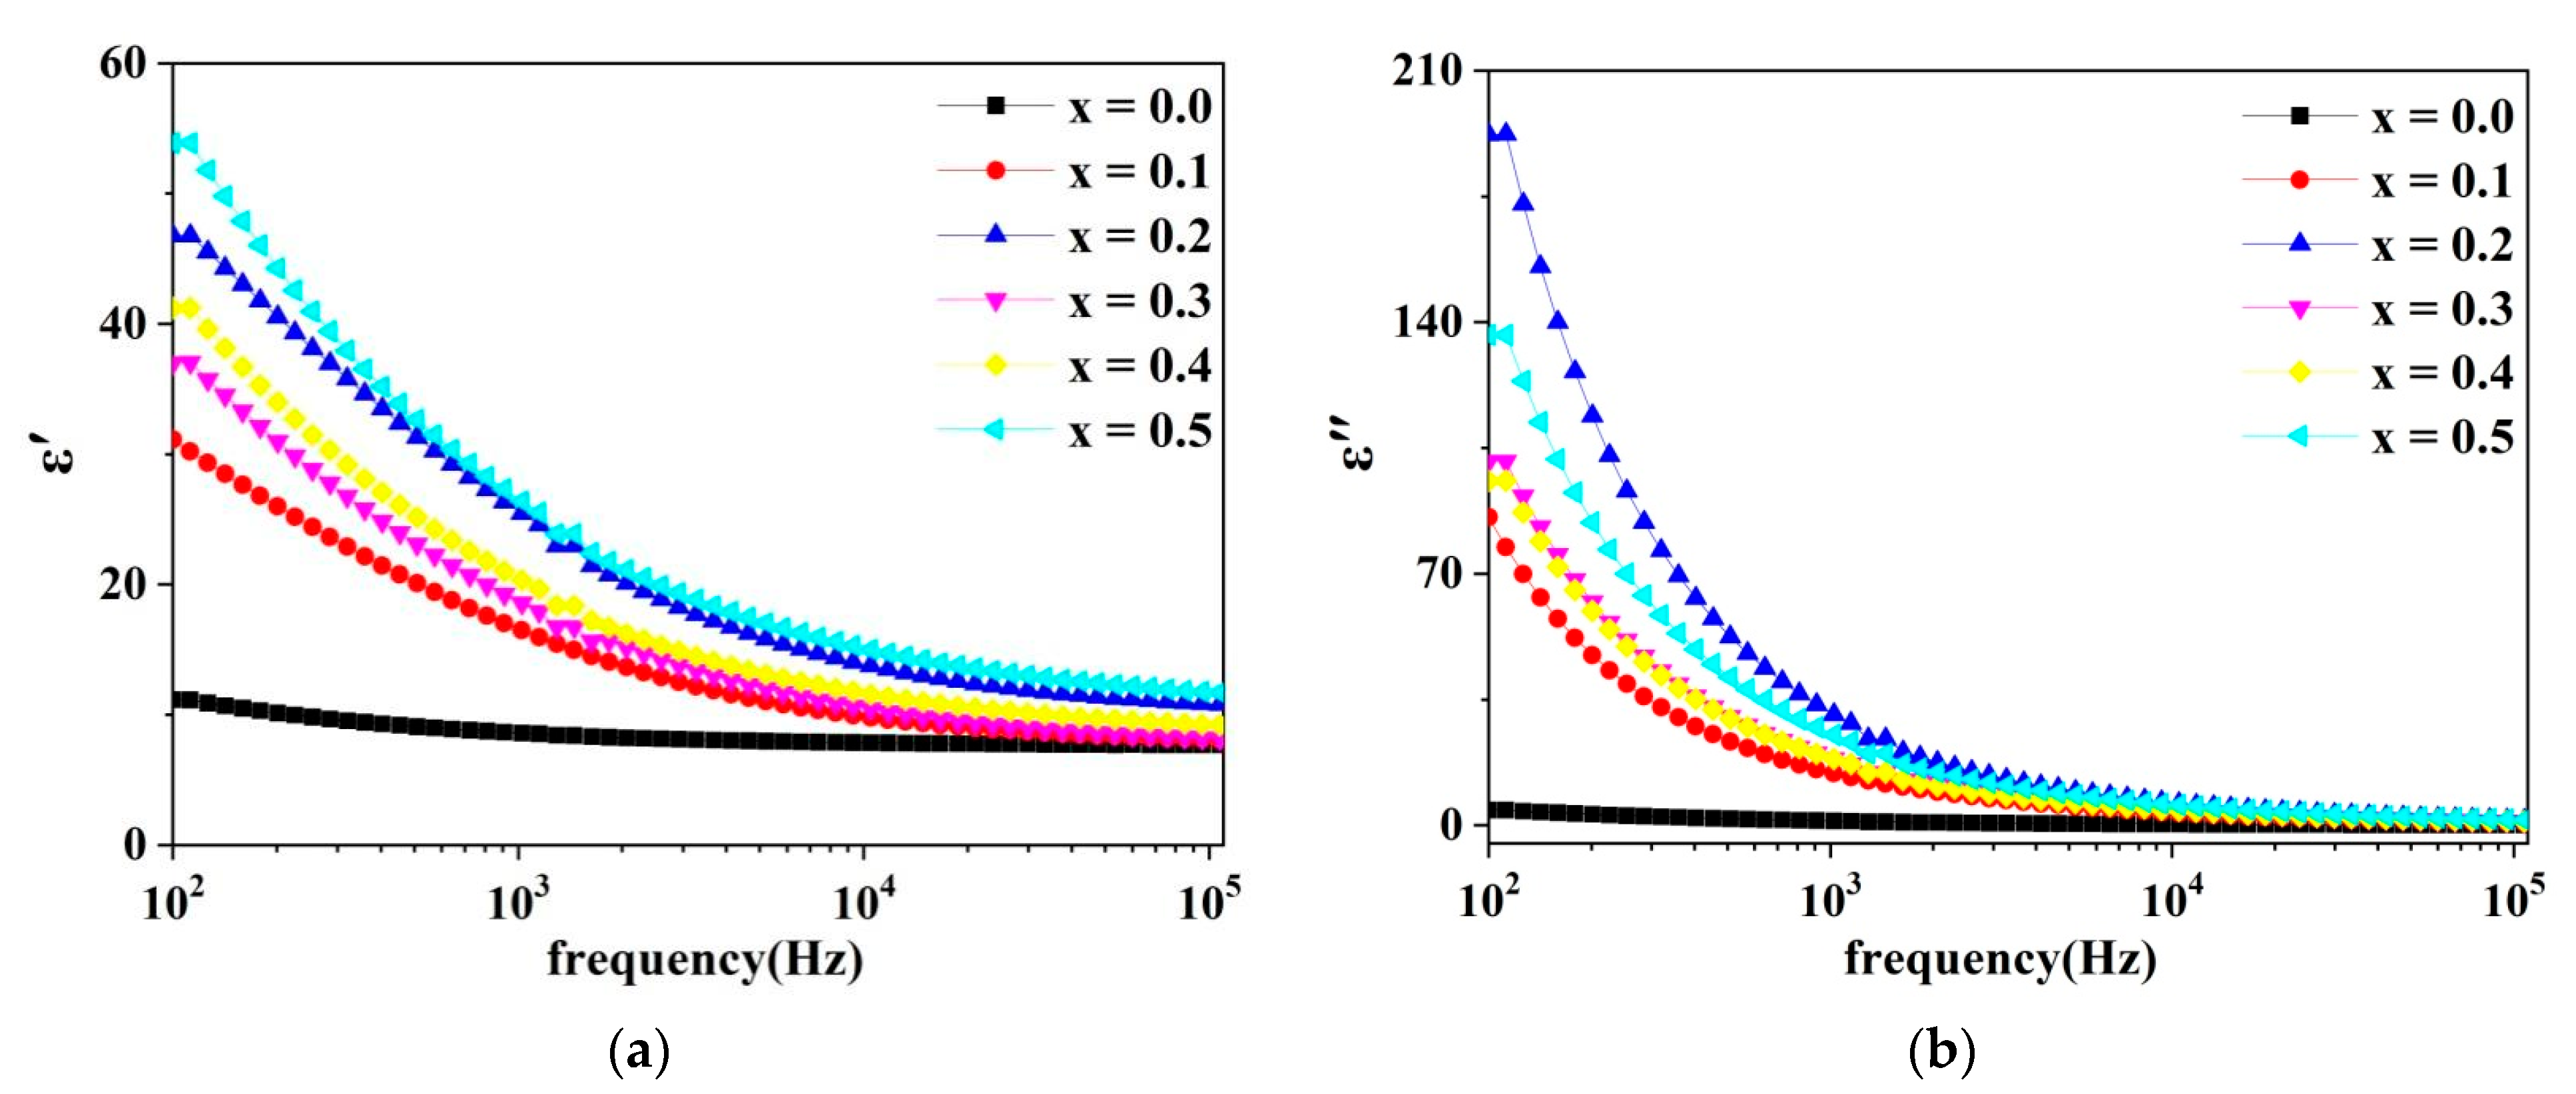
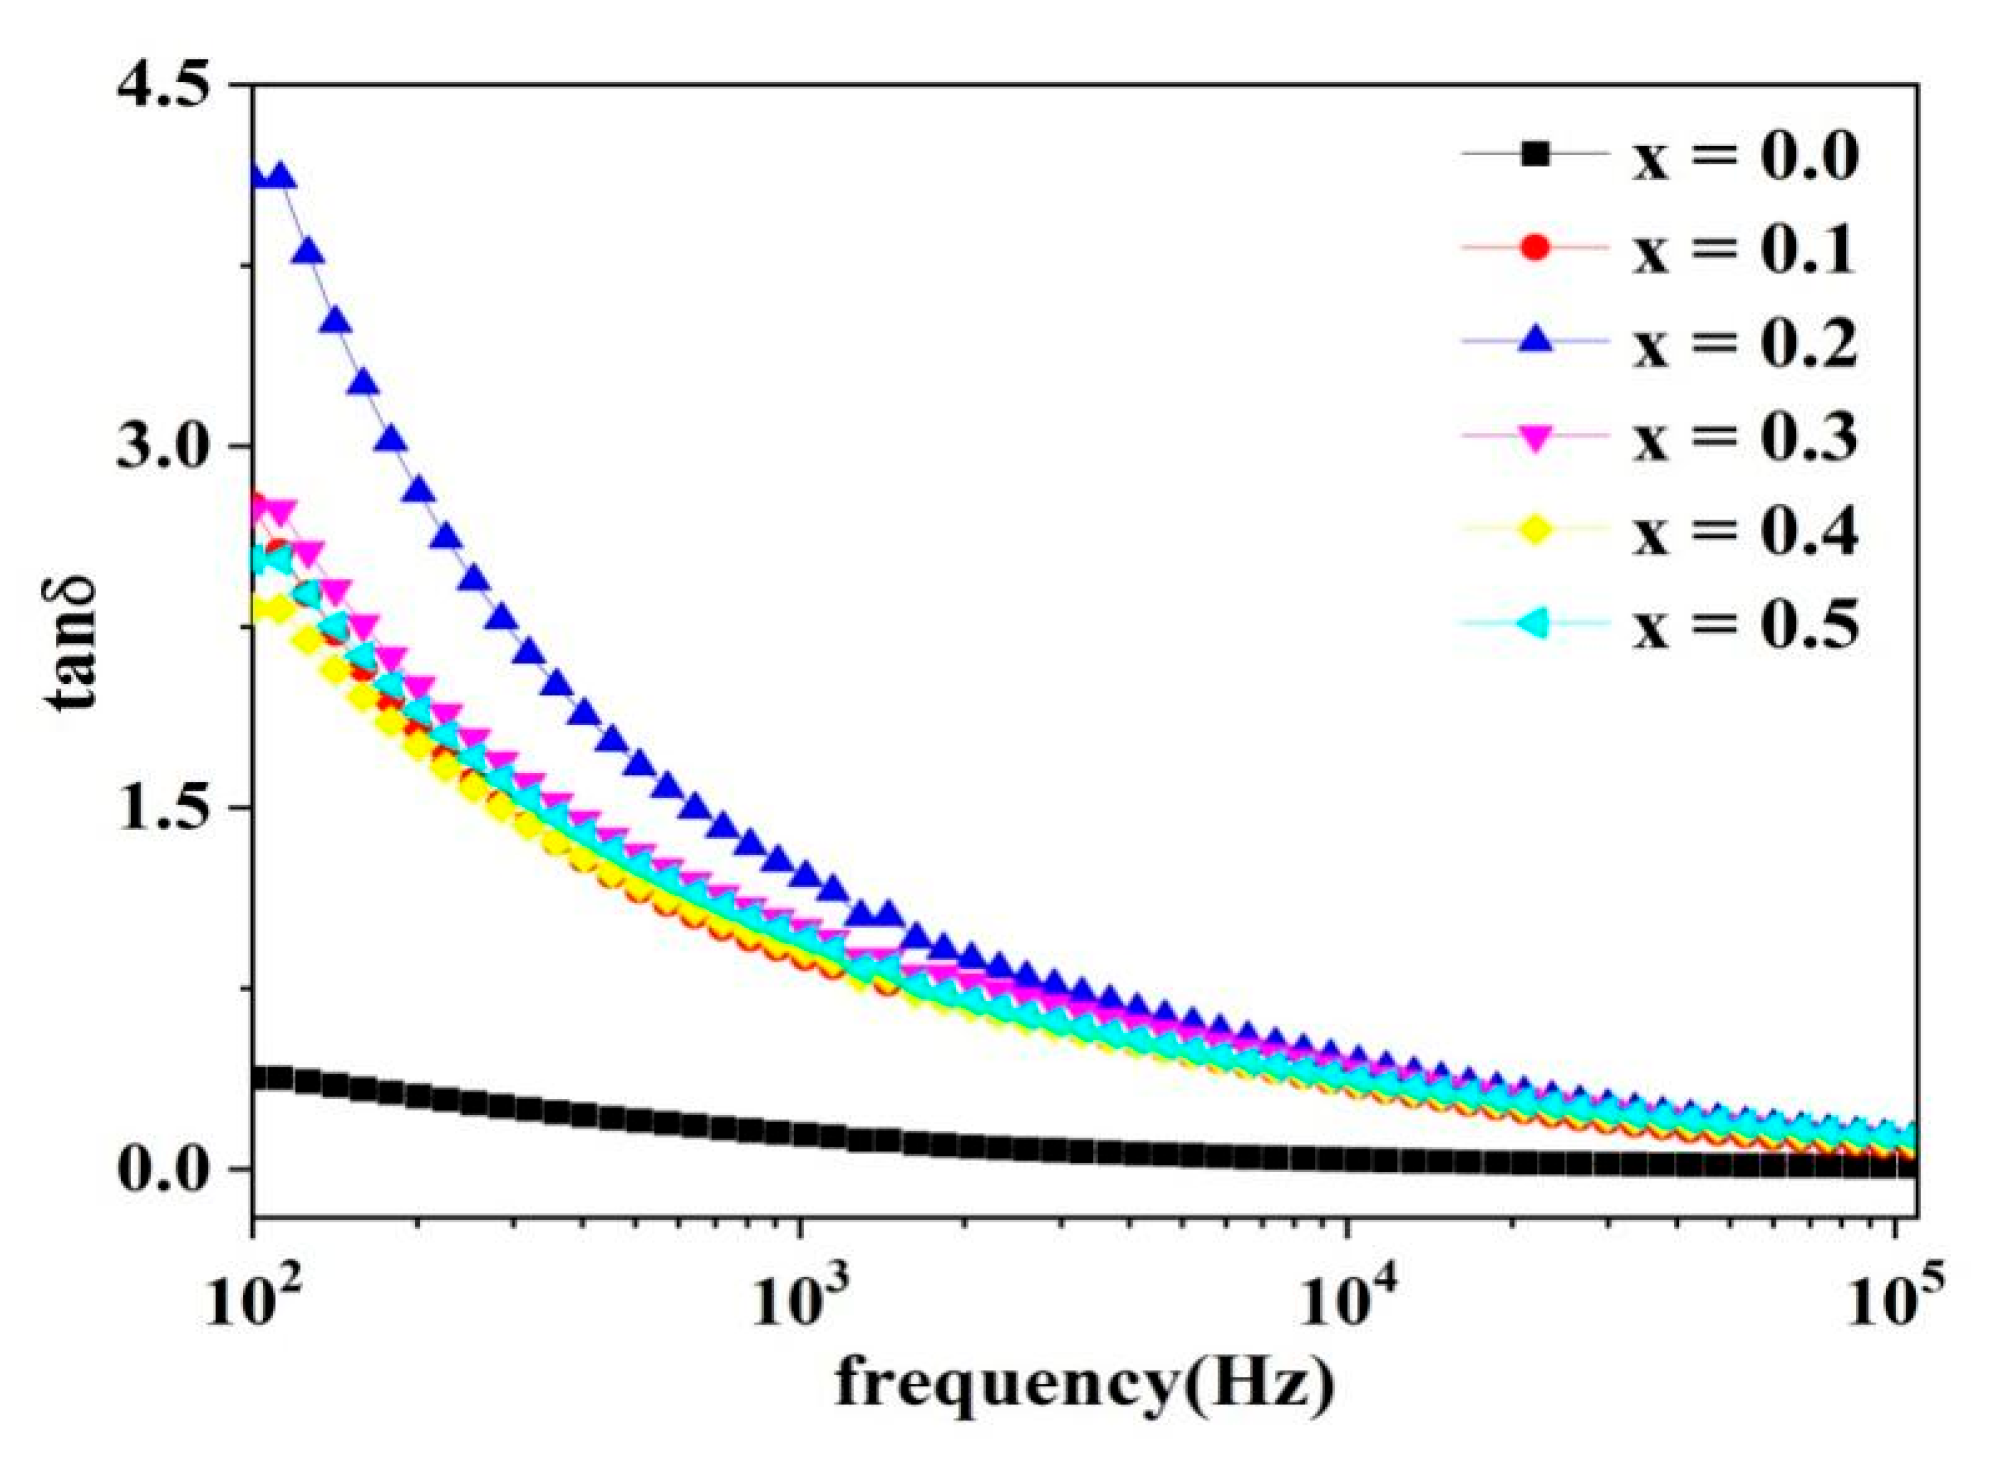
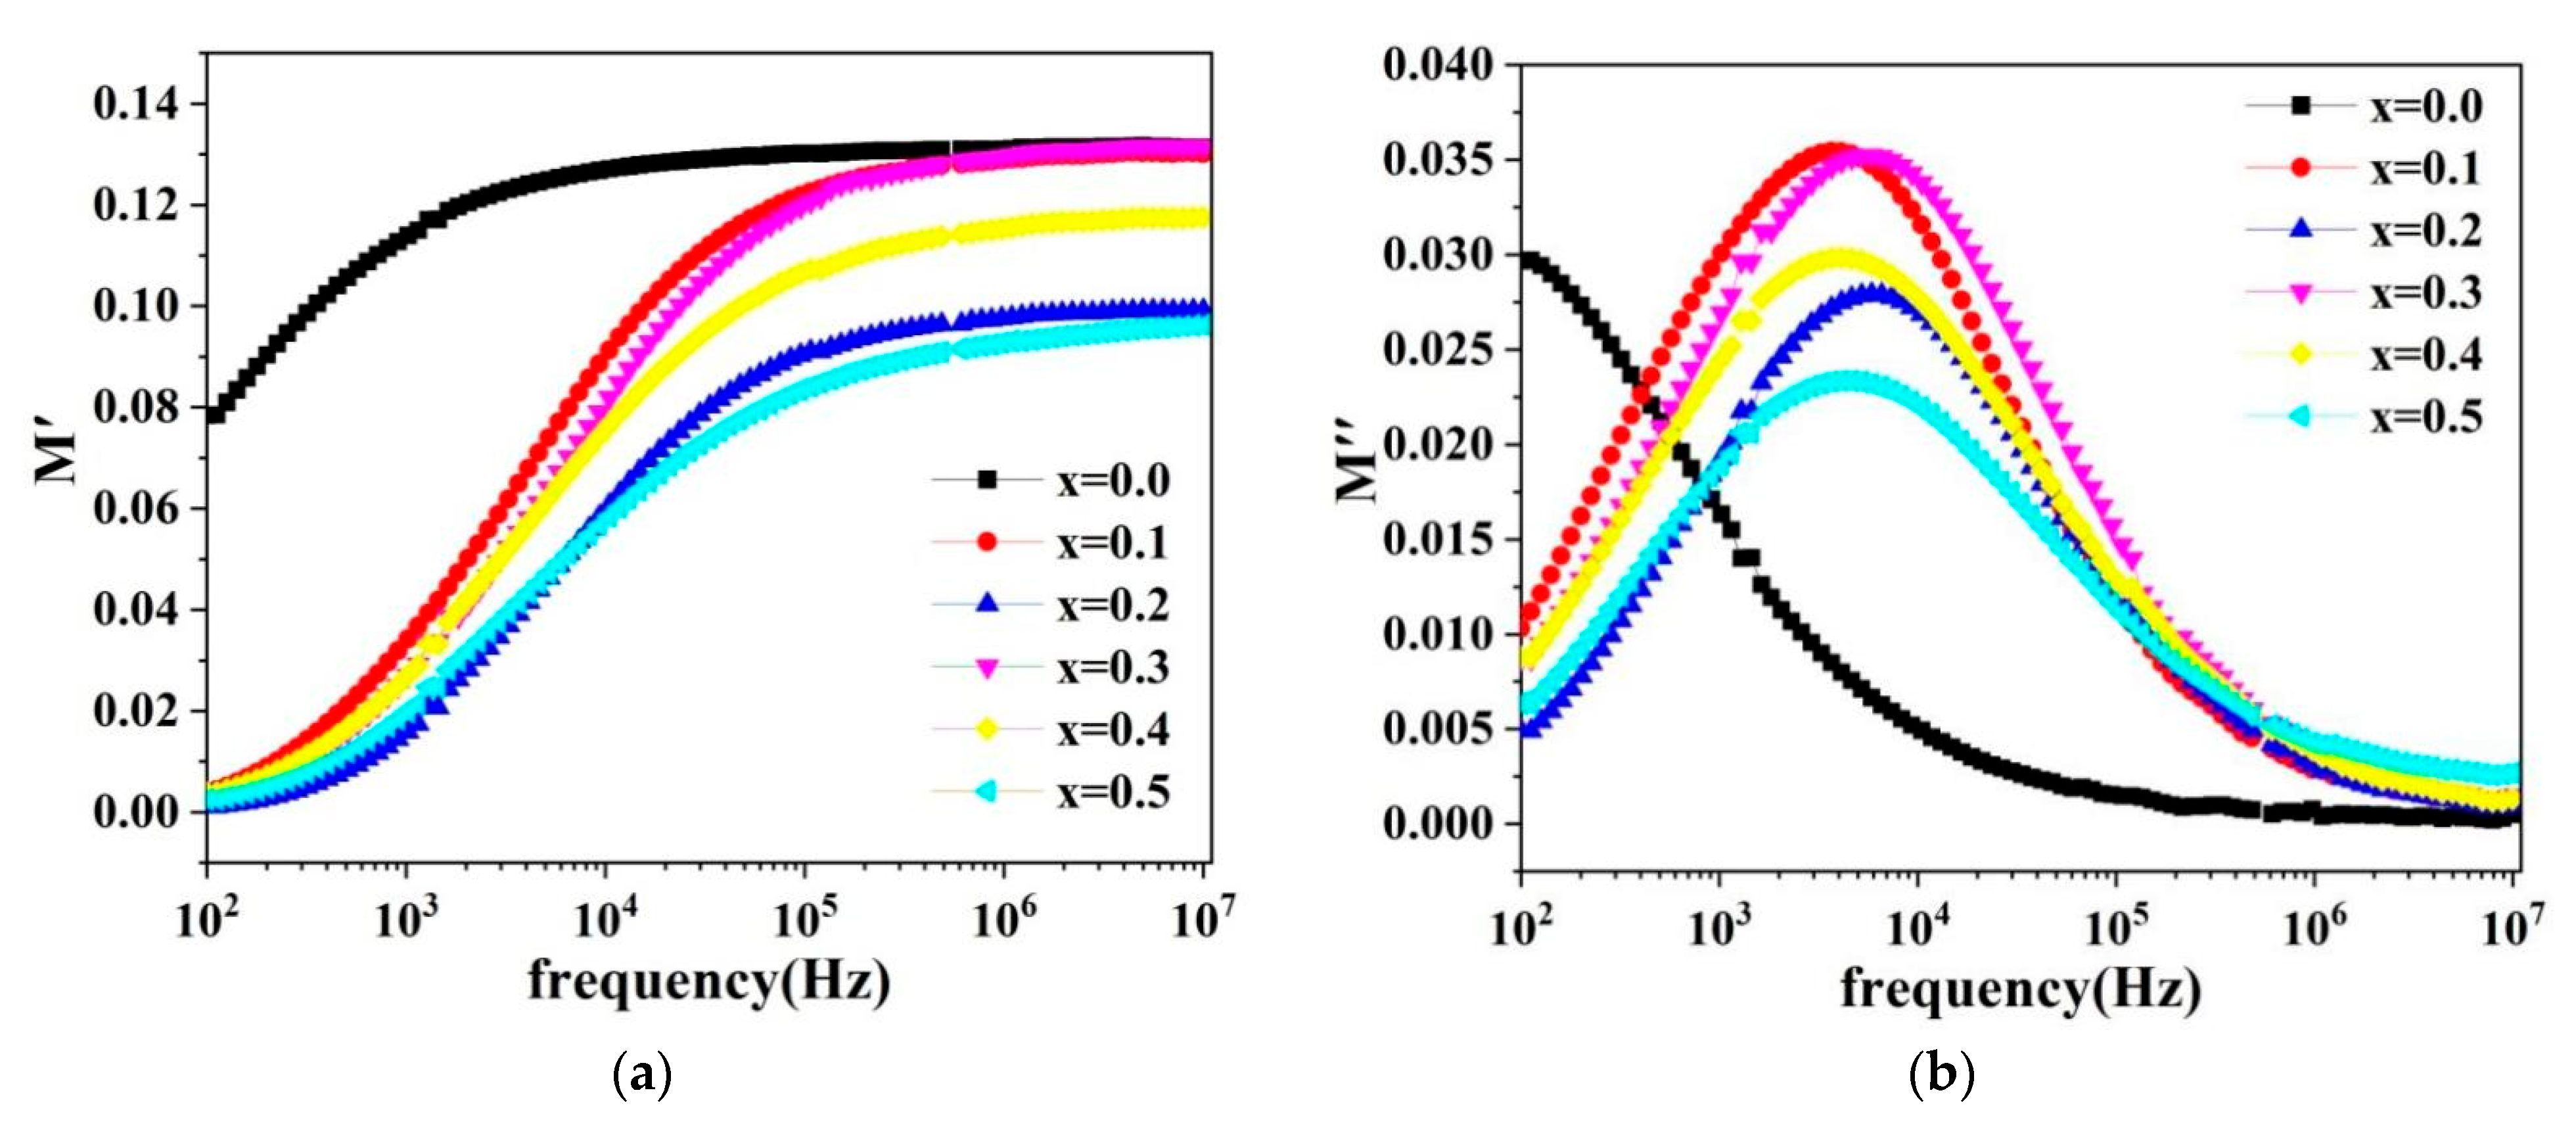
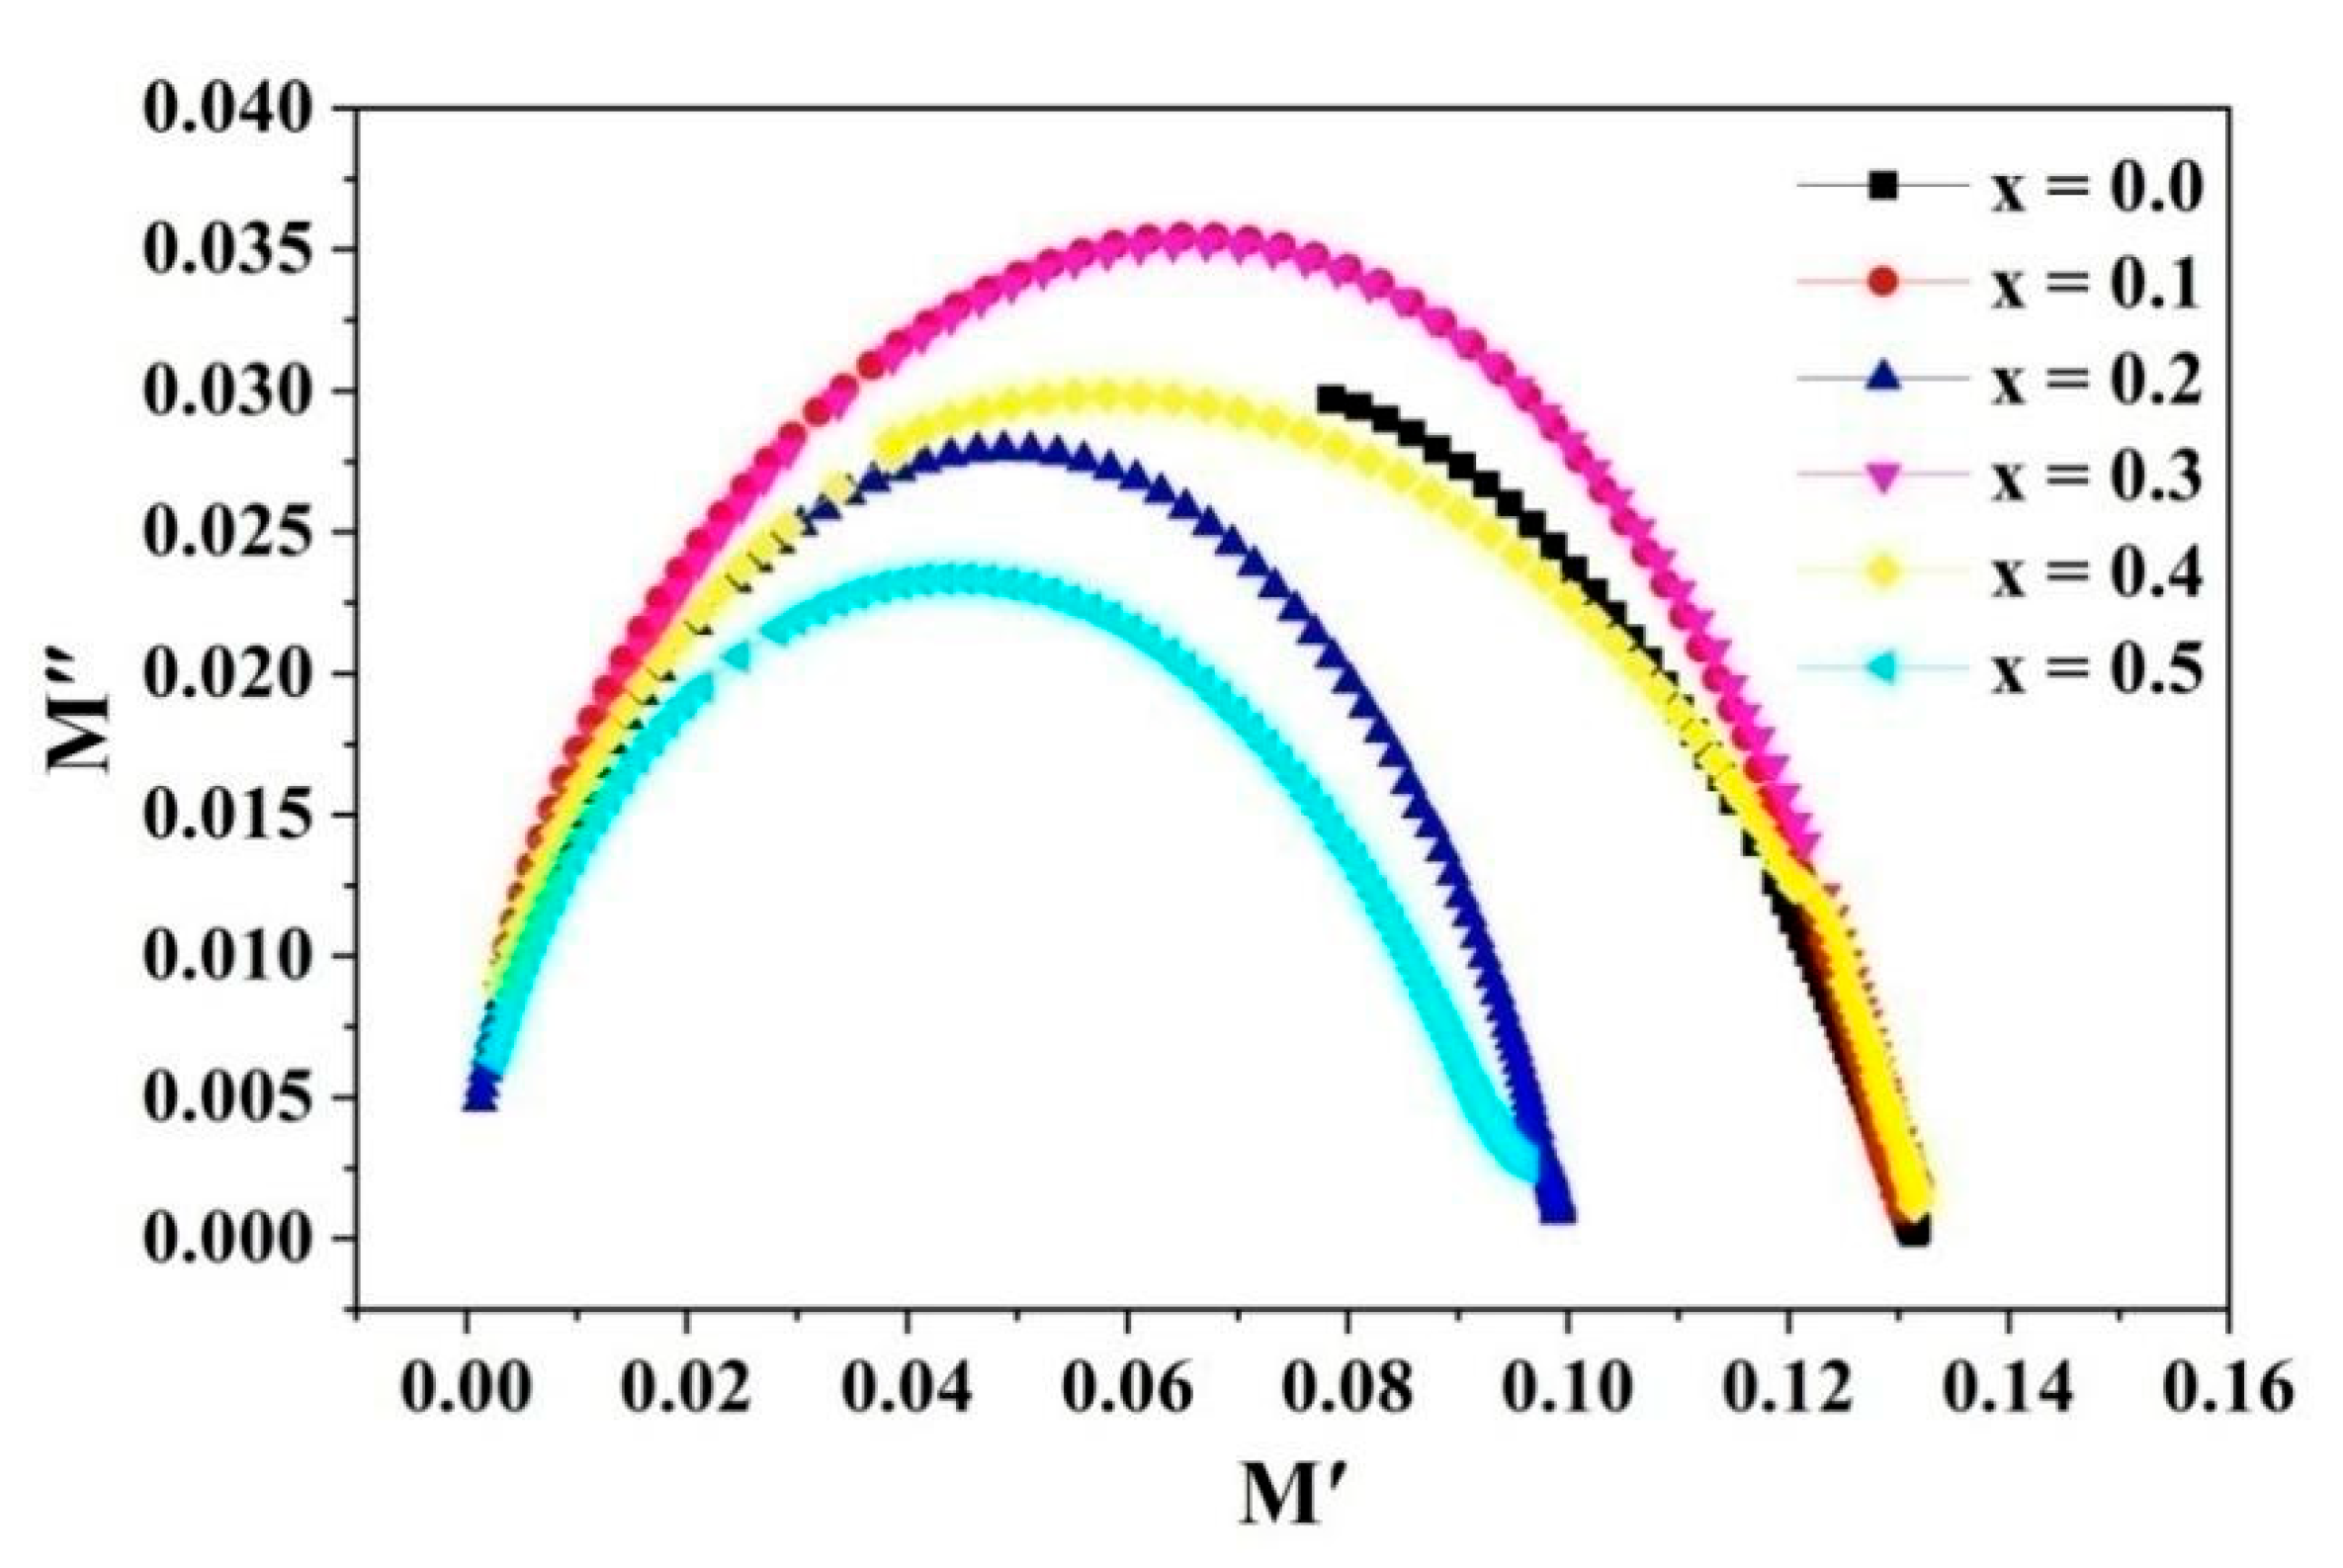
2.5. Dielectric Analysis
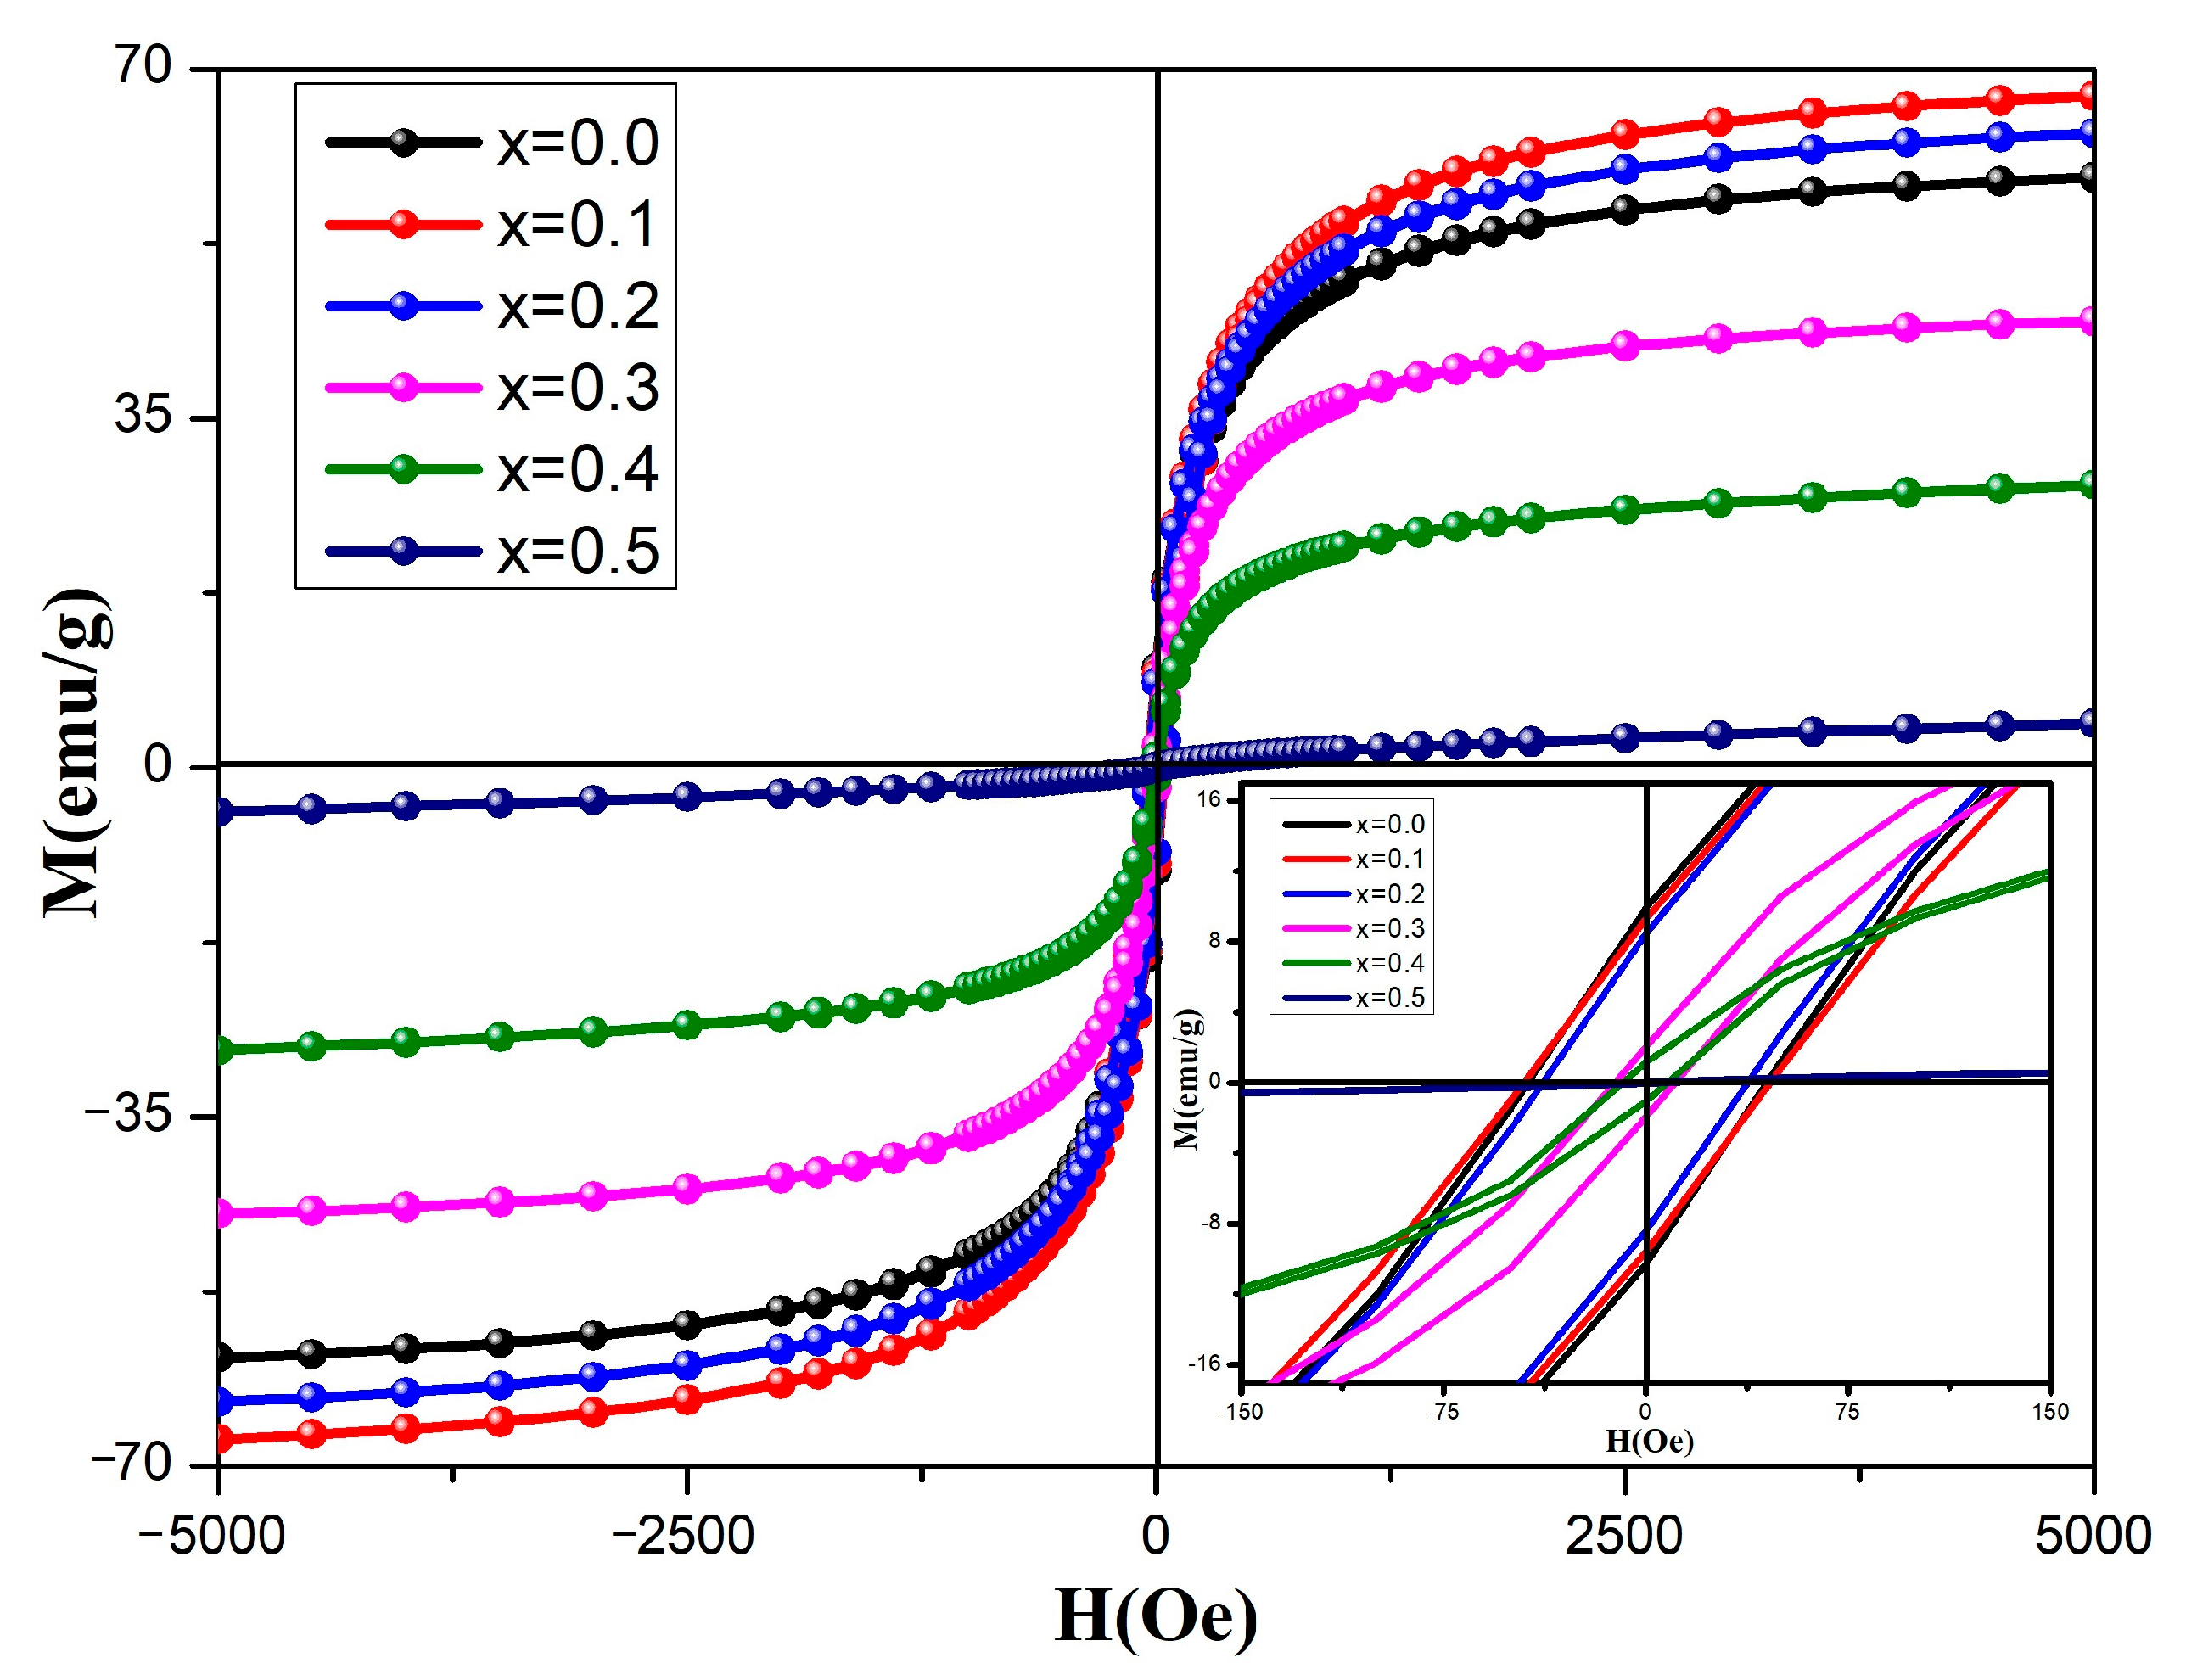
2.6. Magnetic Properties
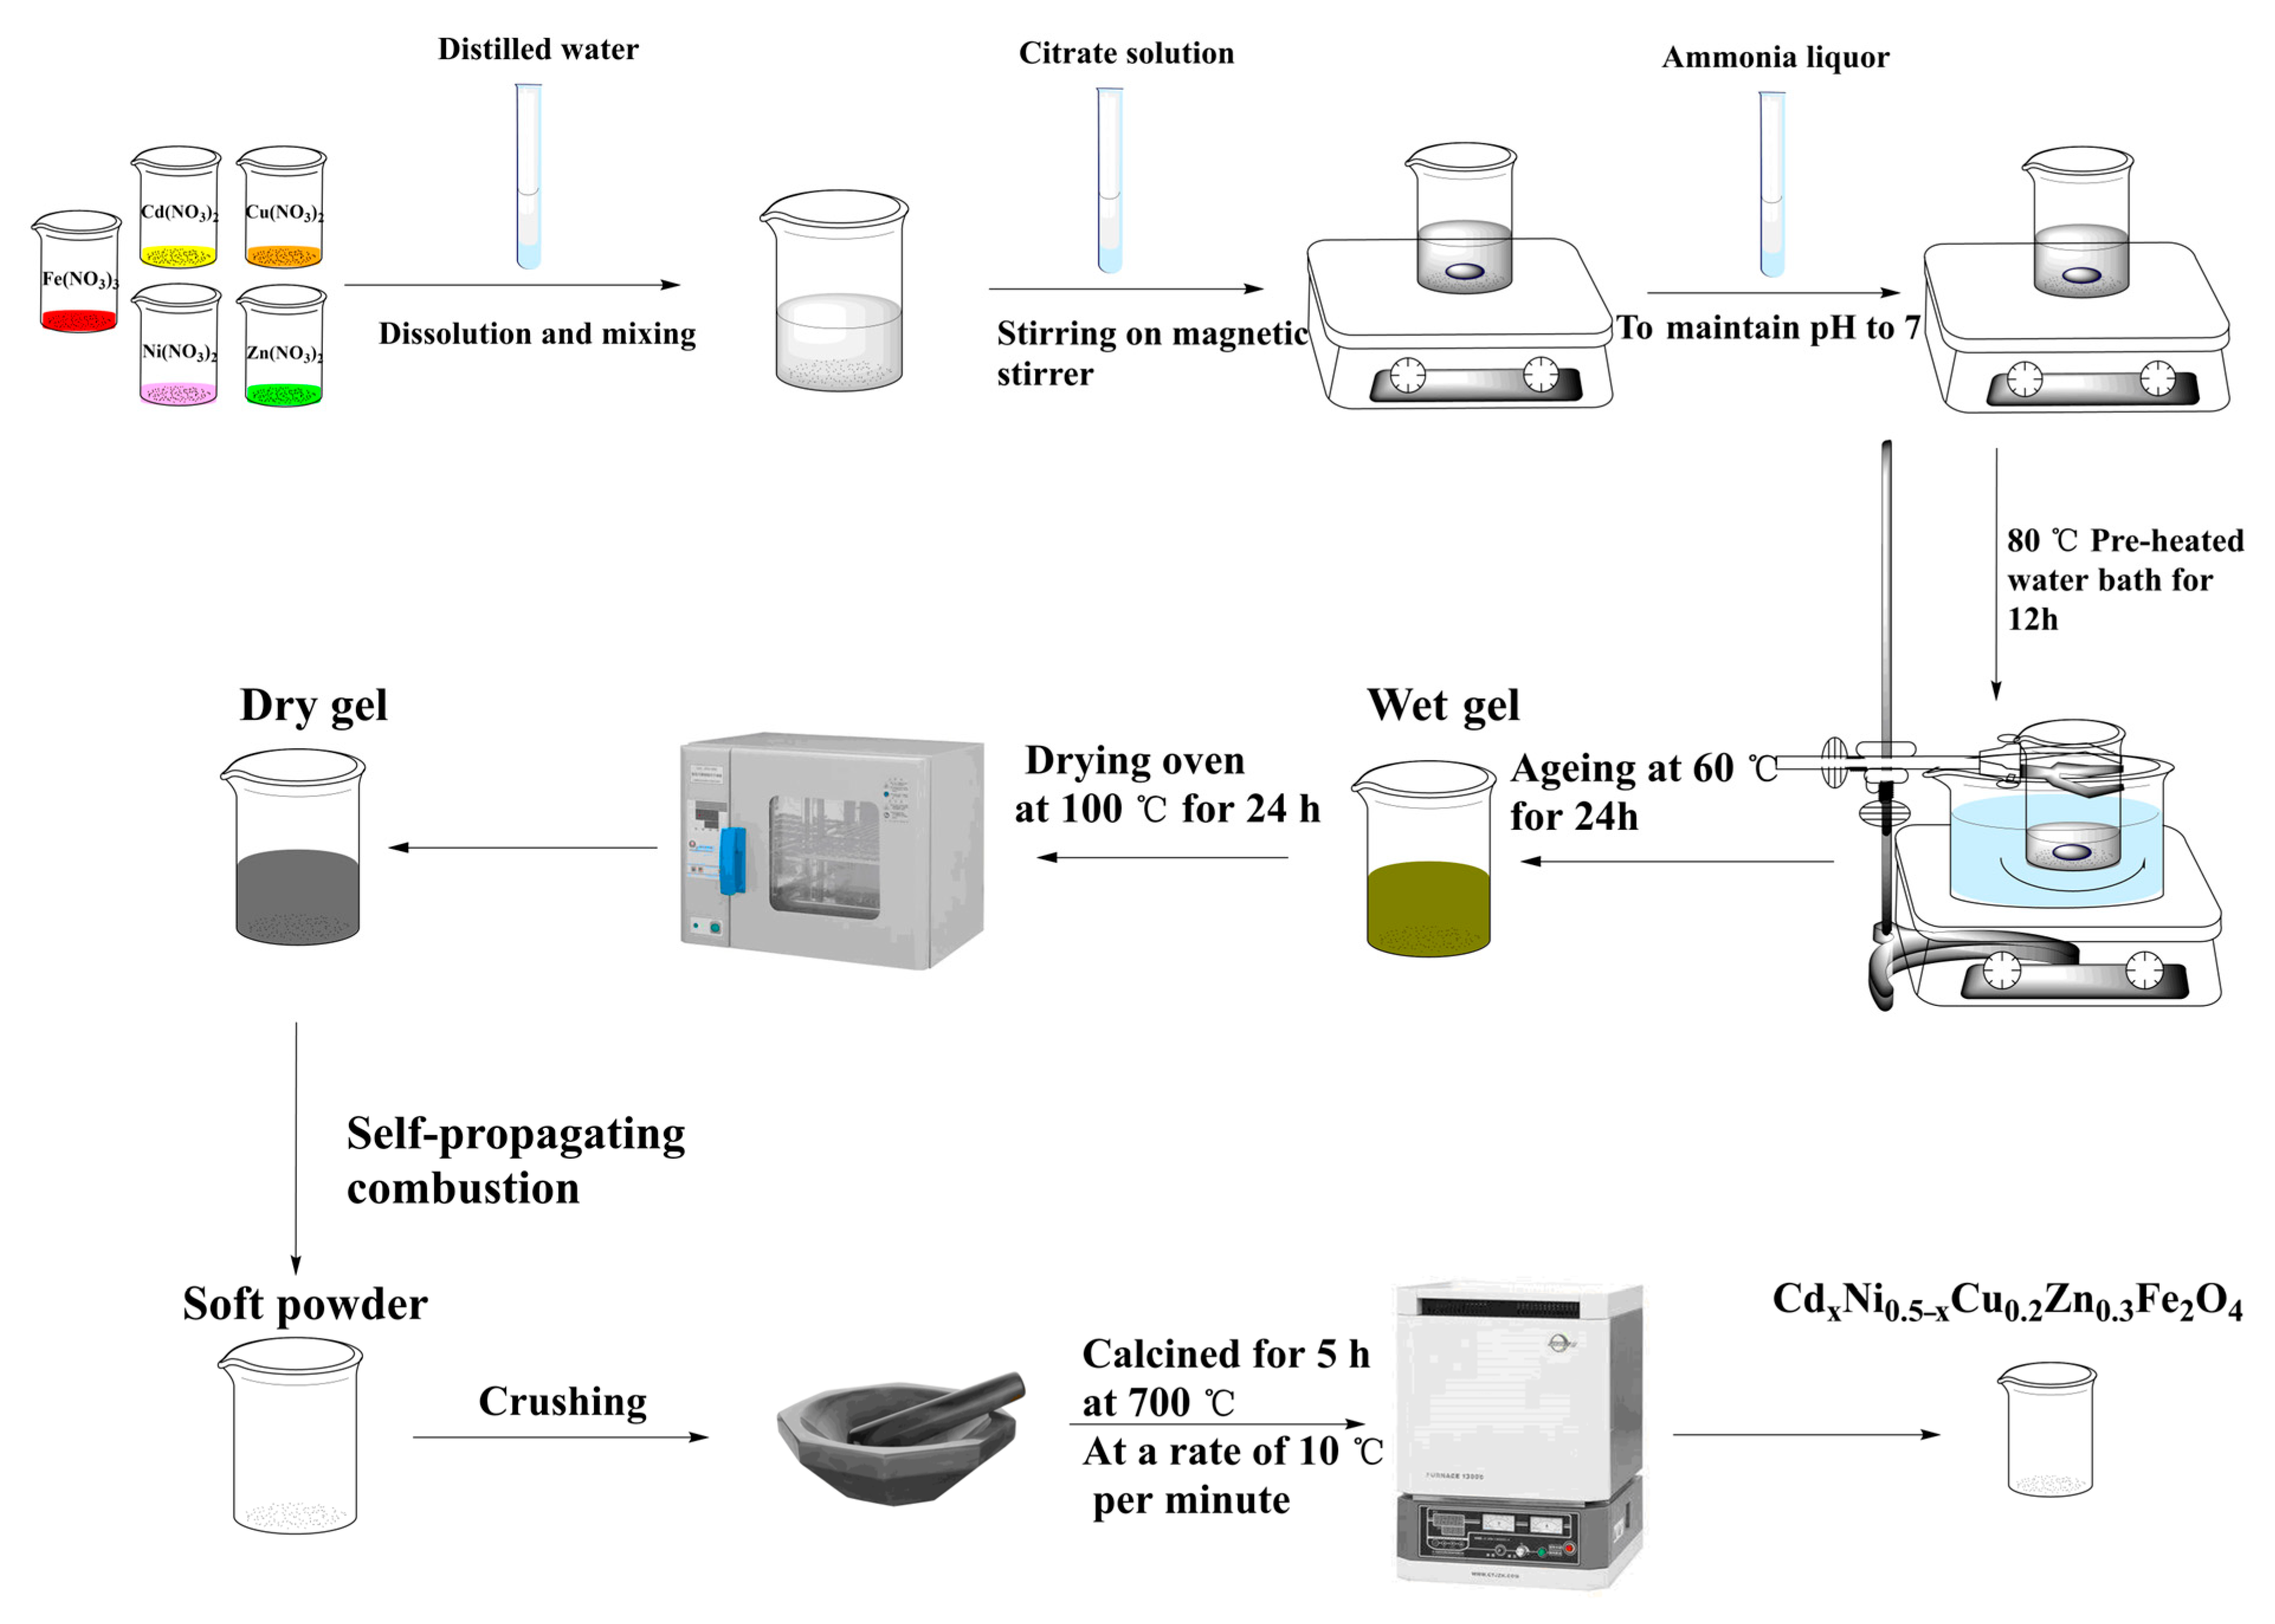
3. Experimental Section
4. Conclusions
Author Contributions
Funding
Institutional Review Board Statement
Informed Consent Statement
Data Availability Statement
Conflicts of Interest
Sample Availability
References
- Rai, R.; Verma, K.; Sharma, S.; Nair, S.S.; Valente, M.A.; Kholkin, A.L.; Sobolev, N.A. Structure and magnetic properties of Cd doped copper ferrite. J. Alloys Compd. 2011, 509, 7585–7590. [Google Scholar] [CrossRef]
- Mustafa, G.; Islam, M.; Zhang, W.; Anwar, A.W.; Jamil, Y.; Murtaza, G.; Ali, I.; Hussain, M.; Ali, A.; Ahmad, M. Influence of the divalent and trivalent ions substitution on the structural and magnetic properties of Mg0.5−xCdxCo0.5Cr0.04TbyFe1.96-yO4 ferrites prepared by sol-gel method. J. Magn. Magn. Mater. 2015, 387, 147–154. [Google Scholar] [CrossRef]
- Salma, I.; Imran, A.M.; Khalid, M.; Ali, A.; Amin, N.; Ali, N. Structural, magnetic and dielectric study of La3+ substituted Cu0.8Cd0.2Fe2O4 ferrite nanoparticles synthesized by the co-precipitation method. J. Alloys Compd. 2018, 769, 1019–1025. [Google Scholar]
- Hossen, M.M.; Hossen, M.B. Structural, electrical and magnetic properties of Ni0.5Cu0.2Cd0.3LaxFe2−xO4 nano-ferrites due to lanthanum doping in the place of trivalent iron. Phys. B Phys. Condens. Matter 2020, 585, 412116. [Google Scholar] [CrossRef]
- Zakir, R.; Iqbal, S.S.; Rehman, A.U.; Nosheen, S.; Ahmad, T.S.; Ehsan, N.; Inam, F. Spectral, electrical, and dielectric characterization of Ce-doped Co-Mg-Cd spinel nano-ferrites synthesized by the sol-gel auto combustion method. Ceram. Int. 2021, 47, 28575–28583. [Google Scholar] [CrossRef]
- Ahamad, H.S.; Rewatkar, K.G.; Meshram, N.S.; Dhoble, S.J. Synthesis and study of Co doped Ni-Cd ferro-spinels by microwave assisted sol-gel auto-combustion method. Ferroelectrics 2020, 555, 146–160. [Google Scholar] [CrossRef]
- Kaur, H.; Singh, A.; Kumar, V.; Ahlawat, D.S. Structural, thermal and magnetic investigations of cobalt ferrite doped with Zn2+ and Cd2+ synthesized by auto combustion method. J. Magn. Magn. Mater. 2019, 474, 505–511. [Google Scholar] [CrossRef]
- Nasr, M.H.; Elkholy, M.M.; EL-Deen, L.M.S.; Abouhaswa, A.S.; Turky, G.M.; El-Hamalawy, A.A. A comprehensive study on crystal structure, magnetic, and electrical properties of Ni-doped Fe-Cd spinel nano-ferrites. J. Mater. Sci. Mater. Electron. 2022, 33, 15652–15664. [Google Scholar] [CrossRef]
- Verma, V.; Dar, M.A.; Pandey, V.; Singh, A.; Annapoorni, S.; Kotnala, R.K. Magnetic properties of nano-crystalline Li0.35Cd0.3Fe2.35O4 ferrite prepared by modified citrate precursor method. Mater. Chem. Phys. 2010, 122, 133–137. [Google Scholar] [CrossRef]
- Hossen, M.M.; Nasrin, S.; Hossen, M.B. Effect of Mn2+ doping on structural, magnetic and electrical properties of Ni0.5−xMnxCu0.2Cd0.3Fe2O4 nano ferrites prepared by sol-gel auto combustion method for high-frequency applications. Phys. B Phys. Condens. Matter 2020, 599, 412456. [Google Scholar] [CrossRef]
- Kardile, H.J.; Somvanshi, S.B.; Chavan, A.R.; Pandit, A.A.; Jadhav, K.M. Effect of Cd2+ doping on structural, morphological, optical, magnetic and wettability properties of nickel ferrite thin films. Optik 2020, 207, 164462. [Google Scholar] [CrossRef]
- Iyer, R.; Desai, R.; Upadhyay, R.V. Low temperature synthesis of nanosized Mn1−xCdxFe2O4 ferrites. Indian J. Pure Appl. Phys. 2009, 47, 180–185. [Google Scholar]
- Aakash Nordblad, P.; Mukherjee, S. Structural, magnetic and hyperfine characterizations of nanocrystalline Zn-Cd doped nickel ferrites. J. Magn. Magn. Mater. 2017, 441, 710–717. [Google Scholar] [CrossRef]
- Gupta, M.; Anu Mudsainiyan, R.K.; Randhawa, B.S. Li doping induced physico-chemical modulations in Cd ferrite (CdLixFe(2−x)O4−x) synthesized using aqueous ammonia assisted coprecipitation route. Mater. Sci. Eng. B 2018, 227, 1–8. [Google Scholar] [CrossRef]
- Ali, I.O.; Mostafa, A.G. Photocatalytic reduction of chromate oxyanions on MMnFe2O4 (M=Zn, Cd) nanoparticles. Mater. Sci. Semicond. Process. 2015, 33, 189–198. [Google Scholar]
- Sheikh, F.A.; Khalid, M.; Shifa, M.S. Effects of bismuth on structural and dielectric properties of cobalt-cadmium spinel ferrites fabricated via micro-emulsion route. Chin. Phys. B 2019, 28, 088701. [Google Scholar] [CrossRef]
- Beyranvand, M.; Zahedi, A.; Gholizadeh, A. Cadmium substitution effect on microstructure and magnetic properties of Mg-Cu-Zn ferrites. Front. Mater. 2022, 8, 779837. [Google Scholar] [CrossRef]
- Peng, Y.; Xia, C.; Cui, M.; Yao, Z.; Yi, X. Effect of reaction condition on microstructure and properties of (NiCuZn)Fe2O4 nanoparticles synthesized via co-precipitation with ultrasonic irradiation. Ultrason. Sonochem. 2021, 71, 105369. [Google Scholar] [CrossRef]
- Almessiere, M.A.; Slimani, Y.; Korkmaz, A.D.; Baykal, A.; Güngüneş, H.; Sözeri, H.; Shirsath, S.E.; Güner, S.; Akhtar, S.; Manikandan, A. Impact of La3+ and Y3+ ion substitutions on structural, magnetic and microwave properties of Ni0.3Cu0.3Zn0.4Fe2O4 nanospinel ferrites synthesized via sonochemical route. RSC Adv. 2019, 9, 30671–30684. [Google Scholar] [CrossRef]
- Aphesteguy, J.C.; Jacobo, S.E.; Schegoleva, N.N.; Kurlyandskaya, G.V. Characterization of nanosized spinel ferrite powders synthesized by coprecipitation and autocombustion method. J. Alloys Compd. 2010, 495, 509–512. [Google Scholar] [CrossRef]
- Lin, Q.; Lei, C.; He, Y.; Xu, J.; Wang, R. Mössbauer and XRD Studies of N0.6Cu0.2Zn0.2CexFe2−xO4 Ferrites by Sol–Gel Auto-Combustion. J. Nanosci. Nanotechnol. 2015, 15, 2997–3003. [Google Scholar] [CrossRef]
- Kaiser, M. Magnetic and dielectric properties of low vanadium doped nickel–zinc–copper ferrites. J. Phys. Chem. Solids 2010, 71, 1451–1457. [Google Scholar] [CrossRef]
- Rao, P.V.S.; Anjaneyulu, T.; Reddy, M.R. Effect of Gd Doping on the Structural and Magnetic Properties of Ni-Cu-Zn-Fe2O4. J. Korean Phys. Soc. 2019, 75, 304–308. [Google Scholar] [CrossRef]
- Arshad, M.I.; Hasan, M.S.; Rehman, A.U.; Akhtar, M.; Tung, L.D.; Amin, N.; Mahmood, K.; Ali, A.; Trakoolwilaiwan, T.; Thanh, N.T.K. Structural, optical, electrical, dielectric, molecular vibrational and magnetic properties of La3+ doped Mg-Cd-Cu ferrites prepared by Co-precipitation technique. Ceram. Int. 2022, 48, 14246–14260. [Google Scholar] [CrossRef]
- Koga, Y.; Okada, R.; Kobayashi, S.; Yamada, H.; Watanabe, T. Substitution effects on frustrated magnetism of chromite spinel ACr2O4 (A = Zn, Cd). J. Magn. Magn. Mater. 2019, 476, 464–468. [Google Scholar] [CrossRef]
- Lin, Q.; Lei, C.; Lin, J.; He, Y.; Dong, J.; Wang, L. Effect of substitution on the structural and magnetic properties of Sm3+-doped/SmFeO3 in nickel-copper-zinc mixed ferrite nanoparticles. Ceram. Int. 2020, 46, 2523–2529. [Google Scholar] [CrossRef]
- Wendari, T.P.; Atmoko, H.M.; Stiadi, Y.; Putri, Y.E. CuFe2O4/activated carbon nanocomposite for efficient photocatalytic degradation of dye: Green synthesis approaches using the waste of oil palm empty bunches and bio-capping agent. Case Stud. Chem. Environ. Eng. 2023, 7, 100305. [Google Scholar]
- Mishra, S.; Kumar, P.; Samanta, S.K. Microwave catalytic degradation of antibiotic molecules by 2D sheets of spinel nickel ferrite. Ind. Eng. Chem. Res. 2020, 59, 15839–15847. [Google Scholar] [CrossRef]
- Mustafa, F.S.; Oladipo, A.A. Photocatalytic degradation of metronidazole and bacteria disinfection activity of Ag–doped Ni0.5Zn0.5Fe2O4. J. Water Process Eng. 2021, 42, 102132. [Google Scholar] [CrossRef]


| Parameters | Concentration (x) | |||||
|---|---|---|---|---|---|---|
| 0 | 0.10 | 0.20 | 0.30 | 0.40 | 0.50 | |
| 2θ° (311) peak | 35.4860 | 35.3720 | 35.7270 | 35.1100 | 34.9870 | 34.7880 |
| d (Å) | 0.2529 | 0.2536 | 0.2542 | 0.2554 | 0.2563 | 0.2577 |
| a = b = c | 8.3794 | 8.3987 | 8.4197 | 8.4668 | 8.4901 | 8.5397 |
| D (nm) | 55.02 | 52.52 | 62.18 | 56.83 | 53.95 | 49.52 |
| V (Å)3 | 588.3625 | 592.4331 | 596.8860 | 606.9505 | 611.9946 | 622.7746 |
| ρx (g·cm−3) | 5.3594 | 5.4420 | 5.5219 | 5.5479 | 5.6188 | 5.6362 |
| ε | 6.27 × 10⁻⁴ | 3.72 × 10⁻⁴ | 1.18 × 10⁻³ | 2.22 × 10⁻³ | 1.46 × 10⁻³ | 1.84 × 10⁻³ |
| x | R-Factors | GoF | Lattice Parameters | ||||
|---|---|---|---|---|---|---|---|
| Rp | Rwp | Rexp | χ2 | arv (Å) | V (Å)3 | Fract (%) | |
| 0.0 | 0.66 | 0.82 | 0.74 | 1.28 | 8.378 | 588.030 | 100 |
| 0.1 | 0.67 | 0.87 | 0.74 | 1.40 | 8.394 | 591.417 | 97.93 |
| 0.2 | 0.73 | 0.92 | 0.76 | 1.47 | 8.420 | 596.876 | 96.28 |
| 0.3 | 0.81 | 1.04 | 0.80 | 1.68 | 8.462 | 605.924 | 96.33 |
| 0.4 | 0.79 | 1.07 | 0.81 | 1.75 | 8.485 | 610.950 | 91.67 |
| 0.5 | 0.89 | 1.14 | 0.87 | 1.72 | 8.532 | 621.066 | 91.98 |
| x | LA | LB | A-O | B-O | rA | rB |
|---|---|---|---|---|---|---|
| 0.0 | 3.628 | 2.962 | 1.9299 | 2.0297 | 0.6099 | 0.7097 |
| 0.1 | 3.635 | 2.968 | 1.9336 | 2.0335 | 0.6136 | 0.7135 |
| 0.2 | 3.646 | 2.977 | 1.9396 | 2.0398 | 0.6196 | 0.7198 |
| 0.3 | 3.664 | 2.992 | 1.9493 | 2.0500 | 0.6293 | 0.7300 |
| 0.4 | 3.674 | 3.000 | 1.9545 | 2.0555 | 0.6345 | 0.7355 |
| 0.5 | 3.694 | 3.016 | 1.9654 | 2.0670 | 0.6454 | 0.7470 |
| Cd2+ | υ1 | KT | υ2 | KO |
|---|---|---|---|---|
| Content, x | (cm−1) | (dyne/cm) × 105 | (cm−1) | (dyne/cm) × 105 |
| 0.0 | 580.50 | 3.1880 | 467.76 | 1.8164 |
| 0.1 | 580.50 | 3.1964 | 467.76 | 1.8212 |
| 0.2 | 580.50 | 3.2045 | 467.76 | 1.8258 |
| 0.3 | 580.50 | 3.2123 | 467.76 | 1.8303 |
| 0.4 | 566.41 | 3.1416 | 467.76 | 1.8346 |
| 0.5 | 556.23 | 3.0921 | 467.76 | 1.8387 |
| Cd2+ Content, x | Ms (emu/gm) | Mr (emu/gm) | Mr/Ms | Coercivity (Oe) | μB (Bohr Magneton) | K1 = MsHc/ 2 × sH4 (erg/cm3) |
|---|---|---|---|---|---|---|
| 0.0 | 59.1433 | 9.8904 | 0.1672 | 45.1505 | 2.5136 | 0.1335 |
| 0.1 | 67.2958 | 9.4579 | 0.1405 | 46.1747 | 2.9248 | 0.1554 |
| 0.2 | 63.5720 | 8.4354 | 0.1327 | 38.3361 | 2.8241 | 0.1219 |
| 0.3 | 47.7300 | 1.9719 | 0.0413 | 10.8696 | 2.1662 | 0.0259 |
| 0.4 | 28.3063 | 1.0590 | 0.0374 | 7.3370 | 1.3119 | 0.0104 |
| 0.5 | 4.4228 | 0.0530 | 0.0120 | 9.5443 | 0.2092 | 021 |
Disclaimer/Publisher’s Note: The statements, opinions and data contained in all publications are solely those of the individual author(s) and contributor(s) and not of MDPI and/or the editor(s). MDPI and/or the editor(s) disclaim responsibility for any injury to people or property resulting from any ideas, methods, instructions or products referred to in the content. |
© 2023 by the authors. Licensee MDPI, Basel, Switzerland. This article is an open access article distributed under the terms and conditions of the Creative Commons Attribution (CC BY) license (https://creativecommons.org/licenses/by/4.0/).
Share and Cite
Yang, H.; Yang, X.; Lin, J.; Yang, F.; He, Y.; Lin, Q. Effect of Cd2+ Substitution on Structural–Magnetic and Dielectric Properties of Ni–Cu–Zn Spinel Ferrite Nanomaterials by Sol–Gel. Molecules 2023, 28, 6110. https://doi.org/10.3390/molecules28166110
Yang H, Yang X, Lin J, Yang F, He Y, Lin Q. Effect of Cd2+ Substitution on Structural–Magnetic and Dielectric Properties of Ni–Cu–Zn Spinel Ferrite Nanomaterials by Sol–Gel. Molecules. 2023; 28(16):6110. https://doi.org/10.3390/molecules28166110
Chicago/Turabian StyleYang, Hu, Xingxing Yang, Jinpei Lin, Fang Yang, Yun He, and Qing Lin. 2023. "Effect of Cd2+ Substitution on Structural–Magnetic and Dielectric Properties of Ni–Cu–Zn Spinel Ferrite Nanomaterials by Sol–Gel" Molecules 28, no. 16: 6110. https://doi.org/10.3390/molecules28166110
APA StyleYang, H., Yang, X., Lin, J., Yang, F., He, Y., & Lin, Q. (2023). Effect of Cd2+ Substitution on Structural–Magnetic and Dielectric Properties of Ni–Cu–Zn Spinel Ferrite Nanomaterials by Sol–Gel. Molecules, 28(16), 6110. https://doi.org/10.3390/molecules28166110