Abstract
We report the DNA-binding properties of three porphyrins with peripheral thienyl substituents (TThPor, PdTThPor and PtTThPor). The binding capacity of each porphyrin with DNA was determined by UV-Vis and steady-state fluorescence emission spectroscopy combined with molecular docking calculations. The results suggest that the interaction of these compounds probably occurs via secondary interactions via external grooves (minor grooves) around the DNA macromolecule. Moreover, porphyrins containing peripheral Pd(II) or Pt(II) complexes (PdTThPor and PtTThPor) were able to promote photo-damage in the DNA.
1. Introduction
Porphyrins belong to a large family of tetrapyrrole macrocycles. These heterocycles are present in nature and play a key role in the metabolism of organisms and plants. Generally, they can be found in metalloenzymes and used as inorganic dyes, photosensitizers and catalysts for chemical and biological purposes [1,2,3,4,5]. Based on the chemical and physical properties of porphyrins, these compounds are often studied as photosensitizers in photodynamic therapy (PDT) and photodynamic inactivation (PDI) treatments [6,7]. PDT is a non-invasive targeted approach that incorporates a photosensitizer (PS), which can bio-accumulate in malignant tumor cells. Thus, the combination of PS, light sources and molecular oxygen can induce microorganism inactivation and tumor cell destruction. In PDT or PDI treatments, for example, photosensitizers generate singlet oxygen (1O2) by energy transfer (Type II) or radical species (such as •OH and O2•−) by electron transfer (Type I) using appropriate light dosage [8,9].
Notably, tetra(thienyl)porphyrin derivatives (TThPor) and their metallo-complexes are a relatively underexplored class of aryl-substituted porphyrins that deserve investigation due to their photophysical, photochemical and chemical properties [10]. Different from tetra(phenyl)porphyrin derivatives (TPPs), the TThPor compounds differ not only by the molecular formula but also by how the aryl rings are conjugated with the porphyrin core structure, with the thienyl moieties almost in a coplanar conformation in relation to the core structure. This very particular structural property may also result in different biological interactions [10]. Therefore, the use of square-planar complexes of Pd(II) and Pt(II) on the periphery of porphyrins is suitable due to their favorable stereochemistry and possible lability of ligands during the interaction.
Palladium(II) and platinum(II) complexes can interact with DNA through supramolecular properties or even through the formation of covalent bonds in nucleobases, thus hindering replication of the resulting DNA. This biomacromolecule exists in many possible conformations, including the most common forms such as the A-DNA, B-DNA and Z-DNA polymorphs, with the B-DNA and Z-DNA forms being the most commonly observed in most organisms. In general, oxidative damage to DNA leads to mutations. Although guanine is present with cytosine, dihydroguanine (8-oxoG), which is the most frequent type of oxidative damage to this nucleobase, can cause improper pairing with adenine through a conformational change, which is a route for mutations [11,12]. In recent years, several studies have reported DNA interactions with this type of complex [13,14,15,16,17,18]. Concerning inducing cancer cell death, developing compounds that target and damage DNA transcription and replication may represent an effective antitumor strategy.
Based on the photophysical properties and biological importance of thienyl-porphyrins and considering the window of opportunities for biological studies with these compounds, in this study we report preliminary studies on the interaction of tetrathienyl porphyrins with peripheral Pd(II) or Pt(II) complexes (PdTThPor and PtTThPor, Figure 1) and biomolecules. The interaction of the porphyrins with DNA was evaluated by multiple spectroscopic techniques (UV-Vis, circular dichroism and steady-state fluorescence) and viscosity analysis, combined with molecular docking calculations. Additionally, DNA breakage damage by capillary electrophoresis technique and photo-oxidation studies by UV-Vis analysis were also performed.
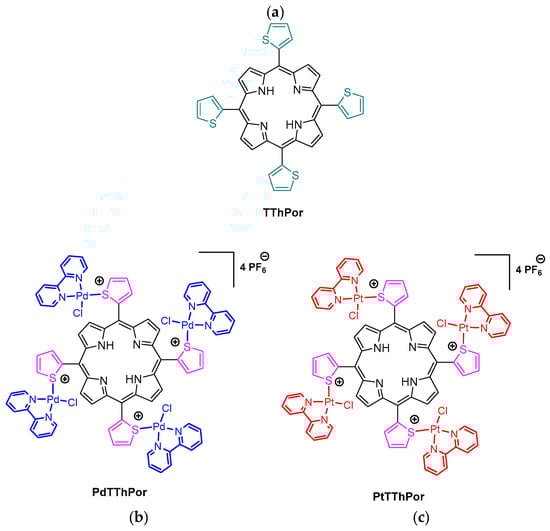
Figure 1.
Representative structures of tetra(2-thienyl)porphyrins (a) free-base TThPor, (b) palladium(II) PdTThPor and (c) platinum(II) PtTThPor complexes.
2. Results
2.1. Thienyl-Porphyrins
The free-base meso-tetra(2-thienyl)porphyrin TThPor was previously synthesized and fully characterized as described in the literature [10]. The meso-tetra(2-thienyl)porphyrin with Pd(II) and Pt(II) peripheral complexes PdTThPor and PtTThPor were also prepared and fully characterized as described by Tisoco and co-workers [19].
2.2. DNA-Binding Assays
2.2.1. Binding Properties of DNA by UV-Vis Analysis
Aiming at evaluating the interaction between calf-thymus (CT-DNA) and the porphyrins TThPor, PdTThPor or PtTThPor, absorption analyses were carried out. The UV-Vis spectra for the thienyl porphyrins in the absence and presence of successive additions of CT-DNA concentrations are shown in Figure 2, and the DNA-binding properties are listed in Table 1. All UV-Vis spectra of porphyrin TThPor are presented in the Supplementary Information section (Figure S1).
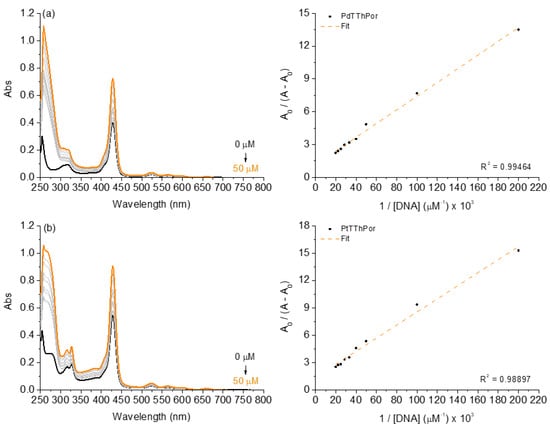
Figure 2.
UV-Vis spectra of the (a) PdTThPor and (b) PtTThPor upon successive additions of CT-DNA concentrations (0 to 50 µM) in a DMSO(5%)/Tris-HCl pH 7.4 mixture buffered solution. Graph plots of A0/(A − A0) versus 1/[CT-DNA].
Observing the absorption analyses, the successive additions of DNA to Pd(II) and Pt(II) compound solutions caused hyperchromic effects at the Soret and Q bands without a red or blue shift, indicating that the porphyrins can interact with DNA, probably via secondary interactions by external grooves around the DNA macromolecule. As derivatives containing peripheral complexes of Pd(II) and Pt(II) are positively charged (cationic), they have potential cationic-anionic electrostatic binding properties with DNA phosphate units, thus demonstrating a great interaction with nucleic acids, which is in agreement with several previous studies that reported the activity of positively charged tetrapyrrolic macrocycles [20,21,22,23].
In this way, the binding constant (Kb) values were determined and are in the order of 104 M−1 (Table 1), indicating that both porphyrins interact with CT-DNA and that the presence of peripheral complexes can interfere with the binding affinity of the DNA structure. Thermodynamic analysis via Gibbs free energy by ΔG° values (Table 1) indicated that all compounds interact spontaneously with DNA, thus reinforcing the results observed by Kb values. In the next section, the possibilities of interaction between these tetrathienyl porphyrins in terms of intercalation or via grooves are also investigated by steady-state fluorescence emission techniques.
2.2.2. Competitive Binding Assays with DNA by Steady-State Fluorescence Emission
The steady-state fluorescence emission analysis involving the competition assays for the binding between porphyrins and DNA:dye adducts was performed using porphyrin PtTThPor (Figure 3). The fluorescence Stern-Volmer (KSV), bimolecular quenching rate (kq), binding (Kb) and ΔG° parameters for DNA:dye:porphyrin are listed in Table 1. All fluorescence emission spectra of porphyrins TThPor and PdTThPor with DNA:dye adducts are presented in the Supplementary Information section (Figures S2–S9).
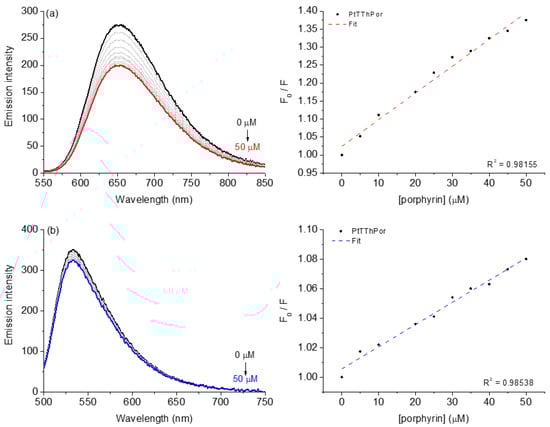
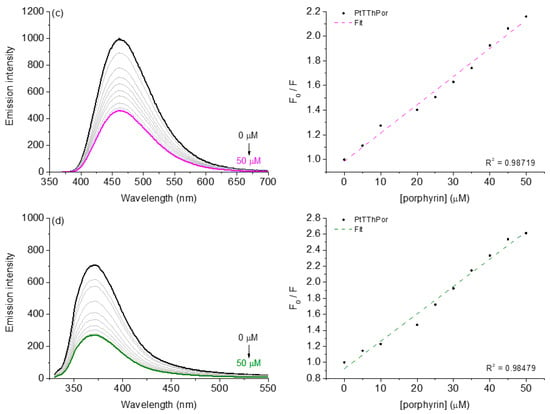
Figure 3.
Steady-state fluorescence emission spectra for (a) EB:DNA, (b) AO:DNA, (c) DAPI:DNA and (d) MG:DNA without and in the presence of porphyrin PtTThPor in a DMSO(5%)/Tris-HCl pH 7.4 mixture buffered solution. Graph plots show the F0/F versus [porphyrin derivative].
As an example, the fluorescence emission spectra for ethidium bromide (EB) bound to DNA (fluorescence emission at 652 nm when excited at 510 nm) in the absence and presence of Pt(II) porphyrin PtTThPor are depicted in Figure 3a. When the porphyrin derivatives were added to DNA pre-treated with EB dye (general intercalator dye), the PtTThPor induced a decrease in the fluorescence intensity of the EB:DNA adduct, indicating a displacement of EB from DNA, which can be assigned as a viable competition between ethidium bromide dye and porphyrin for DNA strands. Additionally, the same behavior was observed for the other studied derivatives.
For acridine orange (AO) competition assays, the steady-state fluorescence emission spectra for AO bound to DNA (fluorescence emission at 534 nm when excited at 480 nm) in the absence and presence of porphyrin PtTThPor are depicted in Figure 3b. In this case, when porphyrins were added to DNA pre-treated with AO dye, the PtTThPor induced a slight decrease in the fluorescence intensity of the AO:DNA adduct, indicating a little displacement of AO from DNA, and the corresponding KSV, kq and Kb constant values in the presence of the studied porphyrins. These values are listed in Table 1.
To evaluate whether the possible interaction of thienyl porphyrins occurs via the groove site, the minor and major grooves’ dyes: 4′,6-diamidino-2-phenylindole (DAPI) and methyl green (MG), respectively, were used for the steady-state fluorescence emission quenching assays (Figure 3c,d). In independent experiments, it was possible to observe a significant fluorescence quenching of DAPI:DNA and MG:DNA upon successive additions of porphyrins. Comparing both KSV and Kb values for competitive binding assays into intercalator dyes EB:DNA and AO:DNA adducts, it can be inferred that there is a significant variation in the fluorescence quenching constants, mainly in the presence of the studied porphyrins (Table 1). Overall, the KSV and Kb data variation (~104 M−1) can be attributed to a preference for porphyrin interaction by the external grooves and not only by an intercalation phenomenon, agreeing with the CD, viscosity and molecular docking calculations as described in the next sections as well as in the literature [24,25].
Moreover, the kq~1012 M−1s−1 values for the porphyrins in DAPI and MG solutions are higher than the diffusion rate constant according to literature [26], thus indicating a ground-state interaction between porphyrins and DNA nuleobases, probably by a static mechanism).

Table 1.
DNA-binding properties of porphyrins TThPor, PdTThPor and PtTThPor by UV-Vis and steady-state fluorescence emission analysis.
Table 1.
DNA-binding properties of porphyrins TThPor, PdTThPor and PtTThPor by UV-Vis and steady-state fluorescence emission analysis.
| UV-Vis Analysis | |||||
| Porphyrin | H (%) a | Δλ (nm) b | Kb (×104; M−1) c | ΔG° (kcal mol −1) d | |
| TThPor | 63.0 | 0.0 | 0.92 ± 0.09 | −5.40 | |
| PdTThPor | 44.5 | 0.0 | 1.59 ± 0.13 | −5.75 | |
| PtTThPor | 40.0 | 0.0 | 1.39 ± 0.21 | −5.65 | |
| Steady-State Fluorescence Emission Analysis | |||||
| EB:DNA | |||||
| Q (%) e | KSV (×103; M−1) f | kq (×1011; M−1s−1) g | Kb (×103; M−1) h | ΔG° (kcal mol−1) d | |
| TThPor | 20.0 | 4.86 ± 0.04 | 2.11 ± 0.08 | 7.44 ± 0.47 | −5.30 |
| PdTThPor | 27.0 | 6.14 ± 0.08 | 2.67 ± 0.15 | 14.3 ± 0.23 | −5.65 |
| PtTThPor | 28.0 | 7.43 ± 0.01 | 3.23 ± 0.02 | 11.1 ± 0.18 | −5.50 |
| AO:DNA | |||||
| Q (%) e | KSV (×103; M−1) f | kq (×1012; M−1s−1) i | Kb (×103; M−1) h | ΔG° (kcal mol−1) d | |
| TThPor | 23.0 | 5.27 ± 0.01 | 3.10 ± 0.02 | 5.35 ± 0.55 | −5.10 |
| PdTThPor | 8.0 | 1.72 ± 0.01 | 1.01 ± 0.02 | 2.01 ± 0.83 | −4.50 |
| PtTThPor | 7.5 | 1.50 ± 0.02 | 0.88 ± 0.04 | 1.63 ± 0.79 | −4.40 |
| DAPI:DNA | |||||
| Q (%) e | KSV (×104; M−1) f | kq (×1012; M−1s−1) j | Kb (×104; M−1) h | ΔG° (kcal mol−1) d | |
| TThPor | 54.0 | 2.31 ± 0.05 | 10.5 ± 0.10 | 1.42 ± 0.13 | −5.65 |
| PdTThPor | 36.0 | 8.98 ± 0.02 | 40.8 ± 0.04 | 0.96 ± 0.37 | −5.45 |
| PtTThPor | 54.0 | 2.29 ± 0.03 | 10.4 ± 0.06 | 2.36 ± 0.14 | −5.95 |
| MG:DNA | |||||
| Q (%) e | KSV (×104; M−1) f | kq (×1012; M−1s−1) k | Kb (×104; M−1) h | ΔG° (kcal mol−1) d | |
| TThPor | 38.5 | 1.25 ± 0.02 | 4.46 ± 0.04 | 3.58 ± 0.28 | −6.20 |
| PdTThPor | 63.0 | 3.50 ± 0.02 | 12.5 ± 0.04 | 3.74 ± 0.03 | −6.25 |
| PtTThPor | 62.0 | 3.42 ± 0.04 | 12.2 ± 0.08 | 2.77 ± 0.17 | −6.05 |
a H(%) = (A0 − A)/A × 100%; b Red-shift; c Binding constant by Benesi-Hidelbrandt equation; d Determined by Gibbs free-energy equation; e Q(%) = (F0 − F)/F × 100%; f Determined by Stern-Volmer quenching constant; g Determined by the KSV/τ0 ratio, where τ0 = 23 ns (EB:DNA) [27]; h Determined by the modified Stern-Volmer equation; i Determined by the KSV/τ0 ratio, where τ0 = 1.70 ns (AO:DNA) [28]; j Determined by the KSV/τ0 ratio, where τ0 = 2.20 ns (DAPI:DNA) [29]; k Determined by the KSV/τ0 ratio, where τ0 = 2.80 ns (MG:DNA) [30].
2.2.3. Viscosity Measurements with DNA and Porphyrins
It is known that viscosity assays are sensitive to changes in DNA structure. As a complementary technique, viscosity analysis can be considered an efficient method to determine the possible intercalation or non-intercalation of compounds into DNA nucleobases [31]. The results of viscosity measurements of all porphyrins, TThPor, PdTThPor and PtTThPor are shown in Figure 4. The DNA viscosity remains almost unchanged upon the addition of porphyrin derivatives, with an increase in the ratio [porphyrin]/[CT-DNA]. These results indicate that tetra-thienyl porphyrins are not performing intercalation between the DNA bases, and they corroborate the steady-state fluorescence measurements in the presence of EB, DAPI, AO or MG (which probably bind to minor/major grooves). Despite the relative planarity of thienyl porphyrin derivatives, this is an expected result since these derivatives still have a steric volume that is not favorable to promoting an efficient intercalation phenomenon.
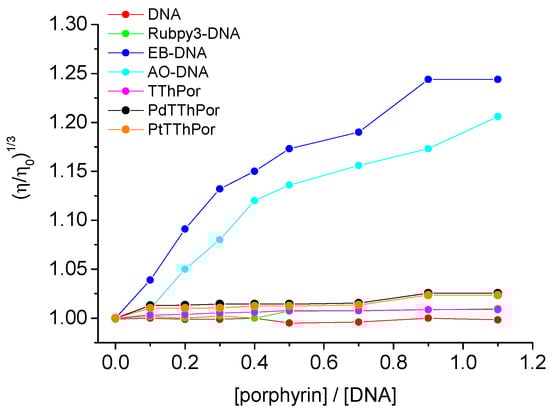
Figure 4.
Viscosity assays in solution in a DMSO(5%)/Tris-HCl pH 7.4 mixture buffered solution with [porphyrin]/[DNA] ratios.
2.2.4. Circular Dichroism (CD) Analysis with DNA
The CD spectra illustrated in Figure 5 reveal that the tetra-cationic Pd(II) and Pt(II) porphyrins PdTThPor and PtTThPor interact with DNA since their addition causes a hypochromic effect in the bands present at 219, 246 and 275 nm, thus indicating an alteration in the DNA strands. In the CD spectra, the helicity characteristic of right-handed B-form DNA is represented by a negative band at 246 nm, while base stacking is identified by the positive band at 275 nm (Figure 5a,b). The CD spectra of free-base porphyrin TThPor are listed in the Supplementary Information section (Figure S10).
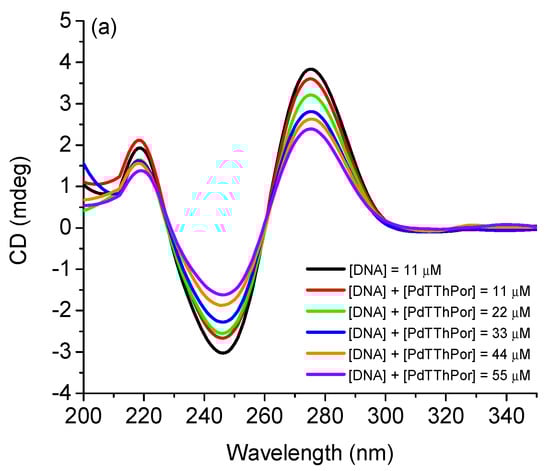
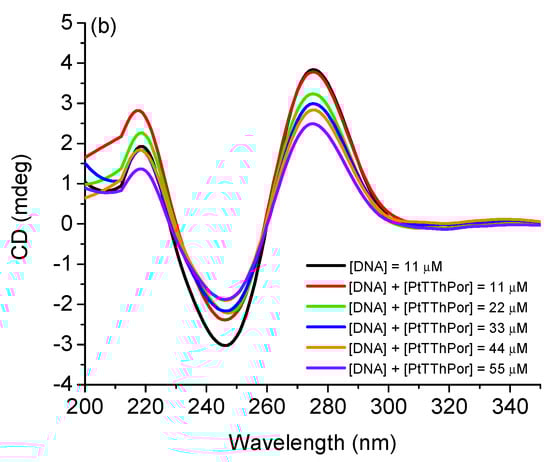
Figure 5.
CD spectra for DNA solution in Tris-HCl buffer (pH = 7.4, 1% DMSO) before and after successive additions of porphyrins (a) PdTThPor and (b) PtTThPor.
The first transition occurs in the band referring to amides, that is, the peptide bonds of DNA, while the transitions at 246 and 275 nm are attributed to aromatic amino acids [32,33]. Therefore, these last two bands strongly indicate an interaction of the DNA base pairs and porphyrins, since the addition of compounds directly affects the DNA structure, especially in the aromatic regions, altering the molar absorptivity at these wavelengths of circularly polarized light due to the drastic conformational changes in the overall structure [34,35]. This same behavior has already been observed for similar porphyrin derivatives containing peripheral platinum(II) complexes [36].
2.2.5. Molecular Docking Analysis with DNA
Molecular docking is a useful approach to offering a molecular-level explanation of the binding capacity of small compounds to DNA [25]. Thus, in silico calculations via molecular docking were carried out to suggest the main intermolecular forces responsible for the binding process between the tetra-thienyl porphyrins and the DNA double-strand, as well as the corresponding binding site, i.e., minor or major groove and the key nucleobases. The docking score value (dimensionless) for DNA:porphyrins inside the most possible binding sites is shown in Table 2.
Table 2.
Molecular docking score values (dimensionless) for the interaction between DNA and the porphyrins under study at the corresponding binding site.
In the interaction between DNA and studied porphyrins, the highest docking score value was obtained for the minor groove, e.g., docking scores for DNA:TThPor of 69.0 and 44.5 in the minor and major grooves, respectively, suggesting that the porphyrins bind preferentially in the minor groove of DNA [37], agreeing with the experimental data reported above (dye displacement studies). Data from literature also indicated the minor groove of DNA strands as the main region for other porphyrins, including Ni(II)-[tetra-N-methyl-pyridyl]porphyrin [38], Mn(III)-bis-aqua-meso-tetrakis(4-N-methylpyridiniumyl)porphyrin [39], free-base and Zn(II)-meso-tetra(ruthenated)porphyrins [23].
The best docking pose for the interaction between DNA:porphyrins in a minor groove is depicted in Figure 6. Molecular docking results suggested that the peripheral groups connected in the meso position of the porphyrin structure are interacting with the nucleobases, and the porphyrin core is more accessible to the aqueous medium than buried inside the DNA strands. Van der Waals interactions are the main forces responsible for the interaction between DNA and porphyrins, relating mainly with adenine and thymine nucleobases in the minor groove (see Supplementary Information section—Table S1). Finally, in silico calculations did not detect the possibility of intercalation between the porphyrins and DNA strands, corroborating the experimental viscometry data (see Section 2.2.3).
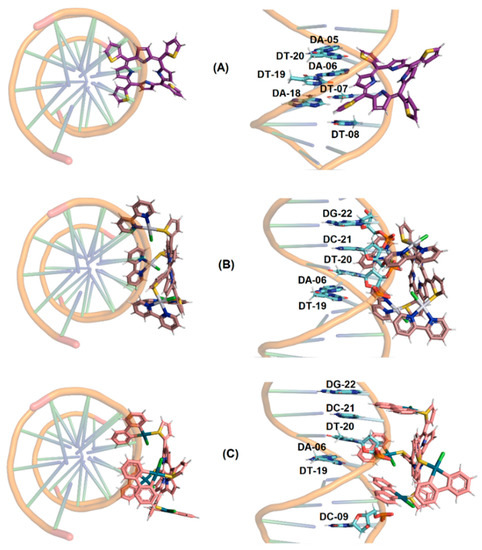
Figure 6.
Best docking pose (top and front of representation) of the interaction (A) DNA:TThPor, (B) DNA:PtTThPor and (C) DNA:PdTThPor in the minor groove. Selected nitrogenated bases, TThPor, PtTThPor and PdTThPor are in stick representation in cyan, purple, brown and beige, respectively. Elements’ color: hydrogen: white; oxygen: red; nitrogen: dark blue; sulfur: yellow; chloro: green, Pt(II): silver; and Pd(II): dark green.
2.3. DNA Photo-Oxidation and Damage
2.3.1. DNA Photo-Oxidation by Absorption Analysis
Aiming at evaluating the photo-oxidation processes between DNA and the studied porphyrins TThPor, PdTThPor and PtTThPor, UV-Vis absorption analyses were carried out in the presence of white-light irradiation conditions (irradiance of 50 mW cm−2 and a total light dosage of 90 J cm−2) at 298.15 K. All UV-Vis spectra of compounds are presented in the Supplementary Information section (Figures S11–S13).
As previously reported by Tisoco and co-workers, tetra-thienyl porphyrins containing Pd(II) and Pt(II) polypyridyl complexes generate reactive oxygen species (ROS) under light irradiation and can cause photo-damage to biomolecules such as serum albumins (in this case, HSA) [19]. The DNA photo-oxidation parameters in the absence and presence of selected porphyrins at fixed concentrations are shown in Table 3. It is possible to notice that the derivatives containing the peripheral complexes of Pd(II) and Pt(II) provide a decay of the DNA absorbance peak at 260 nm as the solution is irradiated with a white LED source. This fact agrees with the possibility of these derivatives to photo-oxidize biomolecules, and this is proven in the next tests of DNA damage by electrophoresis technique (see next section).
Table 3.
Photo-oxidation rate (kpo) constants and half-life times in white-light LED conditions (irradiance of 50 mW cm−2 and a total light dosage of 90 J cm−2) for 30 min, using TThPor, PdTThPor and PtTThPor, in the presence of DNA, by absorption analysis at 298.15 K.
2.3.2. DNA Oxidative Damage by Electrophoresis
Analyzing the gels, it is possible to observe the formation of DNA lesions when exposing the free-base TThPor to white-light conditions (see Supplementary Information section—Figure S14), mainly at 10 µM. These results, however, do not differ significantly from the control (p > 0.05). In dark conditions, there is no induction of damage by the tetra-thienyl porphyrin.
On the other hand, PdTThPor porphyrin caused significant DNA damage proportional to the increase in its concentration when exposed to white light conditions, and the genotoxicity of the Pd(II) compound remained in the dark (Figure 7a,b). The experimental control showed considerably more breaks per 1000 base pairs (kbp) when compared to the negative control, as well as the three concentrations of porphyrin when exposed in the dark (p < 0.0001). The PtTThPor induced significant DNA damage at the two highest concentrations (10 µM: p = 0.0005 and 20 µM: p < 0.0001), which was also maintained in the dark with DNA in solution with 20 µM of porphyrin (p = 0.0033) (Figure 7c,d). For all treatments, most of the damage identified was in purines, since the Fpg enzyme showed more activity in all tests.
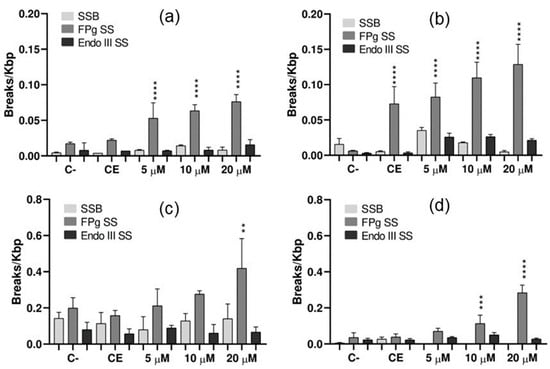
Figure 7.
Quantification of DNA lesions generated by porphyrins (a) PtTThPor (dark), (b) PtTThPor (light), (c) PdTThPor (dark) and (d) PdTThPor (light), using a white-light LED source (irradiance of 50 mW cm−2 and a total light dosage of 270 J cm−2) for 90 min. C-: negative control; EC: experiment control. SSB: single-strand breakage of DNA. FPG SS: Formamido-pyrimidine DNA Glycosylase Sensitive Sites. ENDO III SS: Endonuclease III sensitive sites. Mean and standard deviation of three independent experiments. ** p = 0.0033; *** p = 0.0005; **** p < 0.0001.
3. Materials and Methods
3.1. General
All chemical reagents were of analytical grade and purchased from Sigma-Aldrich® (Burlington, MA, USA) and Oakwood Chemical® (Estill, SC, USA) without any further purification. The calf-thymus acid desoxyribonucleic (CT-DNA) was lyophilized powder (Sigma-Aldrich®, São Paulo, Brazil, purity ≥ 99%). The concentration of the stock solutions of DNA was confirmed by UV-Vis analysis through the Beer-Lambert equation with the molar absorptivity (ε) value of 6600 M−1 cm−1 for CT-DNA at 260 nm (per nucleic acid) in Tris-HCl buffer (pH 7.4) solution and the water used in all experiments was milliQ grade.
3.2. Photobiological Parameters of Porphyrins
Stability, photo-stability, aggregation, ROS generation (by spectroscopy and EPR analysis) and partition coefficients of porphyrins TThPor, PdTThPor and PtTThPor were previously described by Tisoco and co-workers [19].
3.3. DNA Interactive Studies
UV-Vis absorption analysis for each porphyrin without and in the presence of successive additions of CT-DNA solution was obtained at 298.15 K in a DMSO(5%)/Tris-HCl pH 7.4 mixture buffered solution in the 250 to 800 nm range. The porphyrin concentration was fixed at 5.0 μM and CT-DNA was in the 0 to 50 μM range. The hyperchromicity (H%), red-shift (Δλ), binding constant (Kb) and Gibb’s free-energy (ΔG°) values of the porphyrins TThPor, PdTThPor and PtTThPor were calculated according to the literature through Benesi-Hildebrand and free-energy equations [31].
Competitive binding assays between CT-DNA:dyes and thienyl-porphyrins by steady-state fluorescence emission analysis are recorded and the porphyrins TThPor, PdTThPor and PtTThPor in DMSO (5%)/Tris-HCl pH 7.4 mixture buffered solution (0 to 100 μM) were gradually added in a fixed concentration of ethidium bromide (EB; general intercalator; 10 μM; λexc = 510 nm, λem = 550–800 nm), acridine orange (AO; A-T rich intercalator; 10 μM; λexc = 490 nm, λem = 500–800 nm), 4′,6-diamidino-2-phenylindole (DAPI; minor groove binder; 10 μM; λexc = 359 nm, λem = 380–700 nm), methyl green (MG, major groove binder; 10 μM, λexc = 318 nm, λem = 330–600 nm) and CT-DNA (10 μM) in DMSO(5%)/Tris-HCl pH 7.4 mixture buffered solution. The DNA:dye adducts were incubated for 5 min after porphyrin addition for each measurement. The Stern-Volmer quenching (KSV) and bimolecular quenching rate (kq) constants of derivatives were calculated according to the DNA:dye fluorescence quenching using a plot of F0/F versus [porphyrin] and a ratio of KSV/τ0, where the τ0 denotes the fluorescence lifetime of DNA:dye (EB = 23.0 ns; AO = 2.20 ns; DAPI = 1.70 ns; MG = 2.80 ns), respectively. Binding (Kb) constant and free-energy interaction (ΔG°) values are obtained by modifying Stern-Volmer and Gibb’s equation according to the literature [40].
Viscosity analyses were carried out using an Ostwald viscometer immersed in a water bath maintained at 298.15 K, according to the literature [41]. The CT-DNA concentration was kept constant in all experiments, while the porphyrin concentration was increased in the DMSO(5%)/Tris-HCl pH 7.4 mixture buffered solution. The flow time was measured at least three times with a digital stopwatch (Casio®), and the mean value was calculated. Data are presented as (η/η0)1/3 versus the ratio [porphyrin]/[CT-DNA], where η and η0 are the specific viscosities of CT-DNA in the presence and absence of the porphyrins TThPor, PdTThPor and PtTThPor, respectively.
Also, the circular dichroism (CD) spectra of the DNA solutions and in the presence of porphyrins TThPor, PdTThPor and PtTThPor were recorded in a Jasco spectropolarimeter, model J810-150S, at 298.15 K. The experiment was carried out starting with a solution of DNA dissolved in 50 mM Tris-HCl buffer (pH = 7.4) with 1.0% DMSO. The CD spectrum of this solution was recorded, and then aliquots of the solutions of each porphyrin were added in a concentration range between 11 and 55 μM with the same solvent, recording the spectrum after each addition.
3.4. Molecular Docking Procedure with DNA
The crystallographic structure of the DNA was obtained from the Protein Data Bank (PDB) with access code 1BNA [37]. The chemical structure of the porphyrins TThP, PdTThPor and PtTThP was built and minimized in terms of energy by Density Functional Theory (DFT), available in the Spartan’18 software (Wavefunction, Inc., Irvine, CA, USA) [42]. Molecular docking calculations were performed with GOLD 5.7 software (Cambridge Crystallographic Data Centre, Cambridge, CB2 1EZ, UK) [43]. Hydrogen atoms were added to the DNA following tautomeric states and ionization data inferred by GOLD 5.7 software (version 2022.3, Cambridge, UK). In silico calculations were performed in a 10 Å radius around the two main possible binding sites (major and minor grooves) [44]. The standard ChemPLP was used as a scoring function due to the best results obtained in previous work for porphyrins [45]. The figures for the best docking pose were generated with PyMOL Delano Scientific LLC software (Schrödinger, New York, NY, USA) [45]. Additionally, this same software was also used to detect the main interactions among TThP/PdTThPor/PtTThPor and nucleobases through a cut-off for the interaction of 4.2 Å [46] and an analysis of van der Waals radius superposition.
3.5. DNA Photo-Oxidation by UV-Vis Analysis
The photo-oxidation assays of DNA were conducted by absorption UV-Vis analysis at room temperature. Stock solutions of DNA (5.0 μM) were prepared in Tris-HCl buffer (pH 7.4) containing TThP, PdTThPor and PtTThP (at 5.0 μM) and the solutions were irradiated with a white-light LED source (irradiance of 50 mW cm−2 and a total light dosage of 90 J cm−2) in a time period of 30 min. The DNA was absorbed at 260 nm, and the plots of ln A0/A versus time for DNA gave a straight line from which the photo-oxidation rate (kpo) constant was calculated.
3.6. Electrophoresis and Detection of DNA Oxidative Damage
The DNA template used for the detection and quantification of oxidative damage by porphyrins TThP, PdTThPor and PtTThP was the plasmid pCMUT, extracted from Escherichia coli. The plasmid was exposed to concentrations of 5.0 µM, 10 µM and 20 µM of the porphyrins, in the dark and in white-light LED conditions (irradiance of 50 mW cm−2 and a total light dosage of 270 J cm−2) for a period of 90 min using the DNA dosimeter system. After exposure, the DNA was incubated at 37 °C for 60 min with the enzymes formamido-pyrimidine DNA glycosylase (Fpg) and endonuclease III (Endo III), which recognize and cleave oxidized bases, mainly purines and pyrimidines, respectively.
In addition, the DNA was incubated without the presence of enzymes to detect single-stranded breakage (SSB). Then, the solutions were submitted to 0.8% agarose gel electrophoresis. The documentation of this gel was performed using the photo-documenter Amersham Imager 600 (General Electronic). In the gel, we are able to see if the exposure to the porphyrins under different conditions caused damage to DNA. When there is no DNA damage, a lower band is formed in the gel (FI), since the plasmid will stay in its supercoiled form. In the case of DNA damage, a second upper band is formed since the DNA is in a more relaxed form due to the enzyme’s activity.
Damage quantification was performed by band densitometry using the Image Quant 300 program (GE Healthcare, USA) [47]. Statistical analysis was performed using the GraphPad Prism program using the One-Way ANOVA test followed by Sidak, with a confidence interval of 95% (p < 0.05).
4. Conclusions
In summary, these results indicate that the thienyl-porphyrins with Pd(II) or Pt(II) polypyridyl complexes are promising dyes for DNA interaction. The insertion of the peripherally coordinated Pt(II) or Pd(II) complexes resulted in increased interaction with nucleic acids when compared to the non-cationic free-base porphyrin TThPor. These derivatives interact probably via secondary interactions via minor grooves around the DNA nucleobases, showing good binding parameters determined by absorption and emission analysis and molecular docking calculations. Additionally, Pd(II) or Pt(II) complexes (PdTThPor and PtTThPor) were able to promote photo-damage in the DNA, thus evidencing the main purpose of this work, which was to demonstrate the potential interaction and damage induction of these porphyrins in DNA. These findings may open up many opportunities for further studies on PDT treatments and their mechanisms of action.
Supplementary Materials
The following supporting information can be downloaded at: https://www.mdpi.com/article/10.3390/molecules28135217/s1, Figure S1: UV-Vis spectra of the TThPor upon successive additions of CT-DNA concentrations (0 to 50 µM) in DMSO(5%)/Tris-HCl pH 7.4 mixture buffered solution. Graph plots of A0/(A – A0) versus 1/[CT-DNA]; Figure S2: Steady-state fluorescence emission spectra for EB:DNA without and in the presence of porphyrin TThPor, in DMSO(5%)/Tris-HCl pH 7.4 mixture buffered solution. Graphs plots shows the F0/F versus [porphyrin]; Figure S3: Steady-state fluorescence emission spectra for AO:DNA without and in the presence of porphyrin TThPor, in DMSO(5%)/Tris-HCl pH 7.4 mixture buffered solution. Graphs plots shows the F0/F versus [porphyrin]; Figure S4: Steady-state fluorescence emission spectra for DAPI:DNA without and in the presence of porphyrin TThPor, in DMSO(5%)/Tris-HCl pH 7.4 mixture buffered solution. Graphs plots shows the F0/F versus [porphyrin]; Figure S5: Steady-state fluorescence emission spectra for MG:DNA without and in the presence of porphyrin TThPor, in DMSO(5%)/Tris-HCl pH 7.4 mixture buffered solution. Graphs plots shows the F0/F versus [porphyrin]; Figure S6: Steady-state fluorescence emission spectra for EB:DNA without and in the presence of porphyrin PdTThPor, in DMSO(5%)/Tris-HCl pH 7.4 mixture buffered solution. Graphs plots shows the F0/F versus [porphyrin]; Figure S7: Steady-state fluorescence emission spectra for AO:DNA without and in the presence of porphyrin PdTThPor, in DMSO(5%)/Tris-HCl pH 7.4 mixture buffered solution. Graphs plots shows the F0/F versus [porphyrin]; Figure S8: Steady-state fluorescence emission spectra for DAPI:DNA without and in the presence of porphyrin PdTThPor, in DMSO(5%)/Tris-HCl pH 7.4 mixture buffered solution. Graphs plots shows the F0/F versus [porphyrin]; Figure S9: Steady-state fluorescence emission spectra for MG:DNA without and in the presence of porphyrin PdTThPor, in DMSO(5%)/Tris-HCl pH 7.4 mixture buffered solution. Graphs plots shows the F0/F versus [porphyrin]; Figure S10: CD spectra for DNA solution in Tris-HCl buffer (pH = 7.4, 1% DMSO) before and after successive additions of porphyrin TThPor; Figure S11: DNA photo-oxidation assay by UV-Vis analysis in DMSO(5%)/Tris-HCl pH 7.4 mixture buffered solution of porphyrin TThPor; Figure S12: DNA photo-oxidation assay by UV-Vis analysis in DMSO(5%)/Tris-HCl pH 7.4 mixture buffered solution of porphyrin PdTThPor; Figure S13: DNA photo-oxidation assay by UV-Vis analysis in DMSO(5%)/Tris-HCl pH 7.4 mixture buffered solution of porphyrin PtTThPor; Figure S14: Quantification of DNA lesions generated by porphyrins (a) TThPor (dark) and (b) TThPor (light), using white-light LED source (irradiance of 50 mW cm−2 and a total light dosage of 270 J cm−2) for 90 min. C-: negative control, EC: experiment control. SSB: single-strand breakage of DNA. FPG SS: Formamido-pyrimidine DNA Glycosylase Sensitive Sites. ENDO III SS: Endonuclease III sensitive sites. Mean and standard deviation of three independent experiments. ** p = 0.0033; *** p = 0.0005; **** p < 0.0001; Table S1: Molecular docking results for the interaction between DNA:TThPor, DNA:PtTThPor, and DNA:PdTThPor in the minor groove.
Author Contributions
Conceptualization, K.T.d.O. and B.A.I.; methodology, N.P.P., S.I.F., L.B.T., S.N., O.A.C. and R.R.B.; software, K.T.d.O., O.A.C. and B.A.I.; validation, K.T.d.O. and B.A.I.; formal analysis, N.P.P., S.I.F., L.B.T., O.A.C. and R.R.B.; investigation, N.P.P., S.I.F., L.B.T., O.A.C., S.N. and R.R.B.; resources, K.T.d.O., A.P.S. and B.A.I.; data curation, K.T.d.O., A.P.S. and B.A.I.; writing—original draft preparation, K.T.d.O., A.P.S. and B.A.I.; writing—review and editing, K.T.d.O., A.P.S., O.A.C. and B.A.I.; visualization, K.T.d.O., A.P.S. and B.A.I.; supervision, K.T.d.O., A.P.S. and B.A.I.; project administration, K.T.d.O. and B.A.I.; funding acquisition, K.T.d.O. and B.A.I. All authors have read and agreed to the published version of the manuscript.
Funding
All authors would like to thank CNPq, FAPERGS, FAPESP and CAPES. O.A. Chaves also would like to thank FCT—Fundação para a Ciência e a Tecnologia, I.P. (Portugal), under the project UIDB/00313/2020. B.A. Iglesias also would like to thank the CNPq (Universal—403210/2021-6 and PQ—305458/2021-3), CAPES (Finance code 001) and FAPERGS grants (PQ Gaucho—21/2551-0002114-4). S. Nikolaou would also like to thank FAPESP (2022/03478-8 and PQ—305761/2021-8). A.P. Schuch also would like to thank CNPq (407103/2018-0; 307063/2018-6; and 304870/2021-8). K. T de Oliveira thanks FAPESP for the grants 2020/06874-6 and 2013/07276-1.
Institutional Review Board Statement
Not applicable.
Informed Consent Statement
Not applicable.
Data Availability Statement
All analyzed data are contained in the main text of the article. Raw data are available from the authors upon request.
Acknowledgments
The authors acknowledge André Justino at the Department of Chemistry, University of São Paulo (FFCLRP, Brazil) for the circular dichroism (CD) facilities. All authors would like to thank CNPq, FAPERGS, FAPESP and CAPES. O.A. Chaves also thanks FCT—Fundação para a Ciência e a Tecnologia, I.P. (Portugal) for his PhD fellowship 2020.07504.BD.
Conflicts of Interest
The authors declare no conflict of interest. The funders had no role in the design of the study; in the collection, analysis or interpretation of data; in the writing of the manuscript; or in the decision to publish the results.
Sample Availability
Samples of the compounds TThPor, PdTThPor and PtTThPor are available from the authors.
References
- Urbani, M.; Gra, M.; Nazeeruddin, M.K. Meso-Substituted Porphyrins for Dye-Sensitized Solar Cells. Chem. Rev. 2014, 114, 12330–12396. [Google Scholar] [CrossRef] [PubMed]
- Paolesse, R.; Nardis, S.; Monti, D.; Stefanelli, M.; Di Natale, C. Porphyrinoids for Chemical Sensor Applications. Chem. Rev. 2017, 117, 2517–2583. [Google Scholar] [CrossRef] [PubMed]
- Baglia, R.A.; Zaragoza, J.P.T.; Goldberg, D.P. Biomimetic Reactivity of Oxygen-Derived Manganese and Iron Porphyrinoid Complexes. Chem. Rev. 2017, 117, 13320–13352. [Google Scholar] [CrossRef] [PubMed]
- Xue, X.; Lindstrom, A.; Li, Y. Porphyrin-Based Nanomedicines for Cancer Treatment. Bioconjugate Chem. 2019, 30, 1585–1603. [Google Scholar] [CrossRef]
- Pereira, M.M.; Dias, L.D.; Calvete, M.J.F. Metalloporphyrins: Bioinspired Oxidation Catalysts. ACS Catal. 2018, 8, 10784–10808. [Google Scholar] [CrossRef]
- Ravikumar, M.; Raghav, D.; Rathinasamy, K.; Kathiravan, A.; Mothi, E.M. DNA Targeting Long-Chain Alkoxy Appended Tin(IV) Porphyrin Scaffolds: Photophysical and Antimicrobial PDT Investigations. ACS Appl. Bio Mater. 2018, 1, 1705–1716. [Google Scholar] [CrossRef]
- Pandey, V.; Raza, M.K.; Joshi, P.; Gupta, I. Synthesis of Water-Soluble Thioglycosylated Trans-A2B2Type Porphyrins: Cellular Uptake Studies and Photodynamic Efficiency. J. Org. Chem. 2020, 85, 6309–6322. [Google Scholar] [CrossRef]
- Yang, B.; Chen, Y.; Shi, J. Reactive Oxygen Species (ROS)-Based Nanomedicine. Chem. Rev. 2019, 119, 4881–4985. [Google Scholar] [CrossRef]
- Ye, H.; Zhou, Y.; Liu, X.; Chen, Y.; Duan, S.; Zhu, R.; Liu, Y.; Yin, L. Recent Advances on Reactive Oxygen Species-Responsive Delivery and Diagnosis System. Biomacromolecules 2019, 20, 2441–2463. [Google Scholar] [CrossRef]
- Betoni Momo, P.; Pavani, C.; Baptista, M.S.; Brocksom, T.J.; Thiago De Oliveira, K. Chemical Transformations and Photophysical Properties of meso-Tetrathienyl-Substituted Porphyrin Derivatives. Eur. J. Org. Chem. 2014, 2014, 4536–4547. [Google Scholar] [CrossRef]
- Bansal, A.; Kaushik, S.; Kukreti, S. Non-Canonical DNA Structures: Diversity and Disease Association. Front. Genet. 2022, 13, 959258. [Google Scholar] [CrossRef] [PubMed]
- Singh, A.; Kukreti, R.; Saso, L.; Kukreti, S. Oxidative Stress: Role and Response of Short Guanine Tracts at Genomic Locations. Int. J. Mol. Sci. 2019, 20, 4258. [Google Scholar] [CrossRef]
- Kloster, M.; Kostrhunova, H.; Zaludova, R.; Malina, J.; Kasparkova, J.; Brabec, V.; Farrell, N. Trifunctional Dinuclear Platinum Complexes as DNA-Protein Cross-Linking Agents. Biochemistry 2004, 43, 7776–7786. [Google Scholar] [CrossRef] [PubMed]
- Adams, M.; Sullivan, M.P.; Tong, K.K.H.; Goldstone, D.C.; Hanif, M.; Jamieson, S.M.F.; Hartinger, C.G. Mustards-Derived Terpyridine-Platinum Complexes as Anticancer Agents: DNA Alkylation vs Coordination. Inorg. Chem. 2021, 60, 2414–2424. [Google Scholar] [CrossRef] [PubMed]
- Gao, E.; Zhu, M.; Liu, L.; Huang, Y.; Wang, L.; Shi, C.; Zhang, W.; Sun, Y. Impact of the Carbon Chain Length of Novel Palladium(Ll) Complexes on Interaction with DNA and Cytotoxic Activity. Inorg. Chem. 2010, 49, 3261–3270. [Google Scholar] [CrossRef] [PubMed]
- Ruiz, J.; Lorenzo, J.; Sanglas, L.; Cutillas, N.; Vicente, C.; Villa, M.D.; Avilés, F.X.; López, G.; Moreno, V.; Pérez, J.; et al. Palladium(II) and Platinum(II) Organometallic Complexes with the Model Nucleobase Anions of Thymine, Uracil, and Cytosine: Antitumor Activity and Interactions with DNA of the Platinum Compounds. Inorg. Chem. 2006, 45, 6347–6360. [Google Scholar] [CrossRef] [PubMed]
- Ruhayel, R.A.; Langner, J.S.; Oke, M.J.; Berners-Price, S.J.; Zgani, I.; Farrell, N.P. Chimeric Platinum-Polyamines and DNA Binding. Kinetics of DNA Interstrand Cross-Link Formation by Dinuclear Platinum Complexes with Polyamine Linkers. J. Am. Chem. Soc. 2012, 134, 7135–7146. [Google Scholar] [CrossRef]
- Micklitz, W.; Sheldrick, W.S.; Lippert, B. Mono- and Dinuclear Palladium (I1) Complexes of Uracil and Thymine Model A. Inorg. Chem. 1990, 29, 211–216. [Google Scholar] [CrossRef]
- Tisoco, I.; Donatoni, M.C.; Victória, H.F.V.; de Toledo, J.R.; Krambrock, K.; Chaves, O.A.; de Oliveira, K.T.; Iglesias, B.A. Photophysical, photooxidation, and biomolecule-interaction of meso-tetra(thienyl)porphyrins containing peripheral Pt(II) and Pd(II) complexes. Insights for photodynamic therapy applications. Dalton Trans. 2022, 51, 1646–1657. [Google Scholar] [CrossRef]
- Lourenço, L.M.O.; Iglesias, B.A.; Pereira, P.M.R.; Girão, H.; Fernandes, R.; Neves, M.G.P.M.S.; Cavaleiro, J.A.S.; Tomé, J.P.C. Synthesis, characterization and biomolecule-binding properties of novel tetra-platinum(II)-thiopyridylporphyrins. Dalton Trans. 2015, 44, 530–538. [Google Scholar] [CrossRef]
- Iglesias, B.A.; Barata, J.F.B.; Pereira, P.M.R.; Girão, H.; Fernandes, R.; Tomé, J.P.C.; Neves, M.G.P.M.S.; Cavaleiro, J.A.S. New Platinum(II)-Bipyridyl Corrole Complexes: Synthesis, Characterization and Binding Studies with DNA and HSA. J. Inorg. Biochem. 2015, 153, 32–41. [Google Scholar] [CrossRef] [PubMed]
- Auras, B.L.; Oliveira, V.A.; Terenzi, H.; Neves, A.; Iglesias, B.A. meso-Mono-[4-(1,4,7-triazacyclononanyl)]-tri(phenyl)]porphyrin and the respective zinc(II)-complex: Complete characterization and biomolecules binding abilities. Photochem. Photobiol. Sci. 2016, 15, 564–579. [Google Scholar] [CrossRef] [PubMed]
- Oliveira, V.A.; Terenzi, H.; Menezes, L.B.; Chaves, O.A.; Iglesias, B.A. Evaluation of DNA-binding and DNA-photocleavage ability of tetra-cationic porphyrins containing peripheral [Ru(Bpy)2Cl]+ complexes: Insights for photodynamic therapy agents. J. Photochem. Photobiol. B Biol. 2020, 211, 111991. [Google Scholar] [CrossRef] [PubMed]
- Oliveira, V.A.; Iglesias, B.A.; Auras, B.L.; Neves, A.; Terenzi, H. Photoactive: meso-tetra(4-pyridyl)porphyrin-tetrakis-[chloro(2,2′bipyridine)platinum(II) derivatives recognize and cleave DNA upon irradiation. Dalton Trans. 2017, 46, 1660–1669. [Google Scholar] [CrossRef] [PubMed]
- Acunha, T.V.; Chaves, O.A.; Iglesias, B.A. Fluorescent Pyrene Moiety in Fluorinated C6F5-Corroles Increases the Interaction with HSA and CT-DNA. J. Porphyr. Phthalocyanines 2021, 25, 75–94. [Google Scholar] [CrossRef]
- Montalti, M.; Credi, A.; Prodi, L.; Teresa Gandolfi, M. Handbook of Photochemistry, 3rd ed.; Press, C., Ed.; Taylor & Francis: Singapore, 2006. [Google Scholar]
- Heller, D.P.; Greenstock, C.L. Fluorescence Lifetime Analysis of DNA Intercalated Ethidium Bromide and Quenching by Free Dye. Biophys. Chem. 1994, 50, 305–312. [Google Scholar] [CrossRef]
- Sayed, M.; Krishnamurthy, B.; Pal, H. Unraveling Multiple Binding Modes of Acridine Orange to DNA Using a Multispectroscopic Approach. Phys. Chem. Chem. Phys. 2016, 18, 24642–24653. [Google Scholar] [CrossRef]
- Estandarte, A.K.; Botchway, S.; Lynch, C.; Yusuf, M.; Robinson, I. The Use of DAPI Fluorescence Lifetime Imaging for Investigating Chromatin Condensation in Human Chromosomes. Sci. Rep. 2016, 6, 31417. [Google Scholar] [CrossRef]
- Sahar, E.; Latt, S.A. Energy Transfer and Binding Competition between Dyes Used to Enhance Staining Differentiation in Metaphase Chromosomes. Chromosoma 1980, 79, 1–28. [Google Scholar] [CrossRef]
- Fioravanço, L.P.; Pôrto, J.B.; Martins, F.M.; Siqueira, J.D.; Iglesias, B.A.; Rodrigues, B.M.; Chaves, O.A.; Back, D.F. A Vanadium(V) Complexes Derived from Pyridoxal/Salicylaldehyde. Interaction with CT-DNA/HSA, and Molecular Docking Assessments. J. Inorg. Biochem. 2023, 239, 112070. [Google Scholar] [CrossRef]
- Dodero, V.I.; Quirolo, Z.B.; Sequeira, M.A. Biomolecular studies by circular dichroism. Front. Biosci. (Landmark Ed) 2011, 16, 61–73. [Google Scholar] [CrossRef] [PubMed]
- Kypr, J.; Kejnovská, I.; Renčiuk, D.; Vorlíčková, M. Circular Dichroism and Conformational Polymorphism of DNA. Nucleic Acids Res. 2009, 37, 1713–1725. [Google Scholar] [CrossRef]
- Haeubl, M.; Reith, L.M.; Gruber, B.; Karner, U.; Müller, N.; Knör, G.; Schoefberger, W. DNA Interactions and Photocatalytic Strand Cleavage by Artificial Nucleases Based on Water-Soluble Gold(III) Porphyrins. J. Biol. Inorg. Chem. 2009, 14, 1037–1052. [Google Scholar] [CrossRef]
- Joshi, S.; Singh, A.; Kukreti, S. Porphyrin Induced Structural Destabilization of a Parallel DNA G-Quadruplex in Human MRP1 Gene Promoter. J. Mol. Recognit. JMR 2022, 35, e2950. [Google Scholar] [CrossRef]
- da Silveira, C.H.; Vieceli, V.; Clerici, D.J.; Santos, R.C.V.; Iglesias, B.A. Investigation of isomeric tetra-cationic porphyrin activity with peripheral [Pd(bpy)Cl]+ units by antimicrobial photodynamic therapy. Photodiag. Photodyn.Ther. 2020, 31, 101920. [Google Scholar] [CrossRef]
- Drew, H.R.; Wing, R.M.; Takano, T.; Broka, C.; Tanaka, S.; Itakura, K.; Dickerson, R.E. Structure of a B-DNA Dodecamer: Conformation and Dynamics. Proc. Natl. Acad. Sci. USA 1981, 78, 2179–2183. [Google Scholar] [CrossRef] [PubMed]
- Bennett, M.; Krah, A.; Wien, F.; Garman, E.; Mckenna, R.; Sanderson, M.; Neidle, S. A DNA-Porphyrin Minor-Groove Complex at Atomic Resolution: The Structural Consequences of Porphyrin Ruffling. Proc. Natl. Acad. Sci. USA 2000, 97, 9476–9481. [Google Scholar] [CrossRef]
- Romera, C.; Sabater, L.; Garofalo, A.; Dixon, I.M.; Pratviel, G. Interaction of Cationic Nickel and Manganese Porphyrins with the Minor Groove of DNA. Inorg. Chem. 2010, 49, 8558–8567. [Google Scholar] [CrossRef] [PubMed]
- Chaves, O.A.; Acunha, T.V.; Iglesias, B.A.; Jesus, C.S.H.; Serpa, C. Effect of Peripheral Platinum(II) Bipyridyl Complexes on the Interaction of Tetra-Cationic Porphyrins with Human Serum Albumin. J. Mol. Liq. 2020, 301, 112466. [Google Scholar] [CrossRef]
- Rodrigues, B.M.; Victória, H.F.V.; Leite, G.; Krambrock, K.; Chaves, O.A.; de Oliveira, D.F.; de Q. Garcia, R.; De Boni, L.; Costa, L.A.S.; Iglesias, B.A. Photophysical, photobiological, and biomolecule-binding properties of new tri-cationic meso-tri(2-thienyl)corroles with Pt(II) and Pd(II) polypyridyl derivatives. J. Inorg. Biochem. 2023, 242, 112149. [Google Scholar] [CrossRef]
- Hehre, W.J. A Guide to Molecular Mechanics and Quantum Chemical Calculations; Wavefunction, Inc.: Irvine, CA, USA, 2003; ISBN 189066118X. [Google Scholar]
- CCDC Solutions—CSD-Discovery Components. Available online: http://www.ccdc.cam.ac.uk/solutions/csd-discovery/components/gold/ (accessed on 1 May 2023).
- Bessega, T.; Chaves, O.A.; Martins, F.M.; Acunha, T.V.; Back, D.F.; Iglesias, B.A.; de Oliveira, G.M. Coordination of Zn(II), Pd(II) and Pt(II) with Ligands Derived from Diformylpyridine and Thiosemicarbazide: Synthesis, Structural Characterization, DNA/BSA Binding Properties and Molecular Docking Analysis. Inorg. Chim. Acta 2019, 496, 119049. [Google Scholar] [CrossRef]
- DeLano, W.; Bromberg, S. PyMOL User’s Guide (Original); DeLano Scientific LLC: San Carlos, CA, USA, 2004; pp. 1–66. [Google Scholar]
- Chang, D.-K.; Cheng, S.-F. On the Importance of van Der Waals Interaction in the Groove Binding of DNA with Ligands: Restrained Molecular Dynamics Study. Int. J. Biol. Macromol. 1996, 19, 279–285. [Google Scholar] [CrossRef] [PubMed]
- Schuch, A.P.; Da Silva Galhardo, R.; De Lima-Bessa, K.M.; Schuch, N.J.; Menck, C.F.M. Development of a DNA-Dosimeter System for Monitoring the Effects of Solar-Ultraviolet Radiation. Photochem. Photobiol. Sci. 2009, 8, 111–120. [Google Scholar] [CrossRef] [PubMed]


Disclaimer/Publisher’s Note: The statements, opinions and data contained in all publications are solely those of the individual author(s) and contributor(s) and not of MDPI and/or the editor(s). MDPI and/or the editor(s) disclaim responsibility for any injury to people or property resulting from any ideas, methods, instructions or products referred to in the content. |
© 2023 by the authors. Licensee MDPI, Basel, Switzerland. This article is an open access article distributed under the terms and conditions of the Creative Commons Attribution (CC BY) license (https://creativecommons.org/licenses/by/4.0/).