Article

An AIE-Active NIR Fluorescent Probe with Good Water Solubility for the Detection of Aβ1–42 Aggregates in Alzheimer’s Disease

1
Center of Safety Production and Testing Technology, China Academy of Safety Science and Technology, Beijing 100012, China
2
College of Chemistry, Beijing Normal University, Beijing 100875, China
3
Key Laboratory of Energy Conversion and Storage Materials, Beijing Normal University, Beijing 100875, China
4
Key Laboratory of Radiopharmaceuticals, Ministry of Education, Beijing Normal University, Beijing 100875, China
*
Author to whom correspondence should be addressed.
These authors contributed equally to this work.
Molecules 2023, 28(13), 5110; https://doi.org/10.3390/molecules28135110
Submission received: 24 May 2023 / Revised: 25 June 2023 / Accepted: 28 June 2023 / Published: 29 June 2023

Abstract

:
Alzheimer’s disease (AD), an amyloid-related disease, seriously endangers the health of elderly individuals. According to current research, its main pathogenic factor is the amyloid protein, which is a kind of fibrillar aggregate formed by noncovalent self-assembly of proteins. Based on the characteristics of aggregation-induced emission (AIE), a bislactosyl-decorated tetraphenylethylene (TPE) molecule TMNL (TPE + malononitrile + lactose), bearing two malononitrile substituents, was designed and synthesized in this work. The amphiphilic TMNL could self-assemble into fluorescent organic nanoparticles (FONs) with near-infrared (NIR) fluorescence emission in physiological PBS (phosphate buffered saline), achieving excellent fluorescent enhancement (47-fold) upon its combination with Aβ1–42 fibrils. TMNL was successfully applied to image Aβ1–42 plaques in the brain tissue of AD transgenic mice, and due to the AIE properties of TMNL, no additional rinsing process was necessary. It is believed that the probe reported in this work should be useful for the sensitive detection and accurate localization mapping of Aβ1–42 aggregates related to Alzheimer’s disease.

1. Introduction

Alzheimer’s disease, an incurable neurodegenerative disease, seriously endangers the physical and psychological health of elderly individuals [1,2,3]. One of the pathological features of Alzheimer’s disease is the abnormal deposition and accumulation of β-amyloid outside neurons in the cerebral cortex [4,5,6]. When the environment of the protein is changed, such as the temperature, pH, etc., or the protein is misfolded, its biological activity will decrease or even disappear, and the inactive protein aggregates, forming amyloids [7,8]. The most common types of β-amyloids in human bodies are Aβ1–40 and Aβ1–42, and Aβ1–42 polypeptides are more prone to aggregate and deposit into fibrillar aggregates [9,10,11,12].
Developing sensitive and efficient tools for the accurate sensing of Aβ polypeptides is of great importance to the diagnosis and intervention of AD in its early stage. At present, most reported fluorescent probes used for Aβ imaging, such as Thioflavin T (ThT), Thioflavin S (ThS), BODIPYs, and oxazines [13,14,15], lead to serious self-fluorescence quenching due to aggregation at the Aβ binding site, and the rinse process also needs to be repeatedly performed during real-time imaging to overcome the disadvantages of the aggregation-caused quenching (ACQ) effect. In addition, ThT and Congo red (CR) fluorophores with short emission wavelengths and small Stokes shifts are not suitable for imaging in vivo [16,17]. Several fluorescent probes with D-π-A structures and the intramolecular charge transfer (ICT) effect have been developed to extend the conjugate system; however, the fluorescent defects of the molecules themselves still limit their wide application to achieve accurate imaging information for mapping Aβ plaques [18,19,20].
According to the research and report of Tang’s group [21], AIE was a preferential strategy to identify protein fibrillar formation [16]. In contrast with the ACQ fluorophores, fluorophores with AIE properties were exactly able to compensate for their deficiency, particularly the light-up characteristic during the aggregation process [21]. In addition, low fluorescence background, high sensitivity, and good resistance to photobleaching are also advantages of AIE-type luminogens. AIE-luminogen (AIEgen) itself, in dilute solution, exhibited weak fluorescence due to intramolecular thermal motion, but when it was combined with the β-sheet of amyloid due to hydrophobic interactions, the fluorescence was greatly enhanced under the restriction of intramolecular motion (RIM) effect [22,23,24], enabling fluorescence imaging of amyloids, such as Aβ1–42 fibrils [16,21]. However, the initial aggregation of AIE fluorescent probes with poor water solubility led to a stronger “false-positive” AIE signal before binding to Aβ aggregates. To date, a number of fluorescent probes have been developed to detect Aβ amyloid [14,25,26,27,28,29,30,31,32,33,34,35], but water-soluble NIR fluorophores with AIE properties have rarely been reported [36,37,38,39,40].

2. Results and Discussion
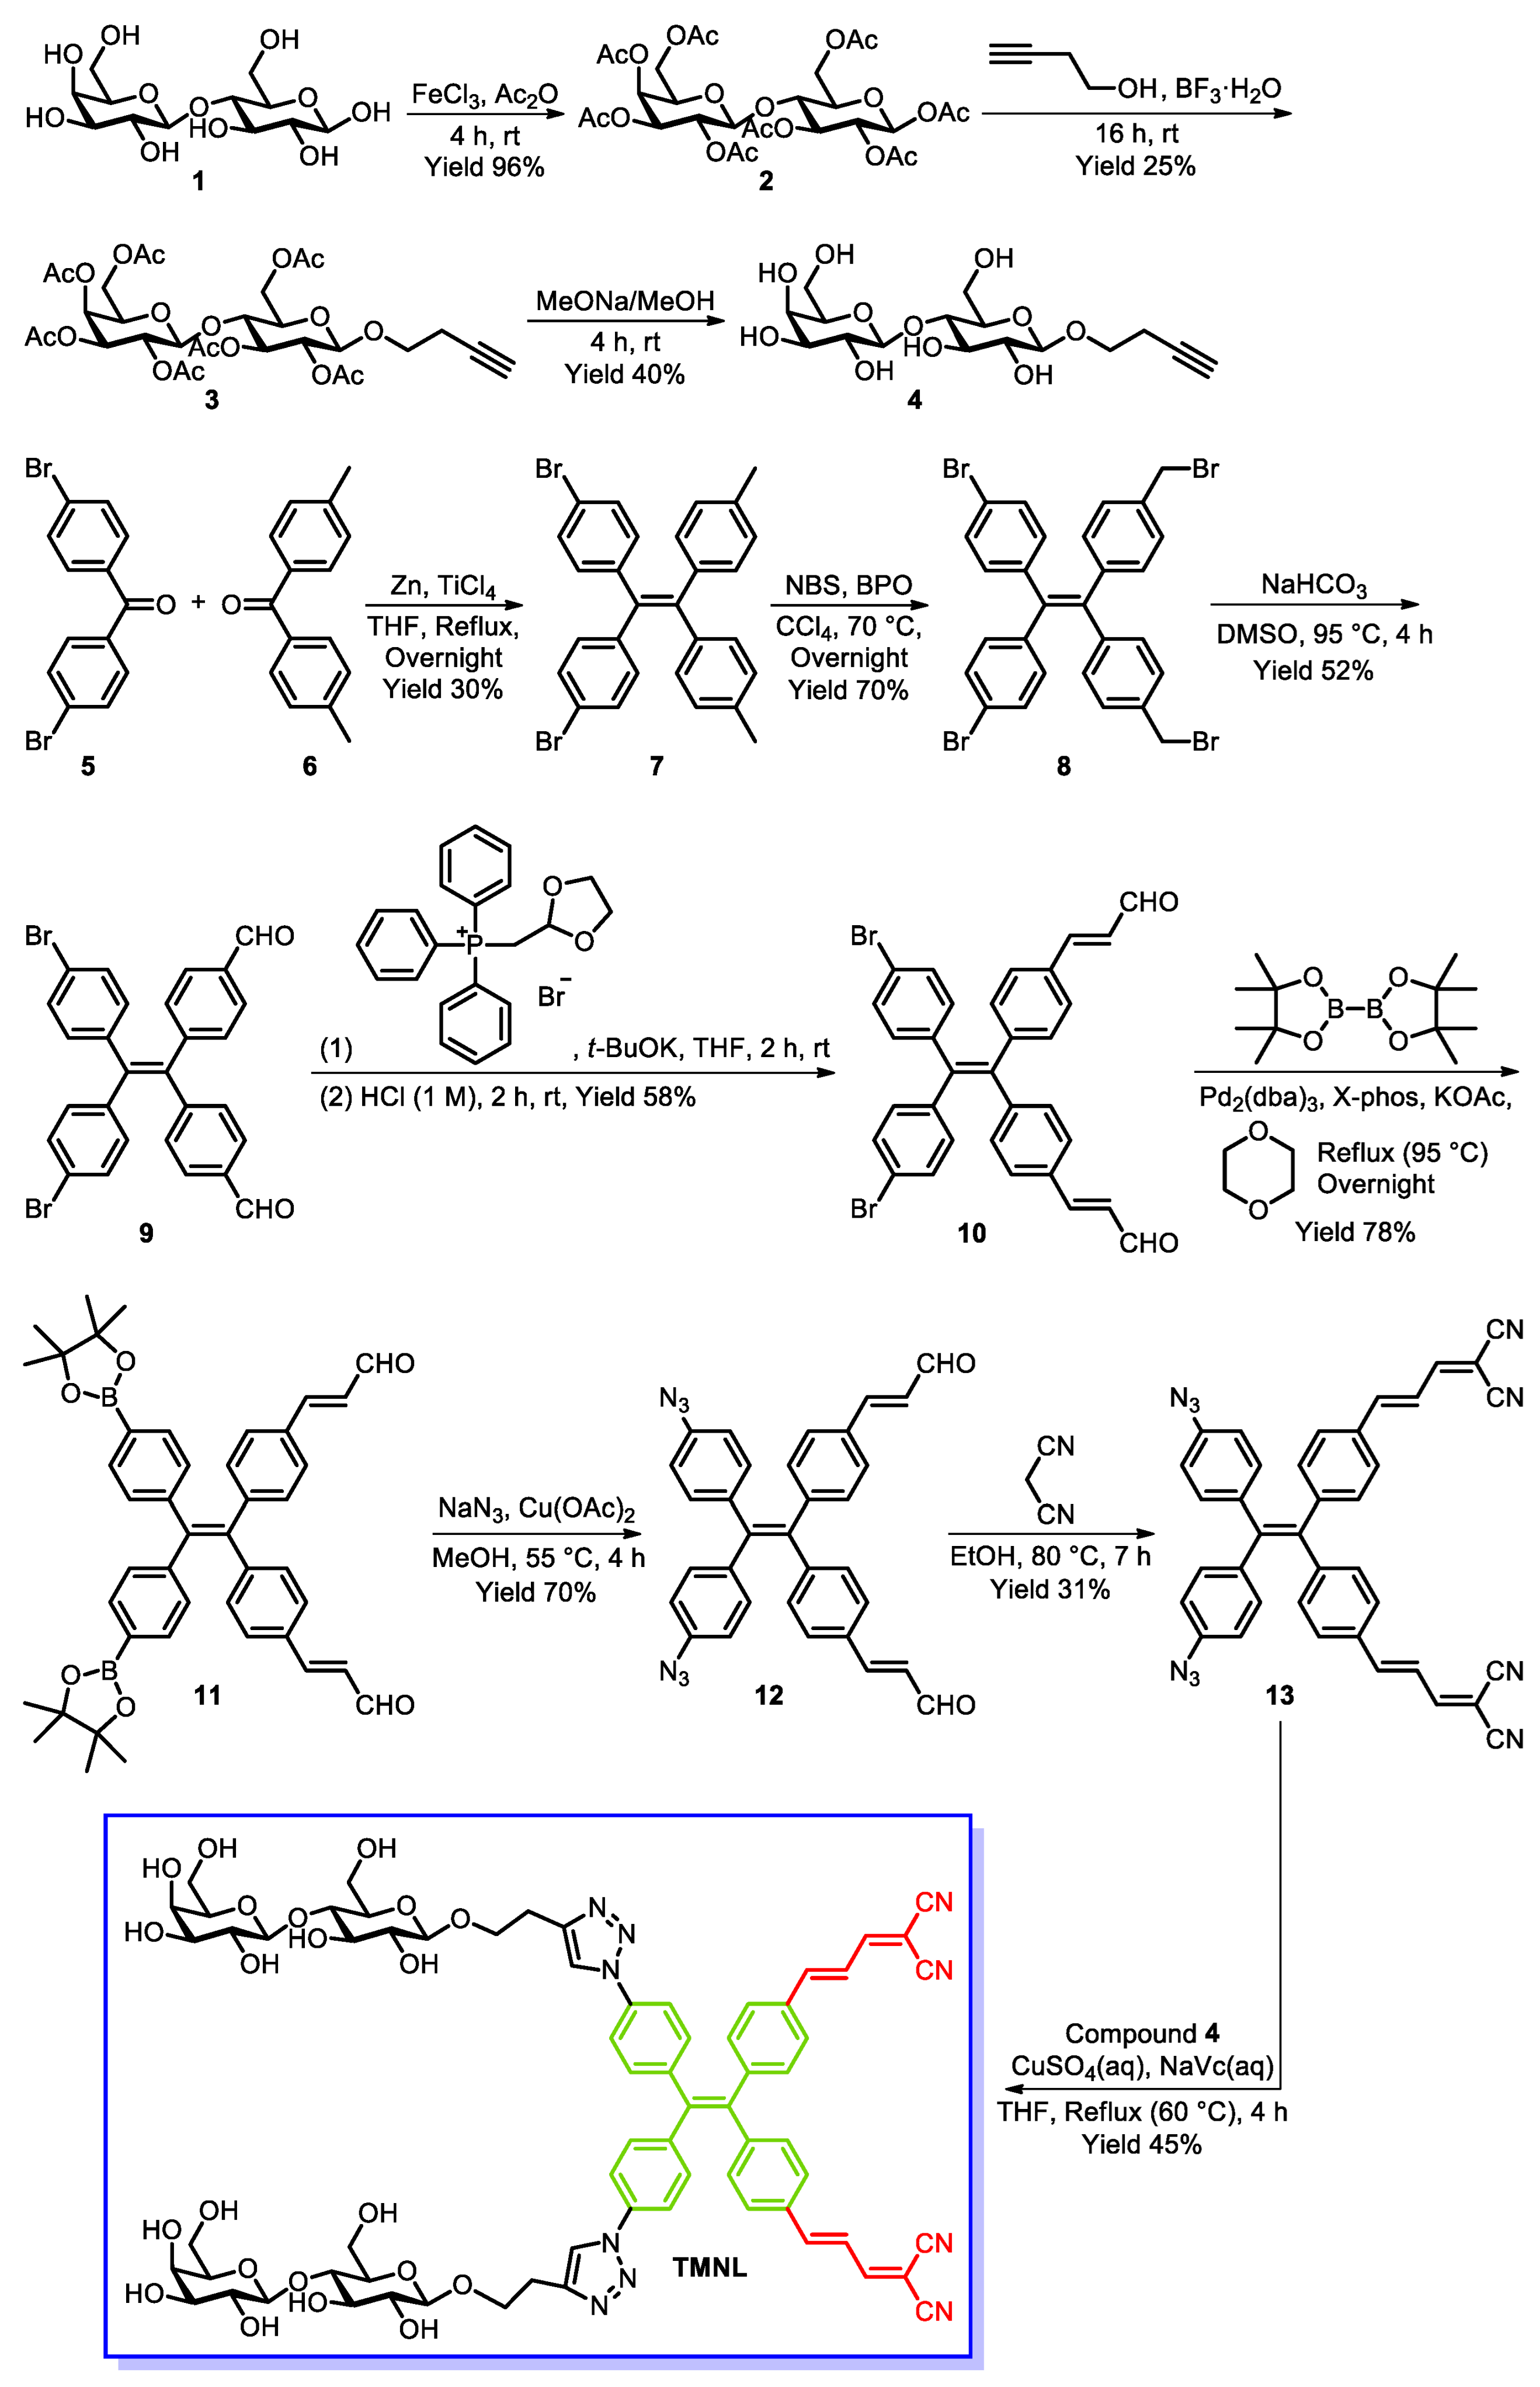
According to the reported literature [20], the malononitrile substituent could be used as an acceptor in D-π-A type NIR fluorophores for the detection of Aβ fibrils, and the π bridge could enhance the fluorescence emission of the probe and increase its redshift. In addition, lactose is a highly biocompatible and water-soluble substance, and it is a good choice for use as the hydrophilic unit.
Herein, we designed and synthesized a bislactosyl-decorated tetraphenylethylene (TPE) molecule, TMNL (Scheme 1), with typical AIE fluorescence characteristics, which contained two malononitrile substituents in the molecule. The amphiphilic TMNL could self-assemble into fluorescent organic nanoparticles (FONs) with NIR fluorescence emission in PBS buffer solution (pH 7.4) and could achieve excellent no-rinsing fluorescence imaging of Aβ1–42 fibrils through the combination of malononitrile groups with Aβ1–42 fibrils. TMNL was bestowed on the following extraordinary features. (i) The water-soluble lactose units would increase the water solubility and biocompatibility of TPE. (ii) The AIE-active TPE unit would overcome the ACQ effect of traditional fluorophores. (iii) The malononitrile substituent with an electron-withdrawing effect could extend the conjugated system of TPE, which redshifted the emission wavelength to the NIR region. Compared to the reported AIE-type NIR fluorescence probes for the detection of the Aβ amyloid (Tables S1 and S3), TMNL was the first amphiphilic and water-soluble AIE-active NIR fluorescent probe with a large Stokes shift for the detection of Aβ1–42 and high-fidelity in situ mapping of Aβ1–42 plaques.

2.1. Synthesis

The details of the synthetic routes of TMNL are shown in Scheme 1. Briefly, the tetraphenylethene derivative, Compound 9, was synthesized with 5 and 6 as starting materials by McMurry coupling reaction, radical substitution reaction, and Kornblum oxidation reaction. The double bond was introduced to Compound 9 by the Witting reaction and then coupled to malononitrile by the Knoevenagel reaction to afford 13. Finally, TMNL was obtained by the click reaction of lactose derivative 4 and TPE derivative 13. The chemical structures of TMNL and the synthetic intermediates were characterized by 1H NMR, 13C NMR, and HRMS (Figures S1–S5).

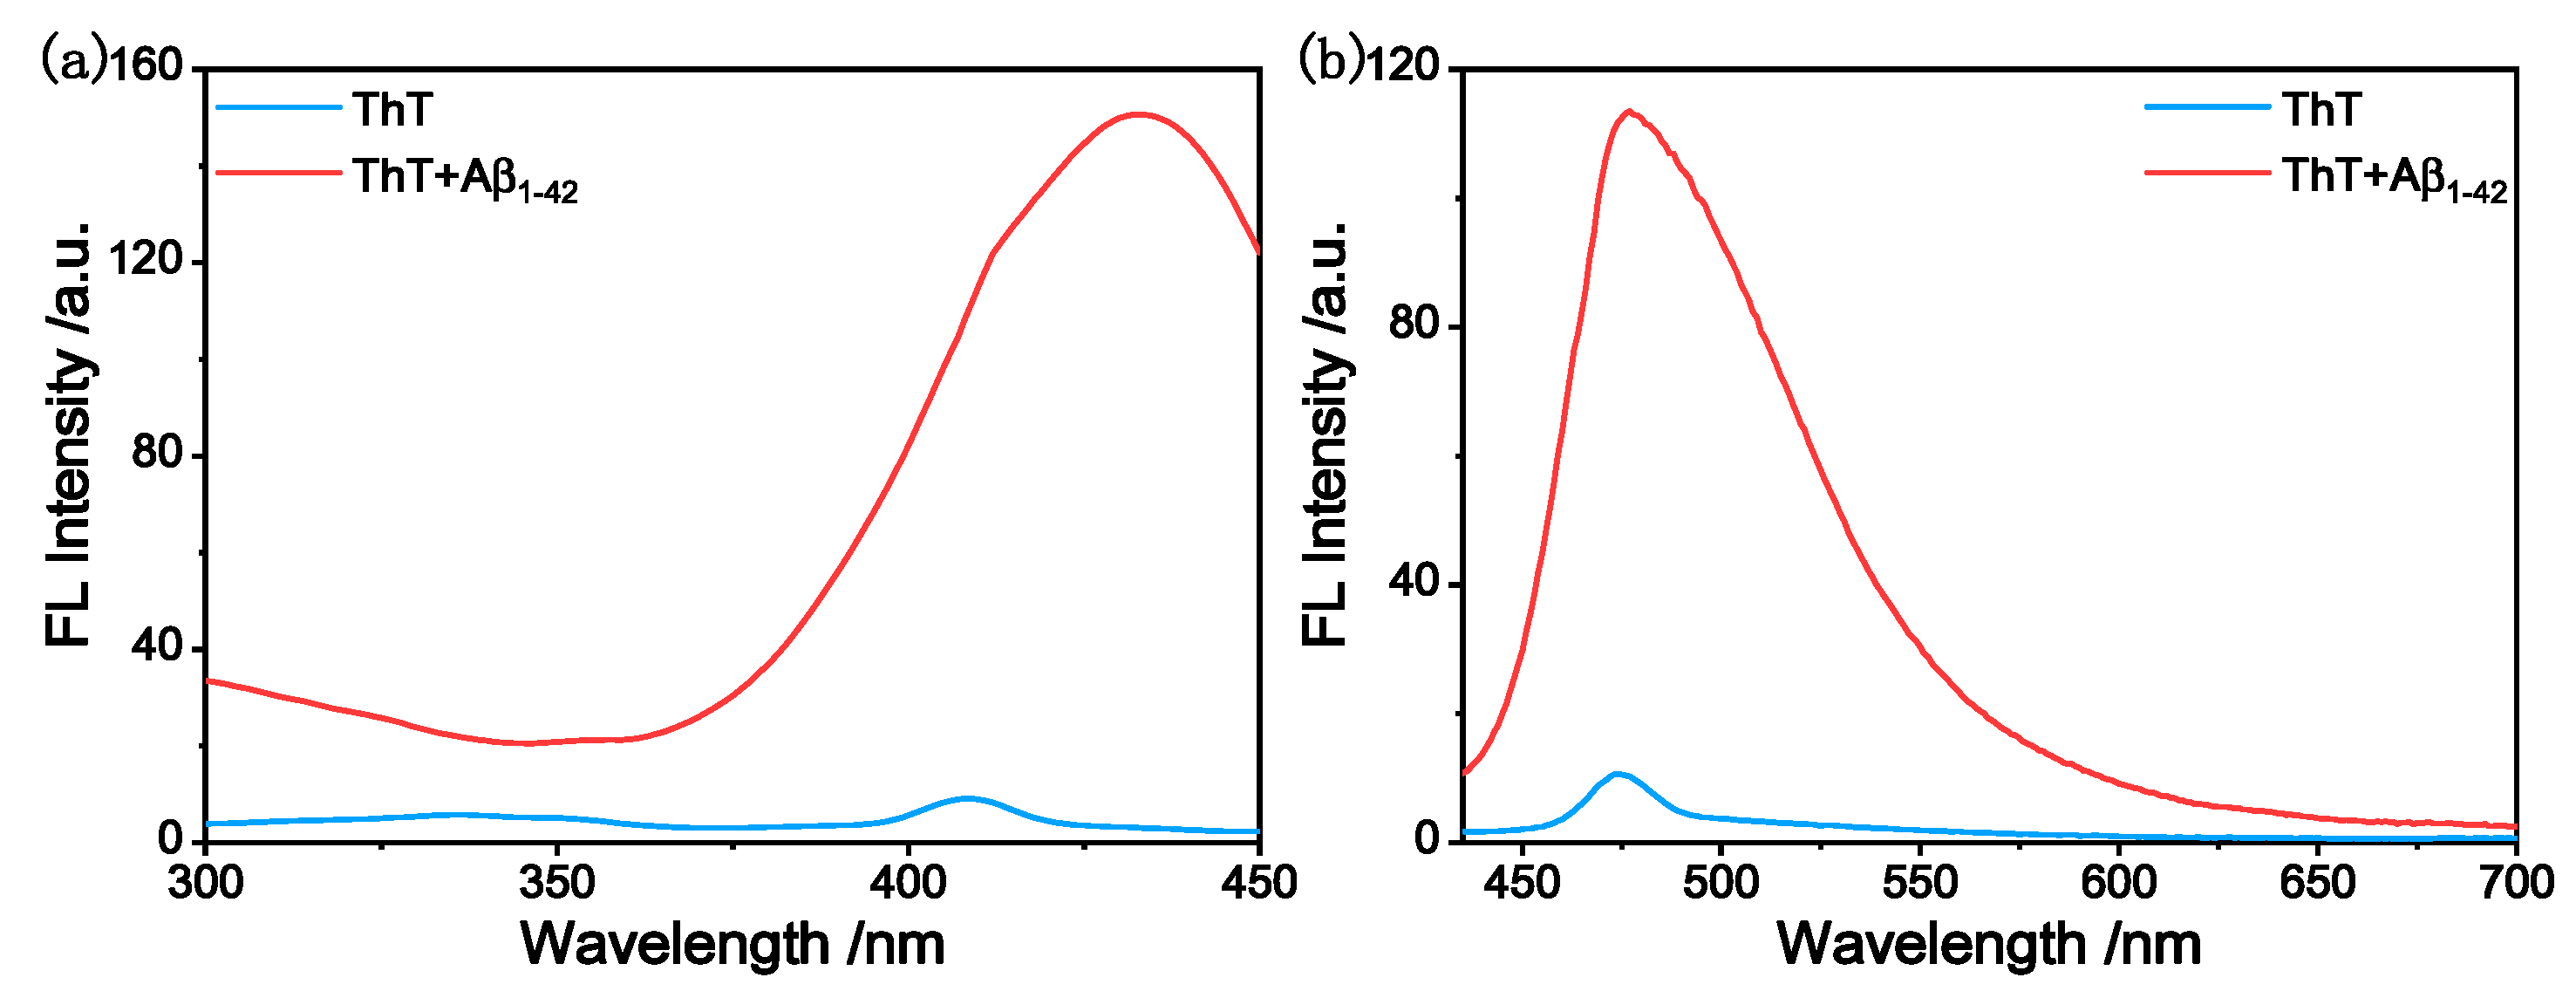
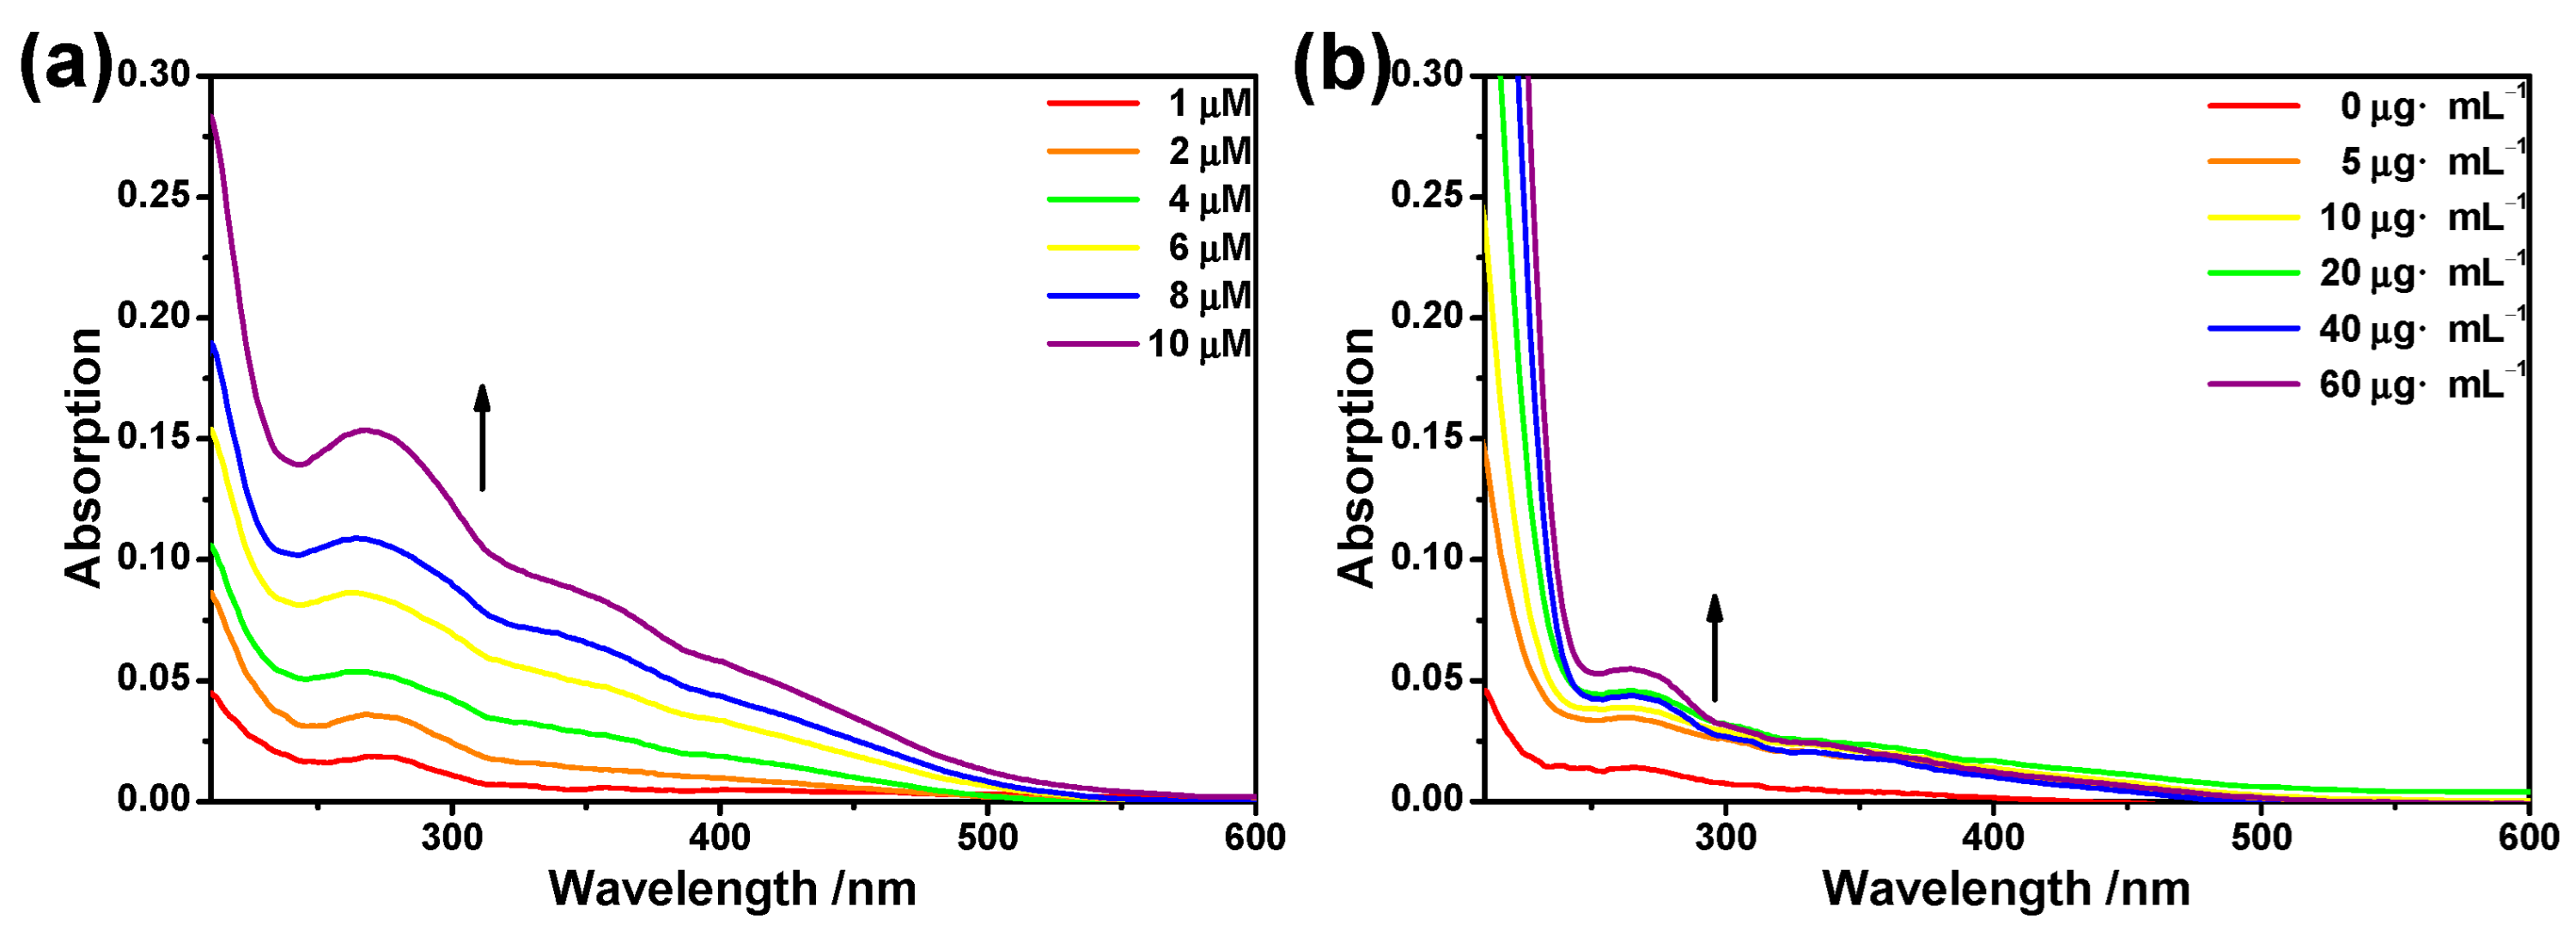
2.2. Photophysical Characterization of TMNL

We first investigated the photophysical properties of TMNL under physiological conditions (PBS buffer, pH 7.4). TMNL showed weak absorption at approximately 320–380 nm, and the maximum emission wavelength was 645 nm (Figure 1). The large Stokes shift of approximately 285 nm could reduce the self-absorption effect and make TMNL have a strong ability to resist background interference [41,42].
Initial background minimization and fidelity signal amplification of TMNL were essential for ultrasensitive and accurate detection of Aβ1–42 fibrils; therefore, it was necessary to choose a suitable detection concentration to avoid a “false-positive” AIE signal. The fluorescence spectra of TMNL itself as a function of concentration were first measured. As shown in Figure 2, when the concentration of TMNL was less than 0.752 μM, the fluorescence intensity in PBS buffer solution (pH 7.4, 10 mM) did not change obviously with increasing concentration. Therefore, the critical micelle concentration (CMC) was measured at 0.752 μM, and TMNL could self-assemble to form FONs when the concentration exceeded 0.752 μM. To make the fluorescence intensity of TMNL as low as possible before binding to Aβ1–42 fibrils, 1 μM was selected as the test concentration.

2.3. The Performance of Aβ1–42 Fibrils Detection

The binding properties of TMNL to Aβ1–42 fibrils were mainly characterized by fluorescence spectroscopy in PBS buffer solution (pH 7.4, 10 mM). The Aβ1–42 species included monomers, oligomers, and aggregates, and different aggregation degrees could have a critical influence on the change in fluorescence intensity [39]. The Aβ1–42 fibrils were prepared from the Aβ1–42 peptide by coincubation in PBS buffer solution (pH 7.4, 10 mM) at 37 °C for seven days (please refer to Section 3.3 for the detailed steps). ThT is generally used as an authoritative standard probe for the detection of the aggregation state of amyloid [37,43,44,45,46]. As shown in Figure 3, upon coincubation with treated Aβ1–42 fibrils, the fluorescence intensity of the excitation spectra and the emission spectra sharply enhanced, accompanied by a redshift, which indicated that the Aβ1–42 protein was in a good aggregation state and could be used for the following detection.
To clarify the saturation time of the interaction between TMNL and Aβ1–42 fibrils, the “Time-Fluorescence Intensity” experiment was performed in PBS buffer solution (pH 7.4, 10 mM). After coincubation with Aβ1–42 fibrils, the fluorescence emission intensity at 645 nm was slightly enhanced, but a very obvious emission peak appeared at 496 nm and increased rapidly with longer coincubation time, which can be attributed to the RIM effect by the binding of TMNL with the Aβ1–42 fibrils. The fluorescence intensity at 496 nm became constant within 60 min, and the color change in the solution before and after the addition of Aβ1–42 fibrils could be clearly distinguished with the naked eye (from red to yellow) under UV illumination at 365 nm (Figure 4, insert). When the coincubation time was fixed at 60 min, the fluorescence intensity of TMNL at approximately 496 nm increased gradually and finally tended to flatten with increasing Aβ1–42 fibril concentration. The increased fluorescence intensity was up to 47-fold (Figure 5). Moreover, the linear relationship between the Aβ1–42 fibril concentration and the fluorescence intensity of TMNL at 496 nm was obtained in the concentration range of 0–45 μg·mL−1 (R2 = 0.9955, Figure 5), indicating that the concentration of Aβ1–42 fibrils can be quantitatively estimated by TMNL. Then, the UV absorption spectra of TMNL in the presence and absence of Aβ1–42 fibrils were also determined. As shown in Figure 6a, the absorption band at 265–360 nm gradually increased with increasing concentrations of Aβ1–42 fibrils, which also indicated that the binding of TMNL and Aβ1–42 fibrils changed the conjugation system of the TMNL molecule. These results suggested that TMNL could act as an efficient and sensitive tool for the detection of Aβ1–42 fibrils.

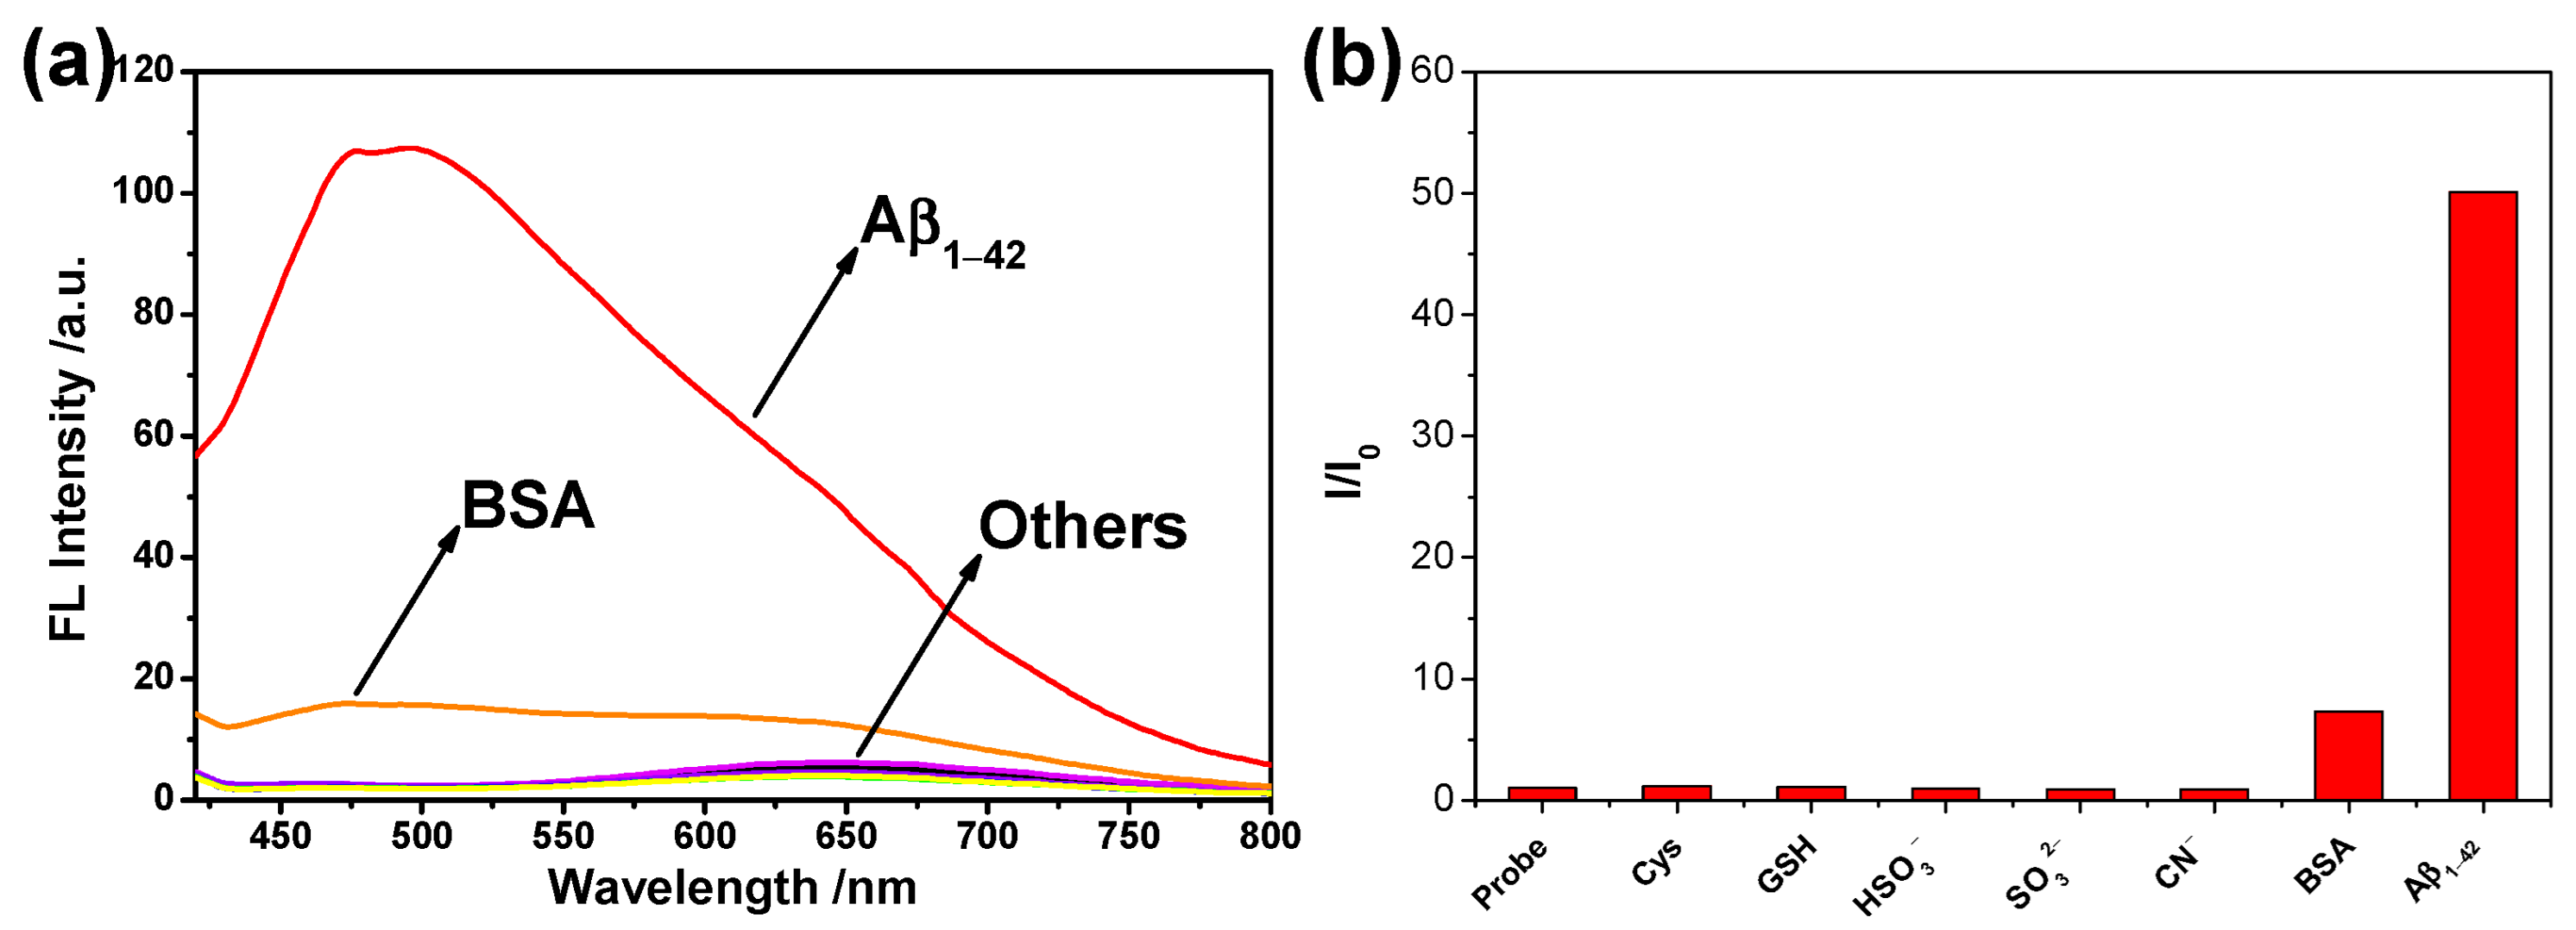
2.4. Selectivity Study

We also screened a series of sulfur-containing substances to verify the selectivity of TMNL for Aβ1–42 fibrils, including L(+)-cysteine (Cys), glutathione (GSH), HSO3, SO32−, and BSA. TMNL was incubated with various high-concentration interfering substances. As shown in Figure 7, the fluorescence intensity of TMNL was nearly unchanged in the presence of other sulfur-containing compounds. Although BSA could produce a weak fluorescence response, it was far lower than the 47-fold increase produced by Aβ1–42 fibrils, which suggested that TMNL could be used for highly selective detection of Aβ1–42 fibrils under complex physiological conditions. Compared to the reported probes (Table S2), TMNL had no inferior selectivity for Aβ1–42 fibrils.

2.5. The Dissociation Constant Study

Binding affinity was a crucial factor for TMNL to efficiently trace the Aβ1–42 fibrils, and a saturation binding experiment was performed to quantitatively evaluate the binding ability of TMNL to Aβ1–42 fibrils. The fluorescence intensity was measured by incubating Aβ1–42 fibrils with different concentrations of TMNL, as shown in Figure 8. The dissociation constant Kd in this process was calculated to be 410.4 nM, which indicated that TMNL was a good substrate for Aβ1–42 fibrils and could be well applied to Aβ1–42 fibril detection. Compared to the reported AIE-type NIR fluorescence probes for the detection of Aβ amyloid (Tables S1 and S3), TMNL had a moderate binding affinity.

2.6. Appearance Observations

To intuitively clarify the binding appearance of TMNL with Aβ1–42 fibrils, transmission electron microscopy (TEM) images of TMNL binding to Aβ1–42 fibrils were obtained. As shown in Figure 9a,b, TMNL could self-assemble into small spherical nanostructures 30–100 nm in diameter. After coincubation with Aβ1–42 fibrils in PBS buffer solution (pH 7.4, 10 mM) for 60 min, as shown in Figure 9c,d, TMNL aggregates were attached to the intertwined Aβ1–42 fibrils, which indicated that TMNL and Aβ1–42 fibrils could combine to make TPE aggregate and to emit strong fluorescence.

2.7. In Vitro Mapping with High-Fidelity Aβ1–42 Plaque Information

To evaluate the performance of TMNL in bioimaging-related fields, TMNL was applied to stain Aβ1–42 plaques in the brain tissue of AD transgenic mice (App, 13 months old). As shown in Figure 10, TMNL bound to and stained Aβ1–42 plaques in the brain tissue of AD transgenic mice, as observed by an Axio Observer Z1 microscope. Due to the AIE properties of TMNL, no additional rinsing or processing was necessary. These results preliminarily indicated that TMNL had a good affinity for Aβ1–42 plaques in biological tissues, which was suitable and convenient for further clinical application.

3. Materials and Methods

3.1. Materials and Instrumentations

All chemicals and solvents were purchased from commercial suppliers and used without further purification, unless otherwise noted. The Aβ1–42 polypeptide was obtained from GL Biochem (Shanghai, China) Co., Ltd. Bovine serum albumin (BSA) was purchased from Innochem (Beijing, China) Technology Co., Ltd. PBS buffer (pH 7.2–7.4, 0.01 M) was purchased from Beijing Solarbio Science & Technology Co., Ltd., Beijing, China. All anaerobic reactions were performed under a dry N2 atmosphere. All reactions were monitored by thin-layer chromatography (TLC) on T-HSGF10025025 normal-phase silica gel glass plates or 60 RP-18 F254s reversed-phase silica gel glass plates and revealed with UV light (254 nm or 365 nm) or EtOH-H2SO4 (7%) solution. Flash column chromatography was performed on 200–300 mesh silica gel. Reversed-phase chromatography was performed on SiliaSphere C18 (50 μm, 120 Å). Molecular exclusion chromatography was performed on Bio-Gel® P-2 Media (45–90 μm). 1H and 13C NMR spectra were recorded on a Bruker Avance III spectrometer (400 MHz) or JNM-ECZR spectrometer (400 and 600 MHz) with tetramethylsilane (TMS, δ = 0 ppm) as an internal standard. The residual peaks of the solvent were chloroform-d at 7.26 ppm (1H) and 77.16 ppm (13C), methanol-d4 at 3.31 ppm (1H) and 49.00 ppm (13C), and DMSO-d6 at 2.50 ppm (1H) and 39.52 ppm (13C). High-resolution mass spectra were recorded on a Bruker micrOTOF-QII mass spectrometer (ESI) or Bruker autoflex speed LRF (MALDI-TOF). Photoluminescence (PL) spectra were recorded on a FS5 spectrofluorometer (Edinburgh Instruments Ltd., Edinburgh, UK). Transmission electron microscopy (TEM) images were recorded on a FEI Talos F200S (Thermo Fisher Scientific, Waltham, USA). Distilled water was used throughout the test experiments.

3.2. Preparation of AD Transgenic Mouse Brain Tissue Paraffin Sections

Brain tissue paraffin sections of AD transgenic mice (App, 13 months old) were obtained from the Institute of Laboratory Animals Science, CAMS & PUMC (Beijing, China). Pretreatment of the brain tissue paraffin sections of AD transgenic mice (App, 13 months old) included soaking the sections in dimethylbenzene solution for 5 min to dewax, rinsing with ethanol and secondary water, and finally air-drying for further use. The brain tissue paraffin section images were observed on an Axio Observer Z1 microscope (Carl Zeiss AG, Oberkochen, Germany).

3.3. Preparation of Aβ1–42 Fibrils

Lyophilized 2.5 mg Aβ1–42 polypeptide powder was dissolved in 1.25 mL of PBS buffer solution (pH 7.4, 10 mM), and a small amount of NH3 was added to fully dissolve Aβ1–42, obtaining a 2 mg·mL−11–42 stock solution. Then, the 2 mg·mL−11–42 stock solution was diluted in PBS buffer solution (pH 7.4, 10 mM) to obtain a 200 μg·mL−1 protein solution and incubated at 37 °C for 7 days at 120 r·min−1 in a constant temperature oscillator to obtain an Aβ1–42 aggregate solution.

3.4. Coincubation Preparation Process of TMNL with Aβ1–42 Fibrils

The TMNL was mixed with Aβ1–42 aggregate solution and then coincubated at 37 °C for 1 h at 120 r·min−1 in a constant temperature oscillator for further testing.

3.5. Synthesis of Compound 4

Compounds 1 to 3 were synthesized according to the methods reported in a previous article [47].
Compound 4: Compound 3 (0.1 g, 0.054 mmol) was dissolved in dry methanol (5.42 mL), and a solution of MeONa/MeOH (5.4 M, 19 μL) was added with a microsyringe, and then the mixture was stirred for 4 h at room temperature. The reaction was neutralized with an IR-120 hydrogen ion resin to adjust the pH of the mixture to approximately 7. Then, the mixture was filtered, and the solvent was evaporated. The crude compound was purified by Bio-Gel® P-2 gel (pure H2O) to obtain Compound 4 (41 mg, 40% yield). 1H NMR (400 MHz, CD3OD), δ (ppm): 4.82 (d, J = 3.9 Hz, 1H), 4.39–4.32 (m, 2H), 3.96–3.67 (m, 14H), 3.61–3.43 (m, 9H), 2.52 (td, J = 7.3, 2.7 Hz, 3H), 2.28 (t, J = 2.6 Hz, 1H).

3.6. Synthesis of Compound 13

Compounds 5 to 12 were synthesized according to the methods reported in a previous article [47].
Compound 13: Compound 12 (50 mg, 0.096 mmol), malononitrile (51 mg, 0.77 mmol), and ethanol (4 mL) were added in a round bottom flask in that order. The mixture was then stirred at 80 °C until the reactant disappeared. After the reaction was accomplished, the reaction was cooled to room temperature, and the solvent was evaporated. The residue was purified by column chromatography (Hexane:EtOAc = 3:1, v/v) to obtain Compound 13 (18 mg, 31% yield). 1H NMR (400 MHz, CDCl3), δ (ppm): 7.57 (t, J = 5.4 Hz, 1H), 7.38 (d, J = 8.2 Hz, 2H), 7.19 (d, J = 5.1 Hz, 2H), 7.07 (d, J = 8.2 Hz, 2H), 6.99 (d, J = 8.4 Hz, 3H), 6.81 (d, J = 8.5 Hz, 2H); 13C NMR (100 MHz, CDCl3), δ (ppm): 159.71, 149.47, 147.02, 142.66, 139.45, 139.11, 139.03, 132.78, 132.64, 132.25, 128.75, 122.47, 118.80, 113.53, 111.72, 82.85; MS (MALDI-TOF): m/z Calcd for C38H22N10 [M − N2 + H]+ 591.205, found: 591.292.

3.7. Synthesis of Compound TMNL

TMNL: Compound 13 (0.42 g, 0.11 mmol) and Compound 4 (30 mg, 0.049 mmol) were added to a double neck bottle and dissolved in THF (3 mL) under N2. Then, sodium ascorbate (0.019 M, 1 mL, aq.) and CuSO4 (0.096 M, 1 mL, aq.) were added successively and stirred at 60 °C for 4 h. Then, the reaction was cooled to room temperature, extracted with DCM, washed with saturated aqueous sodium chloride, and dried over Na2SO4. After filtration, the solvent of the mixture was evaporated. The crude product was purified by Bio-Gel P-2 gel (pure H2O) to obtain TMNL (0.14 g, 45% yield). 1H NMR (400 MHz, DMSO-d6), δ (ppm): 8.60 (s), 7.71–7.61 (m), 7.24–7.01 (m), 5.28 (s), 5.04 (s), 4.74 (s), 4.66 (s), 4.59 (s), 4.55–4.51 (m), 4.47 (s), 4.26 (d, J = 7.9 Hz), 4.16 (d, J = 6.6 Hz), 4.01 (s), 3.74–3.66 (m), 3.58 (s), 3.51–3.39 (m), 3.02 (s), 2.93 (s); HRMS (ESI): m/z Calcd for C70H75N10O22 [M + H]+ 1407.5057, found: 1407.5060.

4. Conclusions

In this work, an AIE-active water-soluble and near-infrared fluorescent luminogen, TMNL, was successfully designed, synthesized, and well characterized; it contained hydrophilic lactose units, hydrophobic malononitrile, and a TPE derivative moiety. TMNL could self-assemble into fluorescent organic nanoparticles in aqueous solution and was used for the detection of Aβ1–42 fibrils and the NIR imaging of Aβ1–42 plaques sensitively and selectively. After coincubation with Aβ1–42 fibrils, the fluorescence intensity of TMNL at 496 nm increased up to 47-fold, and it also had excellent selectivity for Aβ1–42 fibrils. The Kd value (410.4 nm) indicated the good affinity between TMNL and Aβ1–42 fibrils, which could also be observed by TEM. TMNL could be utilized for the imaging of Aβ1–42 plaques in brain tissue accurately and conveniently, which could be an alternative to commercial probes. Although TMNL still had some characteristics to be further improved, such as complex preparation, this work was expected to facilitate relevant studies on Alzheimer’s disease.

Supplementary Materials

The following supporting information can be downloaded at: https://www.mdpi.com/article/10.3390/molecules28135110/s1, Table S1: AIE-type fluorescent probes for the detection of Aβ amyloid; Table S2: The selectivity comparison of AIE-type fluorescent probes for the detection of Aβ amyloid; Table S3: The molecular structures of the corresponding probes in Tables S1 and S2; Figure S1: 1H NMR spectra of compound 4; Figure S2: 1H NMR spectra of compound 13; Figure S3: 13C NMR spectra of compound 13; Figure S4: 1H NMR spectra of TMNL; Figure S5: HRMS spectra of TMNL.

Author Contributions

Conceptualization, G.-W.X. and M.H.; methodology, G.-W.X. and Z.-W.N.; validation, Y.-M.J. and M.H.; formal analysis, Y.-M.J. and M.H.; investigation, Y.-M.J. and M.H.; resources, G.-W.X. and Y.Z.; data curation, M.H.; writing—original draft preparation, Y.-M.J. and W.Z.; writing—review and editing, G.-W.X., Y.-M.J. and W.Z.; visualization, Y.-M.J. and W.Z.; supervision, G.-W.X. and Y.Z.; project administration, G.-W.X. and Y.Z.; funding acquisition, G.-W.X. All authors have read and agreed to the published version of the manuscript.

Funding

The project was financially supported by National Natural Science Foundation of China (21977014).

Institutional Review Board Statement

Not applicable.

Informed Consent Statement

Not applicable.

Data Availability Statement

The data that support the findings of this study are available from the corresponding author upon reasonable request.

Acknowledgments

We gratefully acknowledged the assistance provided by Mengchao Cui’s group at College of Chemistry, Beijing Normal University on the “in vitro mapping with high-fidelity Aβ1–42 plaques information” experiments of brain tissue sections of AD transgenic mice in this study.

Conflicts of Interest

The authors declare no conflict of interest.

Sample Availability

Samples of the compounds are available from the authors.

References

  1. Gravitz, L. Drugs: A tangled web of targets. Nature 2011, 475, S9–S11. [Google Scholar] [CrossRef] [PubMed]
  2. Selkoe, D.J. Resolving controversies on the path to Alzheimer’s therapeutics. Nat. Med. 2011, 17, 1060–1065. [Google Scholar] [CrossRef] [PubMed]
  3. Bhasikuttan, A.C.; Mohanty, J. Detection, inhibition and disintegration of amyloid fibrils: The role of optical probes and macrocyclic receptors. Chem. Commun. 2017, 53, 2789–2809. [Google Scholar] [CrossRef] [PubMed]
  4. Hardy, J.; Selkoe, D.J. The Amyloid Hypothesis of Alzheimer’s Disease: Progress and Problems on the Road to Therapeutics. Science 2002, 297, 353–356. [Google Scholar] [CrossRef] [PubMed] [Green Version]
  5. Kayed, R.; Head, E.; Thompson, J.L.; McIntire, T.M.; Milton, S.C.; Cotman, C.W.; Glabe, C.G. Common Structure of Soluble Amyloid Oligomers Implies Common Mechanism of Pathogenesis. Science 2003, 300, 486–489. [Google Scholar] [CrossRef] [Green Version]
  6. Goedert, M. Alzheimer’s and Parkinson’s diseases: The prion concept in relation to assembled Aβ, tau, and α-synuclein. Science 2015, 349, 1255555. [Google Scholar] [CrossRef]
  7. Dobson, C.M. Protein folding and misfolding. Nature 2003, 426, 884–890. [Google Scholar] [CrossRef]
  8. Morris, K.; Serpell, L. From natural to designer self-assembling biopolymers, the structural characterisation of fibrous proteins & peptides using fibre diffraction. Chem. Soc. Rev. 2010, 39, 3445–3453. [Google Scholar]
  9. Hamley, I.W. The Amyloid Beta Peptide: A Chemist’s Perspective. Role in Alzheimer’s and Fibrillization. Chem. Rev. 2012, 112, 5147–5192. [Google Scholar] [CrossRef]
  10. Kepp, K.P. Bioinorganic Chemistry of Alzheimer’s disease. Chem. Rev. 2012, 112, 5193–5239. [Google Scholar] [CrossRef] [Green Version]
  11. Schroeter, E.H.; Ilagan, M.X.G.; Brunkan, A.L.; Hecimovic, S.; Li, Y.M.; Xu, M.; Lewis, H.D.; Saxena, M.T.; Strooper, B.D.; Coonrod, A.; et al. A presenilin dimer at the core of the γ-secretase enzyme: Insights from parallel analysis of Notch 1 and APP proteolysis. Proc. Natl. Acad. Sci. USA 2003, 100, 13075–13080. [Google Scholar] [CrossRef] [PubMed] [Green Version]
  12. Jarrett, J.T.; Berger, E.P.; Lansbury, P.T. The carboxy terminus of the.beta. amyloid protein is critical for the seeding of amyloid formation: Implications for the pathogenesis of Alzheimer’s disease. Biochemistry 1993, 32, 4693–4697. [Google Scholar] [CrossRef] [PubMed]
  13. Ono, M.; Ishikawa, M.; Kimura, H.; Hayashi, S.; Matsumura, K.; Watanabe, H.; Shimizu, Y.; Cheng, Y.; Cui, M.; Kawashima, H.; et al. Development of dual functional SPECT/fluorescent probes for imaging cerebral β-amyloid plaques. Bioorg. Med. Chem. Lett. 2010, 20, 3885–3888. [Google Scholar] [CrossRef]
  14. Hintersteiner, M.; Enz, A.; Frey, P.; Jaton, A.-L.; Kinzy, W.; Kneuer, R.; Neumann, U.; Rudin, M.; Staufenbiel, M.; Stoeckli, M.; et al. In vivo detection of amyloid-β deposits by near-infrared imaging using an oxazine-derivative probe. Nat. Biotechnol. 2005, 23, 577–583. [Google Scholar] [CrossRef]
  15. Tong, H.; Lou, K.; Wang, W. Near-infrared fluorescent probes for imaging of amyloid plaques in Alzheimer’s disease. Acta Pharm. Sin. B 2015, 5, 25–33. [Google Scholar] [CrossRef] [Green Version]
  16. Hong, Y.; Meng, L.; Chen, S.; Leung, C.W.T.; Da, L.-T.; Faisal, M.; Silva, D.-A.; Liu, J.; Lam, J.W.Y.; Huang, X.; et al. Monitoring and Inhibition of Insulin Fibrillation by a Small Organic Fluorogen with Aggregation-Induced Emission Characteristics. J. Am. Chem. Soc. 2012, 134, 1680–1689. [Google Scholar] [CrossRef]
  17. Marzano, N.R.; Wray, K.M.; Johnston, C.L.; Paudel, B.P.; Hong, Y.; van Oijen, A.; Ecroyd, H. An α-Cyanostilbene Derivative for the Enhanced Detection and Imaging of Amyloid Fibril Aggregates. ACS Chem. Neurosci. 2020, 11, 4191–4202. [Google Scholar] [CrossRef] [PubMed]
  18. Choi, G.; Kim, H.-K.; Baek, A.R.; Kim, S.; Kim, M.J.; Kim, M.; Cho, A.E.; Lee, G.-H.; Jung, H.; Yang, J.-u.; et al. Multifunctional imaging of amyloid-beta peptides with a new gadolinium-based contrast agent in Alzheimer’s disease. J. Ind. Eng. Chem. 2020, 83, 214–223. [Google Scholar] [CrossRef]
  19. Das, A.; Dutta, T.; Gadhe, L.; Koner, A.L.; Saraogi, I. Biocompatible Fluorescent Probe for Selective Detection of Amyloid Fibrils. Anal. Chem. 2020, 92, 10336–10341. [Google Scholar] [CrossRef]
  20. Zhou, K.; Bai, H.; Feng, L.; Dai, J.; Cui, M. Smart D-π-A Type Near-Infrared Aβ Probes: Effects of a Marked π Bridge on Optical and Biological Properties. Anal. Chem. 2017, 89, 9432–9437. [Google Scholar] [CrossRef]
  21. Luo, J.; Xie, Z.; Lam, J.W.Y.; Cheng, L.; Chen, H.; Qiu, C.; Kwok, H.S.; Zhan, X.; Liu, Y.; Zhu, D.; et al. Aggregation-induced emission of 1-methyl-1,2,3,4,5-pentaphenylsilole. Chem. Commun. 2001, 18, 1740–1741. [Google Scholar] [CrossRef] [PubMed]
  22. Hong, Y.; Lam, J.W.Y.; Tang, B.Z. Aggregation-induced emission: Phenomenon, mechanism and applications. Chem. Commun. 2009, 29, 4332–4353. [Google Scholar] [CrossRef] [PubMed]
  23. Ding, D.; Li, K.; Liu, B.; Tang, B.Z. Bioprobes Based on AIE Fluorogens. Acc. Chem. Res. 2013, 46, 2441–2453. [Google Scholar] [CrossRef] [PubMed]
  24. Mei, J.; Leung, N.L.C.; Kwok, R.T.K.; Lam, J.W.Y.; Tang, B.Z. Aggregation-Induced Emission: Together We Shine, United We Soar! Chem. Rev. 2015, 115, 11718–11940. [Google Scholar] [CrossRef]
  25. Nesterov, E.E.; Skoch, J.; Hyman, B.T.; Klunk, W.E.; Bacskai, B.J.; Swager, T.M. In Vivo Optical Imaging of Amyloid Aggregates in Brain: Design of Fluorescent Markers. Angew. Chem. Int. Ed. 2005, 44, 5452–5456. [Google Scholar] [CrossRef]
  26. Raymond, S.B.; Skoch, J.; Hills, I.D.; Nesterov, E.E.; Swager, T.M.; Bacskai, B.J. Smart optical probes for near-infrared fluorescence imaging of Alzheimer’s disease pathology. Eur. J. Nucl. Med. Mol. Imaging 2008, 35, 93–98. [Google Scholar] [CrossRef]
  27. Ono, M.; Watanabe, H.; Kimura, H.; Saji, H. BODIPY-Based Molecular Probe for Imaging of Cerebral β-Amyloid Plaques. ACS Chem. Neurosci. 2012, 3, 319–324. [Google Scholar] [CrossRef] [Green Version]
  28. Cui, M.; Ono, M.; Watanabe, H.; Kimura, H.; Liu, B.; Saji, H. Smart Near-Infrared Fluorescence Probes with Donor-Acceptor Structure for in Vivo Detection of β-Amyloid Deposits. J. Am. Chem. Soc. 2014, 136, 3388–3394. [Google Scholar] [CrossRef]
  29. Fu, H.; Tu, P.; Zhao, L.; Dai, J.; Liu, B.; Cui, M. Amyloid-β Deposits Target Efficient Near-Infrared Fluorescent Probes: Synthesis, in vitro Evaluation, and in vivo Imaging. Anal. Chem. 2016, 88, 1944–1950. [Google Scholar] [CrossRef]
  30. Yan, J.W.; Zhu, J.Y.; Zhou, K.X.; Wang, J.S.; Tan, H.Y.; Xu, Z.Y.; Chen, S.B.; Lu, Y.T.; Cui, M.C.; Zhang, L. Neutral merocyanine dyes: For in vivo NIR fluorescence imaging of amyloid-β plaques. Chem. Commun. 2017, 53, 9910–9913. [Google Scholar] [CrossRef]
  31. Tan, H.; Zhou, K.; Yan, J.; Sun, H.; Pistolozzi, M.; Cui, M.; Zhang, L. Dual-functional red-emitting fluorescent probes for imaging beta-amyloid plaques and viscosity. Sens. Actuators B 2019, 298, 126903. [Google Scholar] [CrossRef]
  32. Zhou, K.; Yuan, C.; Dai, B.; Wang, K.; Chen, Y.; Ma, D.; Dai, J.; Liang, Y.; Tan, H.; Cui, M. Environment-Sensitive Near-Infrared Probe for Fluorescent Discrimination of Aβ and Tau Fibrils in AD Brain. J. Med. Chem. 2019, 62, 6694–6704. [Google Scholar] [CrossRef] [PubMed]
  33. Yang, H.L.; Fang, S.Q.; Tang, Y.W.; Wang, C.; Luo, H.; Qu, L.L.; Zhao, J.H.; Shi, C.J.; Yin, F.C.; Wang, X.B.; et al. A hemicyanine derivative for near-infrared imaging of β-amyloid plaques in Alzheimer’s disease. Eur. J. Med. Chem. 2019, 179, 736–743. [Google Scholar] [CrossRef] [PubMed]
  34. Ran, C.; Xu, X.; Raymond, S.B.; Ferrara, B.J.; Neal, K.; Bacskai, B.J.; Medarova, Z.; Moore, A. Design, Synthesis, and Testing of Difluoroboron-Derivatized Curcumins as Near-Infrared Probes for in Vivo Detection of Amyloid-β Deposits. J. Am. Chem. Soc. 2009, 131, 15257–15261. [Google Scholar] [CrossRef] [PubMed] [Green Version]
  35. Zhang, X.; Tian, Y.; Li, Z.; Tian, X.; Sun, H.; Liu, H.; Moore, A.; Ran, C. Design and Synthesis of Curcumin Analogues for in Vivo Fluorescence Imaging and Inhibiting Copper-Induced Cross-Linking of Amyloid Beta Species in Alzheimer’s Disease. J. Am. Chem. Soc. 2013, 135, 16397–16409. [Google Scholar] [CrossRef] [Green Version]
  36. Yang, Y.; Li, S.; Zhang, Q.; Kuang, Y.; Qin, A.; Gao, M.; Li, F.; Tang, B.Z. An AIE-active theranostic probe for light-up detection of Aβ aggregates and protection of neuronal cells. J. Mater. Chem. B 2019, 7, 2434–2441. [Google Scholar] [CrossRef]
  37. Fu, W.; Yan, C.; Guo, Z.; Zhang, J.; Zhang, H.; Tian, H.; Zhu, W.H. Rational Design of Near-Infrared Aggregation-Induced-Emission-Active Probes: In Situ Mapping of Amyloid-β Plaques with Ultrasensitivity and High-Fidelity. J. Am. Chem. Soc. 2019, 141, 3171–3177. [Google Scholar] [CrossRef]
  38. Wang, Y.; Qiu, Y.; Sun, A.; Xiong, Y.; Tan, H.; Shi, Y.; Yu, P.; Roy, G.; Zhang, L.; Yan, J. Dual-functional AIE fluorescent probes for imaging β-amyloid plaques and lipid droplets. Anal. Chim. Acta 2020, 1133, 109–118. [Google Scholar] [CrossRef]
  39. Xu, M.; Li, R.; Li, X.; Lv, G.; Li, S.; Sun, A.; Zhou, Y.; Yi, T. NIR fluorescent probes with good water-solubility for detection of amyloid beta aggregates in Alzheimer’s disease. J. Mater. Chem. B 2019, 7, 5535–5540. [Google Scholar] [CrossRef]
  40. Patel, K.; Shah, S.K.H.; Prabhakaran, P. Chapter Five—Aggregation-induced emission materials for protein fibrils imaging. Prog. Mol. Biol. Transl. Sci. 2021, 185, 113–136. [Google Scholar]
  41. Zems, Y.; Moiseev, A.G.; Perepichka, D.F. Convenient Synthesis of a Highly Soluble and Stable Phosphorescent Platinum Porphyrin Dye. Org. Lett. 2013, 15, 5330–5333. [Google Scholar] [CrossRef]
  42. Zhang, W.; Wang, Y.; Dong, J.; Zhang, Y.; Zhu, J.; Gao, J. Rational design of stable near-infrared cyanine-based probe with remarkable large Stokes Shift for monitoring Carbon monoxide in living cells and in vivo. Dyes Pigm. 2019, 171, 107753. [Google Scholar] [CrossRef]
  43. Levine, H. Thioflavine T interaction with synthetic Alzheimer’s disease β-amyloid peptides: Detection of amyloid aggregation in solution. Protein Sci. 1993, 2, 404–410. [Google Scholar] [CrossRef] [PubMed]
  44. Naiki, H.; Higuchi, K.; Hosokawa, M.; Takeda, T. Fluorometric determination of amyloid fibrils in vitro using the fluorescent dye, thioflavine T. Anal. Biochem. 1989, 177, 244–249. [Google Scholar] [CrossRef] [PubMed]
  45. Groenning, M.; Norrman, M.; Flink, J.M.; van de Weert, M.; Bukrinsky, J.T.; Schluckebier, G.; Frokjaer, S. Binding mode of Thioflavin T in insulin amyloid fibrils. J. Struct. Biol. 2007, 159, 483–497. [Google Scholar] [CrossRef] [PubMed]
  46. Rodríguez-Rodríguez, C.; Rimola, A.; Rodríguez-Santiago, L.; Ugliengo, P.; Álvarez-Larena, Á.; Gutiérrez-de-Terán, H.; Sodupe, M.; González-Duarte, P. Crystal structure of thioflavin-T and its binding to amyloid fibrils: Insights at the molecular level. Chem. Commun. 2010, 46, 1156–1158. [Google Scholar] [CrossRef]
  47. Ning, Z.W.; Wu, S.Z.; Liu, G.J.; Ji, Y.M.; Jia, L.Y.; Niu, X.X.; Ma, R.F.; Zhang, Y.; Xing, G.W. Water-soluble AIE-Active Fluorescent Organic Nanoparticles: Design, Preparation and Application for Specific Detection of Cysteine over Homocysteine and Glutathione in Living Cells. Chem. Asian J. 2019, 14, 2220–2224. [Google Scholar] [CrossRef]
Scheme 1. The synthesis route of TMNL.
Molecules 28 05110 sch001
Figure 1. The UV absorption spectra and fluorescence emission spectra of TMNL.
Molecules 28 05110 g001
Figure 2. (a) The fluorescence spectra of different concentrations (μM) of TMNL in PBS buffer solution (pH 7.4, 10 mM). (b) Scatter plot of fluorescence intensity at 645 nm of different concentrations of TMNL in PBS buffer solution (pH 7.4, 10 mM). λex = 360 nm.
Molecules 28 05110 g002
Figure 3. Fluorescence spectra of the excitation (a) and emission (b) of ThT (1 μM)-detecting Aβ1–42 (80 μg·mL−1) fibrils in PBS buffer solution (pH 7.4, 10 mM). λex = 410 nm, λem = 470 nm.
Molecules 28 05110 g003
Figure 4. (a) Fluorescence spectra of the interaction of TMNL with Aβ1–42 fibrils after different coincubation times in PBS buffer solution (pH 7.4, 10 mM). Insert: photograph of TMNL after complete interaction with Aβ1–42 fibrils (left) and in the absence of Aβ1–42 fibrils (right) in quartz cuvettes under 365 nm UV light. (b) Scatter plot of the relative fluorescence intensity (I/I0) at 496 nm of the different coincubation times of TMNL and Aβ1–42 fibrils in PBS buffer solution (pH 7.4, 10 mM). I and I0 represent the fluorescence intensity in the presence and absence of Aβ1–42 fibrils, respectively. [TMNL] = 1 μM, [Aβ1–42] = 80 μg·mL−1, λex = 360 nm.
Molecules 28 05110 g004
Figure 5. (a) Fluorescence spectra of the interaction of TMNL with different concentrations of Aβ1–42 fibrils (μg·mL−1) in PBS buffer solution (pH 7.4, 10 mM). (b) Scatter plot of the relative fluorescence intensity (I/I0) at 496 nm of the interaction of TMNL and different concentrations of Aβ1–42 fibrils (μg·mL−1) in PBS buffer solution (pH 7.4, 10 mM). I and I0 represent the fluorescence intensity in the presence and absence of Aβ1–42 fibrils, respectively. [TMNL] = 1 μM, λex = 360 nm.
Molecules 28 05110 g005
Figure 6. (a) The UV absorption spectra of different concentrations of TMNL in PBS buffer solution (pH 7.4, 10 mM). (b) UV absorption spectra of the interaction of TMNL (1 μM) with different concentrations of Aβ1–42 fibrils (μg·mL−1) in PBS buffer solution (pH 7.4, 10 mM).
Molecules 28 05110 g006
Figure 7. (a) Fluorescence spectra of the interaction of TMNL with different interfering substances and Aβ1–42 fibrils in PBS buffer solution (pH 7.4, 10 mM). (b) The histogram of relative fluorescence intensity (I/I0) at 496 nm of the interaction of TMNL with different interfering substances and Aβ1–42 fibrils in PBS buffer solution (pH 7.4, 10 mM). I represents the fluorescence intensity in the presence of the interfering substances or Aβ1–42 fibrils, and I0 represents the fluorescence intensity in the presence of TMNL alone. [Cys] = [GSH] = [HSO3] = [SO32−] = [CN] = 100 μM, [BSA] = [Aβ1–42] = 80 μg·mL−1; [TMNL] = 1 μM; λex = 360 nm.
Molecules 28 05110 g007
Figure 8. Saturation binding curves of different concentrations of TMNL interacting with Aβ1–42 fibrils. [Aβ1–42] = 80 μg·mL−1; λex = 360 nm.
Molecules 28 05110 g008
Figure 9. (a,b) TEM images of TMNL in PBS buffer solution (pH 7.4, 10 mM). (c,d) TEM images of TMNL after binding to Aβ1–42 fibrils in PBS buffer solution (pH 7.4, 10 mM). [TMNL] = 1 μM; [Aβ1–42] = 80 μg·mL−1.
Molecules 28 05110 g009
Figure 10. (a,b) Fluorescence staining images of TMNL in brain tissue sections of AD transgenic mice.
Molecules 28 05110 g010
Disclaimer/Publisher’s Note: The statements, opinions and data contained in all publications are solely those of the individual author(s) and contributor(s) and not of MDPI and/or the editor(s). MDPI and/or the editor(s) disclaim responsibility for any injury to people or property resulting from any ideas, methods, instructions or products referred to in the content.

