Article

Can Rare Earth Elements Be Considered as Markers of the Varietal and Geographical Origin of Wines?

1
Analytical Chemistry Department, Faculty of Chemistry and High Technologies, Kuban State University, Krasnodar 350040, Russia
2
Institute for Spectroscopy, Russian Academy of Sciences, Troitsk, Moscow 108840, Russia
3
North Caucasian Federal Research Center of Horticulture, Viticulture, Wine–Making, Krasnodar 350072, Russia
4
Institute for Geothermal Problems and Renewable Energy, Branch of the Joint Institute of High Temperatures of the Russian Academy of Sciences, Makhachkala 367030, Russia
*
Author to whom correspondence should be addressed.
Molecules 2023, 28(11), 4319; https://doi.org/10.3390/molecules28114319
Submission received: 5 April 2023 / Revised: 11 May 2023 / Accepted: 22 May 2023 / Published: 24 May 2023
(This article belongs to the Special Issue Advances in Detection of Trace Elements by Analytical Spectroscopy)

Abstract

:
The possibility of establishing the varietal and territorial affiliation of wines by the content of rare earth elements (REE) in them was studied. ICP–OES and ICP–MS with subsequent chemometric processing of the results were applied to determine the elemental image of soils containing negligible REE amounts, grapes grown on these soils, and wine materials of Cabernet Sauvignon, Merlot, and Moldova varieties produced from these grapes. To stabilize and clarify wine materials, the traditional processing of wine materials with various types of bentonite clays (BT) was used, which turned out to be a source of REE in the wine material. Discriminant analysis revealed that the processed wine materials were homogeneous within one denomination and that those of different denominations were heterogeneous with respect to the content of REE. It was found that REE in wine materials were transferred from BT during the processing, and thus they can poorly characterize the geographical origin and varietal affiliation of wines. Analysis of these wine materials according to the intrinsic concentrations of macro- and microelements showed that they formed clusters according to their varietal affiliation. In terms of their influence on the varietal image of wine materials, REE are significantly inferior to macro- and microelements, but they enhance their influence to a certain extent when used together.

1. Introduction

The confirmation of the quality and authenticity of dry wines and the control of the processes of their blending require the use of new analytical approaches allowing the consideration of wines as a whole based on the analysis of their “images”. In this case, the identification of the origin of wines is controlled by the characteristic components or elemental profiles (electrophoretic, chromatographic, and elemental) inherent to the studied sample of wine [1,2,3,4]. Due to the specificity of the obtained profiles, this approach makes it possible to determine the quality and affiliation of wines, to detect counterfeit products, and to identify wines by variety and origin [5,6,7].
In fact, the mineral composition is one of the main indicators of the classification of the varietal and geographical affiliation of wines due to the stability of the elemental composition of soils of grapes growing [8,9]. The relationship between the mineral composition in the soil–grape–wine chain makes it possible to establish the varietal and geographical origin of wine with high reliability due to the stability and specificity of the elemental composition of the grape variety cultivated in a particular area [8,9,10].
In many studies, rare earth elements (REE) have been considered as markers of the varietal and geographical origin of wines [11,12,13,14,15,16,17]. Many authors have used REE contents to distinguish wines from different regions of Italy [18,19], Spain [20], France [21], Germany [22], the USA [21,23], Australia [24], and South America [25].
The possibility of using REE as varietal markers based on the relationship between the contents of these elements in soil samples and various parts of grapes (berries, juice, leaves, seeds, and skins) was shown in [12]. Due to the different absorption of REE by the grape from volcanic soils characterized by a high content of these metals, each wine sample was found to belong to a particular grape variety. In Spain, 7 out of 12 studied regions of grape growth were identified by their REE concentrations [16]. The remaining regions, which were not properly differentiated, were additionally characterized taking into account the contents of Ba, Co, Cr, Mn, Ni, Pb, and V. Based on the contents of 31 elements, including REE, a model was obtained by chemometric methods, allowing the differentiation of samples of red wines of the Chianti region from other Italian regions [14].
Most of the above studies are aimed at studying the finished product, wine, which makes it difficult to establish its geographical origin [26,27,28]. Ideally, the elemental composition of wine should depend only on the mineral composition of the soil, grapes, and climatic conditions of its cultivation and not on the technology of production, transportation, or storage. However, the relationship in the soil–grape–wine chain is broken due to the fact that the elemental composition of wine is significantly affected by technological methods of their production, for example, their stabilization and clarification with auxiliary materials to remove an excess of components forming a haze of a various nature [10,26,27,28,29].
Magdas et al. [17] considered the possibilities and problems of using REE for the estimation of the quality of products, while they noted the low efficiency of REE applications in identifying wines. The limitation of using REE as a geographic marker is mainly due to the changes in the elemental composition during the production of wines. The authors of [13,22,30] noted that there was a significant increase in the concentrations of REE in wine materials at the stage of stabilization and clarification. It was noted [18,31] that very often, REE were absent in wine materials produced in different territories or their concentrations were negligible; therefore, the use of REE as markers of the geographical and varietal origin requires specific investigations for different regions of wine production. The only obvious fact is that the elemental image of wine, including the content of REE, can be significantly changed at various stages of wine production.
The purpose of this work is to assess the possibility of using REE as markers of the geographical origin, variety, formation of the cluster structure, and elemental image of wines. The paper presents the data of ICP–OES and ICP–MS studies of the elemental image of soils, grapes grown on soils, and wines of Cabernet Sauvignon, Merlot, and Moldova varieties produced from these grapes. All investigated wines were processed with bentonite clays (BT) at the stage of wine material stabilization and clarification. A total of 32 samples of BT of various compositions and from different manufacturers was used during the analysis of wine production.

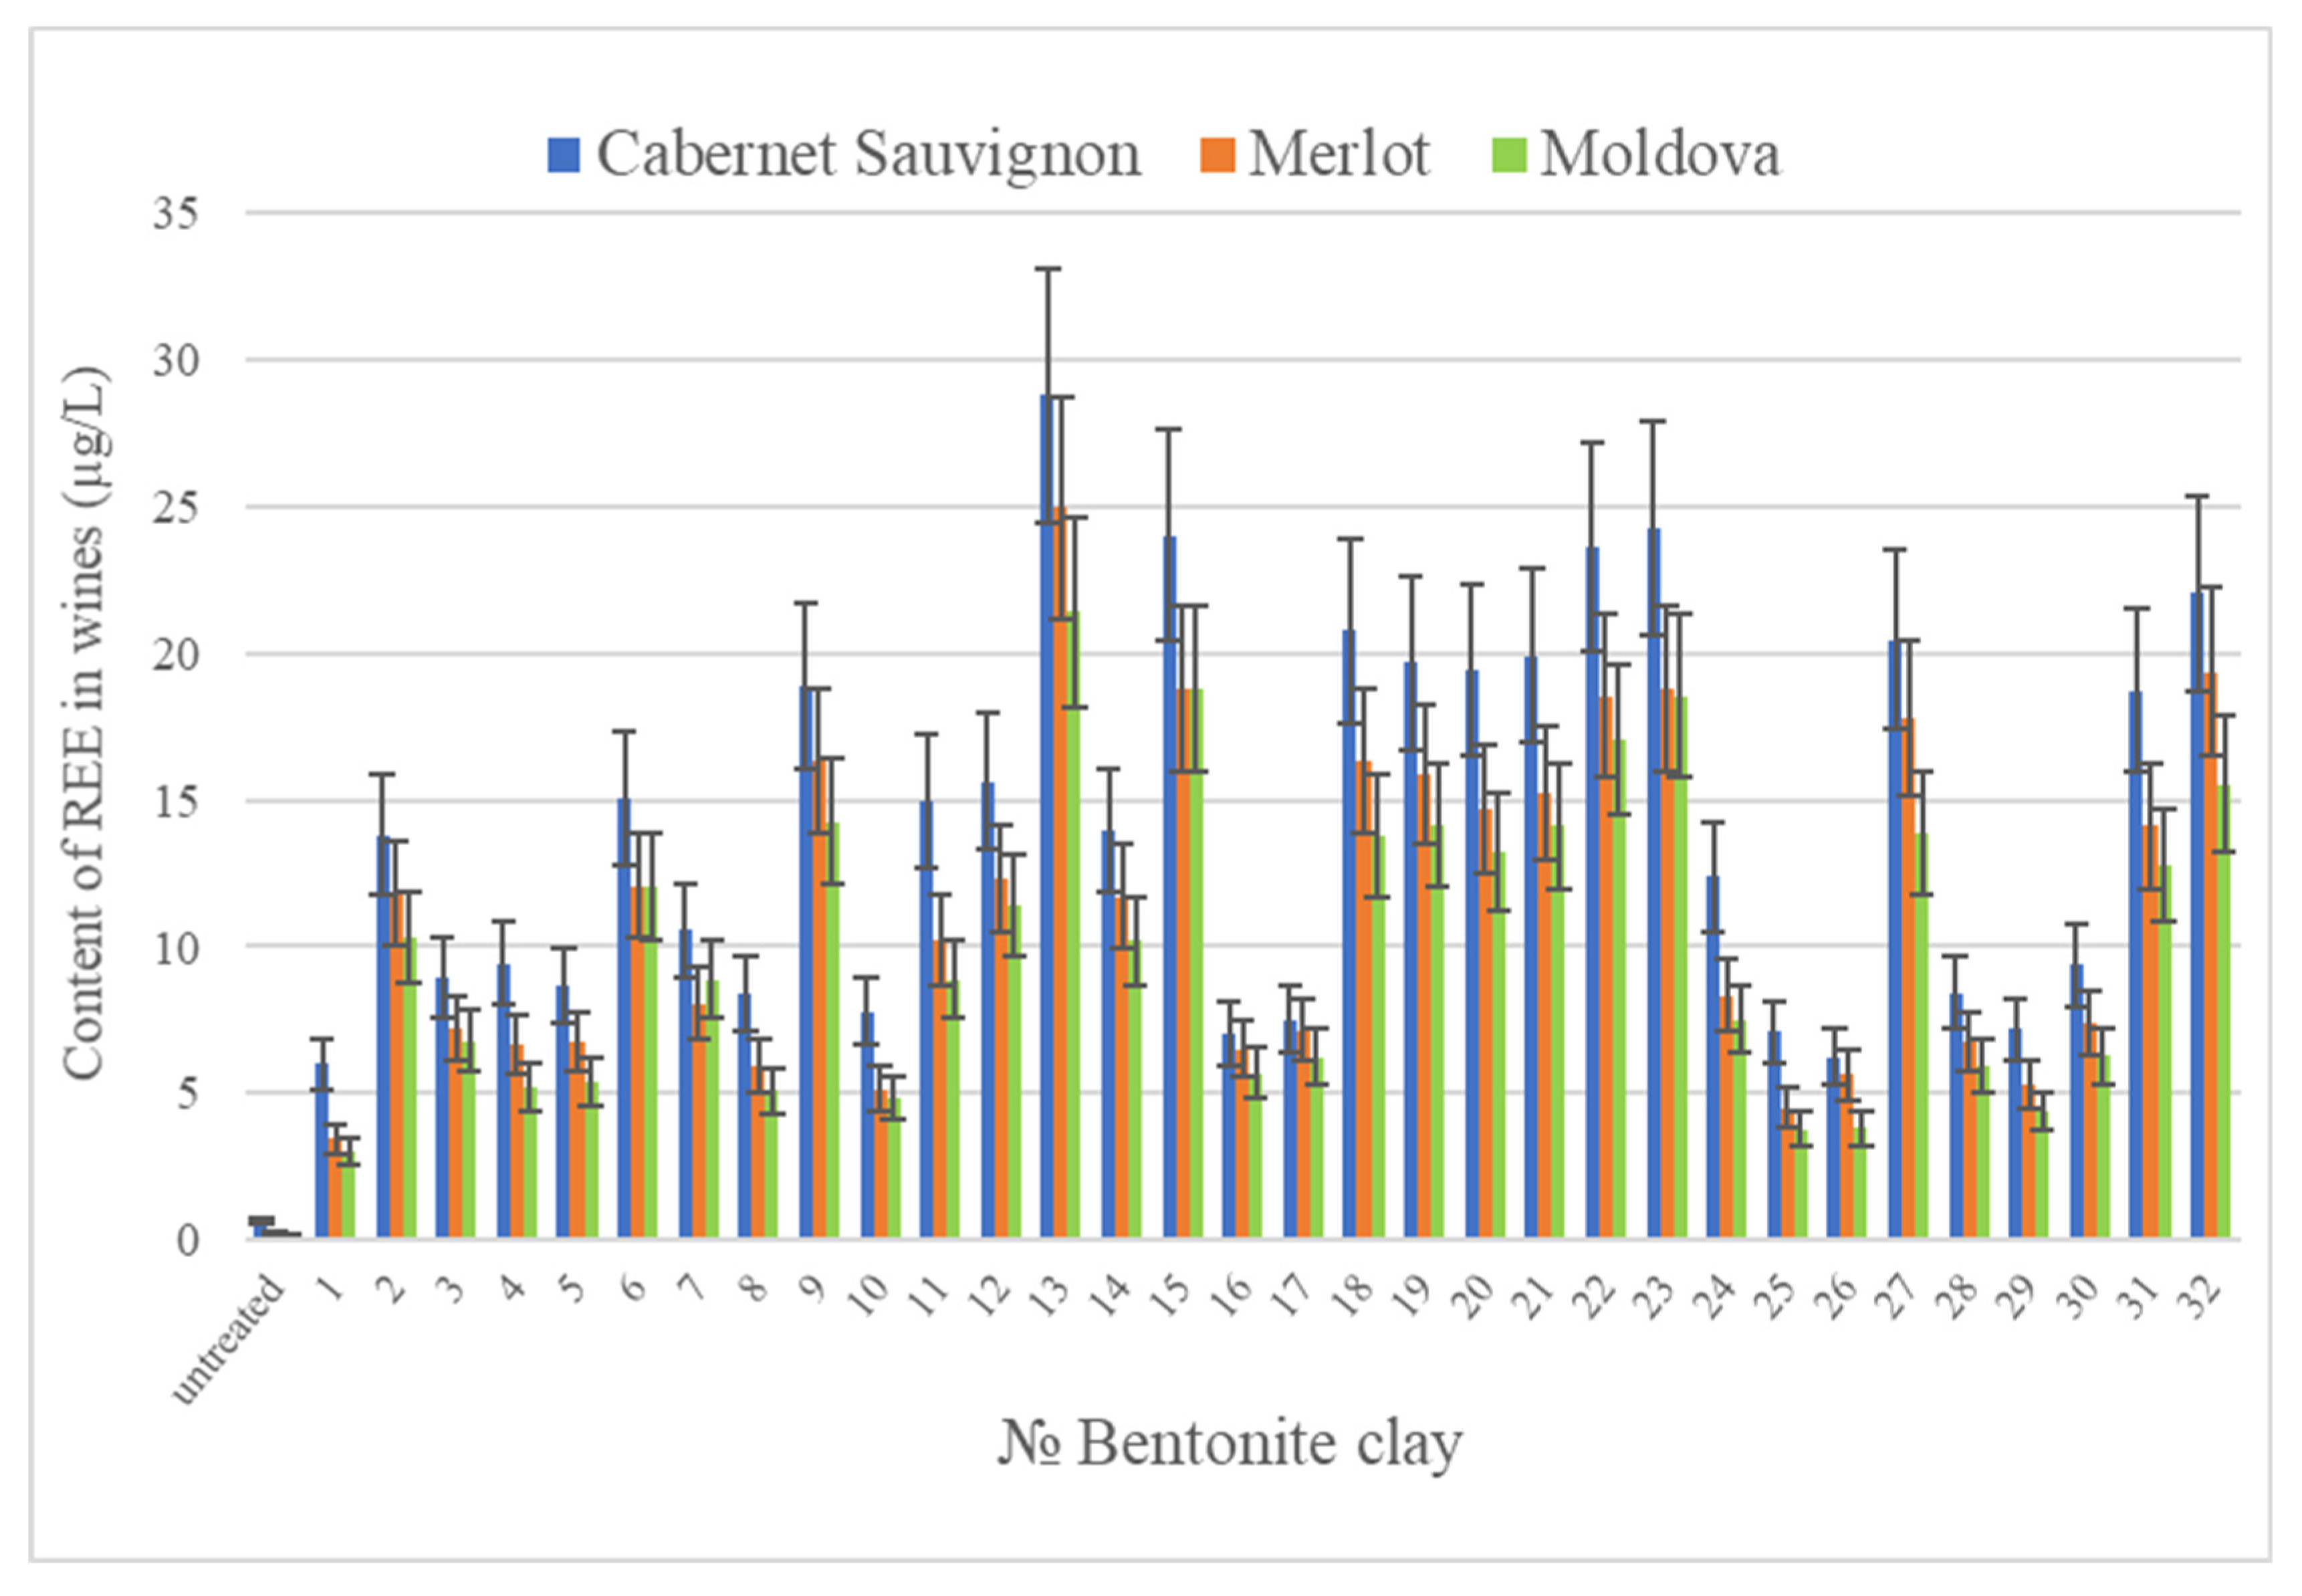
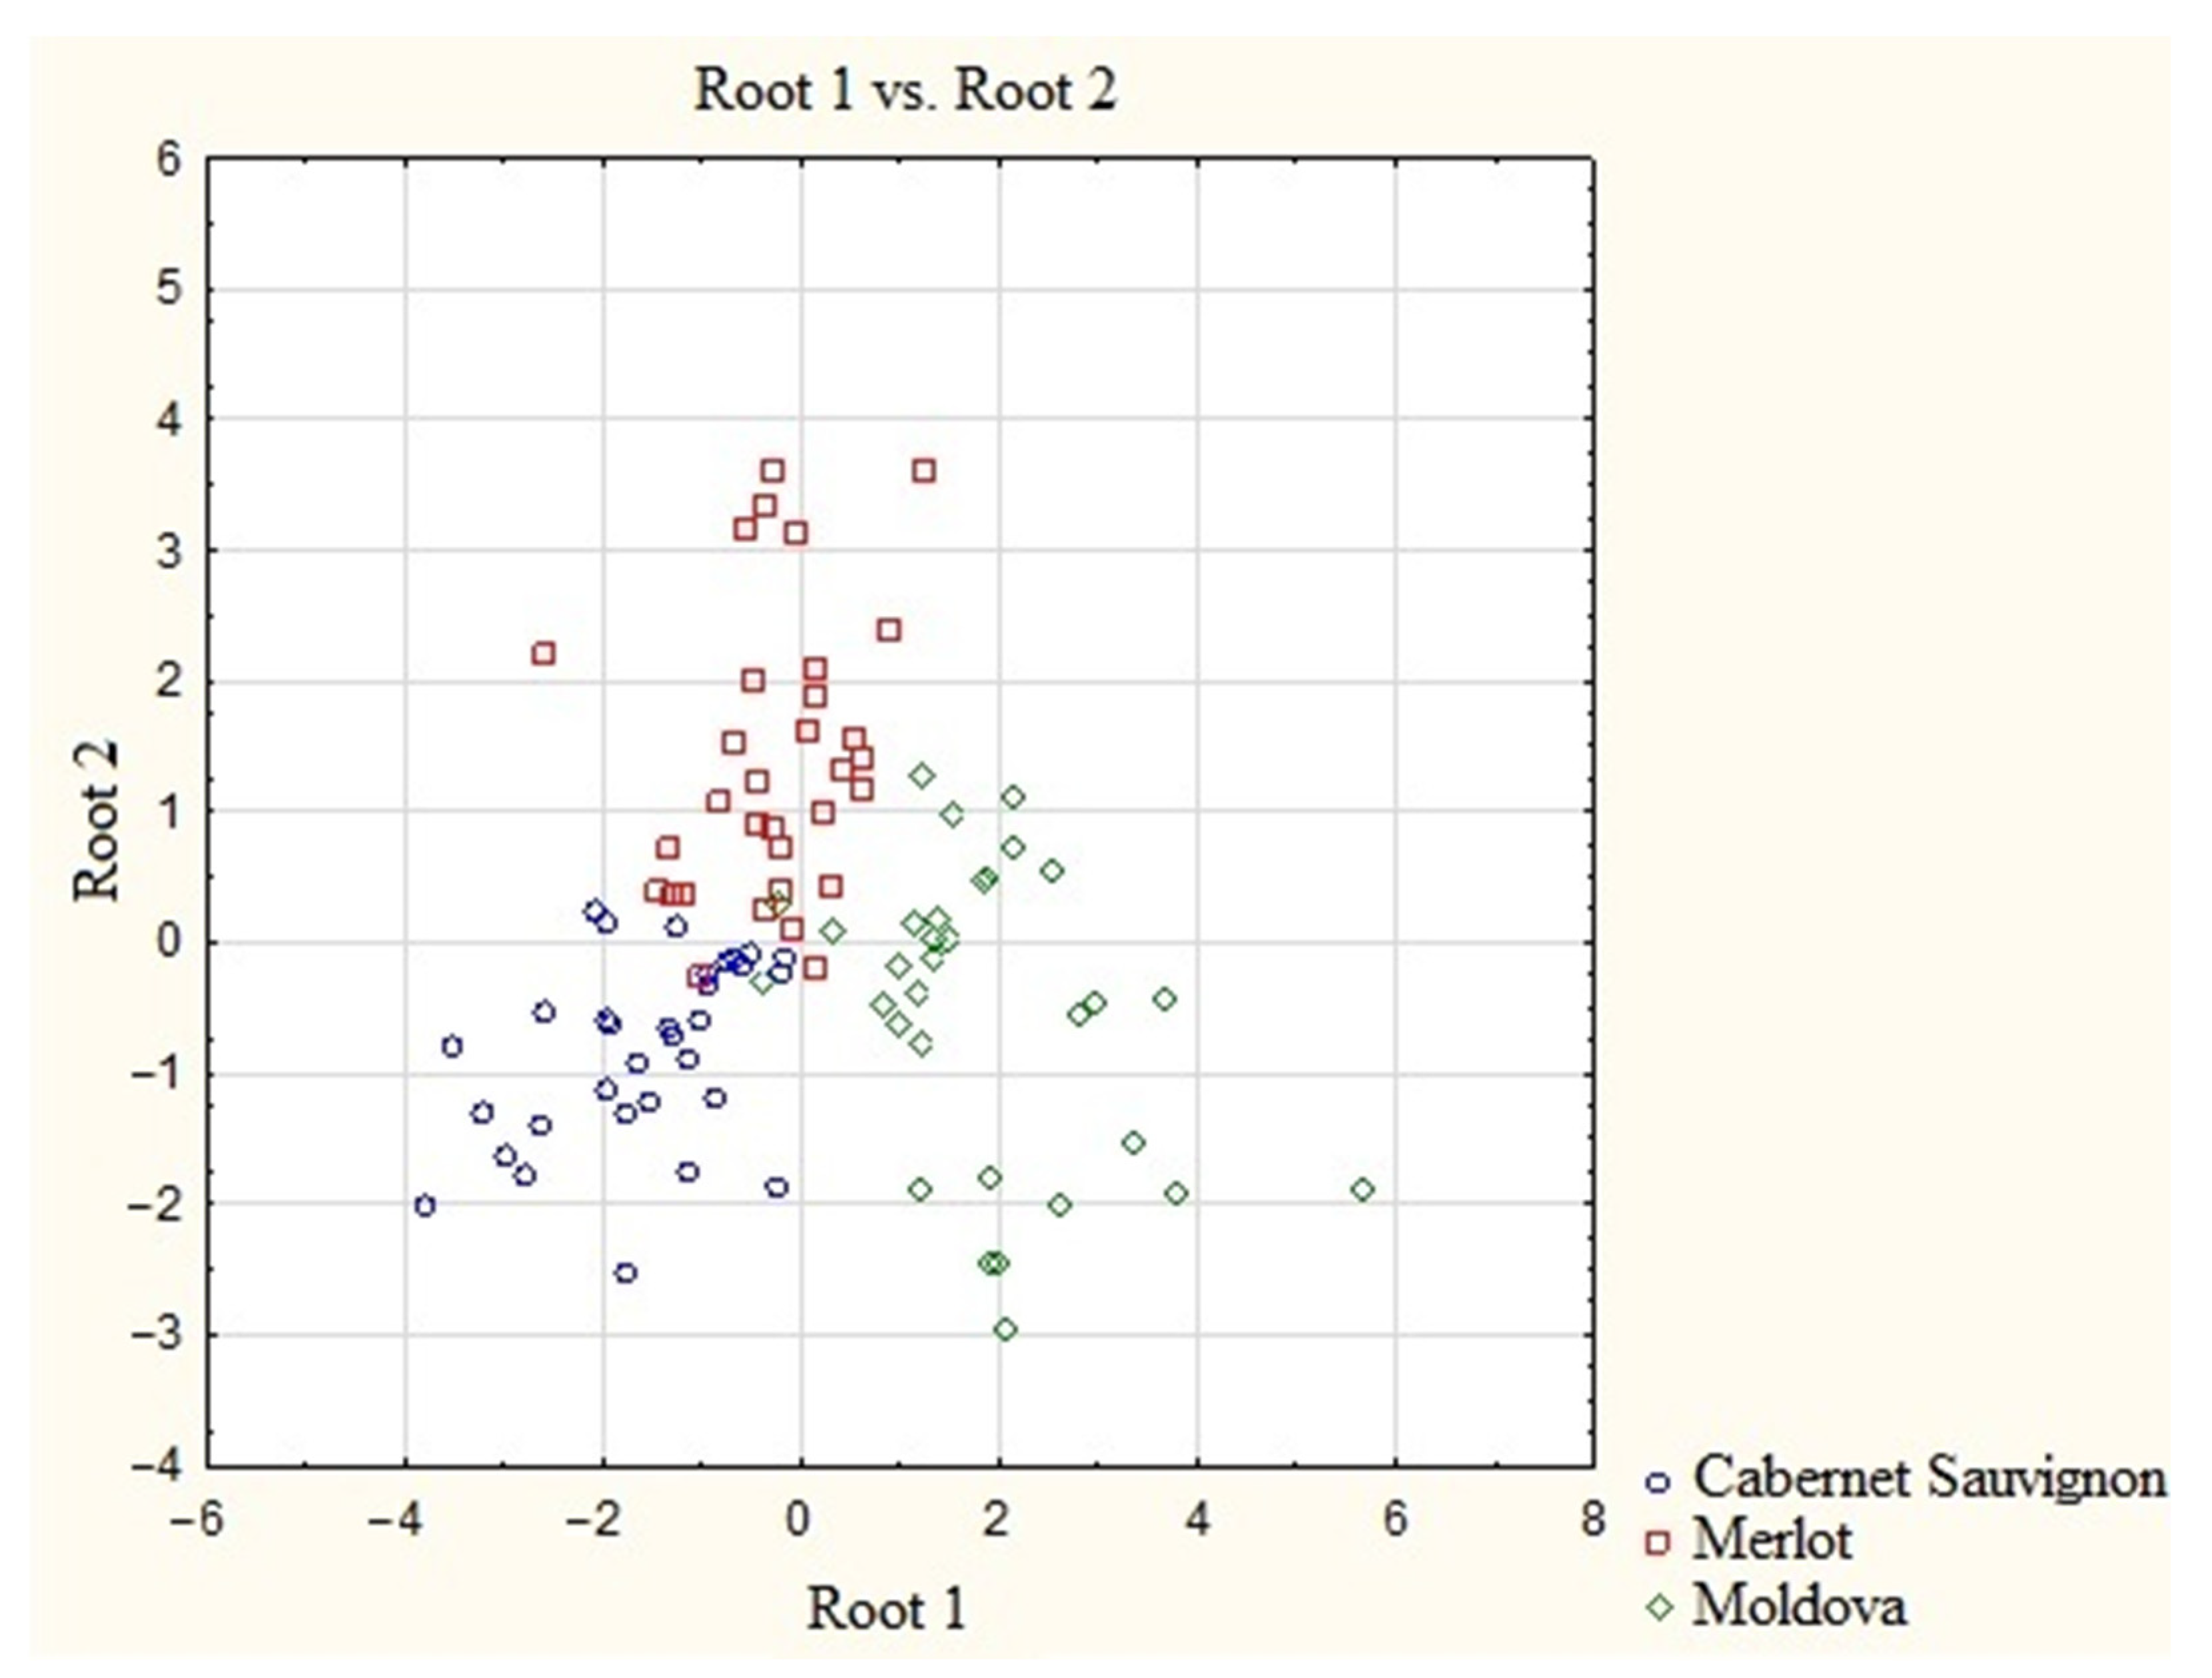
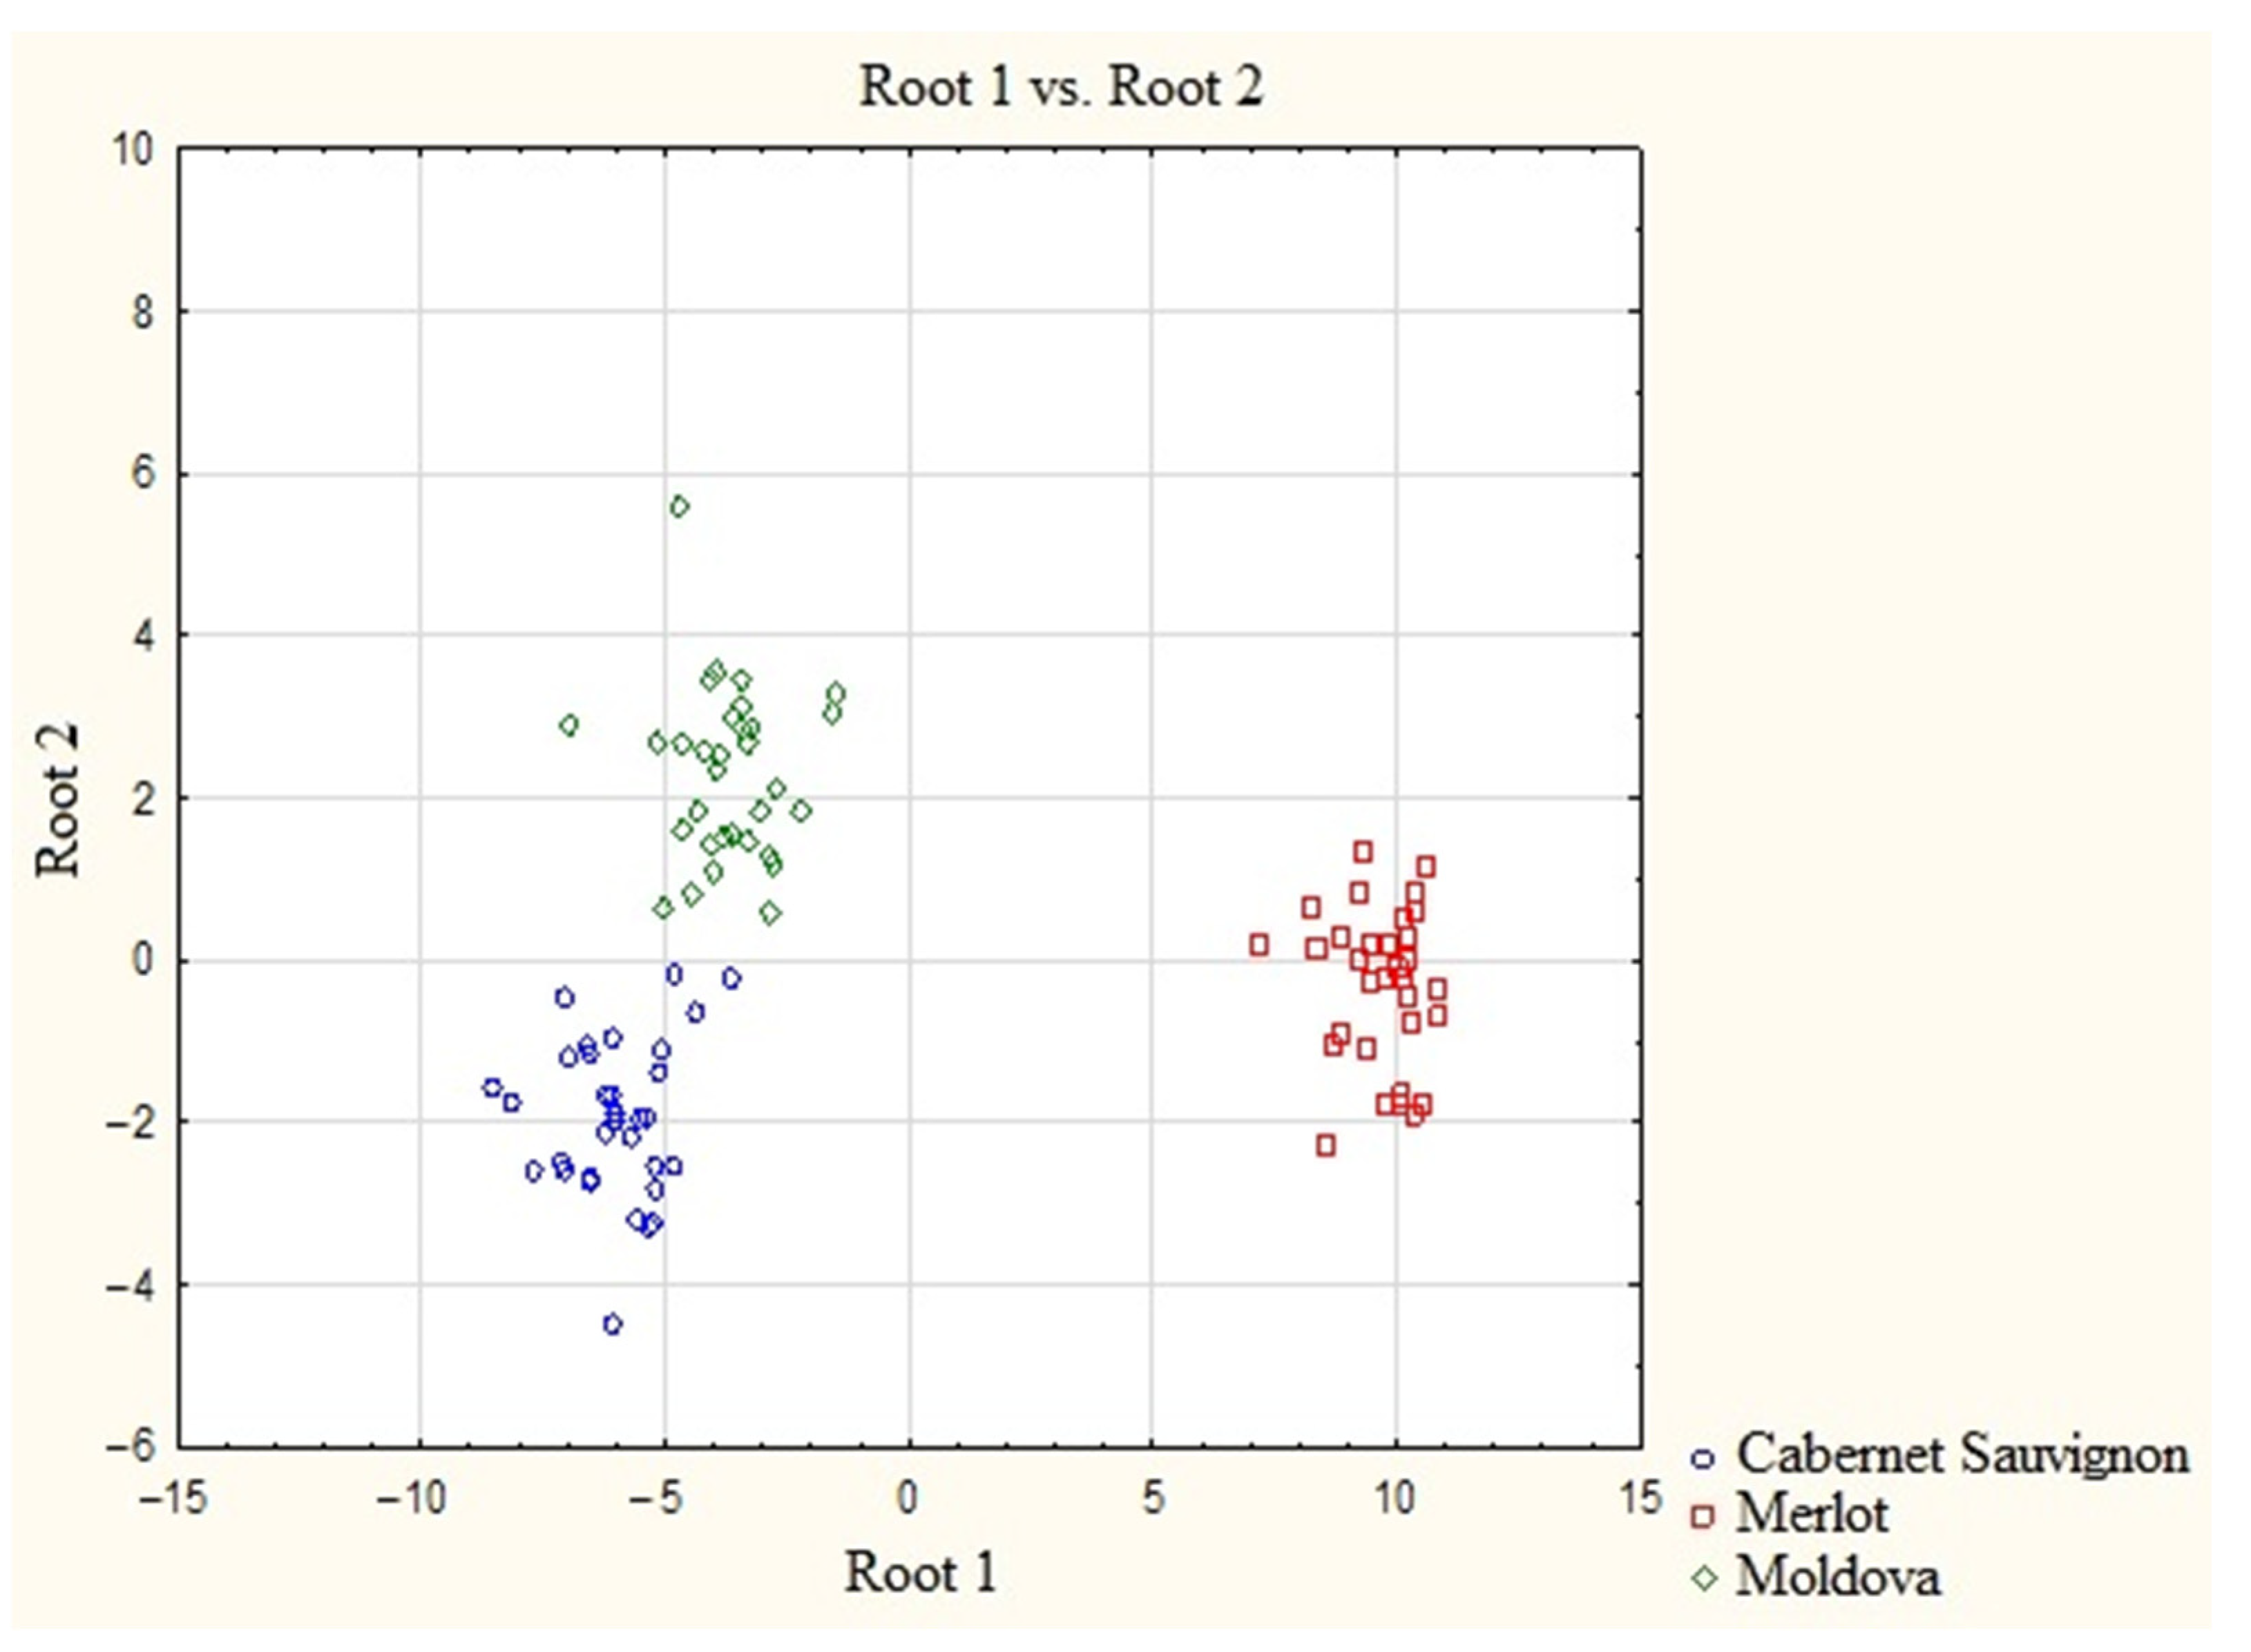
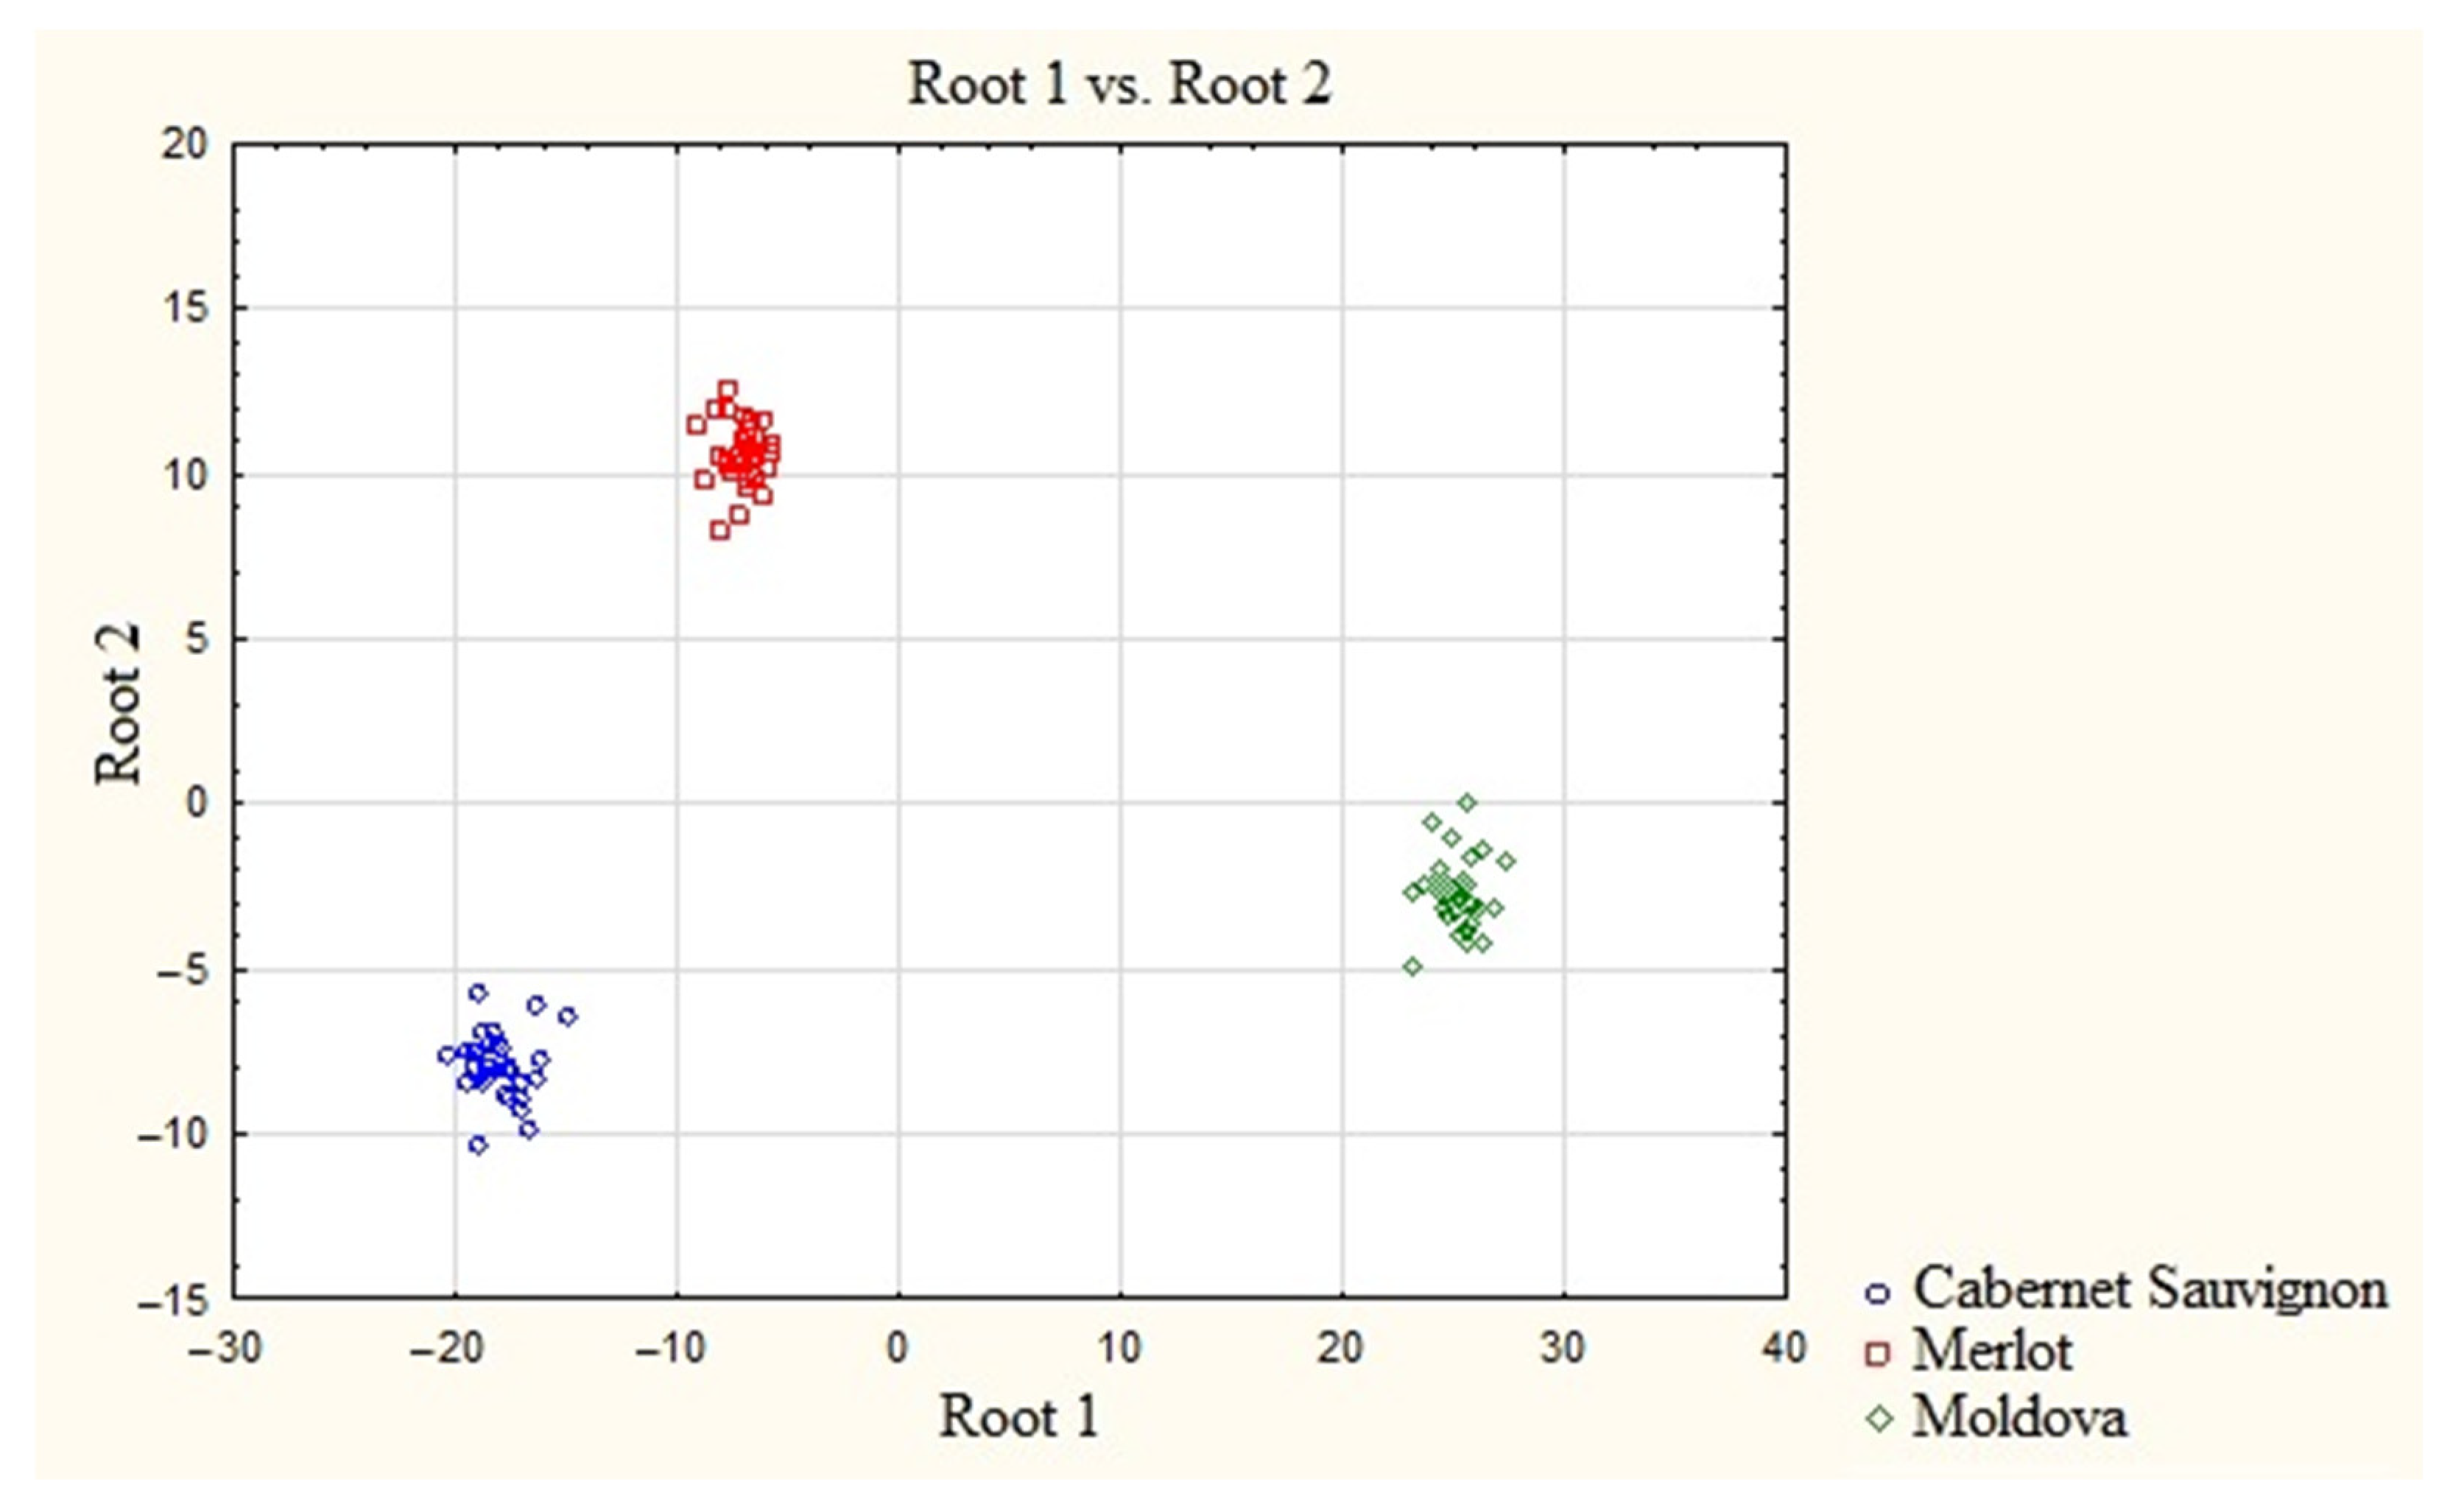
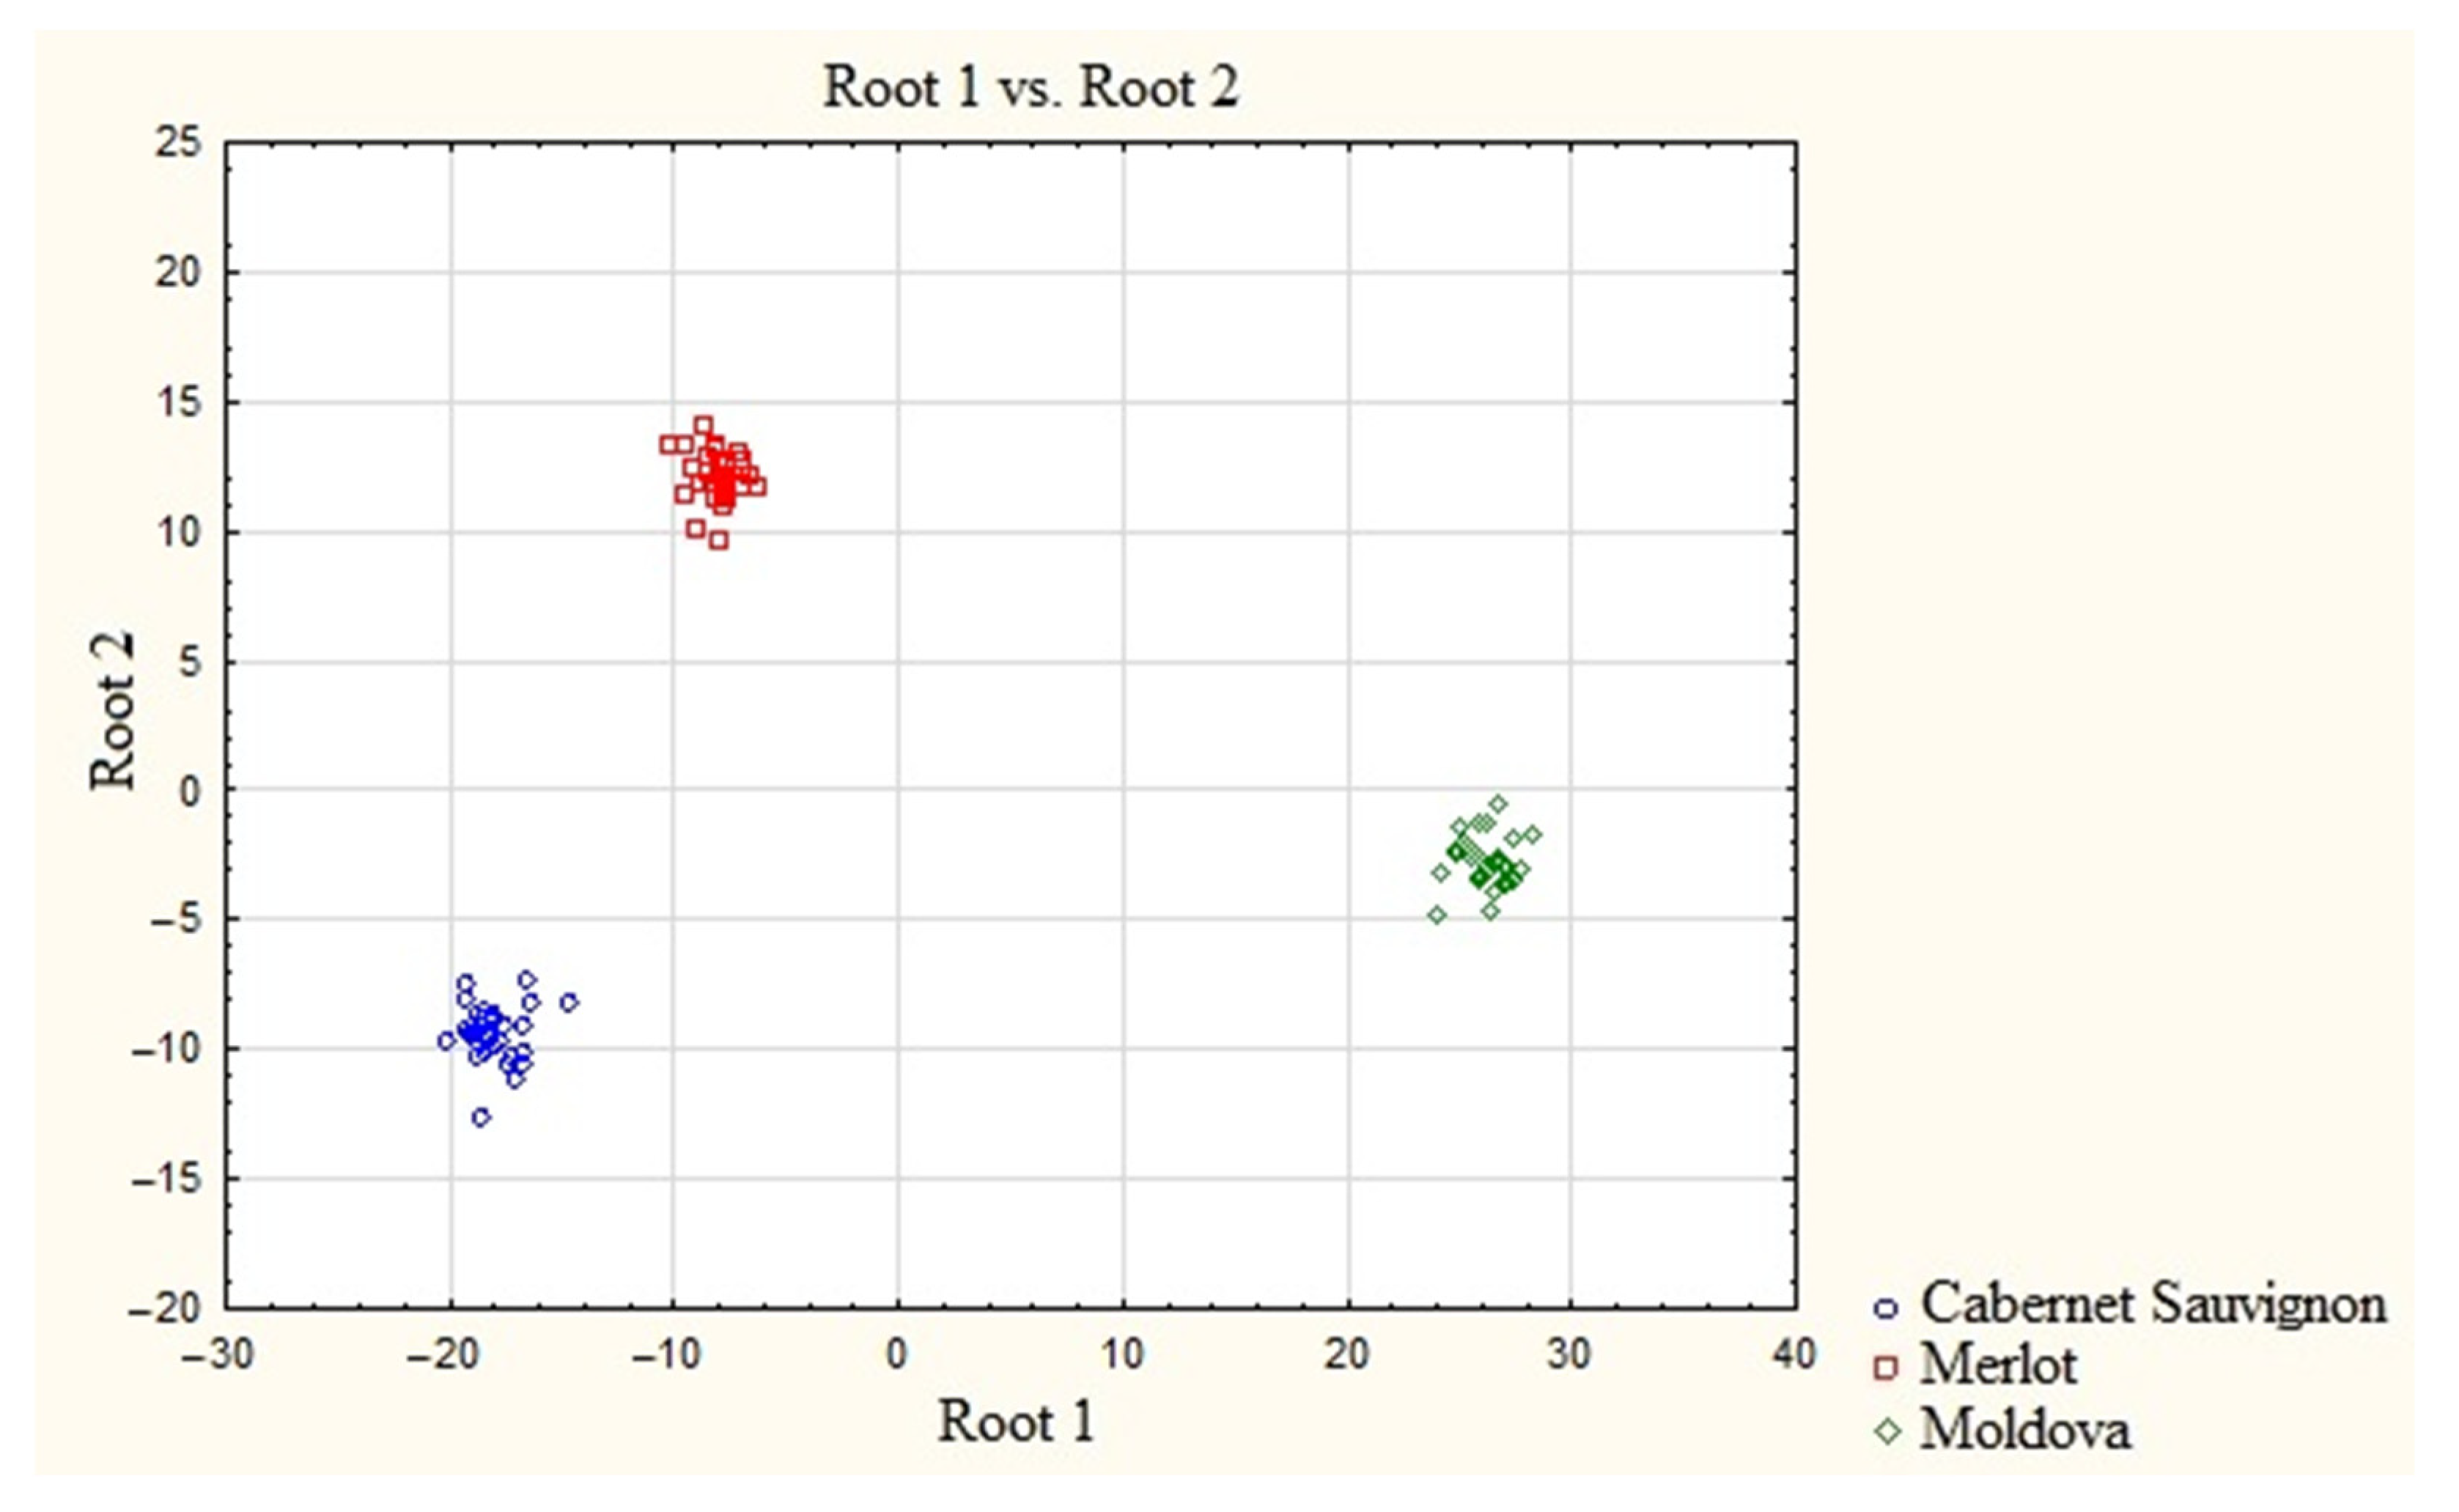
2. Results and Discussion

A comparison of the elemental compositions of BT (Table 1) and tested wine materials (Table 2) proves that REE are introduced in the wine materials during the processing of rare materials by BT. The levels of almost all REE in the studied untreated wine materials were below the limits of quantification (LOQ), despite the high sensitivity of the spectrometer [32] (Table 2), although their contents in the final products were reliably recorded. It seemed important to determine the sources of REE entry into the analyzed wines and to establish a possible correlation of their contents with the quality of soils in the grape-growing region. The presence of Y, La, and Ce in untreated wine materials (Table 2) may be associated with anthropogenic impact, namely the introduction of soil improvers, fertilizers, pesticides, air pollution, or irrigation water [27,33].
The total content of REE in the BT samples combined by groups differs (Table 1). The average minimum content of the total REE is observed in the BT samples of the fourth (7.93 μg/g), then the second (10.03 μg/g), the first (11.83 μg/g), and the third (12.32 μg/g) groups. BT significantly increases the content of REE in wine materials and there is a multiple increase in the concentrations of Ce (4–6), Y (2–19), and La (2–24) relative to their initial content in the wine materials, probably due to ion exchange (Table 2). The concentrations of Tm and Lu in the wine material of the Cabernet Sauvignon variety, Pr, Ho, Tm, and Lu in Merlot and Pr, Tb, Ho, and Tm in Moldova change the least. Notably, the greatest contribution of REE from BT to wine material is observed for the Cabernet Sauvignon variety, followed by Merlot and Moldova (Figure 1). The general nature of the increase in the content of REE in wine materials is quite similar—the greatest contribution to the increase in the content of REE in wine materials of all varieties is made by BT of the third (BT13, BT20, BT21, BT22, and BT27) and the first (BT19, BT23, and BT32) groups, as well as BT15 from the second group, the smallest—BT1 (Figure 1).
Table 3 shows the total contents of REE and trace elements (Ag, Al, As, Ba, Be, Bi, Cd, Co, Cs, Cu, Fe, Gd, Ge, Ho, Li, Mo, Mn, Nb, Ni, Pb, Ru, Sb, Sn, Sr, Ta, Th, Ti, Tl, U, V, W, Y, Zn, and Zr) after processing wine materials by BT of various groups. More detailed data on the effect of stabilization and clarification by BT on the elemental image of various varieties of wine materials are given in the Supplementary Material to the article.
There is a notable fact of an increase in the concentrations of REE and microelements in wine materials after treatment by BT of all groups. In addition, the introduction of BT of the same group during the clarification of different varieties of wine materials affects their elemental image in different ways.
Maximal concentrations of Pr and Eu were observed in Cabernet Sauvignon wine after clarification by BT of the first group; after clarification by BT of the second group—Y, Dy, Ho, Er, Tm, Yb, and Lu; and after BT of the third group—La, Ce, Nd, Sm, Gd, and Tb. Maximal concentrations of Eu were observed in Merlot wine material clarified by BT of the first group; by BT of the second group—Y, Tb, Ho, Er Tm, Yb, and Lu; and by BT of the third group—La, Ce, Pr, Nd, Sm, Gd, and Dy. In the wine material of Moldova, the maximum concentrations of La, Ce, Pr, Eu, and Ho were found after clarification by BT of the first group; Y, Er, and Lu after clarification by BT of the second group; and La, Nd, Sm, Gd, Tb, Dy, and Yb—after clarification by BT of the third group. The smallest change in the elemental composition of REE in all wine materials was caused by the BT of the fourth group.
Possible relationships between REE concentrations in bentonites and processed wine materials were studied by canonical correlation analysis (Table 4). For all three varieties of wine materials, the canonical correlation coefficients R were close to 1 (R = 0.99), indicating a high relationship between the REE content in bentonites and processed wine materials. The pair correlation coefficients r between the concentrations of REE in BT and wines shown in the table indicate strong relationships (r > 0.75), which are statistically significant (p < 0.05), and the content of REE in processed wine materials is directly proportional to their content in BT.
The possible varietal difference/similarity of samples of processed Cabernet Sauvignon, Merlot, and Moldova wine materials by the REE content in them was studied by discriminant analysis (Table 5). The predictors (independent variables) of the discrimination model were REE concentrations in BT-treated wine materials (32 samples each) and the grouping (dependent) variable was the wine material variety. The main criterion for evaluating the effectiveness of discrimination is the Wilks’ Lambda value, the total value of which for discriminant analysis, taking into account all the variables involved, is presented in the upper part of Table 5. Opposite each of the variables is the Wilks’ Lambda value for analysis in the case when this variable is not used. The Partial Lambda value characterizes the Wilks’ Lambda ratio after and before adding the corresponding variable. The Partial Lambda characterizes the single contribution of the corresponding variable to the separating force of the model.
The proximity of the Wilks’ Lambda (0.169) to zero in the upper box of Table 5 indicates successful discrimination, showing that the processed wine materials form clusters according to their varietal affiliation. Such discrimination confirms that wine materials within one denomination are homogeneous and have similarities in terms of the REE content. At the same time, wine materials of different denominations are heterogeneous with respect to the content of REE in them. Based on the Wilks’ Lambda value, which is the result of the exclusion of the corresponding metal from the discrimination model, the metal contribution to the separation procedure can be assessed: the larger its value, the higher the contribution, and hence the role of this metal in the model. Table 5 shows the sequence of REE in descending order in terms of their contribution to the discrimination model and the formation of a varietal cluster structure of wine materials. It can be seen that the largest contribution to the formation of the varietal cluster structure of wine materials based on the REE content is provided by Yb, then Lu, Sm, etc., and the smallest contribution is provided by Ho. At the same time, the contribution of sx elements (Yb, Lu, Sm, Gd, Er, and Dy) to discrimination is statistically significant—the significance level of the Fisher p-test is less than 0.05 (highlighted in bold).
A graphical illustration of the presence of a varietal cluster structure is a scatterplot of canonical values (Figure 2) with the presentation of wine materials as points on a plane. The areas of grouping the canonical values of wine materials have different configurations and colors depending on the variety. This representation allows the visual assessment of the degree of similarity/difference between the varieties through distances according to the principle: the smaller the distance, the greater the similarity. The resulting graphic illustration shows that the distances between all varieties of wine materials are small despite the presence of a cluster structure, which means that inter-varietal differences are not sufficiently pronounced, especially between Cabernet Sauvignon and Merlot. Therefore, the use of REE as markers of the studied varieties of Kuban wine materials is problematic as it can lead to erroneous final results of their identification.
The cluster structure was significantly improved by adding macroelements, i.e., Ca, Mg, K, and Na, to the list of predictors in addition to REE as varietal markers of processed wine materials (Figure 3). In this case, the degree of homogeneity of the groups and the similarity between the cluster structures of wine materials improved. However, using the combination of REE and macroelements as varietal markers is insufficient for a correct analysis.
In a previous work [34], we studied the role of macro elements, i.e., Ca, Mg, K, and Na, and microelements, i.e., Li, Co, Zr, Mo, Cd, Cu, Zn, Be, Ge, Nb, Rb, and Pb, in maintaining inter-varietal differences in wine materials. The combination of macro- and microelements led to a significant increase in intra-varietal similarity and inter-varietal differences in wine materials (Figure 4).
On the other hand, as a result of ion exchange, REE are included in the component composition of the wine material and, given the fact that their distribution is also different depending on the wine material variety, we considered their influence in maintaining inter-varietal differences in the composition with other elements. For this purpose, macro- and microelements were added to the REE predictors (Figure 5). Notably, the elemental images of wine materials after adding REE to the discrimination procedure retain the nature of the varietal difference in the elemental images of wine materials. The addition of REE had a slight effect on the elemental images of wine materials, increasing their intra-varietal similarity and inter-varietal differences. The weak influence of REE in the formation of the image of wine material is most likely due to the initial low content of REE in the soils of the grape-growing region.

3. Materials and Methods

3.1. Research Objects

The studies were carried out with wine materials produced from Cabernet Sauvignon, Merlot, and Moldova grape varieties. The grapes were harvested in September 2019 in the Temryuk region (Cabernet Sauvignon variety) and Krasnodar (Merlot and Moldova varieties) in the Krasnodar Territory, Russia. The processing of grapes and the production of wine materials were carried out in accordance with the general rules of the production of wines [35]. The procedure for processing grapes and obtaining wine materials is described in more detail in [29].
The stages of clarification and stabilization of wine materials by BT were studied using 32 samples of bentonite clays produced in different countries, with varying degrees of dispersion and trademarks (Table 6). All BT samples, except Khakass (BT13), Dagestan (BT15), and Crimean (BT27) origin are traditionally used in commercial wine-making technologies. Materials for claying wine materials (BT13, BT15, and BT27) were prepared from clays selected from deposits in the republics of Dagestan, Khakassia, and Crimea, considering the requirements for the production of wines [36].
In total, the studies were carried out with 99 samples from Cabernet Sauvignon, Merlot, and Moldova grape varieties, which included 3 initial and 96 samples of wine materials treated with bentonite clays (32 of each variety).
Inorganic Ventures IV-STOK-26 (USA) containing Ce, Dy, Er, Eu, Gd, Ho, La, Lu, Nd, Pr, Sm, Tb, Tm, Y, and Yb (10 mg/L of each element) were used to prepare calibration solutions. For the BT sample digestion, individual mineral acids were used: 15.4 mol/L HNO3, 25 mol/L HF, and 12 mol/L HCl (Sigma Aldrich, St. Louis, MO, USA). Solutions were prepared using deionized water (18.2 MΩ cm−1) obtained on a DuoPUR sub distillation unit (Milestone, Milan, Italy).

3.2. Procedures

3.2.1. Wine Clarification and Stabilization Using BT

The clarification and stabilization of wine materials by BT was carried out according to the generally accepted technology in the scientific center “Winemaking” of the Federal Scientific Center for Horticulture, Viticulture, and Winemaking, Krasnodar, Russia [37]. A more detailed procedure for the clarification and stabilization of wine materials is described in [29].

3.2.2. Elemental and X-ray Diffraction Analysis of BT

To study the possible effect of the procedure of clarification and stabilization by BT on the content of REE in wine materials, an X-ray phase analysis of the investigated fining agents was carried out on a Shimadzu XRD-7000 diffractometer (Shimadzu, Kyoto, Japan). According to the results of the X-ray phase analysis, the BT samples were divided into four groups, considering their qualitative and quantitative composition [29]. The first group included samples BT2, BT5, BT9, BT18, BT19, BT23, BT25, BT26, BT28, BT30, and BT32, which were based on sodium montmorillonite, the phase composition of which includes up to 3% of calcite (CaCO3). The second group included BT1, BT7, BT10, BT12, BT14, and BT15 with a base of sodium–calcium montmorillonite and up to 3% of quartz. The third group, i.e., BT3, BT4, BT6, BT8, BT13, BT16, BT17, BT20, BT21, BT22, BT24, BT27, and BT31, contained various forms of montmorillonite with quartz and calcite contents of more than 5%. The fourth group included BT11 and BT29. Sample BT11 was a mixture of sodium–calcium montmorillonite, 10% quartz, and BT29 in addition to sodium–calcium montmorillonite it contained approximately 4% of a non-clay mineral albite and silicon oxide in the form of cristobalite.
The elemental composition of BT was determined by inductively coupled plasma mass spectrometry (ICP–MS) on an iCAP RQ spectrometer (Thermo Scientific, Waltham, MA, USA). Sample introduction was performed using a borosilicate nebulizer MicroMist (Glass Expansion, Melbourne, Australia). The spray chamber was cooled to 2.8 °C by a Peltier element sample aerosol solution. The compromising balance between the sensitivity and minimization of the matrix effect was achieved by the construction of the spectrometer interface (Ni-sampler 1.1 mm diameter, Ni-scimmer 0.5 mm diameter, and 3.5 mm scimmer insert). Samples were prepared for analysis using a MARS 6 microwave system (CEM, Charlotte, NC, USA) considering the recommendations of the system manufacturer (digestion of clay) [38]. Then, 0.2 g of each BT sample was transferred to the vessel accompanying the microwave system employed and 5.0 mL of concentrated HF, 3.0 mL of concentrated HNO3, and 1.0 mL of concentrated HCl were added. The mixture in the flask was gradually heated up to 200 °C for 15 min, then kept at this temperature for 10 min. To eliminate the loss of volatile elements, the flasks were opened at a temperature below 40 °C, then the samples were transferred into 50 mL flasks and made up to the mark with deionized water.

3.2.3. Determination of REE in Wines

The concentrations of REE in wine materials were determined by ICP–MS. A 10-fold dilution of wine samples with deionized water was chosen taking into account the literature data on their multi-element composition and the sensitivity of the analytical instruments used [39,40,41].
Considering the possible REE contents in wine materials, calibration curves were constructed using a set of standard solutions of Y, La, Ce, Pr, Nd, Sm, Eu, Gd, Tb, Dy, Ho, Er, Tm, Yb, and Lu with the analyte concentrations in a 0.001–20 µg/L range. The analysis conditions and operating parameters of the spectrometers are given in Table 7. The procedure for determining macro- and microelements in wine materials by the ICP–OES method is described in [29].

3.2.4. Statistical Analysis

The relationship between the content of REE in BT and processed wine materials was established by correlation analysis. The degree of similarity/difference between samples of processed and unprocessed wine materials in terms of the REE content was assessed by discriminant analysis. The calculations were carried out using the STATISTICA program (v.13) [42].

4. Conclusions

The discriminant analysis of the elemental composition of wine materials obtained from grape varieties grown on soils practically free of REE has confirmed that they are introduced during the processing of wine materials and poorly characterize their varietal and regional affiliation. The resulting graphic illustration shows that, despite the presence of a cluster structure, the distances between all varieties of wine materials are small, which means that inter-varietal differences are not sufficiently pronounced, especially between Cabernet Sauvignon and Merlot. The processed wine materials within one denomination were homogeneous, and the wine materials of different denominations were heterogeneous in terms of their REE content. However, these differences are not sufficient for a reliable classification of wines based on the content of REE.
Therefore, the use of REE as markers of wine material varieties obtained from grape varieties grown on soils practically free of REE is problematic since it can lead to erroneous final results of their identification. In these cases, REE are significantly inferior to macro- and microelements in terms of their ability to represent the varietal image of wine materials.
It can be assumed that the use of ICP–OES and ICP–MS in combination with modern chemometric methods will reliably determine the quality and affiliation of wines by their elemental image and the relationship of components, detect counterfeits, and identify them by variety and origin.

Supplementary Materials

The following supporting information can be downloaded at: https://www.mdpi.com/article/10.3390/molecules28114319/s1, Table S1: Content of REE in untreated and treated with bentonite clays wines.

Author Contributions

Z.T. conceived and designed the experiments; contributed reagents, materials, analysis tools, or data; and wrote the paper. M.B. analyzed and interpreted the data and wrote the paper. A.A. performed the experiments; analyzed and interpreted the data; and wrote the paper. A.K. (Alexan Khalafyan) and O.S. analyzed and interpreted the data. A.V. and A.K. (Anastasia Kaunova) performed the experiments. A.R. contributed reagents and materials. All authors have read and agreed to the published version of the manuscript.

Funding

This research was funded by the Russian Science Foundation No. 23-13-00056.

Institutional Review Board Statement

Not applicable.

Informed Consent Statement

Not applicable.

Data Availability Statement

Data included in the article/Supplementary Material are referenced in the article.

Acknowledgments

The experiments were carried out with the use of scientific equipment of the Environmental Analytical Center of Collective Use at the Kuban State University.

Conflicts of Interest

The authors declare that the research was conducted in the absence of any commercial or financial relationships that could be construed as a potential conflict of interest.

Sample Availability

Not available.

References

  1. Ranaweera, R.K.R.; Gilmore, A.M.; Capone, D.L.; Bastian, S.E.P.; Jeffery, D.W. Spectrofluorometric analysis combined with machine learning for geographical and varietal authentication, and prediction of phenolic compound concentrations in red wine. Food Chem. 2021, 361, 130149. [Google Scholar] [CrossRef] [PubMed]
  2. Popîrdă, A.; Luchian, C.E.; Cotea, V.V.; Colibaba, L.C.; Scutarașu, E.C.; Toader, A.M. A Review of Representative Methods Used in Wine Authentication. Agriculture 2021, 11, 225. [Google Scholar] [CrossRef]
  3. Tahir, H.E.; Arslan, M.; Komla Mahunu, G.; Adam Mariod, A.; Hashim, S.; Xiaobo, Z.; Jiyong, S.; El-Seedi, H.R.; Musa, T.H. The use of analytical techniques coupled with chemometrics for tracing the geographical origin of oils: A systematic review (2013–2020). Food Chem. 2022, 366, 130633. [Google Scholar] [CrossRef] [PubMed]
  4. Ranaweera, R.K.R.; Capone, D.L.; Bastian, S.E.P.; Cozzolino, D.; Jeffery, D.W. A Review of Wine Authentication Using Spectroscopic Approaches in Combination with Chemometrics. Molecules 2021, 26, 4334. [Google Scholar] [CrossRef]
  5. Arslan, M.; Tahir, H.E.; Zareef, M.; Shi, J.; Rakha, A.; Bilal, M.; Xiaowei, H.; Zhihua, L.; Xiaobo, Z. Recent trends in quality control, discrimination and authentication of alcoholic beverages using nondestructive instrumental techniques. Trends Food Sci. Technol. 2021, 107, 80–113. [Google Scholar] [CrossRef]
  6. Temerdashev, Z.; Khalafyan, A.; Kaunova, A.; Abakumov, A.; Titarenko, V.; Akin’shina, V. Using neural networks to identify the regional and varietal origin of Cabernet and Merlot dry red wines produced in Krasnodar region. Foods Raw Mater. 2019, 7, 124–130. [Google Scholar] [CrossRef]
  7. Urvieta, R.; Buscema, F.; Bottini, R.; Coste, B.; Fontana, A. Phenolic and sensory profiles discriminate geographical indications for Malbec wines from different regions of Mendoza, Argentina. Food Chem. 2018, 265, 120–127. [Google Scholar] [CrossRef]
  8. Catarino, S.; Madeira, M.; Monteiro, F.; Caldeira, I.; Bruno de Sousa, R.; Curvelo-Garcia, A. Mineral Composition through Soil-Wine System of Portuguese Vineyards and Its Potential for Wine Traceability. Beverages 2018, 4, 85. [Google Scholar] [CrossRef]
  9. Khalafyan, A.A.; Temerdashev, Z.A.; Kaunova, A.A.; Abakumov, A.G.; Titarenko, V.O.; Akin’shina, V.A.; Ivanovets, E.A. Determination of the Wine Variety and Geographical Origin of White Wines Using Neural Network Technologies. J. Anal. Chem. 2019, 74, 617–624. [Google Scholar] [CrossRef]
  10. Temerdashev, Z.A.; Abakumov, A.G.; Khalafyan, A.A.; Ageeva, N.M. Correlations between the elemental composition of grapes, soils of the viticultural area and wine. Ind. Lab. Diagn. Mater. 2021, 87, 11–18. [Google Scholar] [CrossRef]
  11. Pepi, S.; Grisenti, P.; Sansone, L.; Chicca, M.; Vaccaro, C. Chemical elements as fingerprints of geographical origin in cultivars of Vitis vinifera L. raised on the same SO4 rootstock. Environ. Sci. Pollut. Res. 2018, 25, 490–506. [Google Scholar] [CrossRef]
  12. D’Antone, C.; Punturo, R.; Vaccaro, C. Rare earth elements distribution in grapevine varieties grown on volcanic soils: An example from Mount Etna (Sicily, Italy). Environ. Monit. Assess. 2017, 189, 160. [Google Scholar] [CrossRef]
  13. Mihucz, V.G.; Done, C.J.; Tatár, E.; Virág, I.; Záray, G.; Baiulescu, E.G. Influence of different bentonites on the rare earth element concentrations of clarified Romanian wines. Talanta 2006, 70, 984–990. [Google Scholar] [CrossRef]
  14. Bronzi, B.; Brilli, C.; Beone, G.M.; Fontanella, M.C.; Ballabio, D.; Todeschini, R.; Consonni, V.; Grisoni, F.; Parri, F.; Buscema, M. Geographical identification of Chianti red wine based on ICP-MS element composition. Food Chem. 2020, 315, 126248. [Google Scholar] [CrossRef]
  15. Punturo, R.; D’Antone, C.; Pepi, S.; Vaccaro, C. Rare earth elements absorption patterns in grapevine “Vitis vinifera L.” cultivated in carbonate terrains (south-eastern Sicily, Italy). Environ. Earth Sci. 2018, 77, 801. [Google Scholar] [CrossRef]
  16. Cerutti, C.; Sánchez, R.; Sánchez, C.; Ardini, F.; Grotti, M.; Todolí, J.-L. Prospect on Rare Earth Elements and Metals Fingerprint for the Geographical Discrimination of Commercial Spanish Wines. Molecules 2020, 25, 5602. [Google Scholar] [CrossRef]
  17. Magdas, D.A.; Marincas, O.; Cristea, G.; Feher, I.; Vedeanu, N. REEs—A possible tool for geographical origin assessment? Environ. Chem. 2020, 17, 148. [Google Scholar] [CrossRef]
  18. Galgano, F.; Favati, F.; Caruso, M.; Scarpa, T.; Palma, A. Analysis of trace elements in southern Italian wines and their classification according to provenance. LWT Food Sci. Technol. 2008, 41, 1808–1815. [Google Scholar] [CrossRef]
  19. Aceto, M.; Robotti, E.; Oddone, M.; Baldizzone, M.; Bonifacino, G.; Bezzo, G.; Di Stefano, R.; Gosetti, F.; Mazzucco, E.; Manfredi, M.; et al. A traceability study on the Moscato wine chain. Food Chem. 2013, 138, 1914–1922. [Google Scholar] [CrossRef]
  20. Baxter, M.; Crews, H.; John Dennis, M.; Goodall, I.; Anderson, D. The determination of the authenticity of wine from its trace element composition. Food Chem. 1997, 60, 443–450. [Google Scholar] [CrossRef]
  21. Augagneur, S.; Médina, B.; Szpunar, J.; Lobiński, R. Determination of rare earth elements in wine by inductively coupled plasma mass spectrometry using a microconcentric nebulizer. J. Anal. At. Spectrom. 1996, 11, 713–721. [Google Scholar] [CrossRef]
  22. Jakubowski, N.; Brandt, R.; Stuewer, D.; Eschnauer, H.R.; Görtges, S. Analysis of wines by ICP-MS: Is the pattern of the rare earth elements a reliable fingerprint for the provenance? Fresenius. J. Anal. Chem. 1999, 364, 424–428. [Google Scholar] [CrossRef]
  23. Hopfer, H.; Nelson, J.; Collins, T.S.; Heymann, H.; Ebeler, S.E. The combined impact of vineyard origin and processing winery on the elemental profile of red wines. Food Chem. 2015, 172, 486–496. [Google Scholar] [CrossRef] [PubMed]
  24. Martin, A.E.; Watling, R.J.; Lee, G.S. The multi-element determination and regional discrimination of Australian wines. Food Chem. 2012, 133, 1081–1089. [Google Scholar] [CrossRef]
  25. Bentlin, F.R.S.; dos Santos, C.M.M.; Flores, É.M.M.; Pozebon, D. Lanthanides determination in red wine using ultrasound assisted extraction, flow injection, aerosol desolvation and ICP-MS. Anal. Chim. Acta 2012, 710, 33–39. [Google Scholar] [CrossRef]
  26. Catarino, S.; Madeira, M.; Monteiro, F.; Rocha, F.; Curvelo-Garcia, A.S.; de Sousa, R.B. Effect of Bentonite Characteristics on the Elemental Composition of Wine. J. Agric. Food Chem. 2008, 56, 158–165. [Google Scholar] [CrossRef]
  27. Castiñeira, M.D.M.; Brandt, R.; Jakubowski, N.; Andersson, J.T. Changes of the Metal Composition in German White Wines through the Winemaking Process. A Study of 63 Elements by Inductively Coupled Plasma−Mass Spectrometry. J. Agric. Food Chem. 2004, 52, 2953–2961. [Google Scholar] [CrossRef]
  28. Nicolini, G.; Larcher, R.; Pangrazzi, P.; Bontempo, L. Changes in the contents of micro- and trace elements in wine due to winemaking treatments. Vitis 2004, 43, 41–45. [Google Scholar]
  29. Temerdashev, Z.; Abakumov, A.; Bolshov, M.; Khalafyan, A.; Ageeva, N.; Vasilyev, A.; Ramazanov, A. Instrumental assessment of the formation of the elemental composition of wines with various bentonite clays. Microchem. J. 2022, 175, 107145. [Google Scholar] [CrossRef]
  30. Tatár, E.; Mihucz, V.G.; Virág, I.; Rácz, L.; Záray, G. Effect of four bentonite samples on the rare earth element concentrations of selected Hungarian wine samples. Microchem. J. 2007, 85, 132–135. [Google Scholar] [CrossRef]
  31. Orellana, S.; Johansen, A.M.; Gazis, C. Geographic classification of U.S. Washington State wines using elemental and water isotope composition. Food Chem. X 2019, 1, 100007. [Google Scholar] [CrossRef]
  32. Tomoko, V. Thermo Scientific iCAP RQ ICP-MS: Typical Limits of Detection. Available online: http://tools.thermofisher.com/content/sfs/brochures/TN-43427-ICP-MS-Detection-Limits-iCAP-RQ-TN43427-EN.pdf (accessed on 3 May 2023).
  33. Dabakh, E.V. Rare earth elements in soils and plants of meadow biocenoses. Theor. Appl. Ecol. 2021, 104–111. [Google Scholar] [CrossRef]
  34. Temerdashev, Z.; Abakumov, A.; Bolshov, M.; Khalafyan, A.; Ageeva, N.; Vasilyev, A. Data on the influence of clarification and stabilization with bentonite clays on the elemental composition of red wines determining their varietal affiliation. Data Br. 2022, 42, 108163. [Google Scholar] [CrossRef]
  35. Wucherpfennig, K.; Wines. Production of Table Wines. Food Sci. Nutr. 2003, 6195–6203. [Google Scholar] [CrossRef]
  36. Lambri, M.; Colangelo, D.; Dordoni, R.; Torchio, F.; De Faveri, D.M. Innovations in the Use of Bentonite in Oenology: Interactions with Grape and Wine Proteins, Colloids, Polyphenols and Aroma Compounds. In Grape and Wine Biotechnology; InTech: Rijeka, Croatia, 2016; pp. 381–400. [Google Scholar]
  37. Ribéreau-Gayon, P.; Glories, Y.; Maujean, A.; Dubourdieu, D. Handbook of Enology—The Chemistry of Wine Stabilization and Treatments, 2nd ed.; John Wiley & Sons: Chichester, West Sussex, UK, 2006; pp. 301–332. [Google Scholar]
  38. Microwave Digestion of Clay. Available online: https://cemcontenttype.s3.amazonaws.com/content/media-library/attachments/MetNote_MARS6_Clay_2.pdf (accessed on 3 May 2023).
  39. Alonso Gonzalez, P.; Parga-Dans, E.; Arribas Blázquez, P.; Pérez Luzardo, O.; Zumbado Peña, M.L.; Hernández González, M.M.; Rodríguez-Hernández, Á.; Andújar, C. Elemental composition, rare earths and minority elements in organic and conventional wines from volcanic areas: The Canary Islands (Spain). PLoS ONE 2021, 16, e0258739. [Google Scholar] [CrossRef]
  40. Grainger, C.; Yeh, A.; Byer, S.; Hjelmeland, A.; Lima, M.M.M.; Runnebaum, R.C. Vineyard site impact on the elemental composition of Pinot noir wines. Food Chem. 2021, 334, 127386. [Google Scholar] [CrossRef]
  41. Aceto, M.; Gulino, F.; Calà, E.; Robotti, E.; Petrozziello, M.; Tsolakis, C.; Cassino, C. Authentication and Traceability Study on Barbera d’Asti and Nizza DOCG Wines: The Role of Trace- and Ultra-Trace Elements. Beverages 2020, 6, 63. [Google Scholar] [CrossRef]
  42. Hill, T.; Lewicki, P. Statistics Methods and Applications, 1st ed.; StatSoft: Tulsa, OK, USA, 2007; 800p. [Google Scholar]
Figure 1. The total REE content in wine after BT treatment.
Molecules 28 04319 g001
Figure 2. Scatter diagram of the canonical values of wine samples based on the concentrations of REE.
Molecules 28 04319 g002
Figure 3. Scatter diagram of the canonical values of wine samples based on the concentrations of REE and marcoelements.
Molecules 28 04319 g003
Figure 4. Scatter diagram of the canonical values of wine samples based on the concentrations of micro- and marcoelements [34].
Molecules 28 04319 g004
Figure 5. Scatter diagram of the canonical values of wine samples based on the concentrations of REE and micro- and marcoelements.
Molecules 28 04319 g005
Table 1. REE content in BT samples, grouped based on their qualitative and quantitative analysis (N = 3, p = 0.95).
ElementConcentration, µg/g
Group 1Group 2Group 3Group 4
MinimumAverageMaximumMinimumAverageMaximumMinimumAverageMaximumMinimumAverageMaximum
Y0.842.434.310.551.151.860.541.343.210.640.911.17
La0.731.121.910.371.643.060.781.672.830.370.520.67
Ce1.253.287.190.913.6910.160.913.827.702.143.354.56
Pr0.070.421.240.180.571.480.210.631.890.100.350.59
Nd0.321.392.570.340.791.500.411.773.080.440.991.53
Sm0.050.461.060.120.441.030.070.491.200.070.300.52
Eu0.030.160.680.040.120.370.010.160.660.020.080.13
Gd0.190.691.680.060.450.940.100.742.140.080.500.91
Tb0.010.100.380.010.040.080.040.090.370.010.050.08
Dy0.050.471.620.130.260.360.060.491.530.180.230.28
Ho0.010.140.490.070.160.400.030.130.310.080.090.10
Er0.100.330.850.100.260.370.040.240.580.140.140.14
Tm0.010.090.190.010.030.060.010.060.170.010.010.01
Yb0.210.611.130.240.370.620.080.571.290.300.350.40
Lu0.020.140.310.010.060.150.010.120.350.010.060.11
Total3.8911.8325.613.1410.0322.443.3012.3227.314.597.9311.2
Table 2. REE concentration in wines before and after treatment with bentonite clays, µg/L (N = 3, p = 0.95).
REEREE Content in Wine
Cabernet SauvignonMerlotMoldova
UntreatedAfter BT TreatmentUntreatedAfter BT TreatmentUntreatedAfter BT Treatment
MinimumAverageMaximumMinimumAverageMaximumMinimumAverageMaximum
Y0.29 ± 0.040.642.165.540.11 ± 0.020.541.654.310.07 ± 0.010.471.974.97
La0.18 ± 0.030.641.814.270.05 ± 0.010.371.403.060.05 ± 0.010.201.242.72
Ce0.19 ± 0.031.554.5112.360.08 ± 0.010.913.5810.120.04 ± 0.010.752.999.50
Pr<LOQ0.120.662.55<LOQ<LOQ0.531.89<LOQ<LOQ0.371.25
Nd<LOQ0.341.753.84<LOQ0.321.413.08<LOQ0.220.992.33
Sm<LOQ0.090.511.56<LOQ<LOQ0.461.20<LOQ0.070.411.23
Eu<LOQ0.070.170.52<LOQ0.010.150.68<LOQ<LOQ0.120.36
Gd<LOQ0.200.952.41<LOQ0.060.652.14<LOQ0.050.511.28
Tb<LOQ0.040.140.42<LOQ<LOQ0.080.38<LOQ<LOQ0.040.16
Dy<LOQ0.090.561.99<LOQ0.050.421.62<LOQ0.030.310.93
Ho<LOQ0.050.190.67<LOQ<LOQ0.110.49<LOQ<LOQ0.140.63
Er<LOQ0.100.320.87<LOQ0.040.270.85<LOQ0.100.441.08
Tm<LOQ0.050.110.22<LOQ<LOQ0.060.19<LOQ<LOQ0.060.18
Yb<LOQ0.100.370.88<LOQ0.080.531.29<LOQ0.030.330.87
Lu<LOQ0.040.140.33<LOQ<LOQ0.100.35<LOQ0.040.240.70
Table 3. Dynamics of changes in the total content of rare earth elements and microelements in various varieties of wines during treatment with BT.
ElementConcentration Range of Elements, mg/L
Untreated WineGroup 1Group 2Group 3Group 4
Cabernet Sauvignon
REE, µg/L0.66 ± 0.106.5–24.56.1–24.37.1–29.17.3–15.2
Microelements, mg/L3.9 ± 0.64.1–6.54.2–6.04.2–6.14.1–4.6
Merlot
REE, µg/L0.24 ± 0.044.7–19.53.5–19.06.0–25.05.5–10.4
Microelements, mg/L3.8 ± 0.64.2–6.64.0–5.84.1–6.14.1–4.7
Moldova
REE, µg/L0.16 ± 0.024.1–19.03.3–19.75.4–22.24.7–9.4
Microelements, mg/L5.1 ± 0.85.5–8.05.1–7.45.3–7.85.4–6.0
Table 4. Correlation coefficients (R) between the concentrations of elements in bentonite clays and treated wines.
ElementCabernet SauvignonMerlotMoldova
Y0.8760.8410.902
La0.8310.8630.899
Ce0.8930.8660.845
Pr0.8980.8910.898
Nd0.9130.8940.895
Sm0.8550.8470.853
Eu0.8200.8030.826
Gd0.9660.8040.780
Tb0.9110.9010.874
Dy0.9020.9010.920
Ho0.9340.9020.940
Er0.9040.8700.907
Tm0.8960.9200.845
Yb0.9520.9020.919
Lu0.8690.9020.924
Table 5. Results of the discriminant analysis of wine samples.
N = 96Discriminant Function Analysis Summary
No. of Vars in Model: 15; Grouping: Sort (3 grps)
Wilks’ Lambda: 0.169; Approx. F (30.158) = 7.55, p < 0.05
Wilks’
Lambda
Partial
Lambda
F-Remove (2.78)p-ValueTolerance1-Tolerance
(R-Sqr.)
Yb0.2330.72614.9030.0000.2850.715
Lu0.2080.8119.2140.0000.2870.713
Sm0.1900.8894.9230.0100.1360.864
Gd0.1900.8894.9190.0100.4180.582
Er0.1890.8954.6510.0120.2470.753
Dy0.1860.9064.0980.0200.2380.762
Tb0.1810.9352.7460.0700.1550.845
La0.1800.9352.7240.0720.4380.562
Ce0.1800.9362.6910.0740.2420.758
Tm0.1800.9362.6900.0740.1720.828
Y0.1790.9412.4620.0920.3140.686
Nd0.1710.9850.6160.5430.3340.666
Pr0.1710.9850.6020.5500.1550.845
Eu0.1710.9860.5450.5820.2630.737
Ho0.1700.9910.3770.6870.3180.682
Table 6. The list of studied and used BT.
NoBT NameCountryLightening Quality *NoBT NameCountryLightening Quality
BT1ElectraItaly+++BT17BentoVinumGold (particle size 0.05 mm)Kazakhstan+++
BT2AzerbaijanAzerbaijan++BT18Bentovin (particle size 0.07 mm)Azerbaijan+++
BT3Claris PBosnia and Herzegovina++BT19Bentovin (particle size 0.05 mm)Azerbaijan++
BT4ClarisP70Bosnia and Herzegovina++BT20Vinobent field “10 Khutor” (particle size 0.07 mm)Russia++
BT5GranuBent Pore-TecGermany+++BT21Vinobent field “10 Khutor” (particle size 0.05 mm)Russia++
BT6AktivitGermanycloudy wineBT22Vinobent field “10 Khutor” production lotRussia++
BT7Ca-GranulatGermanycloudy wineBT23Bentovin production lotAzerbaijan++
BT8NaCalitPore-TecGermany++BT24KaliNat ErbslöhGermany+
BT9GumbrinGeorgia++BT25Aktivit ErbslöhGermany+++
BT10GranulaFrance+++BT26ExtrabentFrance+++
BT11AskangelGeorgia+BT27Crimean bentoniteRussia++
BT12Ijevan bentoniteArmenia+BT28InobentFrance++
BT13Khakass fieldRussia++BT29Seporit Pore-TecGermany+++
BT14Khakassia Sigma-TradeRussia++BT30Extrabent SuperFrance+++
BT15Dagestan fieldRussia++BT31ClarisP70 «Meridian»Bosnia and Herzegovina+
BT16BentoVinumGold (particle size 0.07 mm)Kazakhstan+++BT32Kurtsevskoe fieldRussia+
* +++—crystal clear; ++—clear; +—light opalescence.
Table 7. Instrument operating parameters and REE limits of quantification.
ICP–MS (iCAP RQ)
Plasma gas flowrate, L/min15.0
Nebulizer gas flowrate, L/min1.0
Auxiliary gas flowrate, L/min0.8
Applied power, W1400
Integration time, s0.01
Nebulizer type, sample rateMicroMist concentric nebulizer,
0.4 mL/min
Isotopes, (LOQ *, µg/L)
89Y, (0.001);
139La, (0.001);
140Ce, (0.001);
141Pr, (0.011);
146Nd, (0.014);
152Sm, (0.006);
151Eu, (0.003);
157Gd, (0.002);
159Tb, (0.005);
163Dy, (0.003);
165Ho, (0.006);
166Er, (0.003);
169Tm, (0.002);
174Yb, (0.002);
175Lu, (0.002);
Interference correction equations
Sm = I(152Sm) − 0.012780 × I(157Gd)
Yb = I(174Yb) − 0.005934 × I(178Hf)
* LOQ = 10σ0, where σ0 is the standard deviation of blank results.
Disclaimer/Publisher’s Note: The statements, opinions and data contained in all publications are solely those of the individual author(s) and contributor(s) and not of MDPI and/or the editor(s). MDPI and/or the editor(s) disclaim responsibility for any injury to people or property resulting from any ideas, methods, instructions or products referred to in the content.

