Article

Molecular Dynamics Insight into the CO2 Flooding Mechanism in Wedge-Shaped Pores

1
College of Science, China University of Petroleum, Qingdao 266580, China
2
State Key Laboratory of Enhanced Oil Recovery, Research Institute of Petroleum Exploration & Development, CNPC, Beijing 100083, China
3
School of Materials Science and Engineering, China University of Petroleum, Qingdao 266580, China
*
Authors to whom correspondence should be addressed.
Molecules 2023, 28(1), 188; https://doi.org/10.3390/molecules28010188
Submission received: 26 November 2022 / Revised: 22 December 2022 / Accepted: 23 December 2022 / Published: 26 December 2022
(This article belongs to the Special Issue Exclusive Feature Papers in Physical Chemistry)

Abstract

:
Because of the growing demand for energy, oil extraction under complicated geological conditions is increasing. Herein, oil displacement by CO2 in wedge-shaped pores was investigated by molecular dynamics simulation. The results showed that, for both single and double wedge-shaped models, pore Ⅱ (pore size from 3 to 8 nm) exhibited a better CO2 flooding ability than pore Ⅰ (pore size from 8 to 3 nm). Compared with slit-shaped pores (3 and 8 nm), the overall oil displacement efficiency followed the sequence of 8 nm > double pore Ⅱ > single pore Ⅱ > 3 nm > double pore Ⅰ > single pore Ⅰ, which confirmed that the exits of the wedge-shaped pores had determinant effects on CO2 enhanced oil recovery over their entrances. “Oil/CO2 inter-pore migration” and “siphoning” phenomena occurred in wedge-shaped double pores by comparing the volumes of oil/CO2 and the center of mass. The results of the interaction and radial distribution function analyses indicate that the wide inlet and outlet had a larger CO2–oil contact surface, better phase miscibility, higher interaction, and faster displacement. These findings clarify the CO2 flooding mechanisms in wedge-shaped pores and provide a scientific basis for the practical applications of CO2 flooding.

Graphical Abstract

1. Introduction

The excessive consumption of oil resources has been increasing with the rapid growth of the world economy and society [1,2]. To meet this growing demand [3], the development of unconventional resources such as micro- and nano-scale reservoirs has gradually attracted people’s attention [4,5,6]. At present, the most frequently utilized methods for oil displacement are gas flooding, hot water flooding, and surfactant flooding. However, compared with gas flooding, hot water flooding is accompanied by the enormous investment of ground facilities, high heat injection costs, and environmental pollution [7]. Similarly, surfactant flooding uses a lot of chemical solvents, which raises the cost of manufacturing and causes serious damage to reservoirs [8]. Gas flooding technologies using N2 [9], CH4 [10], CO2 [11], and other gaseous oil [12] are commonly used. Among these, supercritical CO2 can be easily dissolved in alkanes [13], which expands the volume of oil [14], decreases the viscosity [15], and declines the gas–liquid surface tension [16]. CO2 flooding is more versatile and has a higher recovery rate than other techniques. It is not only applicable to traditional oil fields, but also clearly improves oil recovery in reservoirs with extremely low permeability. Additionally, it can function as an efficient geological CO2 sequestration to solve issues caused by the greenhouse effect [17]. Current investigations of the mechanism for CO2 flooding in micro- and nano-scale pores is focused mainly on single slit-shaped pores. However, the different environments of oil reservoirs may lead to complexity of the pore structures [18,19,20,21,22], in which the reservoir storage capacity and fluid percolation characteristics are not the same due to the different throat distribution morphology and connectivity [4,23,24,25]. Fang et al. [26] and Lu et al. [27] constructed a rough surface on slit-shaped pores and found that the grooves or bulges on the solid surface had a significant influence on the fluid transport behavior, proving that the roughness of micro- and nano-pore structure would greatly affect the recovery of the crude oil. Mohammad Sejgi et al. [28] studied the multiphase fluid/fluid displacement in nanoscale pores with different cross-sectional shapes, including circular, square, and right-angled triangle. It was found that the angular cross section in the nanopore affects the fluid transport. Studies have indicated that a large percentage of wedge-shaped pores exist in many areas, such as shale oil reservoirs in the Bohai Bay basin [29]; the salt lake basin sedimentary strata of the Jimsar depression in Xinjiang [24]; and the East Morgan oil field in the Gulf of Suez, Egypt [30]. However, the oil displacement in wedge-shaped pores and related mechanisms, including oil/CO2 transport process, phase miscibility, CO2–oil–rock interaction, and displacement efficiency, have not been systematically elucidated.
Molecular dynamics simulation has been widely used in the exploration of CO2 flooding in micro- and nano-scale reservoirs [31,32]. Therefore, it was applied herein to investigate the microscopic behavior of fluid during CO2 flooding in wedge-shaped quartz nanopores. Firstly, we simulated the transport process in wedge-shaped pores during oil displacement. Then, we investigated the oil/CO2 inter-pore migration mechanism and the restriction effect from the inlet and outlet. Subsequently, we studied the microscopic CO2–oil–rock interactions and miscible phases during CO2 flooding in wedge-shaped pores. Finally, the oil displacement in wedge-shaped pores was compared with that in slit-shaped pores to elucidate the effect of wedge-shaped pores on oil recovery.

2. Results and Discussion

Here, four types of wedge-shaped pores, including single pore Ⅰ with a pore size from 8 to 3 nm, single pore Ⅱ with a pore size from 3 to 8 nm, and double pores including double pore Ⅰ and double pore Ⅱ, are explored. Two types of slit-shaped pores, 3 nm and 8 nm pores, are also considered as a comparison to evaluate the effect of wedge-shaped pores on CO2 flooding.

2.1. CO2 Flooding Process

Snapshots of the oil displacement process during CO2 injection into wedge-shaped pores are shown in Figure 1. As seen in Figure 1a, initially, single pore Ⅰ exhibits a large contact area of CO2 with the oil at the inlet, and some oil molecules diffuse into the left side of the pore, and oil molecules then re-enter wedge-shaped pores together with CO2. Before 1.5 ns, CO2 diffuses along the rock surface in wedge-shaped pores. At 2.5 ns, a small number of CO2 molecules pass through the pore and excrete from the 3 nm outlet. At 3.5 ns, the space of the wedge-shaped pores is mostly occupied by CO2, and after 4.5 ns, the oil displacement is nearly complete. As seen in Figure 1b, single pore Ⅱ has a small pore size at the inlet, and no oil molecules diffuse into the left side of single pore Ⅱ over time. The contact between CO2 and oil molecules is comparatively small at the initial stage, but it turns larger after CO2 molecules enter the pore. After 1.5 ns, a small amount of CO2 can pass through the pore, and more CO2 molecules enter single pore Ⅱ compared with those in single pore Ⅰ after 2.5 ns. The oil is almost entirely displaced after 3.5 ns, and the whole CO2 flooding process is much faster than that in single pore Ⅰ.
Figure 1c shows that the transport phenomena in double pores are similar to those in the two single pores. The transport speed of each phase is roughly the same at the initial state. After 1.5 ns, the transport speed of CO2 to the right side of double pore Ⅰ is much slower than that in single pore Ⅰ. More obviously, the transport of CO2 in double pore Ⅱ is much faster than that in double pore Ⅰ, and this difference is larger than that between single pore Ⅰ and single pore Ⅱ. This phenomenon may be ascribed to the fact that a small portion of oil molecules together with CO2 in double pore Ⅰ can enter double pore Ⅱ and eventually be displaced from double pore Ⅱ.

2.2. Oil/CO2 Inter-Pore Migration Mechanism

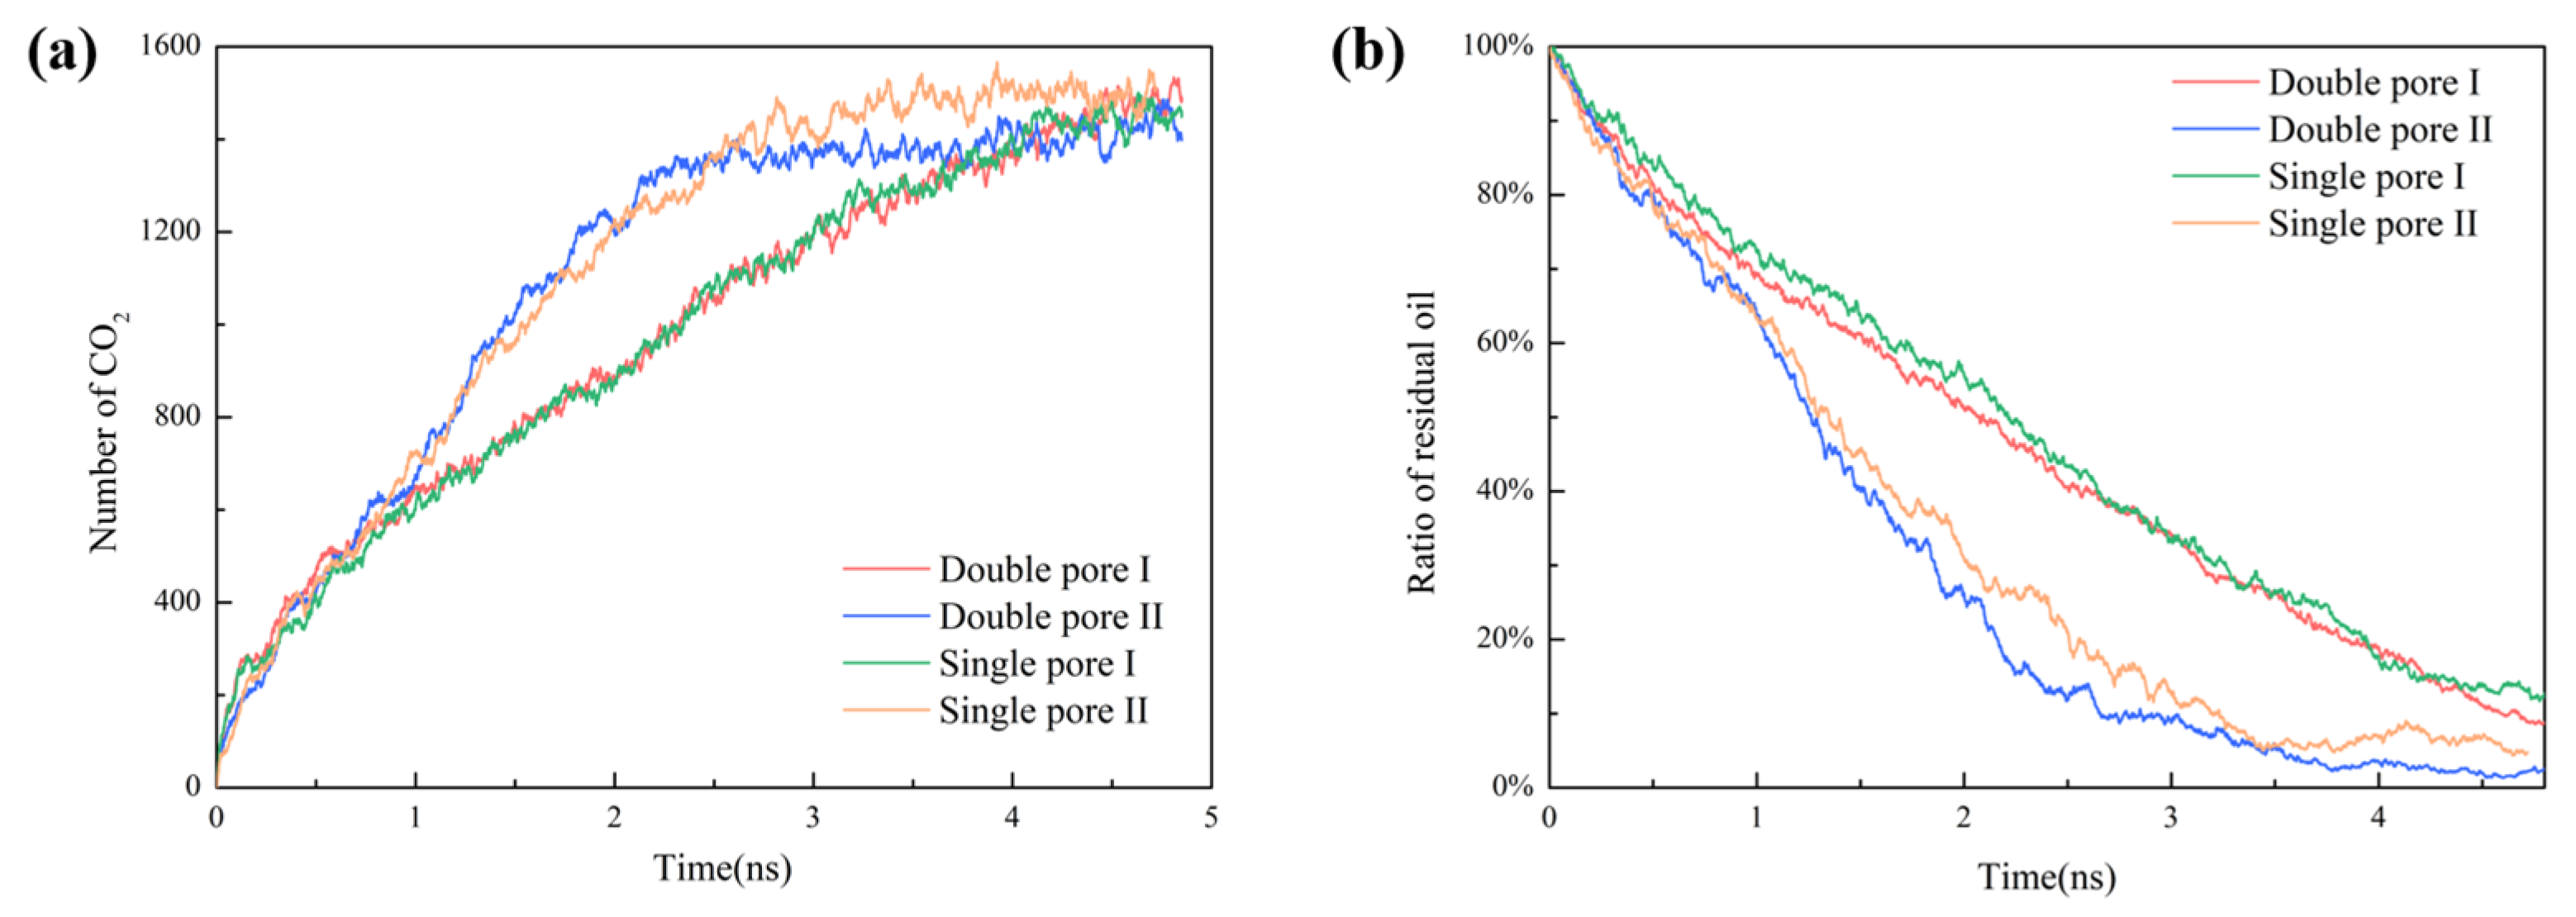
To quantitatively describe the CO2 flooding process, the number of CO2 molecules and the ratio of residual oil in wedge-shaped pores during the displacement processes are provided in Figure 2. Figure 3 presents the number of oil molecules on the left side of double pore Ⅰ and single pore Ⅰ, and the number of oil molecules migrating between double pore Ⅰ and double pore Ⅱ. Accordingly, the mechanism of oil/CO2 inter-pore migration is proposed in Figure 4.
Figure 2a shows that the amount of CO2 entering double pore Ⅰ is roughly the same as that in single pore Ⅰ throughout the whole displacement. Before 1.5 ns, the number of CO2 entering double pore Ⅱ is very close to that of single pore Ⅱ; from 1.5 ns to 2.5 ns, the number of CO2 molecules entering double pore Ⅱ is slightly larger than that of single pore Ⅱ; from 2.5 ns to 4.5 ns, the number of CO2 molecules in double pore Ⅱ is slightly smaller than that of single pore Ⅱ. Because of the same pore shape, CO2 molecules will fill up the whole pore space for both single pore Ⅱ and double pore Ⅱ eventually, and the number of CO2 molecules will reach to the same value. The displacement rate is higher in single pore Ⅱ and double pore Ⅱ than that in single pore Ⅰ and double pore Ⅰ due to the influence of the pore structure. The number of CO2 molecules entering single pore Ⅱ and double pore Ⅱ at the same time is greater than that entering single pore Ⅰ and double pore Ⅰ. As seen from Figure 2b, not much difference can be seen between the ratio of the remaining oil in single pore Ⅰ and double pore Ⅰ, while the displacement rate is slightly larger in double pore Ⅰ. The ratio of residual oil in double pore Ⅱ is smaller than that in single pore Ⅱ, and the displacement rate in double pore Ⅱ is faster than that in single pore Ⅱ.
Figure 3a shows the number of oil molecules on the left side of double pore Ⅰ and single pore Ⅰ. It indicates that there were less oil molecules on the left side of double pore Ⅰthan that of single pore Ⅰ. The number of oil molecules migrating between these two double pores is compared in Figure 3b. Evidently, more oil molecules in double pore Ⅰ migrate into double pore Ⅱ, while very few oil molecules in double pore Ⅱ migrate into double pore Ⅰ.
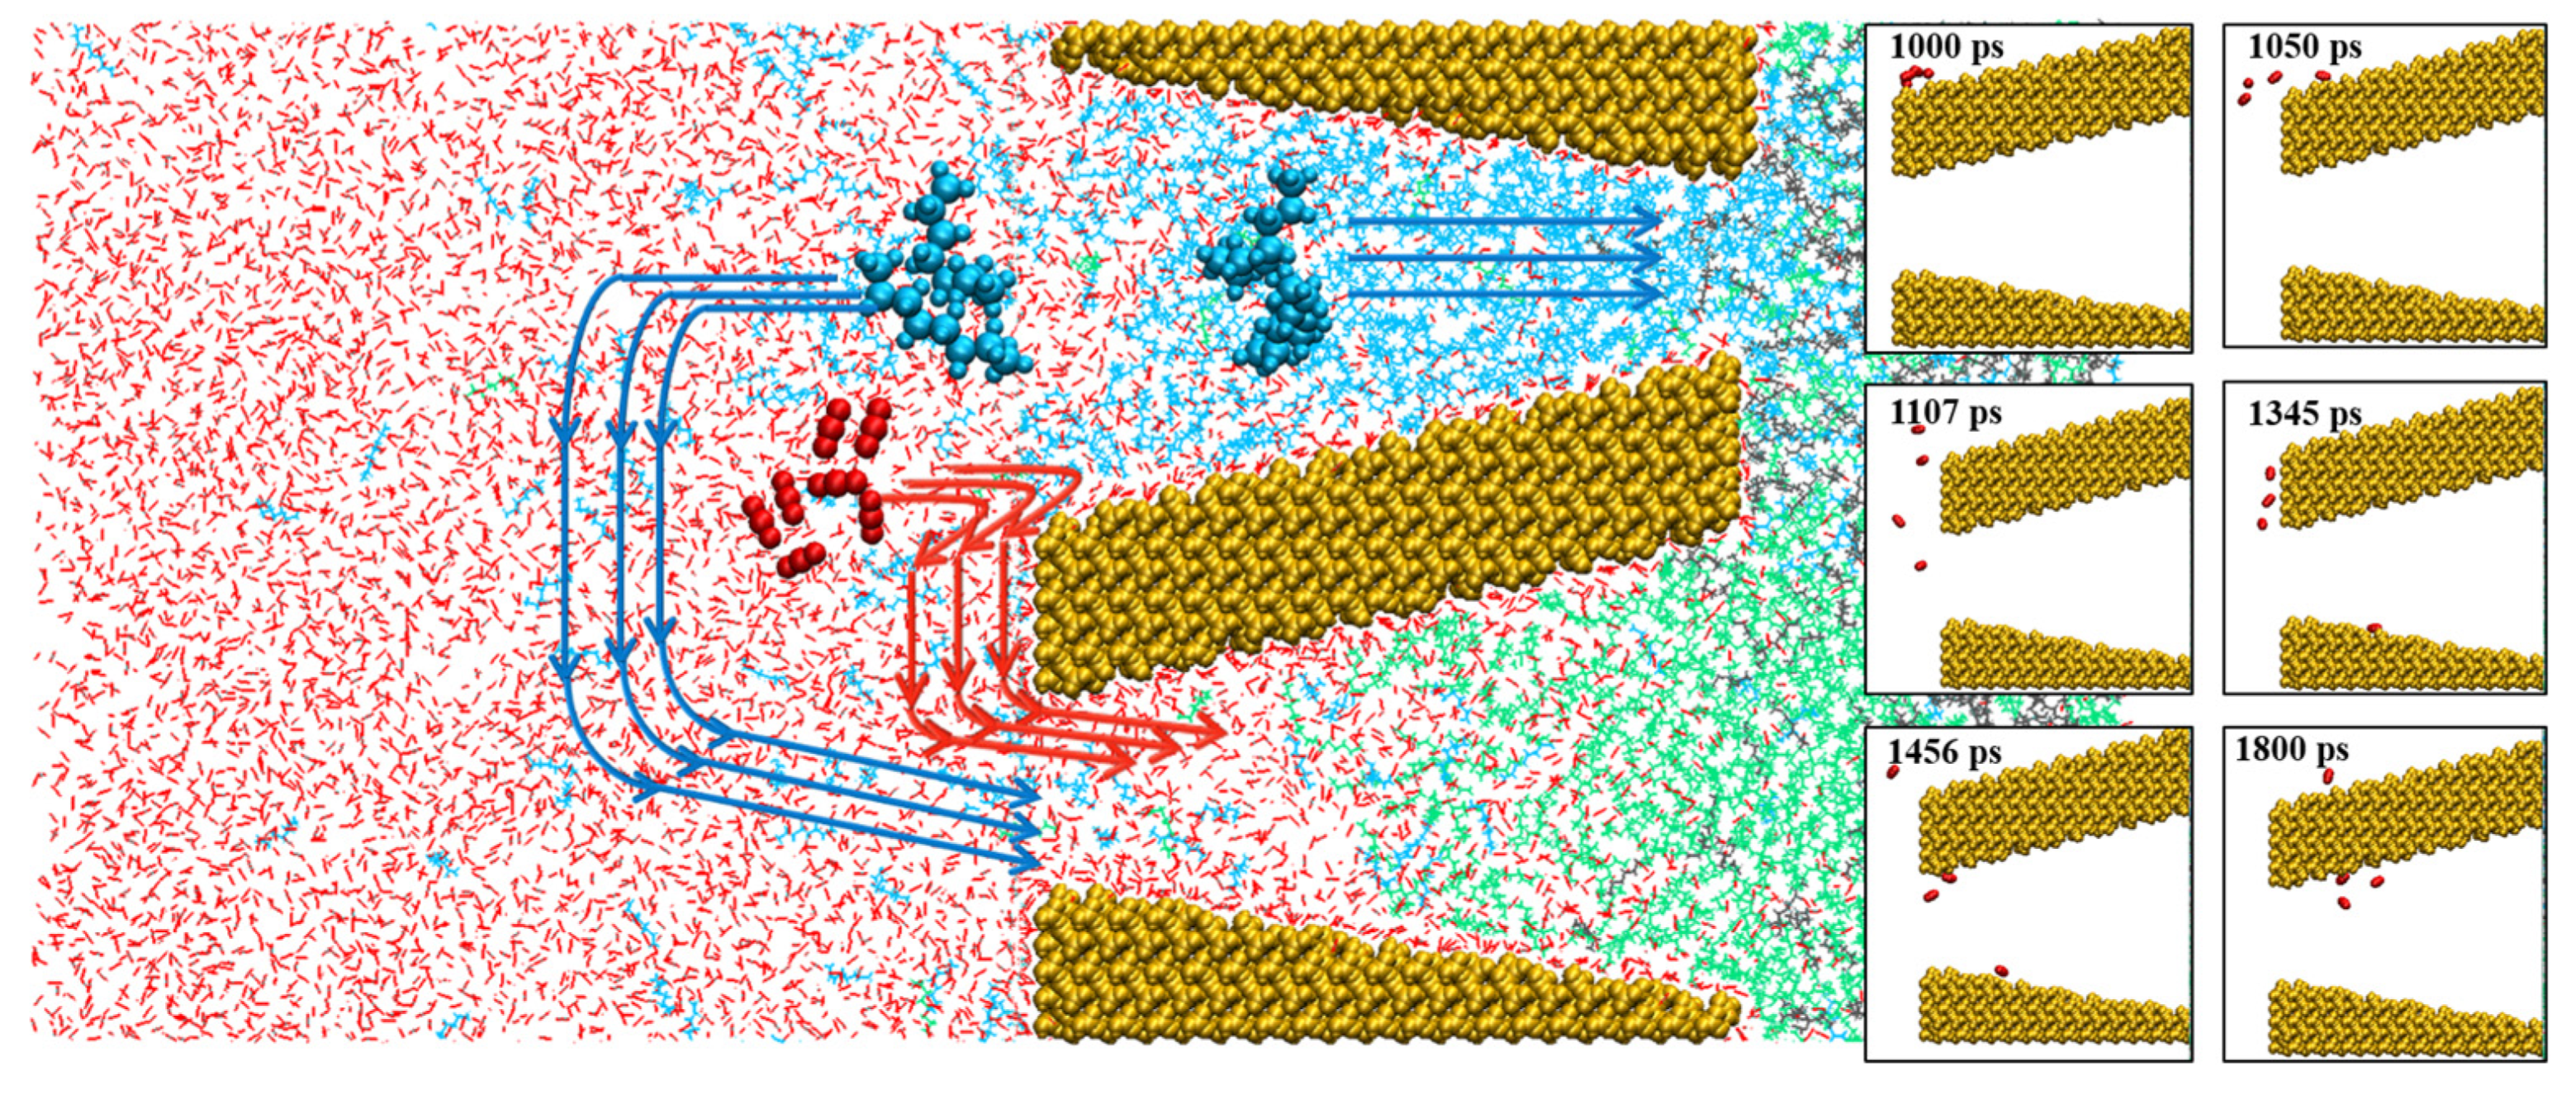
By observing the trajectory of CO2, we plotted the streamlines of CO2 fluid near the two pores to directly reflect the molecular migration in Figure 4. When free phase CO2 approached the interlayer rock, some of free phase CO2 in double pore Ⅰnear the rock between the pores travelled towards double pore Ⅱ along the rock surface due to the obstruction of the wedge-shaped rocks, and a “CO2 inter-pore migration” phenomenon occurred. This explains why the number of CO2 molecules entering double pore Ⅱ was slightly higher than that in single pore Ⅱ at 1.5 ns to 2.5 ns. In Figure 4, the trajectory of oil molecules in double pore Ⅰ is plotted. In double pore Ⅰ, the oil molecules were mainly divided into two parts: most of the oil molecules were displaced from the right outlet due to the pressure difference, and a small part of the oil molecules diffused to the left side of the pore. This was due to the oil molecules in double pore Ⅰ being hindered by the pore structure, which prevented some oil molecules migrating into the right side. In addition, there was a pressure difference between the inlet and outlet due to the fast flow rate and low pressure at the inlet and the slow flow rate and high pressure at the outlet. However, because steady pressure was applied to the left He plate, only a small percentage of the oil molecules could migrate to the left. Combined with the results in Figure 2, most of oil molecules were displaced in the late stage of displacement together with a constant number of CO2 molecules in double pore Ⅱ. The ratio of residual oil in double pore Ⅱ was lower than that in single pore Ⅱ, and the number of CO2 molecules in double pore Ⅱ was less than that in single pore Ⅱ. This is because the oil displacement efficiency in double pore Ⅱ was larger than that in double pore Ⅰ, so the fluid density inside double pore Ⅱ decreased and the pressure weakened. As a result, the pressure difference between these two double pores causes inter-pore migration of oil from double pore Ⅰ into double pore Ⅱ together with CO2 injection, thus creating a phenomenon similar to "siphoning". Both the flow of oil molecules in Figure 1c and the number of oil molecules migrating from double pore Ⅰ to Ⅱ in Figure 3b clearly demonstrate the oil inter-pore migration mechanism, as exhibited in Figure 4.

2.3. Interaction

The interaction energies between oil–rock and oil–CO2 were calculated to reflect the competitive adsorption and transport process of oil–CO2 molecules on the rock surface. Equation (1) is used to calculate the interaction energy between oil and rock surface [33], and Equation (2) is used to calculate the interaction energy between oil and CO2 [34]:
E o i l r o c k = E o i l + r o c k ( E o i l + E r o c k )
E o i l C O 2 = E o i l + C O 2 ( E o i l + E C O 2 )
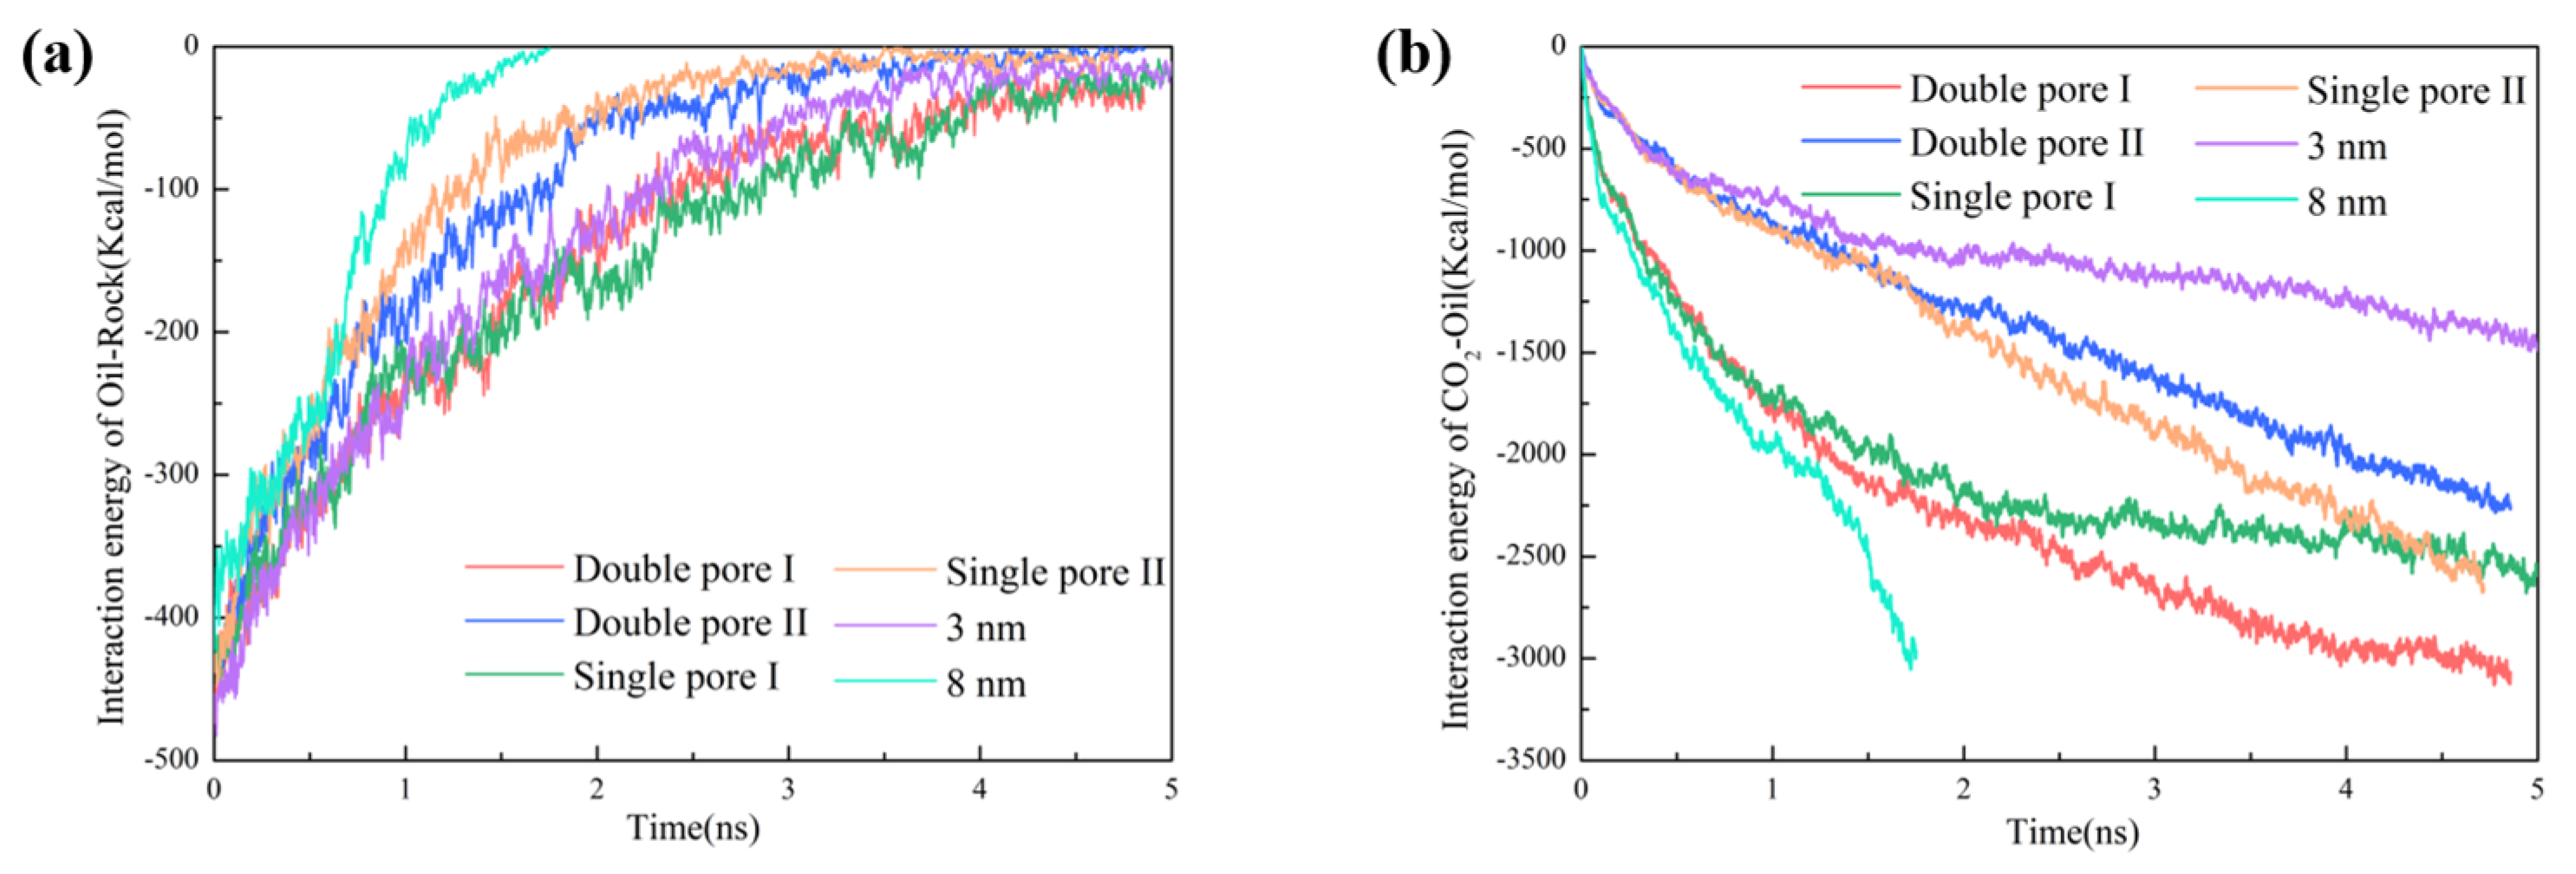
where E o i l r o c k and E o i l C O 2 are the interaction energies between oil–rock and oil–CO2; E o i l + r o c k and E o i l + C O 2 are the energies of the systems including oil–rock and oil–CO2; and E o i l , E r o c k , and E C O 2 represent the energy of oil molecules, rock surface, and CO2 molecules, respectively. It can be seen from Figure 5, as a whole, E o i l r o c k gradually decreased with time, and E o i l C O 2 gradually increased in both the slit-shaped and wedge-shaped pores. These results indicate that CO2 gradually stripped oil from the rock surface during the displacement process [35], the contact between CO2 and oil increased and the driving force from CO2 was strengthened.
Comparing E o i l r o c k   in different pores, it was found that the E o i l r o c k in 3 nm slit-shaped pore decreased more slowly than that in the 8 nm slit-shaped pore. In wedge-shaped pores, E o i l r o c k decreased to 0 Kcal/mol in single pore Ⅰ and double pore Ⅰ simultaneously, indicating that CO2 stripped off oil along the rock surface at the same rate. Comparatively, E o i l r o c k in single pore Ⅰ and double pore Ⅰ decreased more slowly than that in single pore Ⅱ and double pore Ⅱ. This suggests that the wide pore outlet resulted in a faster oil stripping by CO2 than the narrow pore outlet.
In the slit-shaped pores, E o i l C O 2 gradually increased with time, and the tendency became more evident with the increase in the interfacial molecule number of CO2–oil, as shown in Figure 5b. The tendency of E o i l C O 2 increased sharply in the early displacement stage and then slowed down. Comparatively, E o i l C O 2 exhibited a linear growth in single pore Ⅱ and double pore Ⅱ throughout the oil displacement process, because the pore diameter gradually increased and the contact between CO2 and oil kept increasing. In addition, because single pore Ⅰ and single pore Ⅱ contained the same number of oil molecules, the E o i l C O 2 for both pores eventually reached the same value, as shown in Figure 5b. E o i l C O 2 in double pore Ⅰ was larger than that in double pore Ⅱ in the latter displacement stage. This originated from the migrated oil molecules from double pore Ⅰ into double pore Ⅱ, which occupied the pore space that should have belonged to CO2.

2.4. Effect of Pore Shape on CO2–Oil Miscibility

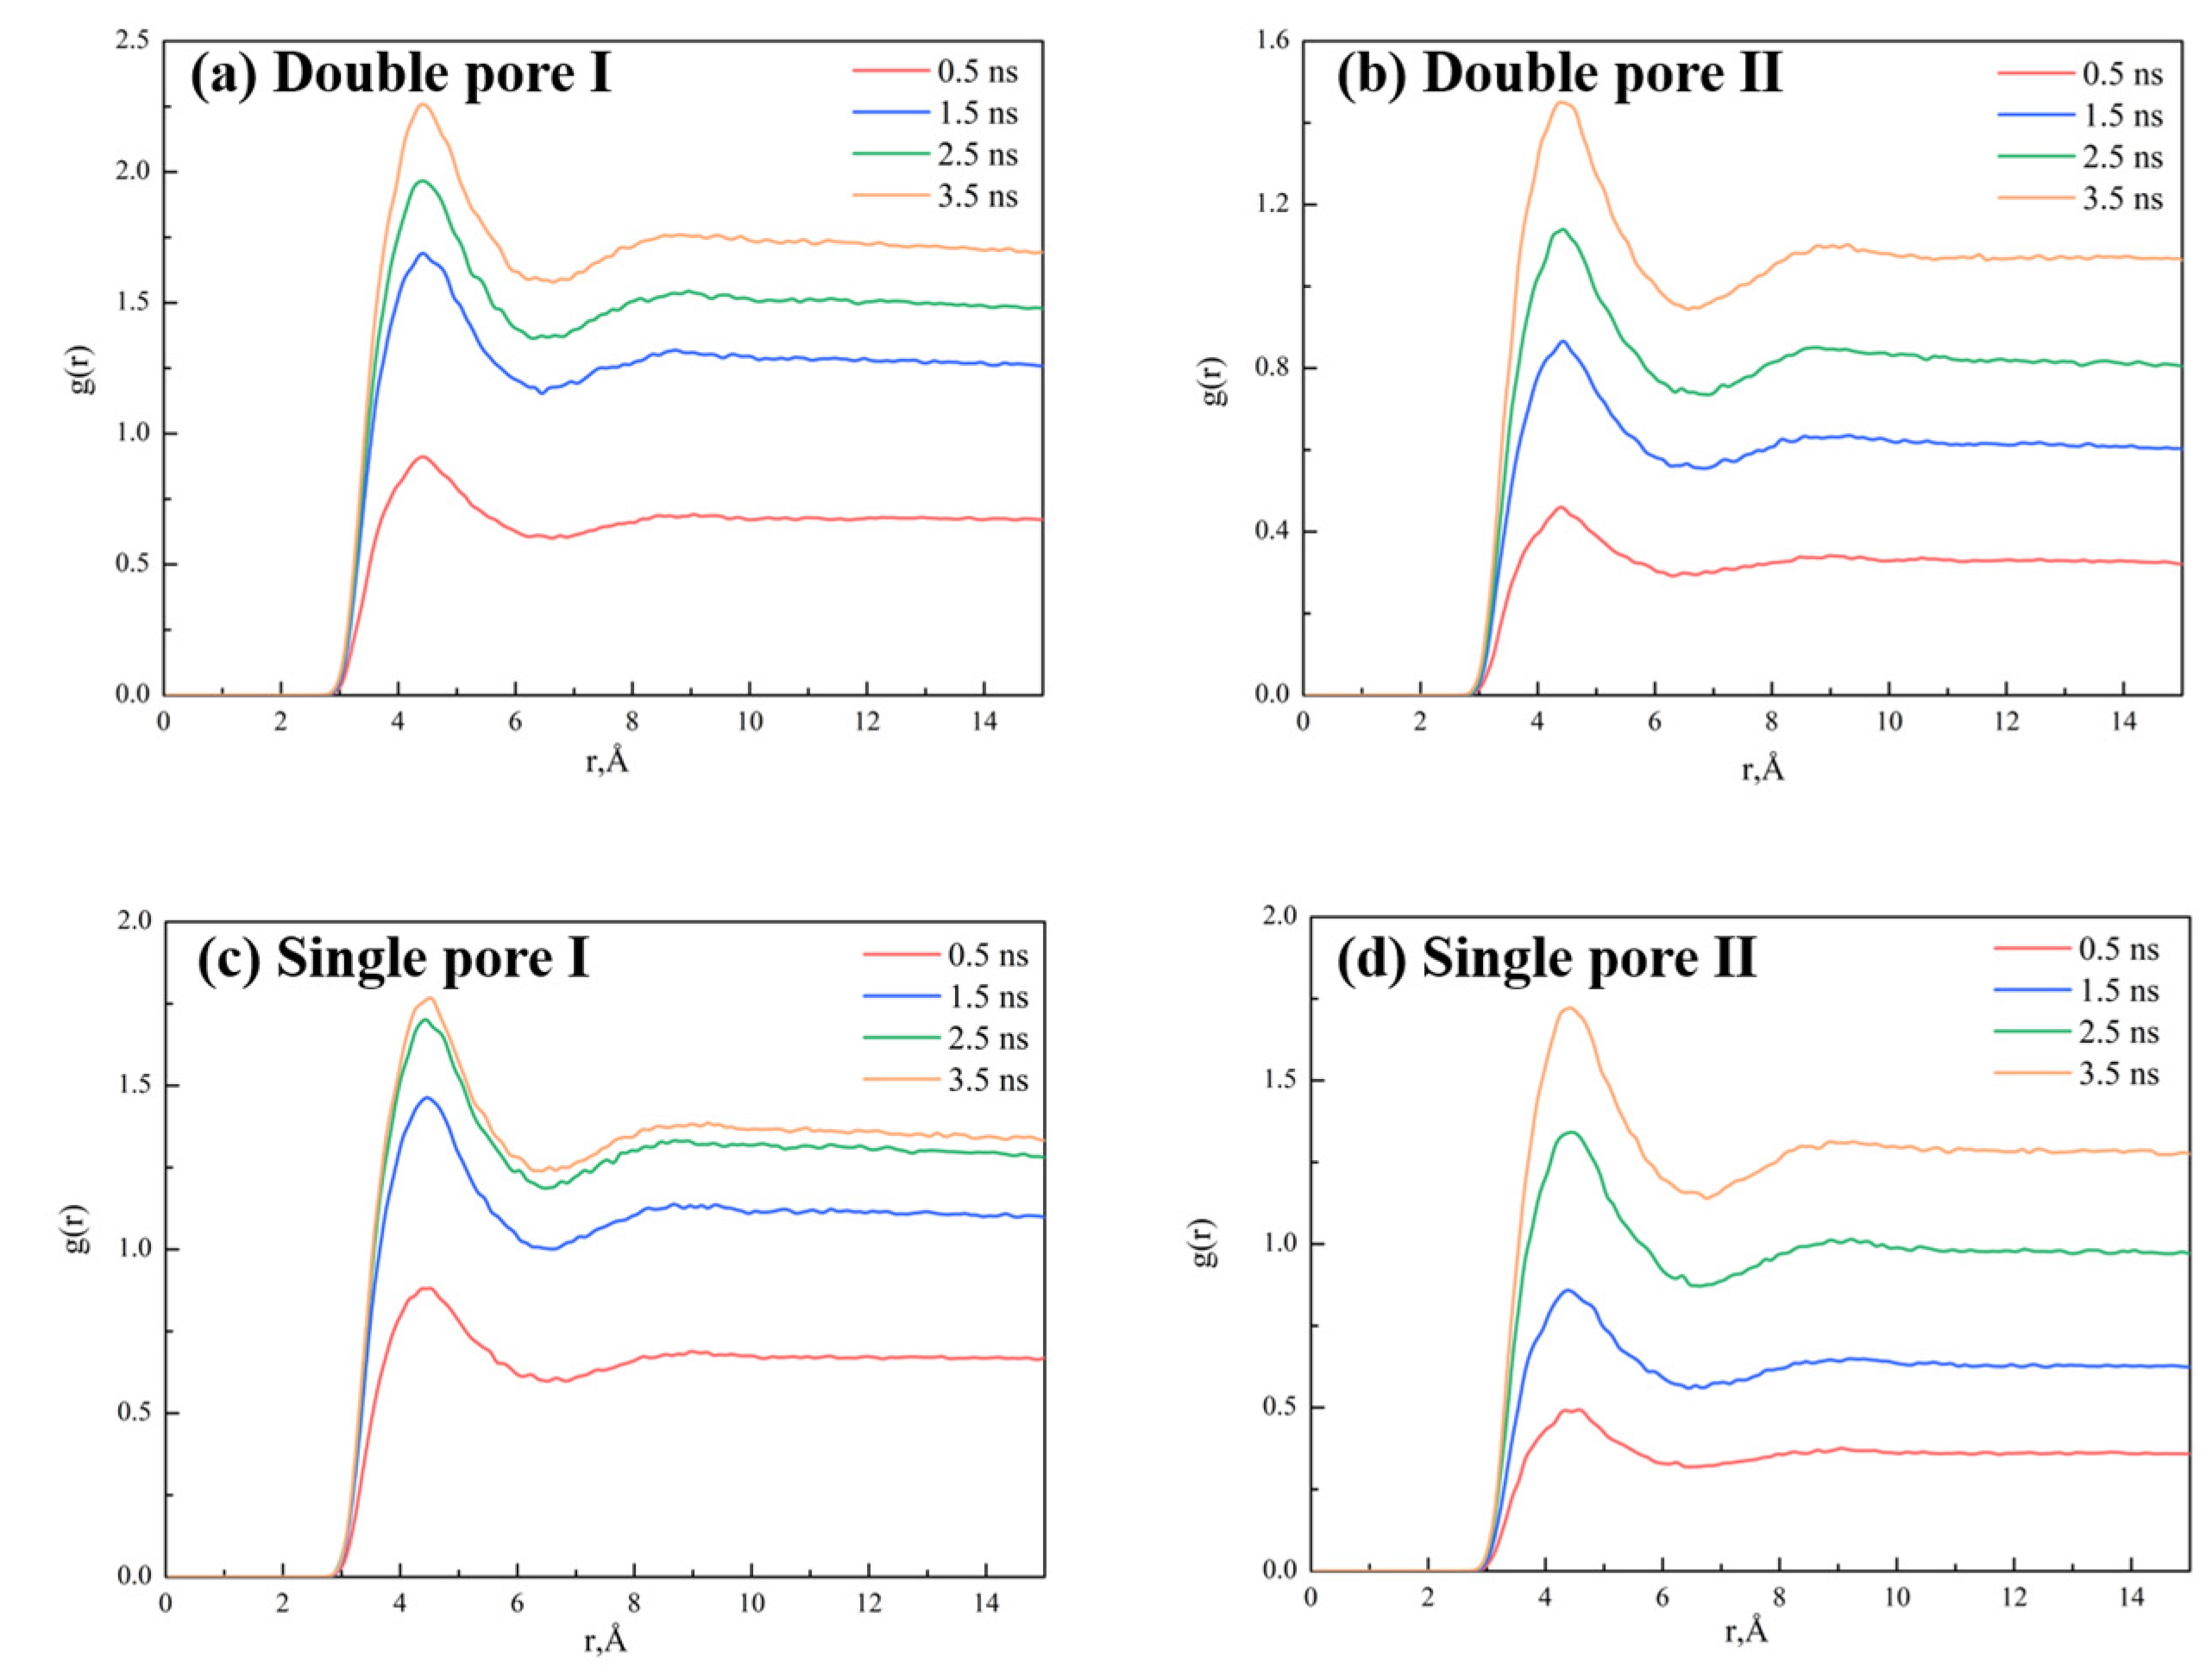
The CO2–oil miscibility had a great influence on the displacement process during the entire oil recovery. In wedge-shaped pores, the miscible phase zone formed via three processes, including the (1) migration of separated oil molecules into CO2, (2) the dissolution of bulk oil molecules in CO2, and the (3) penetration of CO2 into bulk oil, which is in good agreement with those in slit-shaped pores [36]. The radial distribution function (RDF) g(r) between C (CO2)-C (oil) atoms is presented in Figure 6 to describe the distribution of CO2 around oil. According to the snapshots in Figure 1 and RDF in Figure 7a–d, the peak and the area below the curve of RDF in the single pore Ⅰ and double pore Ⅰ were larger than those in the single pore Ⅱ and double pore Ⅱ in the early stage of displacement. This was due to the larger contact surface between CO2 and oil in single pore Ⅰ and double pore Ⅰ in the early stage of displacement, and the restriction at the outlet made the oil molecules less likely to be displaced out. These two factors led to a better mixing of CO2 and oil in single pore Ⅰ and double pore Ⅰ, which is in good agreement with the interaction analyses. The curves of RDF in single pore Ⅰ and double pore Ⅰ became denser, indicating that there was decrease in miscibility tendency, as well as the dissolution of CO2 and oil. The g(r) value of double pore Ⅰ was still larger than that of double pore Ⅱ because part of the oil diffused to the left side of the double pores with a large diffusion and more contact with CO2.

2.5. Effect of Wedge-Shaped Pore on Oil Recovery

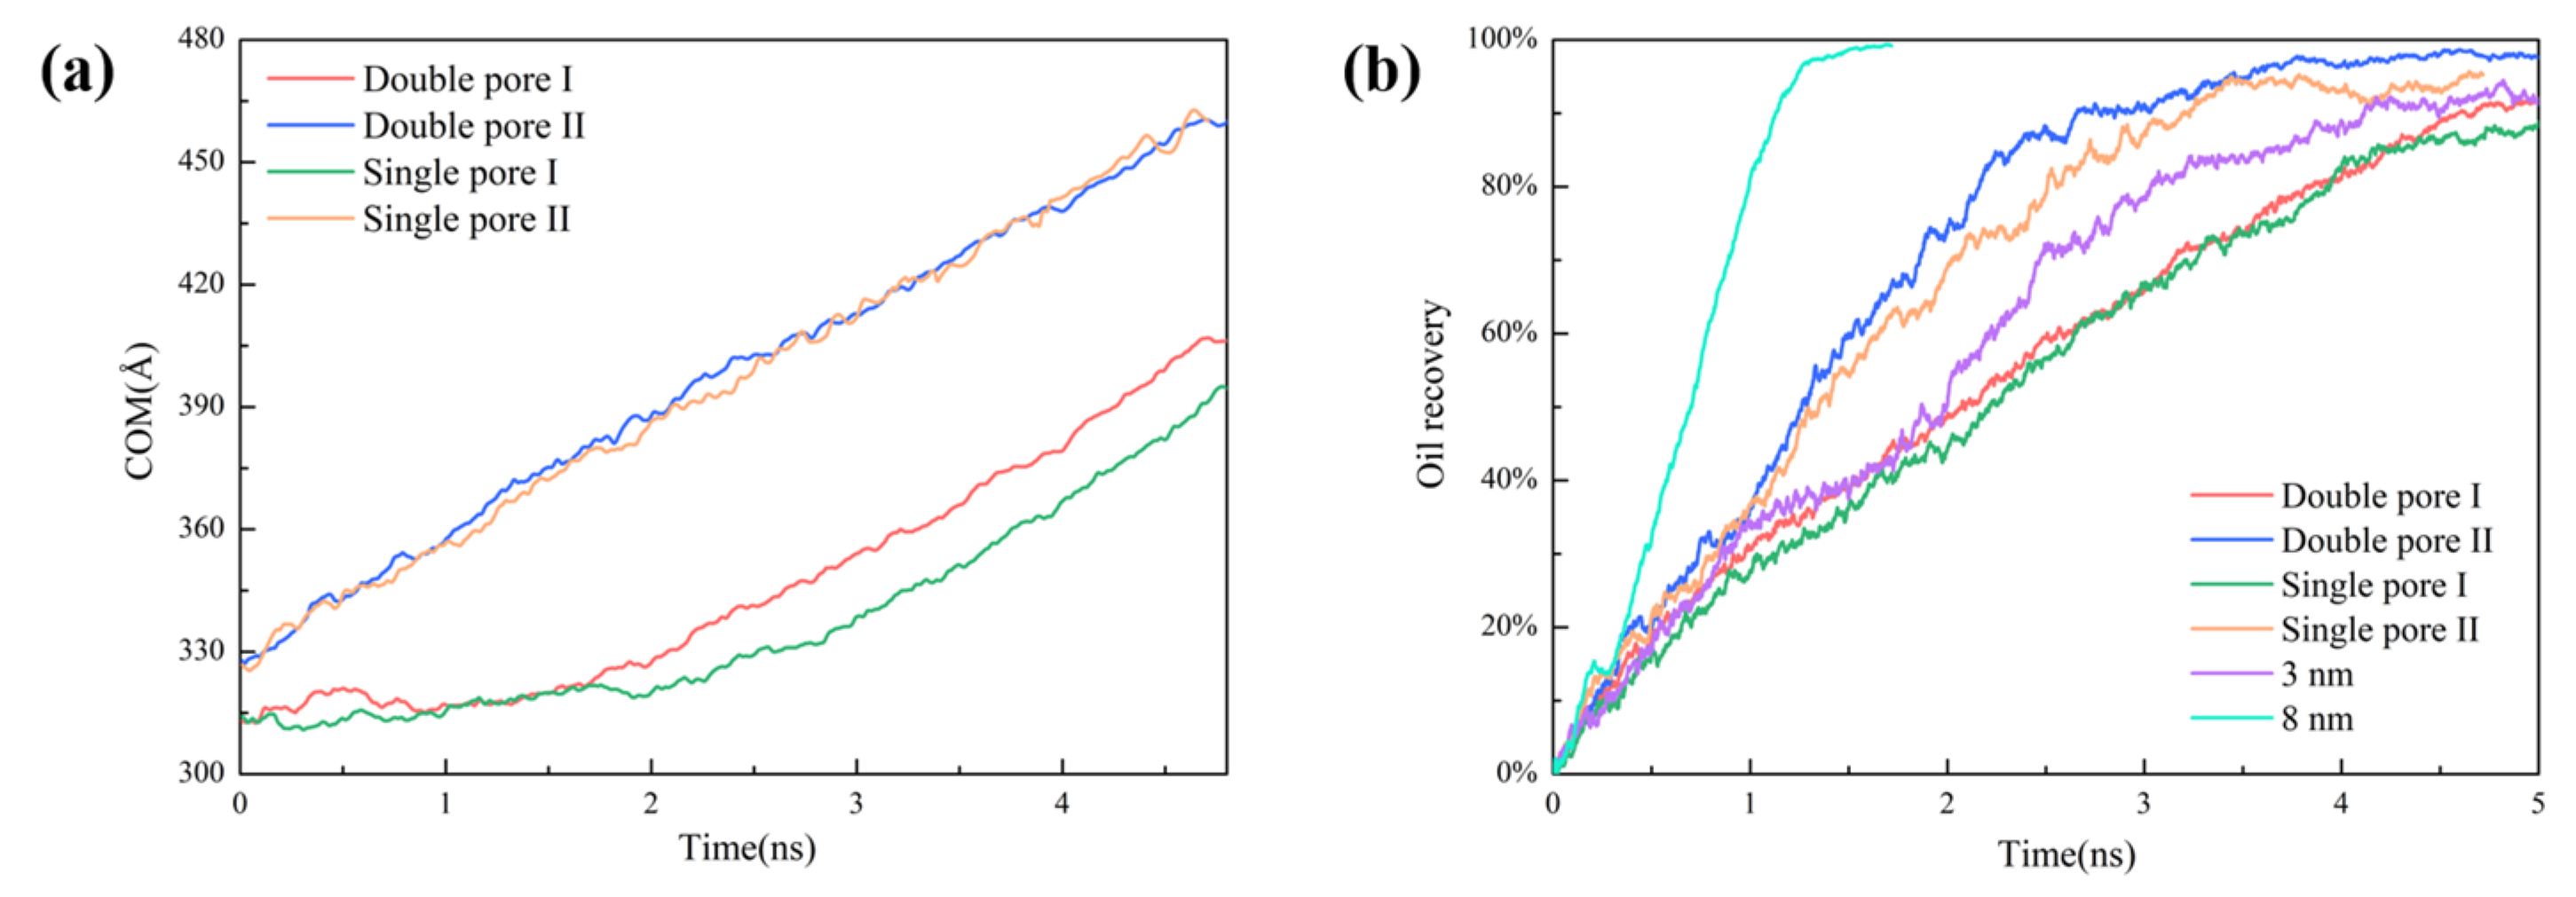
To better understand the oil recovery in wedge-shaped pores, the center of mass (COM) of oil molecules during the transport process was calculated. According to Figure 7a, COM changed more quickly in single pore Ⅱ and double pore Ⅱ than that in single pore Ⅰ and double pore Ⅰ, which was constrained by pores shape. In addition, the transport of oil molecules was faster, and the displacement efficiency was higher in double pores than that in single pores. The transport of oil molecules was accelerated in the double pore due to the "siphoning" phenomenon.
By comparing the crude oil recovery in Figure 7b, we can see that the displacement efficiency in wedge-shaped double pore Ⅱ was the highest, followed by single pore Ⅱ > double pore Ⅰ > single pore Ⅰ. This means the oil displacement efficiency would be improved in wedge-shaped double pores with respect to their corresponding single pores. To estimate the effect of wedge-shaped pores on oil recovery, we compared the displacement in wedge-shaped single pores with that in slit-shaped pores. As a whole, the efficiency of the displacement process followed the sequence of 8 nm > double pore Ⅱ > single pore Ⅱ > 3 nm > double pore Ⅰ > single pore Ⅰ. Compared with the 3 nm slit-shaped pores, a wedge-shaped single pore with an enlarged outlet size would be facile to the enhancement of oil recovery, while a wedge-shaped single pore with a larger inlet size would be unfavorable for the enhancement of oil recovery. Compared with the 8 nm slit-shaped pores, both the oil recovery and displacement rate would sharply decrease whether the inlet size decreased or outlet size decreased. In addition, the mean square displacement (MSD) in Figure S1 (Supplementary Material) shows that the fluidity in single pore Ⅱ and double pore Ⅱ was better than that in single pore Ⅰ and double pore Ⅰ, giving good support regarding the effect of wedge-shaped pores for oil recovery.

3. Models and Methodology

3.1. Modeling

The silica surface was chosen as the typical mineral composition and the α-square quartz crystalline surface along the (010) crystallographic direction was cut. One H atom was attached to each O atom on the surface to make it completely hydroxylated, so that the constructed rock surface conformed to the actual situation where the shale pore was hydrophilic [37,38,39]. The surface hydroxyl density was 9.6 nm−2, which was consistent with the results of the crystal chemistry calculations (5.9–18.8 nm−2) [40]. In addition, the effect of surface hydroxyl density in this study was investigated using some simple characterizations in the supporting material. The length of the rock surface in the Z-direction was 103.5 Å, the thickness in the Y-direction was 28.0 Å, and the widest point of the rock surface in the X-direction was 23.4 Å. The position of the silica surface was fixed. The narrowest point of the wedge-shaped nanopores was 30.0 Å and the widest point was 80.0 Å. Octane was used to represent shale oil during the displacement simulation in the medium, in which 517 molecules were randomly placed in single pore and 517 molecules were randomly placed in both of the double pores, with a total of 1034 octane molecules. To ensure that the results of this study were accurate, we also chose dodecane to represent the oil phase. Details are given in the supporting material. Figure 8a,b show the wedge-shaped single pore Ⅰ ranging in size from 8 nm to 3 nm, and single pore Ⅱ from 3 nm to 8 nm, respectively, and Figure 8c shows wedge-shaped double pores Ⅰ and Ⅱ. To compare with wedge-shaped pores, 3 nm and 8 nm slit-shaped pores were constructed, and the details can be found in the supporting information in Figure S4. Prior to the CO2 flooding simulation, a 3 ns equilibrium molecular dynamics simulation was performed to obtain a reasonable oil density at 333 K and 20 MPa based on the reservoir conditions. The displacement simulation was based on non-equilibrium molecular dynamics (NEMD). The NEMD simulations that were run for the wedge-shaped pores and 3 nm slit-shaped pore systems were 5 ns, and the 8 nm slit-shaped pore system was 2 ns. During the CO2 flooding simulation, a He plate was placed on the left and right sides, and different pressures were applied to the plates to generate a pressure difference that allowed CO2 to be injected. The pressure applied to the left side was 25 MPa, and the pressure applied to the right side was 20 MPa.

3.2. Simulation Details

For all of the models, periodic boundary conditions were used. With time step of 1 fs, all MD simulations were carried out in NVT system synthesis [41] by using the LAMMPS (Large-scale Atomic/Molecular Massively Parallel Simulator) program. The thermostat was a Nosé–Hoover [42] set to 333 K to regulate the temperature. The He plates and rock surfaces were regarded as rigid bodies. Octane molecules were modeled by using the OPLS-AA force field [43], CO2 was modeled by using the EMP2 force field [44,45], and the quartz rock surface was modeled by using the ClayFF force field [46]. The densities of oil and CO2 in the bulk phase state were computed and compared with the information in the standard database of the National Institute of Standards and Technology (NIST) in order to confirm the precision of each force field in our implemented system. The comparison results are shown in the supporting information Figure S5, where barely any density differences can be seen, indicating that the force fields we used in this study were appropriate. Utilizing the Ewald summation method [47,48], the long-range electrostatic interaction was calculated between two atoms, i and j, as the sum of the Lenard–Jones (LJ) and electrostatic potential energies [49]:
E i j = q i q j r i j + 4 ε i j [ ( σ i j r i j ) 12 ( σ i j r i j ) 6 ]
With a cut-off radius of 10.0 for the non-bonding interaction and a non-bonding energy E i j as the result, where r i j stands for the distance between two atoms i and j, q i and q j stand for the charges of those atoms, respectively, and ε i j and σ i j stand for the LJ trap depth and LJ radius between atoms i and j, respectively. The Lorentz–Berthelot rule governed how various atom types interact with one another [50]:
σ i j = 1 2 ( σ i i + σ j j )
ε i j = ( ε i i ε j j ) 1 2 t

4. Conclusions

In this work, CO2 flooding in four types of wedge-shaped pores, together with two types of slit-shaped pores were investigated by using molecular dynamics simulations. The main conclusions are as follows:
(1) In wedge-shaped pores, CO2 transport is much faster in single pore Ⅱ and double pore Ⅱ than that in single pore Ⅰ and double pore Ⅰ, and this flow velocity difference is more pronounced between double pores. During the oil displacement process, some oil molecules in wedge-shaped single pore Ⅰ and double pore Ⅰ diffuse into the left side of pores, and then oil molecules re-enter the wedge-shaped pores together with CO2, while this phenomenon does not appear in wedge-shaped single pore Ⅱ and double pore Ⅱ.
(2) In wedge-shaped pores, the “oil/CO2 inter-pore migration” mechanism is proposed according to the migration of oil/CO2 molecules from double pore Ⅰ to Ⅱ and the center of the mass analyses. The interaction and RDF analyses confirm that the oil has more contact with CO2, a better miscible phase, greater interaction, and faster displacement in the wide inlet in single pore Ⅰ and double pore Ⅰ, as well as in the wide outlet in single pore Ⅱ and double pore Ⅱ.
(3) The efficiency of the whole oil displacement process follows the sequence of 8 nm > double pore Ⅱ > single pore Ⅱ > 3 nm > double pore Ⅰ > single pore Ⅰ. The inlet and outlet of the pores have an influence on oil displacement, and the restriction influence from the outlet is much greater than that from the inlet.

Supplementary Materials

The following supporting information can be downloaded at: https://www.mdpi.com/article/10.3390/molecules28010188/s1. Figure S1: Mean square displacement of CO2 and oil phase in (a) double pores and (b) single pores. Figure S2: (a) 50% hydroxylated silicone surface; (b) density profiles of oil, (c) interaction energy between oil and rock surface, and (d) oil recovery in completely hydroxylated and 50% hydroxylated silicone surface. Figure S3: When dodecane represents the oil molecules, (a) the COM of oil with time; (b) oil recovery in double pore; (c) the number of oil molecules migrating from double pore Ⅰ to double pore Ⅱ and from double pore Ⅱ to double pore Ⅰ. (d) Left side: streamlines of oil molecules/CO2 fluid migration from double pore Ⅰ to double pore Ⅱ. Right side: snapshot of CO2 migration from double pore Ⅰ to double pore Ⅱ at different times (red: CO2 molecule; gray, cyan, green: oil phase; orange: shale rock surface). Figure S4: (a) 3 nm and (b) 8 nm slit-shaped pores (red: CO2 molecule, gray: oil phase, orange: shale rock surface). Figure S5: Density profiles of oil in (a) double pore; (b) single pore Ⅰ; (c) single pore Ⅱ; (d) 3 nm slit-shaped pore; (e) 8 nm slit-shaped pore (the red dashed line is the density of octane in NIST).

Author Contributions

Writing—original draft, writing—review and editing, conceptualization, methodology, L.W. (Lu Wang 1) and W.L.; data curation, formal analysis, Z.J.; supervision, L.W. (Lu Wang 2); writing—review and editing, S.L. (Sen Liu); data curation, H.F.; validation, X.Y.; software, S.W.; data curation, S.L. (Siyuan Liu); visualization, Z.W.; software, X.L. All authors have read and agreed to the published version of the manuscript.

Funding

This work was supported by The National Natural Science Foundation of China (22101300), Shandong Natural Science Foundation, China (ZR2022ME105, ZR2020ME053, and ZR2020QB027), State Key Laboratory of Enhanced Oil Recovery of Open Fund Funded Project (2022-KFKT-28), Major Special Projects of CNPC (2021ZZ01-03 and 2021ZZ01-05), and the Fundamental Research Funds for the Central Universities (20CX05010A and 22CX03010A).

Institutional Review Board Statement

The study did not involve humans or animals.

Informed Consent Statement

The study did not involve humans.

Data Availability Statement

Not applicable.

Acknowledgments

The support given by The National Natural Science Foundation of China, Shandong Natural Science Foundation, State Key Laboratory of Enhanced Oil Recovery of Open Fund Funded Project, Major Special Projects of CNPC, and the Fundamental Research Funds for the Central Universities is acknowledged.

Conflicts of Interest

The authors declare no conflict of interest.

References

  1. Haider, W.H. Estimates of total oil & gas reserves in the world, future of oil and gas companies and smart investments by E & P companies in renewable energy sources for future energy needs. In Proceedings of the International Petroleum Technology Conference, Dhahran, Saudi Arabia, 13–15 January 2020. [Google Scholar] [CrossRef]
  2. Raimi, D. The greenhouse gas effects of increased US oil and gas production. Energy Transit. 2020, 4, 45–56. [Google Scholar] [CrossRef] [Green Version]
  3. Morozov, I.V. Prospects for the development of the oil and gas industry in the regional and global economy. Int. J. Energy Econ. Policy 2018, 8, 55–62. [Google Scholar] [CrossRef]
  4. Loucks, R.G.; Reed, R.M.; Ruppel, S.C.; Hammes, U. Spectrum of pore types and networks in mudrocks and a descriptive classification for matrix-related mudrock pores. AAPG Bull. 2012, 96, 1071–1098. [Google Scholar] [CrossRef] [Green Version]
  5. Wang, H.; Feng, M.; Tong, X.; Liu, Z.; Zhang, X.; Wu, Z.; Li, D.; Wang, B.; Xie, Y.; Yang, L. Assessment of global unconventional oil and gas resources. Pet. Explor. Dev. 2016, 43, 925–940. [Google Scholar] [CrossRef]
  6. Alfi, M.; Barrufet, M.; Killough, J. Effect of pore sizes on composition distribution and enhance recovery from liquid shale—Molecular sieving in low permeability reservoirs. Fuel 2019, 235, 1555–1564. [Google Scholar] [CrossRef]
  7. Liu, Y.; Liu, X.; Hou, J.; Li, H.A.; Liu, Y.; Chen, Z. Technical and economic feasibility of a novel heavy oil recovery method: Geothermal energy assisted heavy oil recovery. Energy 2019, 181, 853–867. [Google Scholar] [CrossRef]
  8. Tavakkoli, O.; Kamyab, H.; Shariati, M.; Mohamed, A.M.; Junin, R. Effect of nanoparticles on the performance of polymer/surfactant flooding for enhanced oil recovery: A review. Fuel 2022, 312, 122867. [Google Scholar] [CrossRef]
  9. Su, Y.; Zhang, X.; Li, L.; Hao, Y.; Zhan, S.; Wang, W.; Wu, Z.; Zhang, W. Experimental study on microscopic mechanisms and displacement efficiency of N2 flooding in deep-buried clastic reservoirs. J. Pet. Sci. Eng. 2022, 208, 109789. [Google Scholar] [CrossRef]
  10. Liu, P.; Zhang, X. Enhanced oil recovery by CO2–CH4 flooding in low permeability and rhythmic hydrocarbon reservoir. Int. J. Hydrog. Energy 2015, 40, 12849–12853. [Google Scholar] [CrossRef]
  11. Hao, Y.; Wu, Z.; Ju, B.; Chen, Y.; Luo, X.; Petro, X. Laboratory investigation of CO2 flooding. In Proceedings of the Nigeria Annual International Conference and Exhibition, Abuja, Nigeria, 2–4 August 2004. [Google Scholar] [CrossRef]
  12. Thomas, S. Enhanced oil recovery-an overview. Oil Gas Sci. Technol. Rev. De L’ifp 2008, 63, 9–19. [Google Scholar] [CrossRef] [Green Version]
  13. Wang, P.; Li, X.; Tao, Z.; Wang, S.; Fan, J.; Feng, Q.; Xue, Q. The miscible behaviors and mechanism of CO2/CH4/C3H8/N2 and crude oil in nanoslits: A molecular dynamics simulation study. Fuel 2021, 304, 121461. [Google Scholar] [CrossRef]
  14. Abedini, A.; Torabi, F. Oil Recovery Performance of Immiscible and Miscible CO2 Huff -and -Puff Processes. Energy Fuels 2014, 28, 774–784. [Google Scholar] [CrossRef]
  15. Sun, G.; Zhang, H.; Wei, G.; Liu, D.; Li, C.; Yang, F.; Yao, B. Experimental Study on the Effective Viscosity of Unstable CO2 Flooding Produced Fluid with the Energy Dissipation Method. Ind. Eng. Chem. Res. 2019, 59, 1308–1318. [Google Scholar] [CrossRef]
  16. Wang, X.; Liu, L.; Lun, Z.; Lv, C.; Wang, R.; Wang, H.; Zhang, D. Effect of Contact Time and GasComponent on Interfacial Tension of CO2/Crude Oil Systemby Pendant Drop Method. J. Spectrosc. 2015, 2015, 285891. [Google Scholar] [CrossRef] [Green Version]
  17. He, L.; Shen, P.; Liao, X.; Li, F.; Gao, Q.; Wang, Z. Potential evaluation of CO2 EOR and sequestration in Yanchang oilfield. J. Energy Inst. 2016, 89, 215–221. [Google Scholar] [CrossRef]
  18. Gerritsen, M.G.; Durlofsky, L.J. Modeling fluid flow in oil reservoirs. Annu. Rev. Fluid Mech. 2005, 37, 211. [Google Scholar] [CrossRef]
  19. Zha, X.; Lai, F.; Gao, X.; Gao, Y.; Jiang, N.; Luo, L.; Li, Y.; Wang, J.; Peng, S.; Luo, X.; et al. Characteristics and Genetic Mechanism of Pore Throat Structure of Shale Oil Reservoir in Saline Lake—A Case Study of Shale Oil of the Lucaogou Formation in Jimsar Sag, Junggar Basin. Energies 2021, 14, 8450. [Google Scholar] [CrossRef]
  20. Zhu, P.; Balhoff, M.T.; Mohanty, K.K. Simulation of fracture-to-fracture gas injection in an oil-rich shale. In Proceedings of the SPE Annual Technical Conference and Exhibition, Houston, TX, USA, 28–30 September 2015. [Google Scholar] [CrossRef]
  21. Zang, Q.; Liu, C.; Awan, R.S.; Yang, X.; Lu, Z.; Li, G.; Wu, Y.; Feng, D.; Ran, Y. Comparison of Pore Size Distribution, Heterogeneity and Occurrence Characteristics of Movable Fluids of Tight Oil Reservoirs Formed in Different Sedimentary Environments: A Case Study of the Chang 7 Member of Ordos Basin, China. Nat. Resour. Res. 2022, 31, 415–442. [Google Scholar] [CrossRef]
  22. Lai, J.; Wang, G.; Wang, Z.; Chen, J.; Pang, X.; Wang, S.; Zhou, Z.; He, Z.; Qin, Z.; Fan, X. A review on pore structure characterization in tight sandstones. Earth Sci. Rev. 2018, 177, 436–457. [Google Scholar] [CrossRef]
  23. Xiao, D.; Lu, S.; Yang, J.; Zhang, L.; Li, B. Classifying multiscale pores and investigating their relationship with porosity and permeability in tight sandstone gas reservoirs. Energy Fuels 2017, 31, 9188–9200. [Google Scholar] [CrossRef]
  24. Shen, R.; Xiong, W.; Lang, X.; Wang, L.; Guo, H.; Zhou, H.; Zhang, X.; Yang, H. Quantitative analysis of nano-scale pore structures of broad sense shale oil reservoirs using atomic force microscopy. Energy Explor. Exploit. 2021, 39, 1839–1856. [Google Scholar] [CrossRef]
  25. Zhang, F.; Jiang, Z.; Sun, W.; Zhang, X.; Zhu, L.; Li, X.; Zhao, W. Effect of microscopic pore-throat heterogeneity on gas-phase percolation capacity of tight sandstone reservoirs. Energy Fuels 2020, 34, 12399–12416. [Google Scholar] [CrossRef]
  26. Fang, T.; Zhang, Y.; Ma, R.; Yan, Y.; Dai, C.; Zhang, J. Oil extraction mechanism in CO2 flooding from rough surface: Molecular dynamics simulation. Appl. Surf. Sci. 2019, 494, 80–86. [Google Scholar] [CrossRef]
  27. Lu, P.; Mo, T.; Wei, Y.; Guo, Z.; Feng, G. Molecular insight into oil displacement by CO2 flooding on rough silica surface. J. Supercrit. Fluids 2022, 181, 105507. [Google Scholar] [CrossRef]
  28. Sedghi, M.; Piri, M.; Goual, L. Molecular dynamics of wetting layer formation and forced water invasion in angular nanopores with mixed wettability. J. Chem. Phys. 2014, 141, 194703. [Google Scholar] [CrossRef] [Green Version]
  29. Deng, Y.; Chen, S.; Pu, X.; Yan, J. Characteristics and controlling factors of shale oil reservoir spaces in the Bohai Bay Basin. Acta Geol. Sin. Engl. Ed. 2020, 94, 253–268. [Google Scholar] [CrossRef]
  30. Lashin, A.A.; El-Naby, A.A. Petrophysical, seismic structural and facies analysis of the Miocene reservoirs of East Morgan oil field, Gulf of Suez, Egypt. Arab. J. Geosci. 2014, 7, 3481–3504. [Google Scholar] [CrossRef]
  31. Fang, T.; Li, S.; Zhang, Y.; Su, Y.; Yan, Y.; Zhang, J. How the oil recovery in deep oil reservoirs is affected by injected gas types: A molecular dynamics simulation study. Chem. Eng. Sci. 2021, 231, 116286. [Google Scholar] [CrossRef]
  32. Xu, J.; Yuan, Y.; Xie, Q.; Wei, X. Research on the application of molecular simulation technology in enhanced oil-gas recovery engineering. E3S Web Conf. 2021, 233, 01124. [Google Scholar] [CrossRef]
  33. Li, X.; Xue, Q.; Zhu, L.; Jin, Y.; Wu, T.; Guo, Q.; Zheng, H.; Lu, S. How to select an optimal surfactant molecule to speed up the oil-detachment from solid surface: A computational simulation. Chem. Eng. Sci. 2016, 147, 47–53. [Google Scholar] [CrossRef]
  34. Fang, T.; Wang, M.; Wang, C.; Liu, B.; Shen, Y.; Dai, C.; Zhang, J. Oil detachment mechanism in CO2 flooding from silica surface: Molecular dynamics simulation. Chem. Eng. Sci. 2017, 16, 17–22. [Google Scholar] [CrossRef]
  35. Luo, Y.; Liu, X.; Xiao, H.; Zheng, T. Microscopic production characteristics of tight oil in the nanopores of different CO2-affected areas from molecular dynamics simulations. Sep. Purif. Technol. 2022, 306, 122607. [Google Scholar] [CrossRef]
  36. Liu, B.; Wang, C.; Zhang, J.; Xiao, S.; Zhang, Z.; Shen, Y.; Sun, B.; He, J. Displacement mechanism of oil in shale inorganic nanopores by supercritical carbon dioxide from molecular dynamics simulations. Energy Fuels 2017, 31, 738–746. [Google Scholar] [CrossRef]
  37. Wang, S.; Javadpour, F.; Feng, Q. Molecular dynamics simulations of oil transport through inorganic nanopores in shale. Fuel 2016, 171, 74–86. [Google Scholar] [CrossRef]
  38. Skelton, A.A.; Fenter, P.; Kubicki, J.D.; Wesolowski, D.J.; Cummings, P.T. Simulations of the quartz (1011)/water interface: A comparison of classical force fields, ab initio molecular dynamics, and X-ray reflectivity experiments. J. Phys. Chem. C 2011, 115, 2076–2088. [Google Scholar] [CrossRef]
  39. Skelton, A.A.; Wesolowski, D.J.; Cummings, P.T. Investigating the quartz (1010)/water interface using classical and ab initio molecular dynamics. Langmuir 2011, 27, 8700–8709. [Google Scholar] [CrossRef] [PubMed]
  40. Koretsky, C.M.; Sverjensky, D.A.; Sahai, N. A model of surface site types on oxide and silicate minerals based on crystal chemistry; implications for site types and densities, multi-site adsorption, surface infrared spectroscopy, and dissolution kinetics. Am. J. Sci. 1998, 298, 349–438. [Google Scholar] [CrossRef]
  41. Plimpton, S. Fast parallel algorithms for short-range molecular dynamics. J. Comput. Phys. 1995, 117, 1–19. [Google Scholar] [CrossRef] [Green Version]
  42. Nosé, S. A unified formulation of the constant temperature molecular dynamics methods. J. Chem. Phys. 1984, 81, 511–519. [Google Scholar] [CrossRef] [Green Version]
  43. Jorgensen, W.L.; Maxwell, D.S.; Tirado-Rives, J. Development and testing of the OPLS all-atom force field on conformational energetics and properties of organic liquids. J. Am. Chem. Soc. 1996, 118, 11225–11236. [Google Scholar] [CrossRef]
  44. Harris, J.G.; Yung, K.H. Carbon dioxide’s liquid-vapor coexistence curve and critical properties as predicted by a simple molecular model. J. Phys. Chem. 1995, 99, 12021–12024. [Google Scholar] [CrossRef]
  45. Headen, T.F.; Boek, E.S. Molecular dynamics simulations of asphaltene aggregation in supercritical carbon dioxide with and without limonene. Energy Fuels 2011, 25, 503–508. [Google Scholar] [CrossRef]
  46. Cygan, R.T.; Liang, J.J.; Kalinichev, A.G. Molecular models of hydroxide, oxyhydroxide, and clay phases and the development of a general force field. J. Phys. Chem. B 2004, 108, 1255–1266. [Google Scholar] [CrossRef]
  47. Toukmaji, A.Y.; Board, J.A., Jr. Ewald summation techniques in perspective: A survey. Comput. Phys. Commun. 1996, 95, 73–92. [Google Scholar] [CrossRef]
  48. Nymand, T.M.; Linse, P. Ewald summation and reaction field methods for potentials with atomic charges, dipoles, and polarizabilities. J. Chem. Phys. 2000, 112, 6152–6160. [Google Scholar] [CrossRef]
  49. Fang, T.; Zhang, Y.; Liu, J.; Ding, B.; Yan, Y.; Zhang, J. Molecular insight into the miscible mechanism of CO2/C10 in bulk phase and nanoslits. Int. J. Heat Mass Transf. 2019, 141, 643–650. [Google Scholar] [CrossRef]
  50. Chen, J.; Mi, J.G.; Chan, K.Y. Comparison of different mixing rules for prediction of density and residual internal energy of binary and ternary Lennard–Jones mixtures. Fluid Phase Equilibria 2001, 178, 87–95. [Google Scholar] [CrossRef]
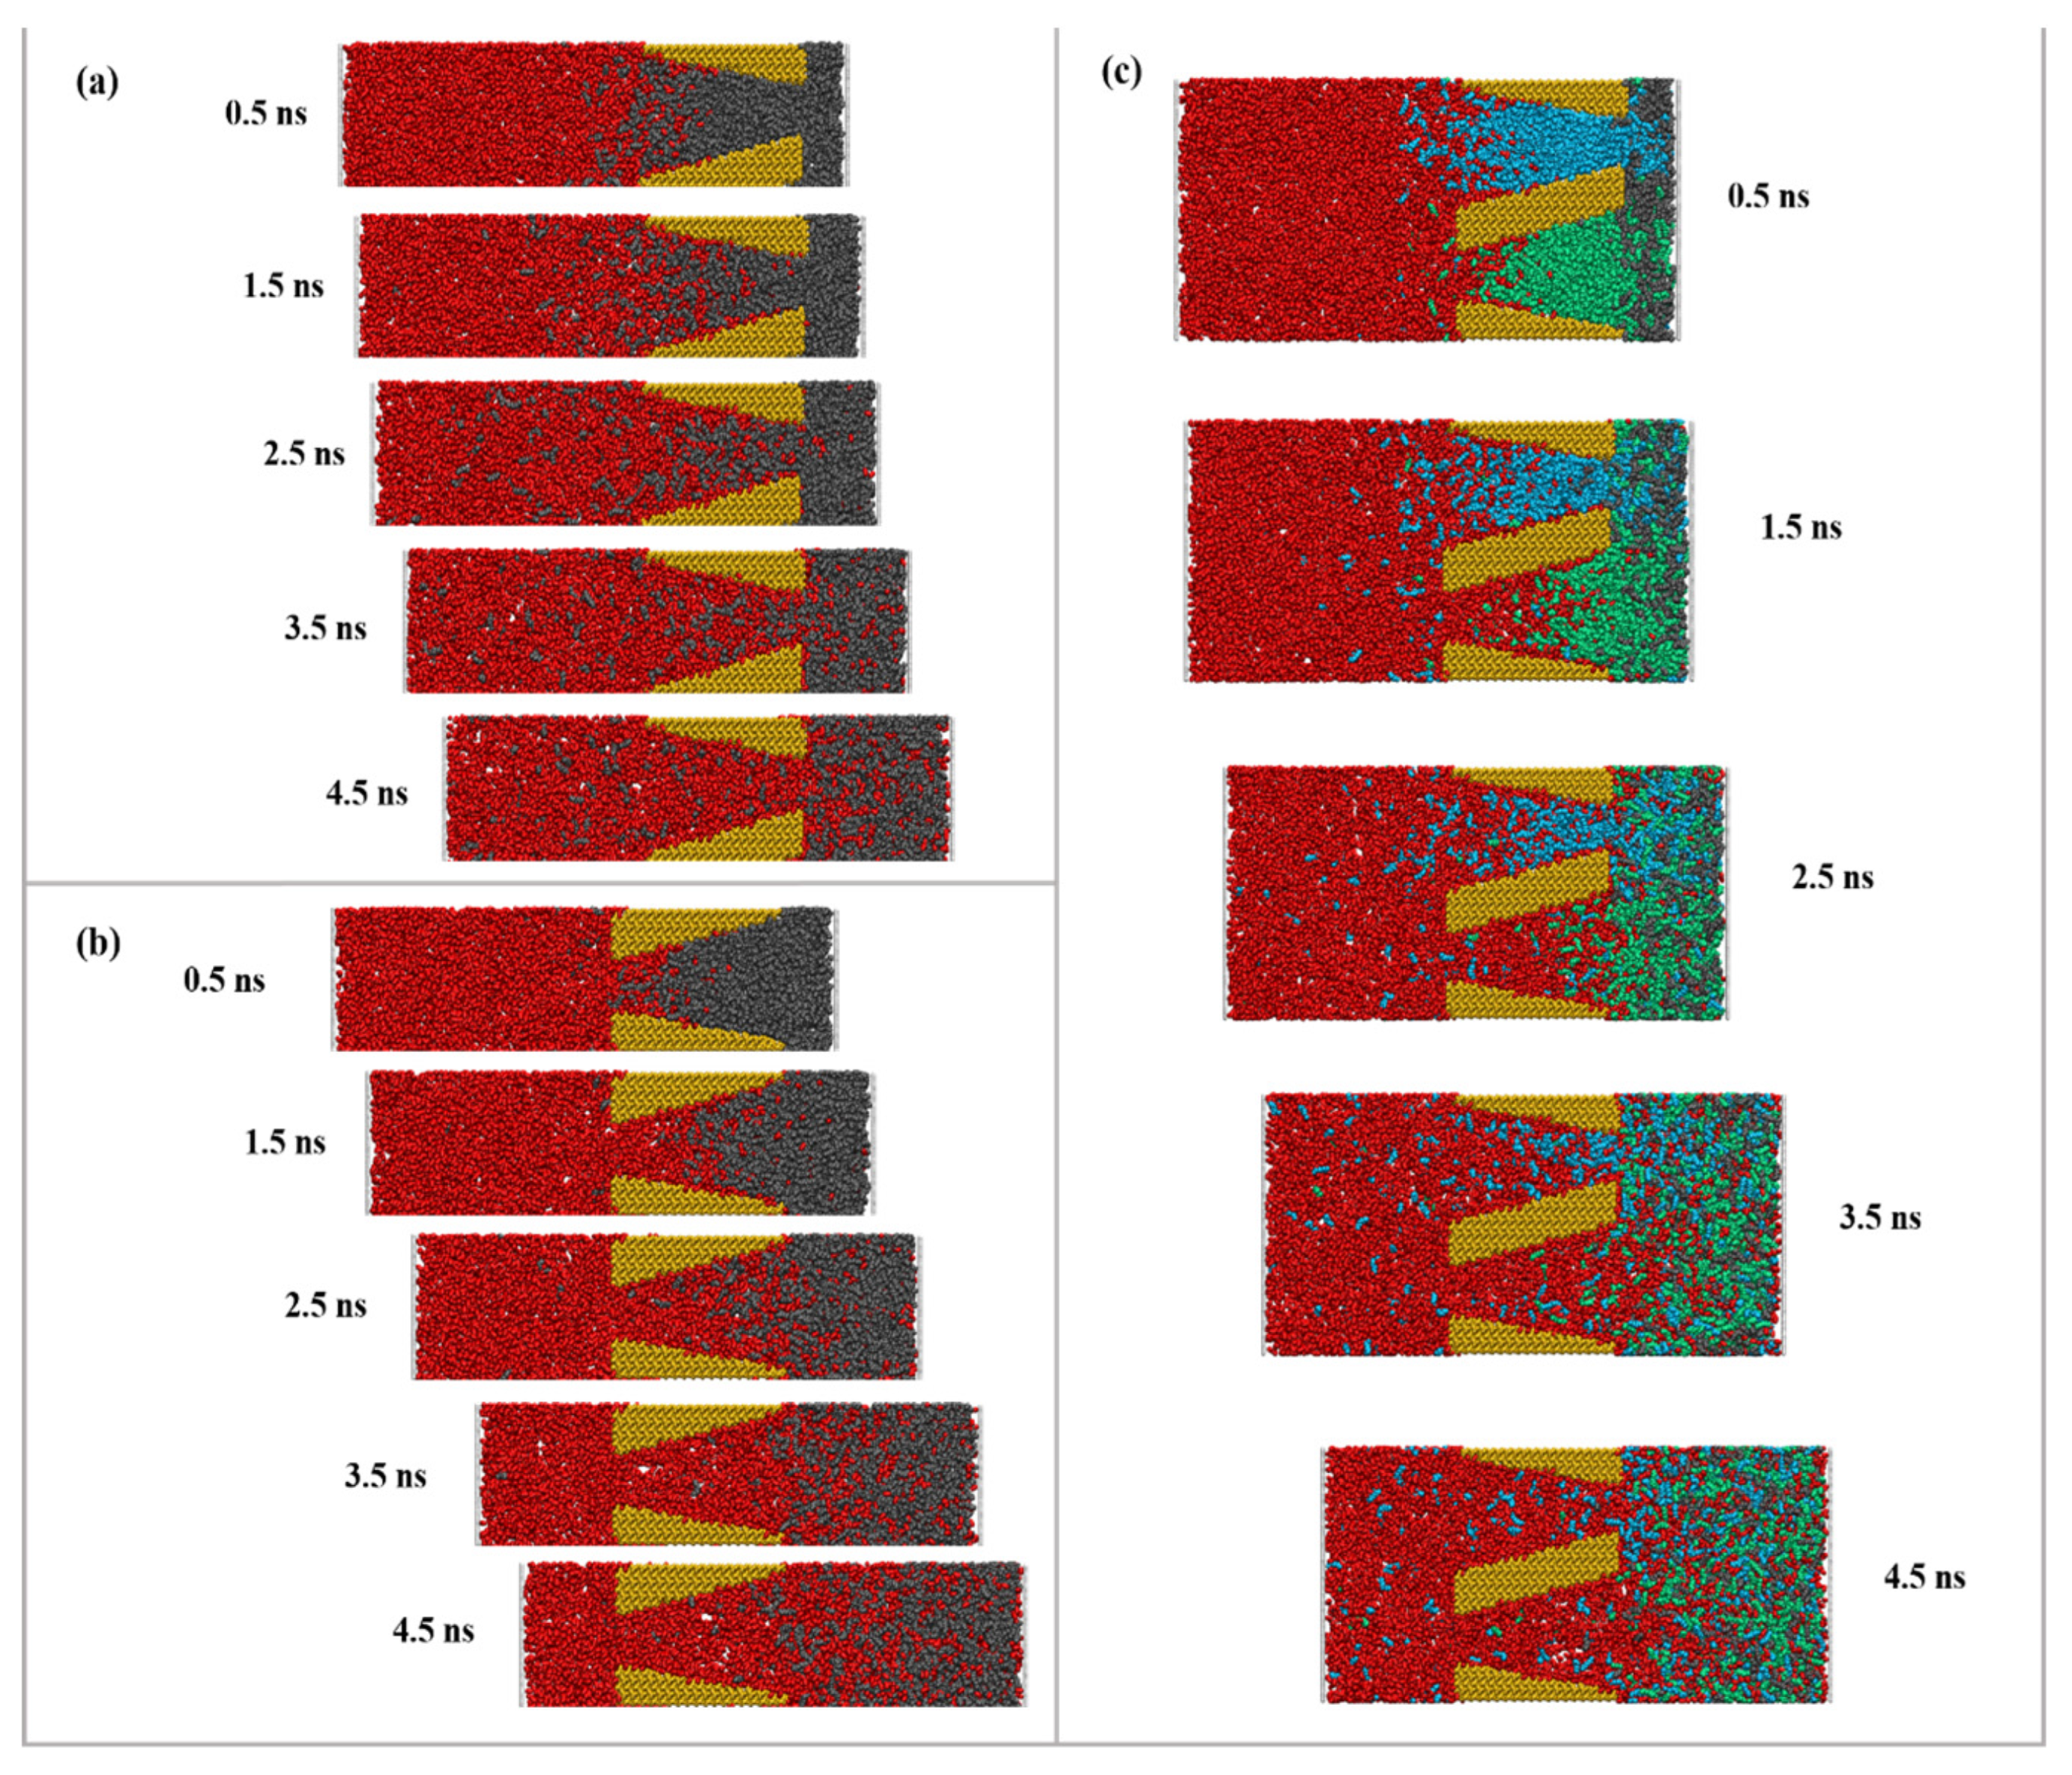
Figure 1. Snapshots to indicate the evolutions of CO2 flooding in (a) single pore Ⅰ; (b) single pore Ⅱ; (c) double pore.
Molecules 28 00188 g001
Figure 2. (a) The number of CO2 molecules entering in each wedge-shaped pore and (b) the ratio of residual oil.
Molecules 28 00188 g002
Figure 3. (a) The number of oil molecules on the left side of double pore Ⅰ and single pore Ⅰ; (b) number of oil molecules migrating from double pore Ⅰ to double pore Ⅱ and from double pore Ⅱ to double pore Ⅰ.
Molecules 28 00188 g003
Figure 4. Left side: streamlines of oil molecules/CO2 fluid migration from double pore Ⅰ to double pore Ⅱ. Right side: snapshot of CO2 migration from double pore Ⅰ to double pore Ⅱ at different times.
Molecules 28 00188 g004
Figure 5. Interaction energy between (a) oil and rock surface, and (b) CO2 and oil during oil displacement at 333 K.
Molecules 28 00188 g005
Figure 6. Radial distribution function g(r) between C (CO2)-C (oil) atoms in (a) double pore Ⅰ, (b) double pore Ⅱ, (c) single pore Ⅰ, and (d) single pore Ⅱ.
Molecules 28 00188 g006
Figure 7. (a) COM of oil with time, and (b) oil recovery in different pore structures.
Molecules 28 00188 g007
Figure 8. (a) Wedge-shaped single pore Ⅰ with 8 to 3 nm sized pores; (b) wedge-shaped single pore Ⅱ with 3 to 8 nm pore; (c) wedge-shaped double pore, pore size 3 to 8 nm for double pore Ⅰ, 8 to 3 nm for double pore Ⅱ (red: CO2 molecule; gray, cyan, green: oil phase; orange: shale rock surface).
Molecules 28 00188 g008
Disclaimer/Publisher’s Note: The statements, opinions and data contained in all publications are solely those of the individual author(s) and contributor(s) and not of MDPI and/or the editor(s). MDPI and/or the editor(s) disclaim responsibility for any injury to people or property resulting from any ideas, methods, instructions or products referred to in the content.