Article

Luminescent Properties of Phosphonate Ester-Supported Neodymium(III) Nitrate and Chloride Complexes

1
Institute of Nanostructure Technologies and Analytics (INA) and CINSaT, University of Kassel, Heinrich-Plett-Str. 40, 34132 Kassel, Germany
2
Institute of Chemistry and Center for Interdisciplinary Nanostructure Science and Technology (CINSaT), University of Kassel, Heinrich-Plett-Str. 40, 34132 Kassel, Germany
*
Author to whom correspondence should be addressed.
Molecules 2023, 28(1), 48; https://doi.org/10.3390/molecules28010048
Submission received: 27 November 2022 / Revised: 12 December 2022 / Accepted: 15 December 2022 / Published: 21 December 2022
(This article belongs to the Special Issue Exclusive Feature Papers in Physical Chemistry)

Abstract

:
This study examines the synthesis of two geminal bisphosphonate ester-supported Ln3+ complexes [Ln(L3)2(NO3)3] (Ln = Nd3+ (5), La3+ (6)) and optical properties of the neodymium(III) complex. These results are compared to known mono-phosphonate ester-based Nd3+ complexes [Nd(L1/L2)3X3]n (X = NO3, n = 1; Cl, n = 2) (14). The optical properties of Nd3+ compounds are determined by micro-photoluminescence (µ-PL) spectroscopy which reveals three characteristic metal-centered emission bands in the NIR region related to transitions from 4F3/2 excited state. Additionally, two emission bands from 4F5/2, 2H9/24IJ (J = 11/2, 13/2) transitions were observed. PL spectroscopy of equimolar complex solutions in dry dichloromethane (DCM) revealed remarkably higher emission intensity of the mono-phosphonate ester-based complexes in comparison to their bisphosphonate ester congener. The temperature-dependent PL measurements enable assignment of the emission lines of the 4F3/24I9/2 transition. Furthermore, low-temperature polarization-dependent measurements of the transitions from R1 and R2 Stark sublevel of 4F3/2 state to the 4I9/2 state for crystals of [Nd(L3)2(NO3)3] (5) are discussed.

Graphical Abstract

1. Introduction

Luminescent lanthanide(III) (Ln3+) ions have attracted considerable research interest due to their versatile photophysical properties [1,2,3,4,5], which are related to their 4f electrons: Due to their small radial distribution, 4f electrons exhibit minimal interaction and little involvement in chemical bonding with surrounding ligands, since they are effectively shielded by electrons of the 5s and 5p shell. Thus, Ln3+ luminescence exhibits characteristic narrow emission bands (FWHM < 10 nm) [6,7] along with relatively long emission lifetimes in a micro- or millisecond range [8,9,10]. This UV/Vis-to-NIR photoluminescence results from intra-configurational 4f-4f transitions [11] which are Laporte forbidden, but partially permitted by mixing of 4f and 5d orbitals or with charge transfer states of neighboring ligands [6,12].
Luminescence of Ln3+ ions has received considerable attention due to potential applications in a variety of technological fields such as light-emitting diodes [13,14,15], bioimaging [16,17,18,19,20], optical telecommunication [21,22,23], and luminescent ratiometric thermometers [24,25,26,27,28,29,30]. Especially Nd3+ ions have attracted interest for the development of diode-pumped solid-state lasers based on Nd-doped crystals [31,32,33,34,35,36], used for medical applications [37,38] and material processing [39,40,41]. We previously reported the synthesis of mono-phosphonate ester-supported Ln3+ (Ln=La, Nd, Dy, Er) complexes including their structural and optical characterizations [42]. Starting with various mono-phosphonate esters featuring varied aromatic residues, mono- or dimeric lanthanide complexes of the type [Ln(L)3X3]n (14) (L = phosphonate ester ligand; X = NO3, n = 1; Cl, n = 2) were synthesized. Room temperature (RT) absorption as well as luminescence spectra of Dy3+ and Nd3+ complexes were reported. In this work, we present additional synthesis and characterization of two geminal bisphosphonate ester-supported Ln3+ complexes [Ln(L3)2(NO3)3] (Ln = Nd3+ (5), La3+ (6)) (for preparation of L3 see [43]) as well as a comparison of the photoluminescence properties of the Nd3+ derivative 5 to compounds 14. Micro-photoluminescence (µ-PL) studies of the complexes at RT reveal the characteristic emission bands of neodymium(III) ions which are centered around 890 nm, 1060 nm, and 1350 nm, corresponding to the 4F3/24I9/2, 4F3/24I11/2, and 4F3/24I13/2 transitions, respectively. Furthermore, two transition bands assigned to transitions from 4F5/2 and 2H9/2 excited states to 4IJ (J = 11/2, 13/2) were detected. Evaluation of RT measurements of equimolar complex solutions provide insight into the emission strength of the various complexes. High-resolution µ-PL measurements of solid bulk material at liquid helium temperature (5 K) give detailed information on the three characteristic emission bands of neodymium(III) ions corresponding to transitions from the 4F3/2 manifold. Low-temperature polarization-dependent µ-PL measurements reveal information about the crystal orientation of the complex [Nd(L3)2(NO3)3] (5).

2. Results

2.1. Mono-Phosphonate Ester-Based Nd3+ Complexes 14 and the Geminal Bisphosphonate Ester-Supported Complexes 5 (Nd3+) and 6 (La3+)

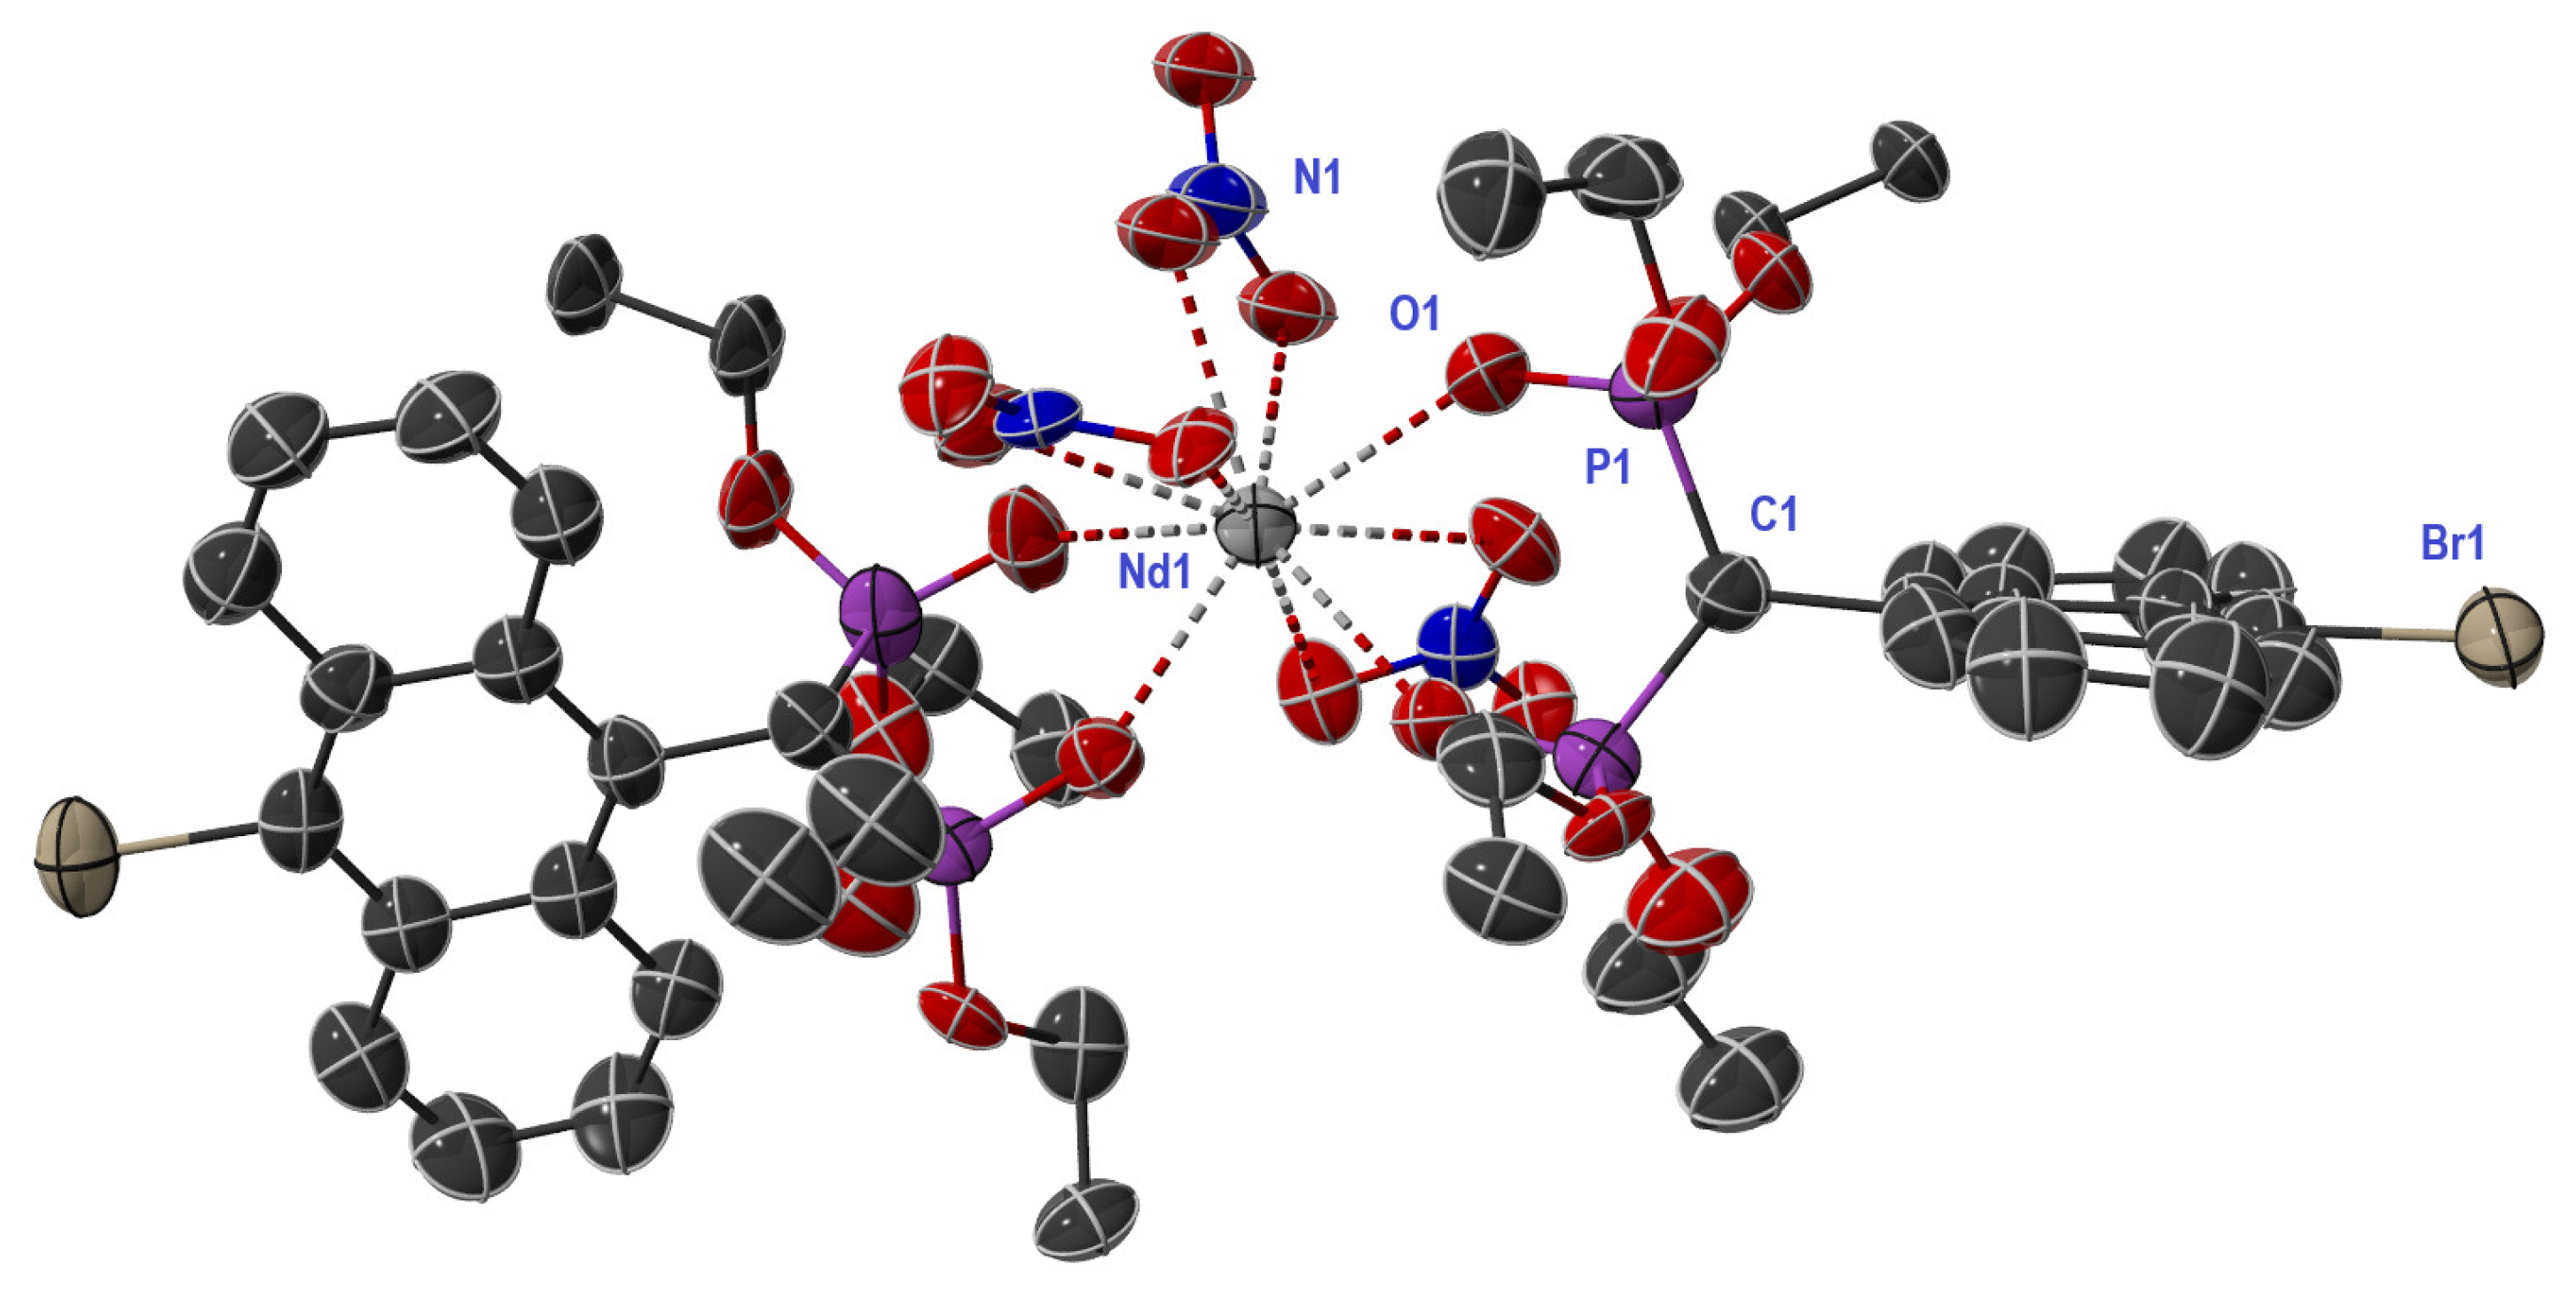
The ligand platforms L1L3 as well as complexes 14 are synthesized according to literature procedures (Scheme 1a,b) [15,16]. For the preparation of the latter, three equivalents of ligand L1 or L2 are combined with a [Nd(H2O)6X3] (X = NO3 or Cl) precursor in EtOH solution. Compounds [Ln(L3)2(NO3)3] (Ln = Nd3+ (5) or La3+ (6)) are prepared in the same manner, but under the addition of only two equivalents of geminal bisphosphonate ester L3 and are obtained as pale-yellow to yellow solids. The lanthanum(III) derivative is prepared in order to have additional access to NMR spectroscopy as a powerful analytic tool. In comparison to free L3 which exhibits a 31P{1H} NMR resonance at 19.4 ppm [16], complex 6 shows a slightly high field shifted signal at 18.8 ppm. The same observation can be made in the 1H NMR spectrum for the corresponding methine bridge proton of the P–C–P moiety. The triplet resonance at 5.48 ppm (2JPH = 30.8 Hz) of free L3 is shifted to 5.39 ppm in complex 6. The P=O vibration at 1252 cm−1 of free L3 becomes red-shifted to 1222 cm−1 (5) and 1221 cm−1 (6) upon coordination to an electron deficient metal ion corresponding to a slight weakening of the P=O bond (SI, Figures S5 and S6). In general, the P=O vibrations are in good agreement with those observed for other related phosphonate ester-supported lanthanide complexes [42,44,45,46,47]. Crystals of [Nd(L3)2(NO3)3] (5) and [La(L3)2(NO3)3] (6) are obtained from vapor diffusion of pentanes into saturated tetrahydrofuran (THF) solutions of each complex. The compounds are isostructural, both crystallizing in the monoclinic space group C2/c as well as showing half a molecule in the asymmetric unit. The molecular structure of [Nd(L3)2(NO3)3] (5) is exemplarily shown in Figure 1. Complexes 5 and 6 adopt a doubly-capped square-antiprismatic geometry in a ten-fold all-O coordination.
The Ln–OP=O (5: 2.443(5); 6: 2.525(5)) and Ln–ONO3 (5: 2.570(11); 6: 2.629(18)) distances increase going from complex [Nd(L3)2(NO3)3] (5) to [La(L3)2(NO3)3] (6) in accordance with an increasing ionic radius from Nd3+ (1.11 Å) to La3+ (1.16 Å) [48]. The free ligand L3 shows merged P=O and P–C bond lengths of 1.462(4) Å and 1.806(6) Å, respectively. [16] In contrast, the P=O (5: 1.466(5) Å; 6: 1.467(5) Å) distance becomes slightly elongated while the P–C bond (5: 1.779(7) Å; 6: 1.788(7) Å) becomes somewhat shortened upon lanthanide ion coordination. To properly host the metal ions, the observed P–C–P angle (5: 118.4(4) °; 6: 117.8(4)) is less acute than in the free ligand system L3 (113.7(3)). The OP=O–Ln–OP=O (5: 72.5(16); 6: 71.4(16)) angle expectedly decreases when switching from the smaller Nd3+ to the bigger La3+ ion.

2.2. Photoluminescence Properties

2.2.1. Room Temperature Emission Properties of Nd3+ Complexes 15 from Amorphous Solids and Solutions

Neodymium(III) complex [Nd(L3)2(NO3)3] (5) exhibits a broad absorption band in the UV range due to ligand absorption as well as sharp absorption bands between 500 to 850 nm, characteristic of Nd3+ ions (see Figure S7 in SI file). Excitation of the synthesized Nd3+ complexes at 750 nm, which is resonant with the 4I9/24F7/2, 4S3/2 transition, results in the detection of three emission bands in the NIR region (centered around 890 nm, 1060 nm, and 1350 nm). These are associated with the electronic transitions 4F3/24I9/2, 4F3/24I11/2, and 4F3/24I13/2, respectively. Pumping into the 4F7/2, 4S3/2 levels also enable the detection of two emission lines from the 4F5/2, 2H9/2 excited states (4F5/2, 2H9/24IJ) centered around 960 nm (J = 11/2) and 1180 nm (J = 13/2). However, following non-radiative decay and due to the small energy gap between 4F5/2, 2H9/2 levels, and 4F3/2, emission from the lower excited state represents the dominant process. Figure 2 depicts RT emission spectra of [Nd(L1)3Cl3]2 (2) highlighting the relatively weak transition bands from the 4F5/2, 2H9/2 states as insets, which were detected also for the other Nd3+ complexes. These emission bands from 4F5/2, 2H9/2 states cannot be observed from conventional laser materials such as Nd:YAG, but were observed from Nd-doped lead halides [49,50,51]. Lead halides represent solid-state host materials with low maximum phonon energy and therefore less quenching of luminescence from 4F5/2, 2H9/2 excited states.
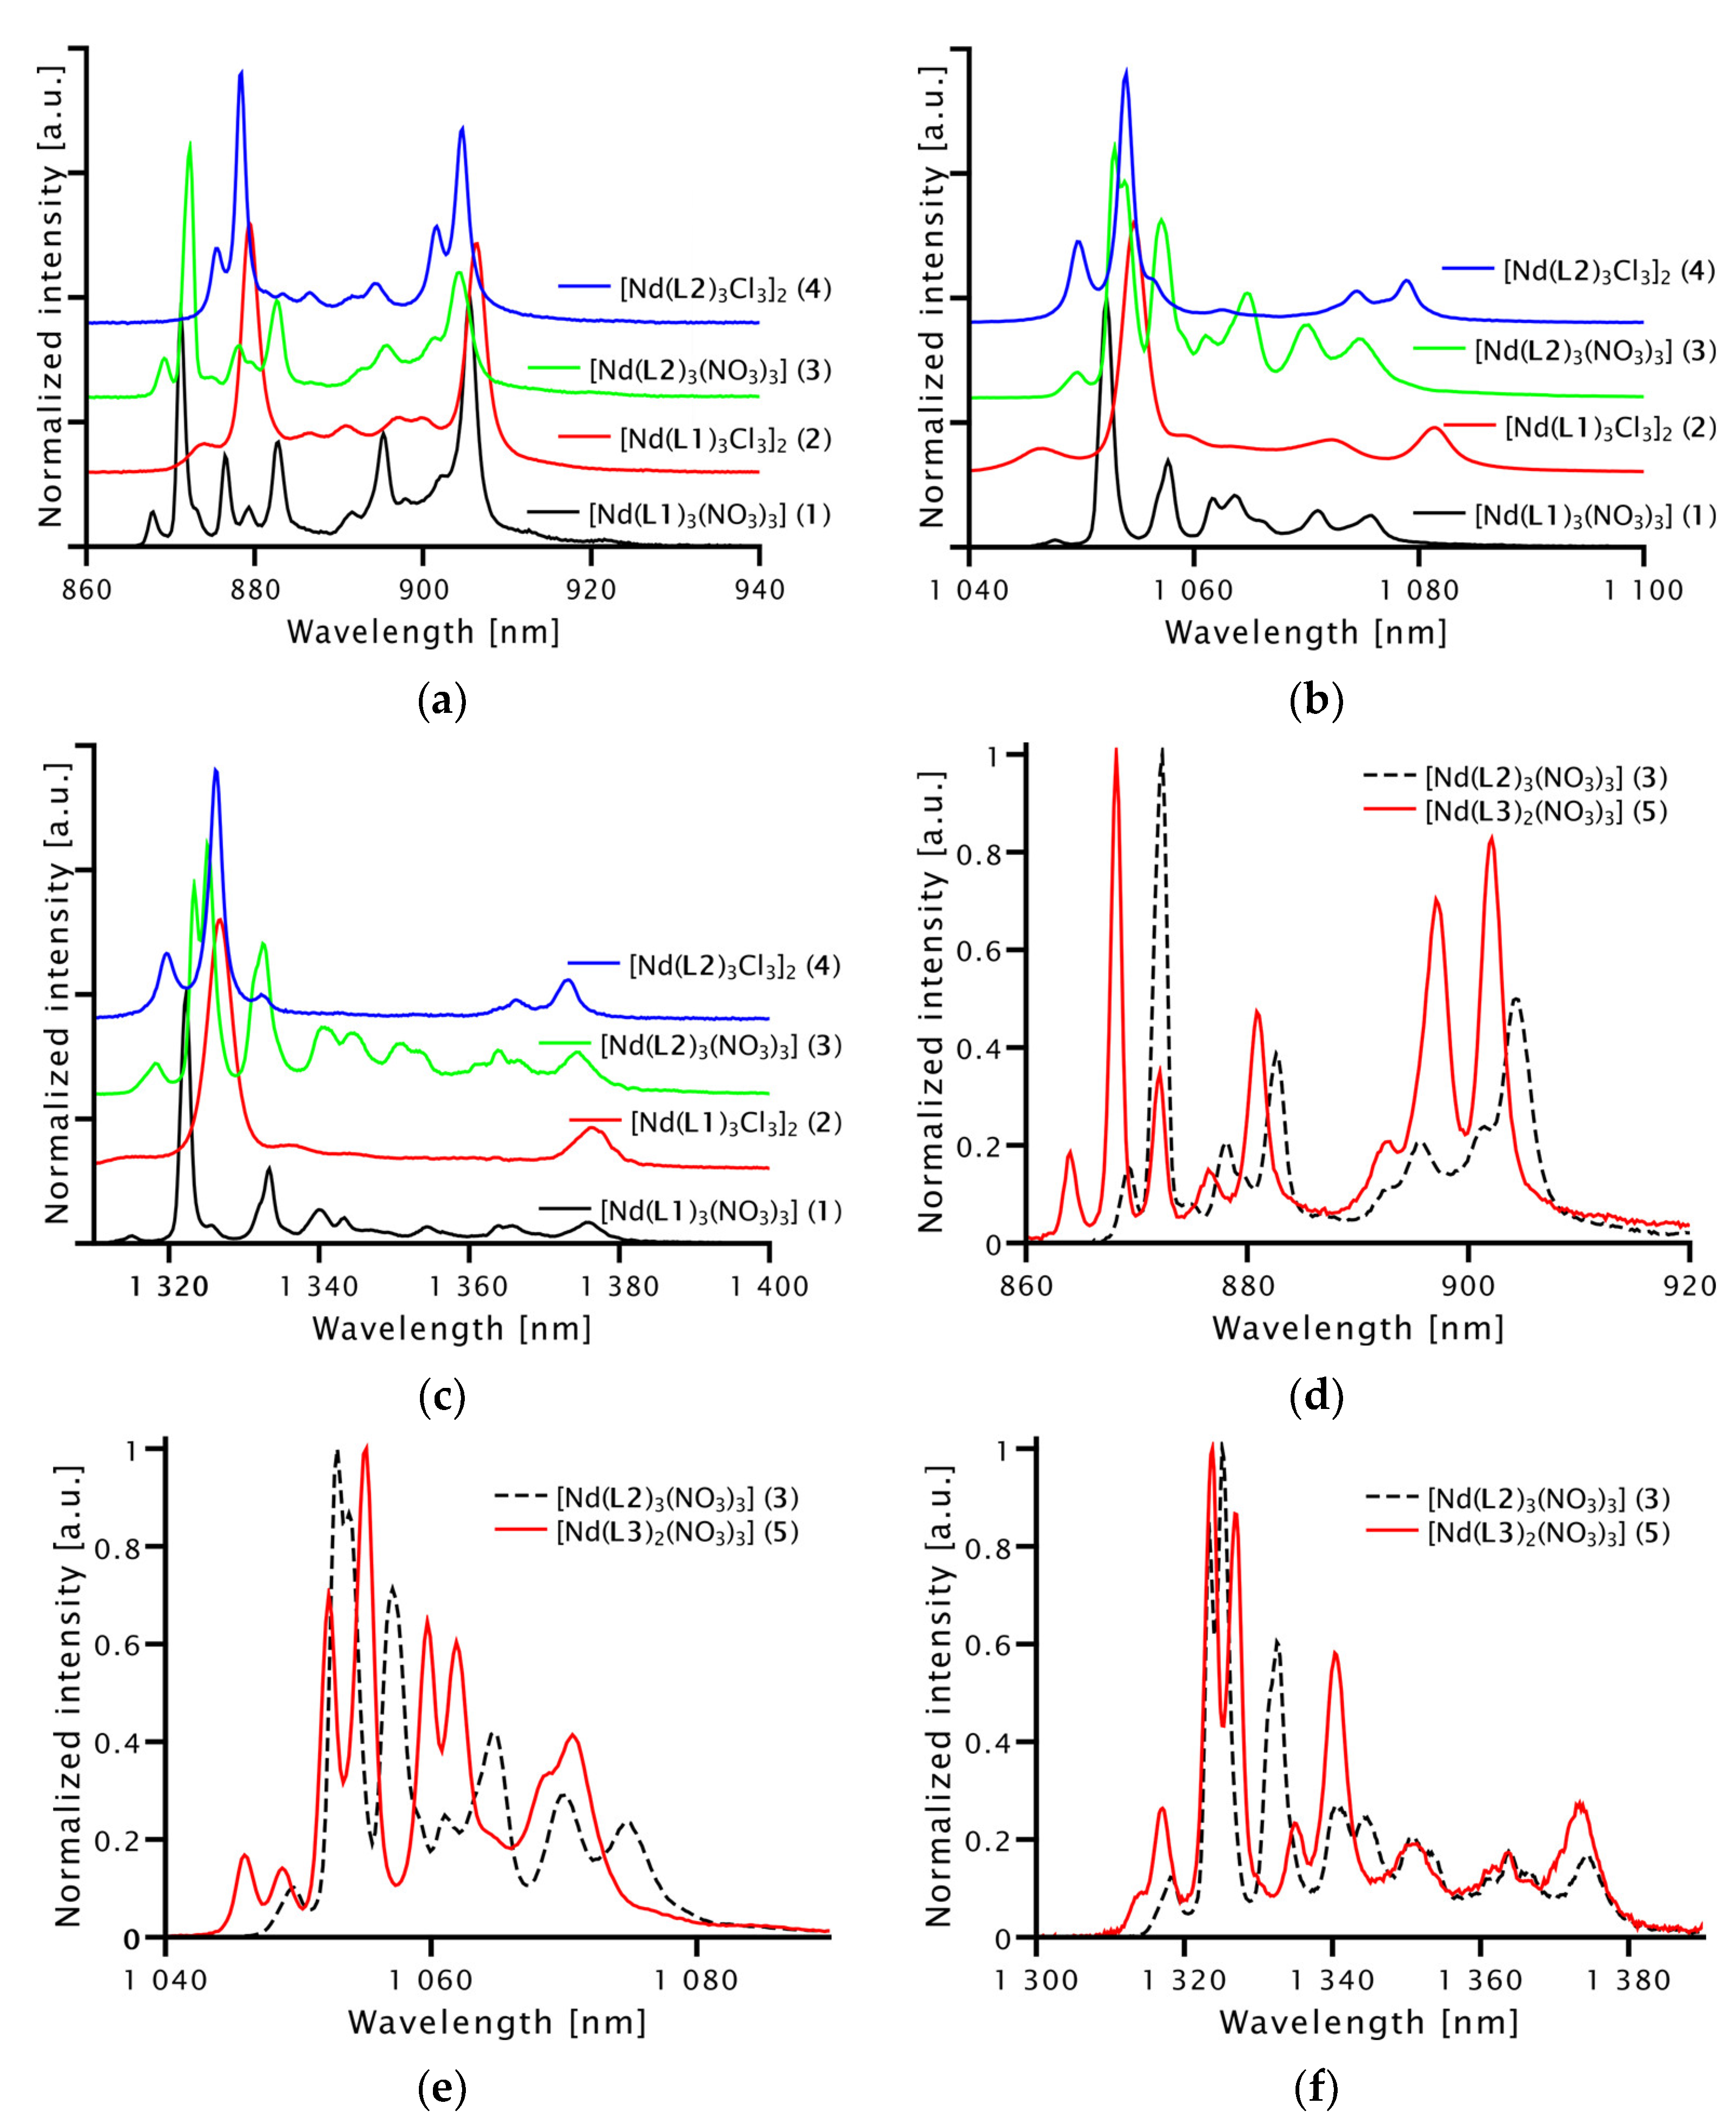
Investigation of solutions of equimolar concentration enables comparison of emission intensities of the various complexes. For comparison, Figure 3a–c firstly represents the emission spectra obtained from amorphous bulk material [Nd(L2)3(NO3)3] (3) and of the complexes dissolved in dry dichloromethane (DCM). Only a minor shift in the emission bands was observed.
Since the mono-phosphonate ester-supported neodymium chloride complexes are less soluble in DCM, only nitrate-based complexes with mono-phosphonate and geminal bisphosphonate esters are considered. The complexes are dissolved in dry DCM (c = 4 × 10⁻³ mol/L) and their optical characteristics were investigated at RT using µ-PL spectroscopy (same laser power and acquisition time for all three complexes). Since there is less rotation and vibrational modes along the Nd-O bonds, geminal bisphosphonate ester-based complexes are more rigid than their mono-phosphonate ester congeners. As a result, enhanced luminescence intensity can be anticipated for complexes based on a geminal bisphosphonate ester such as L3. In contrast, the emission spectra shown in Figure 3d–f demonstrate that higher emission intensities are detected in the case of the mono-phosphonate esters-supported complexes, with [Nd(L2)3(NO3)3] (3) exhibiting the most intense emissions. The salient emission intensity of [Nd(L2)3(NO3)3] (3) is about four times higher compared to [Nd(L3)2(NO3)3] (5). This observation is possibly a consequence of better ligand-to-metal charge transfer (LMCT) for the evaluated mono-phosphonate ester ligands compared with the parent geminal bisphosphonate ligand system L3.

2.2.2. Liquid Helium Temperature Emission Properties of Nd3+ Complexes 15

At liquid helium temperature (5 K), narrow emission lines (FWHM = 1.1 nm–4.6 nm) can be observed as compared to RT measurements. Generally, there are 10, 12, and 14 transition lines resulting from transitions from the 4F3/2 manifold to the 4I9/2, 4I11/2, and 4I13/2 manifolds, respectively, under the assumption of a non-cubic symmetry around the Nd3+ ion, which has an odd number of electrons (Kramers ions [52,53]). This can be rationalized by using the energy level diagram displayed in Figure 4. It illustrates how the 4F3/2 state is divided into upper (R2) and lower (R1) Stark sublevels, whereas the 4I9/2, 4I11/2, and 4I13/2 states are split into five (Z1-Z5), six (Y1-Y6) and seven (X1-X7) sublevels, respectively.
Figure 5 illustrates the temperature-dependent emission spectra of complex [Nd(L2)3(NO3)3] (3). At low temperature (5 K), ten emission lines of the 4F3/24I9/2 transition can be observed, which overlap strongly at higher temperatures due to the broadening of electron-phonon interactions. Despite low-temperature measurements, 4F3/24I11/2 and 4F3/24I13/2 transitions are less resolved. This is due to the spectral overlap between the emission lines since they lie close together.
As the morphology has a significant impact on the emission spectrum, crystals of the geminal bisphosphonate ester-supported compound [Nd(L3)2(NO3)3] (5) are investigated in this respect. The normalized PL spectra of the amorphous bulk and crystalline complexes are depicted in Figure 6a. As expected, the amorphous bulk material has a wider linewidth than the crystalline sample due to structural disorder.
When a perfect crystal considered under ideal conditions is excited with a laser, the emission bands have a narrow Lorentzian shape since all emitting molecules have the same orientation in the crystal. Due to differences in the local environment of the Nd3+ centers in amorphous bulk samples and grown crystals, broadened Gaussian band shapes are observed [54]. As described by Lenz et al. [54] the PL intensity of transition lines is strongly affected by the crystal orientation. This orientation-dependence was also observed for crystalline [Nd(L3)2(NO3)3] (5) when applying a polarizer in front of the detector. As the polarization angle increases from 0° to 90°, the intensity of the transition lines associated with the R1 sublevel decrease, whereas transition lines associated with the R2 sublevel increase, as illustrated in Figure 6b.

3. Discussion

According to Figure 4, ten, twelve and fourteen emission lines are expected for the 4F3/24I9/2, 4F3/24I11/2, and 4F3/24I13/2 transitions, respectively. Due to spectral overlap, not all transition lines can be resolved in the emission spectra as demonstrated by the 4F3/24I9/2 transition of [Nd(L3)2(NO3)3] (5), where only eight of ten emission lines can be observed (Figure 6a). However, temperature-dependent PL measurements can be used to assign the emission lines. At RT, the R2 Stark sublevel is easily populated due to the small energy difference between R1 and R2 [55,56]. With decreasing temperature, R2 is less populated leading to decreasing PL intensity of the corresponding emission lines. Figure 5a illustrates the increase in emission intensities of transition lines centered at 869.3 nm, 875.3 nm, 879.8 nm, 892.6 nm, and 901.2 nm with rising temperature for the 4F3/24I9/2 transition of [Nd(L2)3(NO3)3] (3). A radiative depopulation of the R2 Stark sublevel of the 4F3/2 state to the 4I9/2 manifold results in the emission of these lines. Increased intensity of emission lines related to transitions from the R1 sublevel centered at 878.1 nm, 895.7 nm, and 904.6 nm may be caused by spectral overlap with R2 Stark sublevel emission lines. The emission bands of the 4F3/24I11/2, and 4F3/24I13/2 transitions were not assigned, as the emission lines overlap strongly even at low temperatures.
Due to spectral overlap and low intensity of some of the emission lines, its peak positions (λmax) cannot be determined precisely. A powerful tool for resolving overlapping spectral bands is the so-called derivative spectroscopy [57,58], which gives detailed information about emission lines and λmax values. Figure 7 depicts the zero-order (dashed line) PL spectrum of [Nd(L2)3(NO3)3] (3) (recorded at 5 K) and its second-order derivative (D2) spectrum (solid line). When compared to the original (zero-order) PL spectrum, the D2 spectrum’s peaks are reversed, revealing minima at λmax of the zero-order spectrum. In addition, a positive satellite band is also present on either side of each dip. In general, sharp peaks of zero-order spectra become even narrower in D2 spectra, while broad peaks will be flattened, leading to a reduction in broad background but also to unwanted enhancement of sharp noise-signals. Thus, PL spectra were smoothed to increase the signal-to-noise ratio. The λmax values of the Nd3+ complexes are derived from the second-order derivative spectra and are summarized in Table 1. Values for several transition lines are not reported in the table, because λmax of the transition lines in case of [Nd(L2)3CL3]2 (4) and [Nd(L3)2(NO3)3] (5) overlapped and could not be resolved properly. Only seven transition lines can be detected in case of [Nd(L1)3Cl3]2 (2), which is insufficient for a valid assignment.
As previously stated, the 4f shell of lanthanides is well shielded by electrons of the 5s and 5p orbitals resulting in only minor influence from neighboring ligands. However, for Stark level splitting, ligand parameters such as interatomic distances and electric charge are critical [54]. As a result, nitrate and chloride anions have a significant influence on the PL spectra. Figure 8a–c compares the 5 K emission bands associated with the three NIR transitions of Nd3+ complexes 14. The emission bands of the monomeric NO3 and dimeric Cl based Nd3+ complexes under investigation are similar, nevertheless, there are two noteworthy differences: First, NO3 based complexes exhibit emission lines for the 4F3/24I9/2 transition that start at shorter wavelengths and are spread across a wider spectral range. Second, the transition lines of the neodymium(III) chloride complexes, apart from the two outer lines of each transition band, are much less prominent than those of the nitrate-based congeners. It appears that the different organic ligands do not significantly influence the µ-PL spectrum, as similar spectra were observed for [Nd(L1)3(NO3)3] (1) and [Nd(L2)3(NO3)3] (3), and [Nd(L1)3Cl3]2 (2) and [Nd(L2)3Cl3]2 (4), respectively.
Figure 8d–f compares the low-temperature (5 K) PL spectra of mono-phosphonate ester-supported complexes [Nd(L2)3(NO3)3] (3) (dashed line) and [Nd(L3)2(NO3)3] (5) (solid line). The geminal bisphosphonate ester complex 5 exhibits a redshift in emission compared to compounds with mono-phosphonate ester ligands, such as 3. The R2 → Z1 transition line for 3 and 5 is shifted by 3.7 nm (Figure 8d). In both NO3 based complex types, the transition line shape is similar.
In line with the already mentioned orientation-dependence of the PL intensity of transition lines for crystalline samples, we explored this aspect for the geminal bisphosphonate ester complex [Nd(L3)2(NO3)3] (5) by introducing a polarizer in front of the detector. Since the first two transition lines of 4F3/24I9/2 transition are spectrally most isolated, the following investigations focus on the R2 → Z1 and R1 → Z1 transition lines. The relative emission intensities as a function of the polarization angle, as extracted from careful fits of many spectra, are shown in Figure 9a. As can be seen, an increase in peak intensity corresponds to transitions from the upper Stark sublevel R2 while a decrease in peak intensity corresponds to the transition from the lower Stark R1 sublevel and vice versa. Figure 9b shows the transition energies of the two transition lines as a function of the linear polarization angle. The oscillatory behavior of both lines stems from two perpendicularly linearly polarized components. The two transitions show anticorrelated shifts when changing the polarization angle, confirming the above assigned transitions. While polarized emission has been observed, the exact correlation between polarization and crystal orientation has not yet been examined. It is necessary to conduct further investigations, which is beyond the scope of this study. The FWHM was also found to be polarization-dependent as shown in Figure 9c. The two transitions show as well anticorrelated broadening when changing the polarization angle. Here only the R1 → Z1 transition line is plotted. Since the peak intensity of the R2 → Z1 transition is weak, the fitting of the emission line was not unambiguous, therefore it is not shown.

4. Materials and Methods

Starting materials for synthesis were purchased commercially and were used as received, unless stated otherwise. The ligands L1L3 as well as complexes 14 have been prepared according to literature protocols [42,43]. NMR experiments were performed with a Varian 500 MHz spectrometer, and spectra were processed with MestReNova (v11.0.4-18998, Mestrelab Research S.L.). 1H- and 13C NMR spectra are referenced relative to TMS using the residual solvent signals as internal standards [59]. IR spectra were recorded with a diamond probe ATR IR spectrometer by Bruker. Elemental analyses were performed using a HEKAtech Euro EA-CHNS elemental analyzer. For analyses, samples were prepared in tin cups with V2O5 as an additive to ensure complete combustion.

4.1. General Procedure for the Preparation of Geminal Bisphosphonate Ester-Supported Ln3+ (Ln = Nd3+ (5), La3+ (6)) Complexes

[Ln(H2O)6(NO3)3] (Ln = Nd3+, La3+; 1.00 mmol, 1.00 eq.) is dissolved in a vial in EtOH (15 mL). Ligand L3 (1.09 g, 2.00 mmol, 2.00 eq.) is dissolved in a round-bottom flask in EtOH (15 mL). The lanthanide precursor solution is added to the ligand solution under stirring and the mixture is stirred at RT overnight (~16 h). The formed precipitate is recovered via percolation over a pleated filter, the filter cake is washed with small amounts of −20 °C EtOH and subsequently, air dried. The complexes are isolated as pale-yellow solids in non-optimized yields of 58% (5) and 59% (6). [Nd(L3)2(NO3)3] (5): IR (ATR) ν ˜ = 1222 (P=O), 1100 (P–OEt) cm−1; Anal. Calcd for C46H58Br2N3NdO21P4: C, 38.99; H, 4.13; N, 2.97. Found: C, 38.99; H, 4.18; N, 2.93; [La(L3)2(NO3)3] (6): 1H-NMR (500 MHz, DMSO-d6): δ = 9.19 (d, 2H, 3JHH = 9.0 Hz, H4), 8.57 (dd, 2H, 3JHH = 6.4, 4JHH = 3.6 Hz, H1), 8.49 (d, 2H, 3JHH = 8.8 Hz, H8), 8.37 (dd, 2H, 3JHH = 6.4, 4JHH = 3.6 Hz, H5), 7.75–7.69 (m, 6H, H2 + H6, H3), 7.63–7.59 (m, 2H, H7) 5.39 (t, 2H, 2JPH = 30.3 Hz, CH), 4.18–4.11 (m, 8H, CH2CH3), 3.86–3.74 (m, 2H, CH2CH3), 3.68–3.60 (m, 4H, CH2CH3), 3.54–3.46 (m, 4H, CH2CH3), 1.24 (t, 12H, 3JHH = 7.1 Hz, CH2CH3), 0.61 (t, 12H, 3JHH = 7.0 Hz, CH2CH3) ppm; 13C{1H}-NMR (101 MHz, C6D6): δ = 131.6 (t, 2C, J = 4.4 Hz, CAr), 130.9 (t, 2C, J = 8.4 Hz, CAr), 129.9 (t, 2C, J = 2.4 Hz, CAr), 129.8 (t, 2C, J = 3.3 Hz, CAr), 129.6–129.5 (m, 2C, CAr), 128.3 (s, 2C, CAr), 127.9 (s, 2C, CAr), 127.6 (s, 2C, CAr), 127.5 (s, 2C, CAr), 127.0 (s, 2C, CAr), 125.4–125.1 (m, 4C, CAr), 124.3–124.2 (m, 2C, CAr), 123.6 (t, 2C, J = 6.3 Hz, CAr), 63.0–62.8 (m, 4C, CH2CH3), 62.7–62.5 (m, 4C, CH2CH3), 40.5 (t, 2C, 1JPC = 134 Hz, CH (partially covered by DMSO-d6 signal)), 16.3–16.1 (m, 4C, CH2CH3), 15.7–15.5 (m, 4C, CH2CH3) ppm; 31P{1H}-NMR (202 MHz, C6D6): δ = 18.9 (s, 4P) ppm; IR (ATR) ν ˜ = 1221 (P=O), 1100 (P–OEt) cm−1; Anal. Calcd for C46H58Br2N3LaO21P4: C, 39.14; H, 4.14; N 2.98. Found: C, 39.61; H, 4.24; N, 3.19.

4.2. Crystallographic Details

X-ray diffraction experiments were performed with either a STOE IPDS 2 with an image plate (Ø 34 cm) using a Mo-GENIX source (λ = 0.71073 nm) or a STOE StadiVari instrument with DECTRIS PILATUS 200 K using a Cu-GENIX source (λ = 1.54186 nm). All structures were solved using direct methods (SHELXT) [60] and refined against F2 using the full-matrix least-squares methods of SHELXL [61] within the SHELXLE GUI [62] or with OLEX2 [63]. CCDC 2201668 (5) and 2201669 (6) contain the supplementary crystallographic data for this paper. These data can be obtained free of charge via www.ccdc.cam.ac.uk/data_request/cif.

4.3. Micro-Photoluminescence (µ-PL) Measurments

Luminescence characteristics of phosphonate ester-supported Nd3+ complexes are investigated by µ-PL spectroscopy. For the characterization of Nd3+ complexes in solid form, the samples were mounted in a liquid helium flow cryostat. The compounds are attached to silicon wafer pieces by partially melting or, if non-meltable, by sticking with vacuum grease, to fix the solid in position and to ensure good thermal conductivity when cooling the sample down to liquid helium temperature. For RT PL measurements in solution, the complexes were dissolved in dry DCM, filled into a cuvette, and attached to the holder of an open cryostat. The Nd3+ complexes are excited at 750 nm, using a CW Ti:Sapphire laser. A microscope objective (NA = 0.7) focuses the laser onto the sample and collects the photoluminescence light of the complexes. The emitted light is guided to a monochromator equipped with a liquid nitrogen-cooled InGaAs detector. For polarization-dependent measurements, a polarizer is inserted in front of the detector.
Low-temperature measurements were conducted on amorphous solids except for [Nd(L3)2(NO3)3] (5) where a crystalline sample was used. From this compound, crystals were obtained from vapor diffusion of pentanes into a saturated THF solution of the complex. The amorphous bulk material as well as a crystalline sample are depicted in Figure 10a,b.

5. Conclusions

The preparation of two geminal bisphosphonate ester-supported Ln3+ complexes [Ln(L3)2(NO3)3] (Ln = Nd3+, La3+) has been presented. Emission intensities of equimolar solutions of the germinal bisphosphonate ester-supported Nd3+ nitrate complex 5 and related NO3 based Nd3+ complexes featuring mono-phosphonate esters were compared obtaining unexpected higher emission intensities for the latter compounds. Emission bands from 4F5/2, 2H9/24IJ (J = 11/2, 13/2) transitions were detected, which are rarely presented for Nd3+ containing materials. The three emission bands characteristic for transitions from 4F3/2 excited state, of mono- and dimeric phosphonate ester-supported Nd3+ nitrate and chloride complexes as well as of the geminal bisphosphonate-based complex at liquid helium temperature (5 K) were examined. PL spectra of all three complex types depict similar features with slight shifts of peak positions. Temperature-dependent PL spectroscopy enabled assignment of the transition lines corresponding to the 4F3/24I9/2 transition. At 5 K polarization-dependence of a crystalline sample was observed showing opposite change in peak intensity of transitions related to the depopulation of the R1 and R2 Stark sublevel, respectively.
This study shows that the investigated neodymium(III) complexes exhibit interesting luminescence properties. With improved synthesis processes, their optical properties could be further enhanced. In the next step, molecules will be integrated onto microcavities to examine molecule-cavity coupling.

Supplementary Materials

The following are available online at https://www.mdpi.com/article/10.3390/molecules28010048/s1, Figure S1: 1H NMR spectrum of 6 in DMSO-d6, Figure S2: 13C{1H} NMR spectrum of 6 in DMSO-d6, Table S1: Crystallographic data for complex 5 and 6, Figure S3: Asymmetric unit of 5, Figure S4: Asymmetric unit of 6, Figure S5: ATR IR-spectrum of complex [Nd(L3)2(NO3)3] (5), Figure S6: ATR IR-spectrum of complex [La(L3)2(NO3)3] (6), Figure S7: Normalized absorption spectrum of complex [Nd(L3)2(NO3)3] (5) at room temperature showing sharp Nd3+ absorption bands. Reference [64] is cited in the Supplementary Materials.

Author Contributions

Conceptualization, M.B.; formal analysis, M.G., I.K. and M.B.; investigation, M.G. and I.K.; resources, M.B., J.P.R. and R.P.; writing—original draft preparation, M.G. and I.K.; writing—review and editing, M.B. and R.P.; supervision, M.B. and R.P.; project administration, M.B., R.P. and J.P.R.; funding acquisition, M.B., J.P.R. and R.P. All authors have read and agreed to the published version of the manuscript.

Funding

The federal state of Hesse, Germany is kindly acknowledged for financial support of the SMolBits project within the LOEWE program. This work was also financially supported by the DFG Heisenberg grant-BE 5778/4-1.

Institutional Review Board Statement

Not applicable.

Informed Consent Statement

Not applicable.

Data Availability Statement

NMR, IR, and crystallographic data presented in this study are available in the Supplementary Materials.

Acknowledgments

We acknowledge fruitful discussions on the derivative spectroscopy with Claudia Backes.

Conflicts of Interest

The authors declare no conflict of interest.

Sample Availability

Samples of the compounds are not available from the authors.

References

  1. Bünzli, J.-C.G.; Eliseeva, S.V. Basics of Lanthanide Photophysics. In Lanthanide Luminescence; Hänninen, P., Härmä, H., Eds.; Springer: Berlin/Heidelberg, Germany, 2011; pp. 1–45. ISBN 978-3-642-21022-8. [Google Scholar]
  2. Comby, S.; Imbert, D.; Chauvin, A.-S.; Bünzli, J.-C.G. Stable 8-Hydroxyquinolinate-Based Podates as Efficient Sensitizers of Lanthanide Near-Infrared Luminescence. Inorg. Chem. 2006, 45, 732–743. [Google Scholar] [CrossRef] [PubMed]
  3. Freidzon, A.Y.; Kurbatov, I.A.; Vovna, V.I. Ab Initio Calculation of Energy Levels of Trivalent Lanthanide Ions. Phys. Chem. Chem. Phys. 2018, 20, 14564–14577. [Google Scholar] [CrossRef] [PubMed]
  4. Martin, L.J.; Hähnke, M.J.; Nitz, M.; Wöhnert, J.; Silvaggi, N.R.; Allen, K.N.; Schwalbe, H.; Imperiali, B. Double-Lanthanide-Binding Tags: Design, Photophysical Properties, and NMR Applications. J. Am. Chem. Soc. 2007, 129, 7106–7113. [Google Scholar] [CrossRef]
  5. Ilichev, V.A.; Silantyeva, L.I.; Kukinov, A.A.; Bochkarev, M.N. Photophysical Properties of IR Luminescent Lanthanide Complexes with Polyfluorinated Ligands. INEOS OPEN 2019, 2, 78–83. [Google Scholar] [CrossRef]
  6. Hasegawa, Y.; Kitagawa, Y.; Nakanishi, T. Effective photosensitized, electrosensitized, and mechanosensitized luminescence of lanthanide complexes. NPG Asia Mater. 2018, 10, 52–70. [Google Scholar] [CrossRef] [Green Version]
  7. Leif, R.C.; Vallarino, L.M.; Becker, M.C.; Yang, S. Increasing the Luminescence of Lanthanide Complexes. Cytom. A 2006, 69, 767–778. [Google Scholar] [CrossRef]
  8. Manna, P.; Bhar, M.; Mukherjee, P. Lanthanide photoluminescence lifetimes reflect vibrational signature of local environment: Lengthening duration of emission in inorganic nanoparticles. J. Lumin. 2021, 235, 118052. [Google Scholar] [CrossRef]
  9. Jia, J.; Ren, P.; Hu, H.; Sayyadi, N.; Parvin, F.; Zheng, X.; Shi, B.; Piper, J.A.; Song, B.; Vickery, K.; et al. Lifetime Multiplexing with Lanthanide Complexes for Luminescence In Situ Hybridisation. Anal. Sens. 2022, 2, e202100057. [Google Scholar] [CrossRef]
  10. Wang, D.; Zhang, J.; Lin, Q.; Fu, L.; Zhang, H.; Yang, B. Lanthanide complex/polymer composite optical resin with intense narrow band emission, high transparency and good mechanical performance. J. Mater. Chem. 2003, 13, 2279–2284. [Google Scholar] [CrossRef]
  11. Kofod, N.; Arppe-Tabbara, R.; Sørensen, T.J. Electronic Energy Levels of Dysprosium(III) ions in Solution. Assigning the Emitting State and the Intraconfigurational 4f-4f Transitions in the Vis-NIR Region and Photophysical Characterization of Dy(III) in Water, Methanol, and Dimethyl Sulfoxide. J. Phys. Chem. A 2019, 123, 2734–2744. [Google Scholar] [CrossRef]
  12. Reisfeld, R. Optical Properties of Lanthanides in Condensed Phase, Theory and Applications. AIMS Mater. Sci. 2015, 2, 37–60. [Google Scholar] [CrossRef]
  13. Carlos, L.D.; Ferreira, R.A.S.; Bermudez, V.d.Z.; Ribeiro, S.J.L. Lanthanide-Containing Light-Emitting Organic-Inorganic Hybrids: A Bet on the Future. Adv. Mater. 2009, 21, 509–534. [Google Scholar] [CrossRef]
  14. Deng, D.; Yu, H.; Li, Y.; Hua, Y.; Jia, G.; Zhao, S.; Wang, H.; Huang, L.; Li, Y.; Li, C.; et al. Ca4(PO4)2O:Eu2+ red-emitting phosphor for solid-state lighting: Structure, luminescent properties and white light emitting diode application. J. Mater. Chem. C 2013, 1, 3194–3199. [Google Scholar] [CrossRef]
  15. Khreis, O.M.; Curry, R.J.; Somerton, M.; Gillin, W.P. Infrared organic light emitting diodes using neodymium tris-(8-hydroxyquinoline). J. Appl. Phys. 2000, 88, 777–780. [Google Scholar] [CrossRef] [Green Version]
  16. Gao, N.; Zhang, Y.; Huang, P.; Xiang, Z.; Wu, F.-Y.; Mao, L. Perturbing Tandem Energy Transfer in Luminescent Heterobinuclear Lanthanide Coordination Polymer Nanoparticles Enables Real-Time Monitoring of Release of the Anthrax Biomarker from Bacterial Spores. Anal. Chem. 2018, 90, 7004–7011. [Google Scholar] [CrossRef]
  17. Amoroso, A.J.; Pope, S.J.A. Using lanthanide ions in molecular bioimaging. Chem. Soc. Rev. 2015, 44, 4723–4742. [Google Scholar] [CrossRef] [Green Version]
  18. Dong, H.; Du, S.-R.; Zheng, X.-Y.; Lyu, G.-M.; Sun, L.-D.; Li, L.-D.; Zhang, P.-Z.; Zhang, C.; Yan, C.-H. Lanthanide Nanoparticles: From Design toward Bioimaging and Therapy. Chem. Rev. 2015, 115, 10725–10815. [Google Scholar] [CrossRef]
  19. Qiu, X.; Xu, J.; Cardoso Dos Santos, M.; Hildebrandt, N. Multiplexed Biosensing and Bioimaging Using Lanthanide-Based Time-Gated Förster Resonance Energy Transfer. Acc. Chem. Res. 2022, 55, 551–564. [Google Scholar] [CrossRef]
  20. Ning, Y.; Zhu, M.; Zhang, J.-L. Near-infrared (NIR) lanthanide molecular probes for bioimaging and biosensing. Coord. Chem. Rev. 2019, 399, 213028. [Google Scholar] [CrossRef]
  21. Bünzli, J.-C.G.; Eliseeva, S.V. Lanthanide NIR luminescence for telecommunications, bioanalyses and solar energy conversion. J. Rare Earths 2010, 28, 824–842. [Google Scholar] [CrossRef]
  22. Naftaly, M.; Jha, A. Nd3+-doped fluoroaluminate glasses for a 1.3 μm amplifier. J. Appl. Phys. 2000, 87, 2098–2104. [Google Scholar] [CrossRef]
  23. Chen, B.J.; Shen, L.F.; Pun, E.Y.B.; Lin, H. Nd3+-doped ion-exchanged aluminum germanate glass channel waveguide. Opt. Mater. Express 2015, 5, 113–123. [Google Scholar] [CrossRef]
  24. Brites, C.D.S.; Lima, P.P.; Silva, N.J.O.; Millán, A.; Amaral, V.S.; Palacio, F.; Carlos, L.D. Lanthanide-based luminescent molecular thermometers. New J. Chem. 2011, 35, 1177. [Google Scholar] [CrossRef] [Green Version]
  25. Kumar, K.; Chorazy, S.; Nakabayashi, K.; Sato, H.; Sieklucka, B.; Ohkoshi, S. TbCo and Tb 0.5 Dy 0.5 Co layered cyanido-bridged frameworks for construction of colorimetric and ratiometric luminescent thermometers. J. Mater. Chem. C 2018, 6, 8372–8384. [Google Scholar] [CrossRef]
  26. Zhou, X.; Wang, Y.; Wang, H.; Xiang, L.; Yan, Y.; Li, L.; Xiang, G.; Li, Y.; Jiang, S.; Tang, X.; et al. Nd3+ and Nd3+/Yb3+-incorporated complexes as optical thermometer working in the second biological window. Sens. Bio-Sens. Res. 2020, 29, 100345. [Google Scholar] [CrossRef]
  27. Brites, C.; Millán, A.; Carlos, L.D. Lanthanides in Luminescent Thermometry. In Including Actinides; Bünzli, J.-C., Pecharsky, V., Eds.; Elsevier: Amsterdam, The Netherlands, 2016; pp. 339–427. ISBN 9780444636997. [Google Scholar]
  28. Back, M.; Ueda, J.; Xu, J.; Murata, D.; Brik, M.G.; Tanabe, S. Ratiometric Luminescent Thermometers with a Customized Phase-Transition-Driven Fingerprint in Perovskite Oxides. ACS Appl. Mater. Interfaces 2019, 11, 38937–38945. [Google Scholar] [CrossRef]
  29. Ren, M.; Brites, C.D.S.; Bao, S.-S.; Ferreira, R.A.S.; Zheng, L.-M.; Carlos, L.D. A cryogenic luminescent ratiometric thermometer based on a lanthanide phosphonate dimer. J. Mater. Chem. C 2015, 3, 8480–8484. [Google Scholar] [CrossRef]
  30. Cui, Y.; Xu, H.; Yue, Y.; Guo, Z.; Yu, J.; Chen, Z.; Gao, J.; Yang, Y.; Qian, G.; Chen, B. A Luminescent Mixed-Lanthanide Metal-Organic Framework Thermometer. J. Am. Chem. Soc. 2012, 134, 3979–3982. [Google Scholar] [CrossRef]
  31. Xu, X.; Cheng, S.; Meng, J.; Li, D.; Zhou, D.; Zheng, L.; Xu, J.; Ryba-Romanowski, W.; Lisiecki, R. Spectral characterization and laser performance of a mixed crystal Nd:(LuxY1-x)3Al5O12. Opt. Express 2010, 18, 21370–21375. [Google Scholar] [CrossRef]
  32. Sorokin, E.; Ober, M.H.; Sorokina, I.; Wintner, E.; Schmidt, A.J. Femtosecond solid-state lasers using Nd3+-doped mixed scandium garnets. J. Opt. Soc. Am. B 1993, 10, 1436–1442. [Google Scholar] [CrossRef]
  33. Huang, Y.J.; Chen, Y.F. High-power diode-end-pumped laser with multi-segmented Nd-doped yttrium vanadate. Opt. Express 2013, 21, 16063–16068. [Google Scholar] [CrossRef]
  34. Fan, T.Y.; Byer, R.L. Diode laser-pumped solid-state lasers. IEEE J. Quantum Electron. 1988, 24, 895–912. [Google Scholar] [CrossRef] [Green Version]
  35. Zhi, Y.; Dong, C.; Zhang, J.; Jia, Z.; Zhang, B.; Zhang, Y.; Wang, S.; He, J.; Tao, X. Continuous-wave and passively Q-switched laser performance of LD-end-pumped 1062 nm Nd:GAGG laser. Opt. Express 2010, 18, 7584–7589. [Google Scholar] [CrossRef]
  36. Cheng, Y.; Xu, X.D.; Xin, Z.; Yang, X.B.; Xiao, X.D.; Li, D.Z.; Zhao, C.C.; Xu, J.; Zhou, S.M. Crystal growth, optical properties, and continuous-wave laser operation of Nd 3+-doped CaNb2O6 crystal. Laser Phys. Lett. 2009, 6, 740–745. [Google Scholar] [CrossRef]
  37. Apollonov, V.V.; Konstantinov, K.V.; Sirotkin, A.A. UV Diode-pumped solid state laser for medical applications. Proc. SPIE 1999, 3829, 135–140. [Google Scholar] [CrossRef]
  38. Šulc, J.; Jelínková, H. Solid-state lasers for medical applications. In Lasers for Medical Applications; Jelínková, H., Ed.; Woodhead Publishing: Sawston, UK, 2013; pp. 127–176. ISBN 9780857092373. [Google Scholar]
  39. Otani, T.; Herbst, L.; Heglin, M.; Govorkov, S.V.; Wiessner, A.O. Microdrilling and micromachining with diode-pumped solid-state lasers. Appl. Phys. A 2004, 79, 1335–1339. [Google Scholar] [CrossRef]
  40. Choi, H.; Li, X. UV laser machining of biomaterial composite. In International Congress on Applications of Lasers & Electro-Optics, Proceedings of the ICALEO® 2003: 22nd International Congress on Laser Materials Processing and Laser Microfabrication, Jacksonville, FL, USA, 13–16 October 2003; Laser Institute of America: Orlando, FL, USA, 2003. M310. ISBN 978-0-912035-75-8. [Google Scholar]
  41. Choi, H.; Yang, Y.; Li, X. Experimental study on integration of laser-based additive/subtractive processes for meso/micro solid freeform fabrication. Int. J. Adv. Manuf. Technol. 2005, 26, 335–341. [Google Scholar] [CrossRef]
  42. Koehne, I.; Lik, A.; Gerstel, M.; Bruhn, C.; Reithmaier, J.P.; Benyoucef, M.; Pietschnig, R. Functionalised phosphonate ester supported lanthanide (Ln = La, Nd, Dy, Er) complexes. Dalton Trans. 2020, 49, 16683–16692. [Google Scholar] [CrossRef]
  43. Koehne, I.; Pietschnig, R. Synthesis of Geminal Bis- and Tetrakisphosphonate Ester Derivatives and Their Coordination Behavior Towards Ca(II) Ions. Eur. J. Inorg. Chem. 2022, 2022, e202200194. [Google Scholar] [CrossRef]
  44. Koehne, I.; Gerstel, M.; Bruhn, C.; Reithmaier, J.P.; Benyoucef, M.; Pietschnig, R. Azido-Functionalized Aromatic Phosphonate Esters in RPOSS-Cage-Supported Lanthanide Ion (Ln = La, Nd, Dy, Er) Coordination. Inorg. Chem. 2021, 60, 5297–5309. [Google Scholar] [CrossRef]
  45. Krekić, K.; Käkel, E.; Klintuch, D.; Bloß, D.; Pietschnig, R. Coordination Polymers based on the Neutral Ditopic Ligand (C6H4PO(OCH3)2)2 Involving some f-Block Elements. Z. Anorg. Allg. Chem. 2018, 644, 149–154. [Google Scholar] [CrossRef] [PubMed] [Green Version]
  46. Krekić, K.; Klintuch, D.; Lescop, C.; Calvez, G.; Pietschnig, R. Structural and Luminescence Properties of Anthracene- and Biphenyl-Based Lanthanide Bisphosphonate Ester Coordination Polymers. Inorg. Chem. 2019, 58, 382–390. [Google Scholar] [CrossRef] [PubMed]
  47. Krekić, K.; Klintuch, D.; Pietschnig, R. Facile access to efficiently luminescent Ln3+ phosphonic ester coordination polymers (Ln = Eu, Tb, Dy). Chem. Commun. 2017, 53, 11076–11079. [Google Scholar] [CrossRef] [PubMed] [Green Version]
  48. Vinothkumar, G.; Rengaraj, S.; Arunkumar, P.; Cha, S.W.; Suresh Babu, K. Ionic Radii and Concentration Dependency of RE3+ (Eu3+, Nd3+, Pr3+, and La3+)-Doped Cerium Oxide Nanoparticles for Enhanced Multienzyme-Mimetic and Hydroxyl Radical Scavenging Activity. J. Phys. Chem. C 2019, 123, 541–553. [Google Scholar] [CrossRef]
  49. Rademaker, K.; Krupke, W.F.; Page, R.H.; Payne, S.A.; Petermann, K.; Huber, G.; Yelisseyev, A.P.; Isaenko, L.I.; Roy, U.N.; Burger, A.; et al. Optical properties of Nd3+- and Tb3+-doped KPb2Br5 and RbPb2Br5 with low nonradiative decay. J. Opt. Soc. Am. B 2004, 21, 2117–2129. [Google Scholar] [CrossRef]
  50. Hömmerich, U.; Brown, E.; Trivedi, S.B.; Zavada, J.M. Synthesis and 1.5μm emission properties of Nd3+ activated lead bromide and lead iodide crystals. Appl. Phys. Lett. 2006, 88, 251906. [Google Scholar] [CrossRef]
  51. Nostrand, M.C.; Page, R.H.; Payne, S.A.; Isaenko, L.I.; Yelisseyev, A.P. Optical properties of Dy3+- and Nd3+-doped KPb2Cl5. J. Opt. Soc. Am. B 2001, 18, 264. [Google Scholar] [CrossRef]
  52. Gatterer, K.; Fritzer, H.P. Symmetry-Modelling of Rare Earth Compounds with Kramers Ions: I. Neodymium (III) in Various Solids. Phys. Chem. Miner. 1988, 15, 484–492. [Google Scholar] [CrossRef]
  53. Scherer, P.; Fischer, S.F. Theoretical Molecular Biophysics; Springer: Berlin/Heidelberg, Germany, 2010; ISBN 978-3-540-85609-2. [Google Scholar]
  54. Lenz, C.; Talla, D.; Ruschel, K.; Škoda, R.; Götze, J.; Nasdala, L. Factors affecting the Nd3+ (REE3+) luminescence of minerals. Mineral. Petrol. 2013, 107, 415–428. [Google Scholar] [CrossRef] [Green Version]
  55. Marciniak, Ł.; Bednarkiewicz, A.; Hreniak, D.; Strek, W. The influence of Nd3+ concentration and alkali ions on the sensitivity of non-contact temperature measurements in ALaP4O12:Nd3+ (A = Li, K, Na, Rb) nanocrystalline luminescent thermometers. J. Mater. Chem. C 2016, 4, 11284–11290. [Google Scholar] [CrossRef]
  56. Huang, P.; Zheng, W.; Tu, D.; Shang, X.; Zhang, M.; Li, R.; Xu, J.; Liu, Y.; Chen, X. Unraveling the Electronic Structures of Neodymium in LiLuF4 Nanocrystals for Ratiometric Temperature Sensing. Adv. Sci. 2019, 6, 1802282. [Google Scholar] [CrossRef] [Green Version]
  57. Redasani, V.K.; Patel, P.R.; Marathe, D.Y.; Chaudhari, S.R.; Shirkhedkar, A.A.; Surana, S.J. A Review on Derivative UV-Spectrophotometry Abalysis of Drugs in Pharmaceutical Formulations and Biological Samples Review. J. Chil. Chem. Soc. 2018, 63, 4126–4134. [Google Scholar] [CrossRef]
  58. Mozo-Villarías, A. Second derivative fluorescence spectroscopy of tryptophan in proteins. J. Biochem. Biophys. Methods 2002, 50, 163–178. [Google Scholar] [CrossRef]
  59. Fulmer, G.R.; Miller, A.J.M.; Sherden, N.H.; Gottlieb, H.E.; Nudelman, A.; Stoltz, B.M.; Bercaw, J.E.; Goldberg, K.I. NMR Chemical Shifts of Trace Impurities: Common Laboratory Solvents, Organics, and Gases in Deuterated Solvents Relevant to the Organometallic Chemist. Organometallics 2010, 29, 2176–2179. [Google Scholar] [CrossRef] [Green Version]
  60. Sheldrick, G.M. SHELXT—Integrated space-group and crystal-structure determination. Acta Crystallogr. A Found. Adv. 2015, 71, 3–8. [Google Scholar] [CrossRef] [Green Version]
  61. Sheldrick, G.M. Crystal structure refinement with SHELXL. Acta Crystallogr. C Struct. Chem. 2015, 71, 3–8. [Google Scholar] [CrossRef] [Green Version]
  62. Hübschle, C.B.; Dittrich, B. MoleCoolQt—A molecule viewer for charge-density research. J. Appl. Crystallogr. 2011, 44, 238–240. [Google Scholar] [CrossRef] [Green Version]
  63. Dolomanov, O.V.; Bourhis, L.J.; Gildea, R.J.; Howard, J.A.K.; Puschmann, H. OLEX2: A complete structure solution, refinement and analysis program. J. Appl. Crystallogr. 2009, 42, 339–341. [Google Scholar] [CrossRef]
  64. Parsons, S.; Flack, H.D.; Wagner, T. Use of intensity quotients and differences in absolute structure refinement. Acta Crystallogr. B 2013, 69, 249–259. [Google Scholar] [CrossRef]
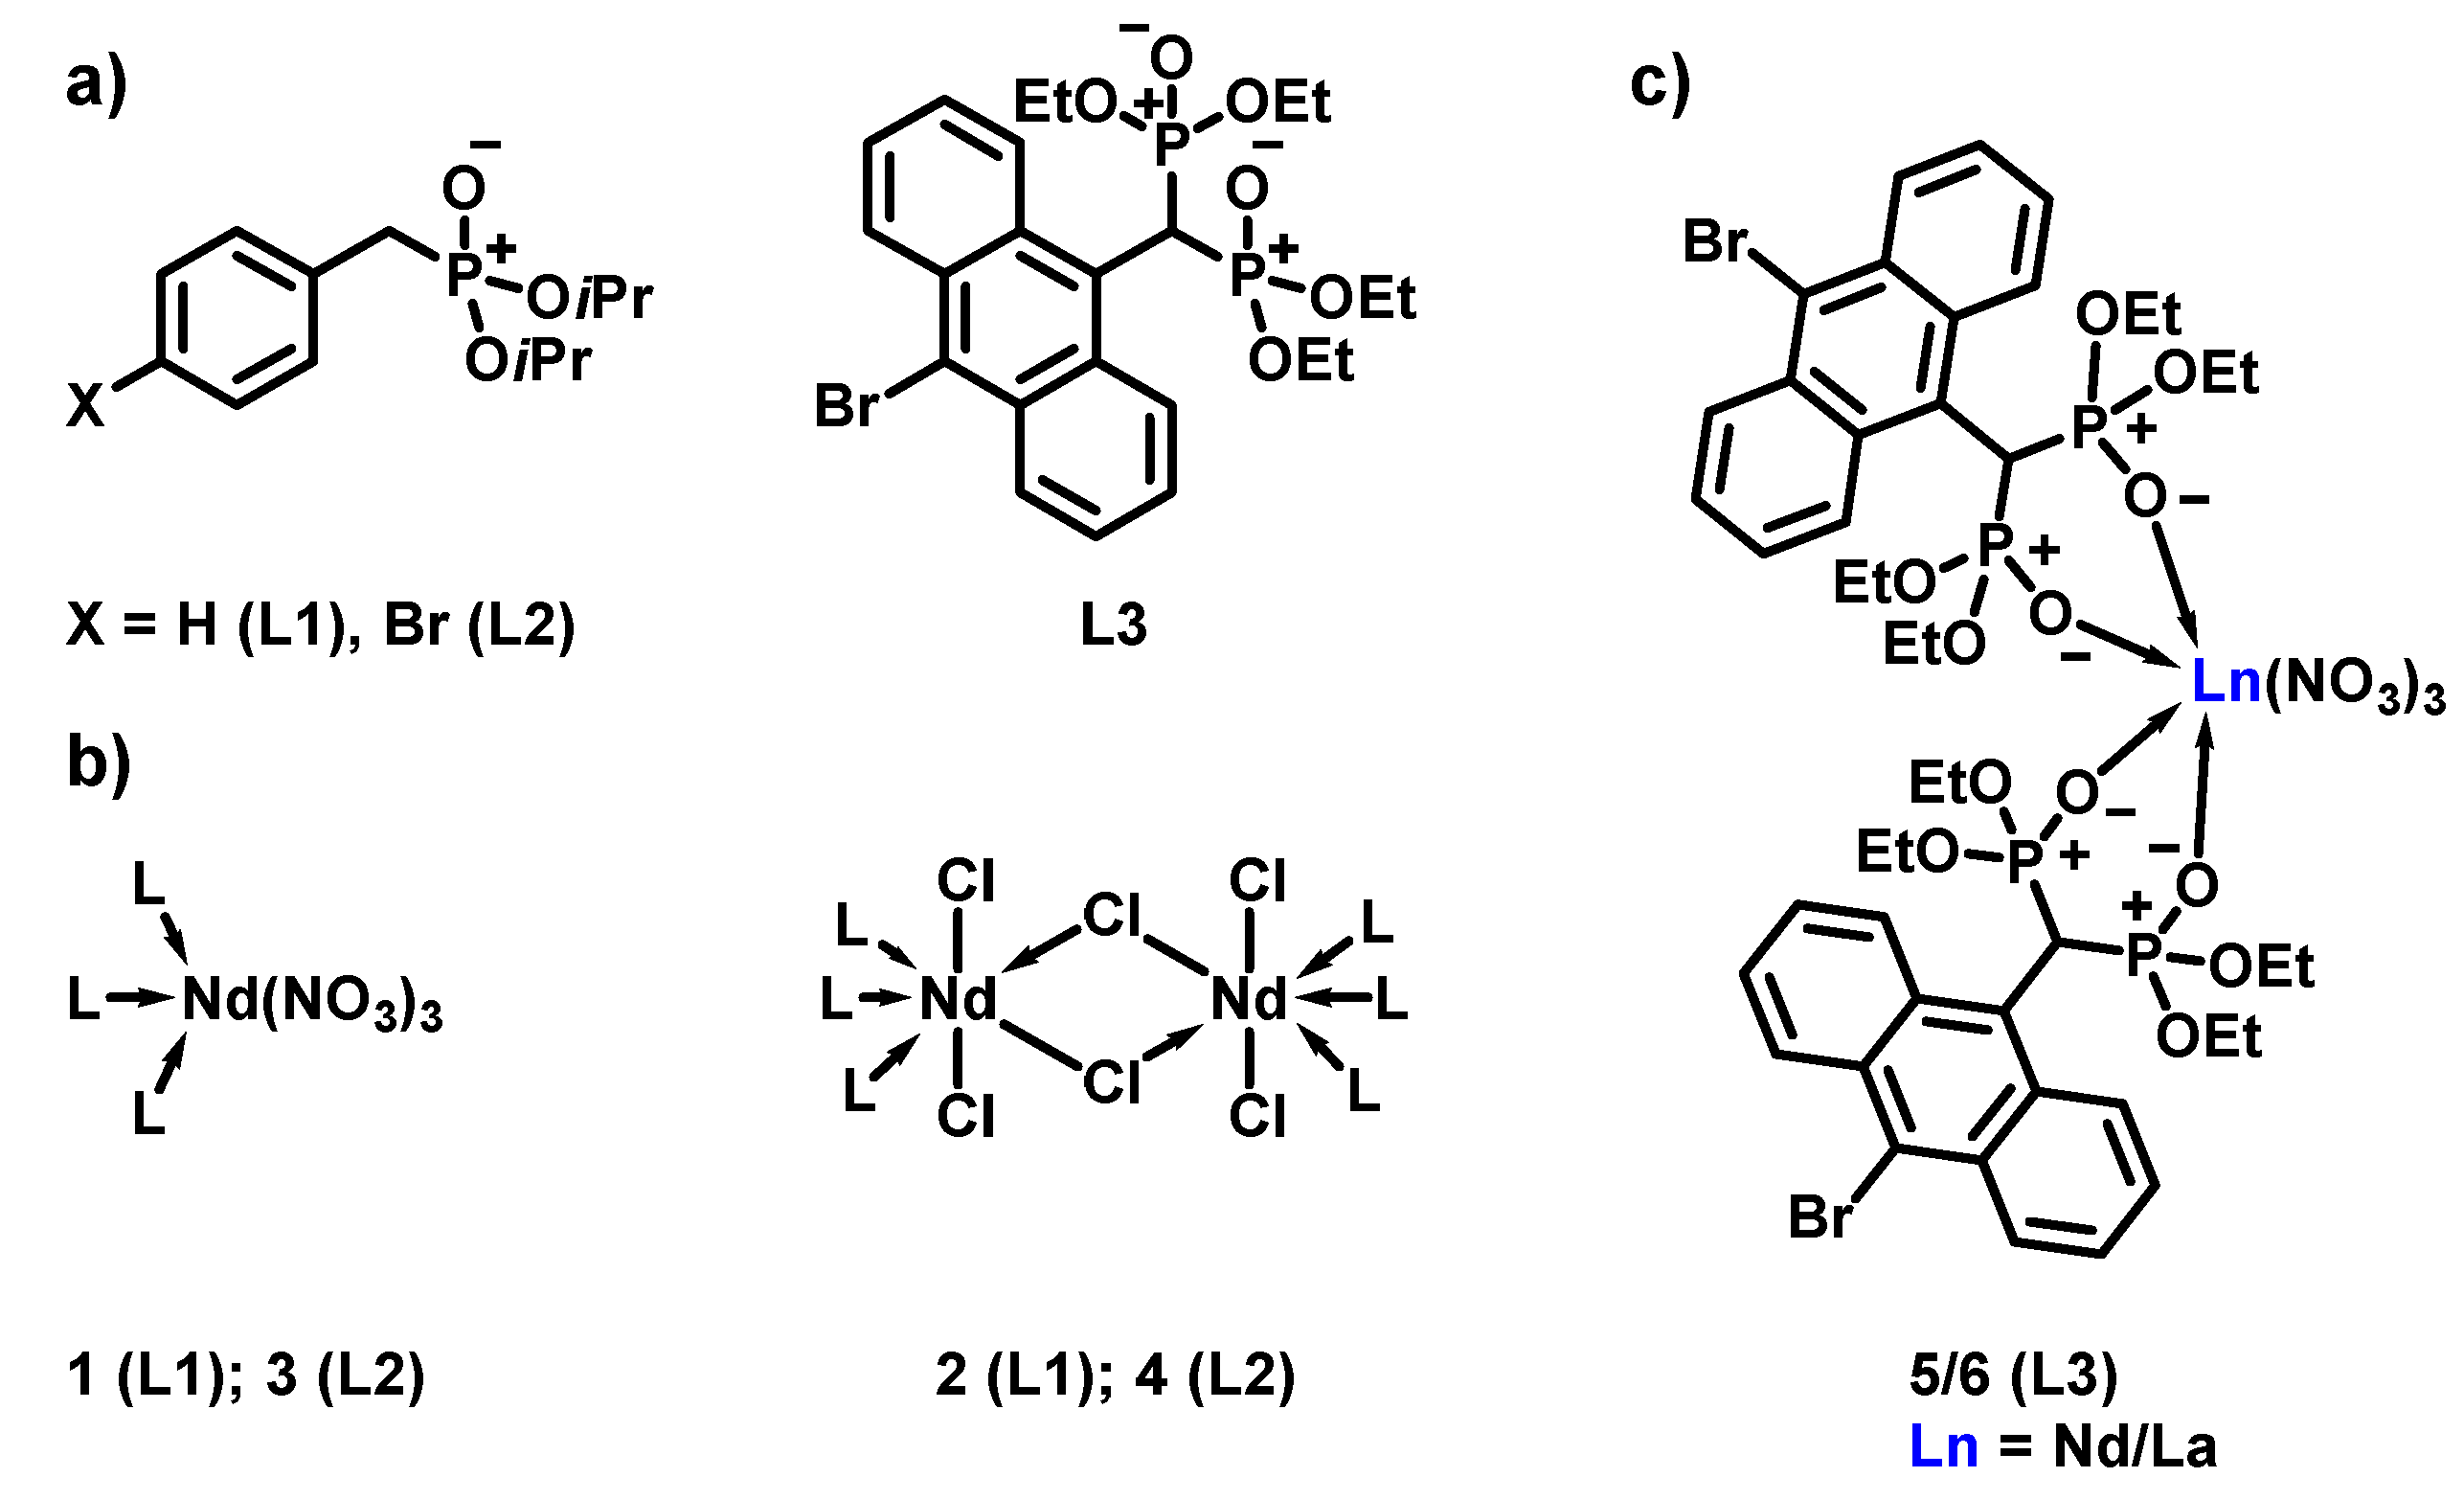
Scheme 1. (a) Overview on the mono-phosphonate ester ligands L1 and L2 and the anthracene-based geminal bisphosphonate ester L3. (b) Schematic structures of L1- and L2-supported complexes 14: Monomeric Nd(NO3)3-based complexes 1 and 3 and dimeric NdCl3-based species 2 and 4. (c) Monomeric structure of L3-supported Ln(NO3)3 (Ln = Nd3+, La3+) compounds 5 and 6.
Molecules 28 00048 sch001
Figure 1. The molecular structure of complex [Nd(L3)2(NO3)3] (5) which is isostructural to the solid-state structure of lanthanum(III) derivative [La(L3)2(NO3)3] (6). Anisotropic displacement parameters are depicted at the 50% probability level. Hydrogen atoms are omitted for clarity. Symmetry transformations used to generate equivalent atoms: #1: −x + 1, y, −z + 3/2. Selected bond lengths [Å] and angles [°] of 5 and 6 (If there is more than one value for a considered bond length or angle, merged values are given): Ln–OP=O (5: 2.443(5); 6: 2.525(5)), Ln–ONO3 (5: 2.570(11); 6: 2.629(18)), P=O (5: 1.466(5); 6: 1.467(5)), P–C (5: 1.779(7); 6: 1.788(7)), P–C–P (5: 118.4(4); 6: 117.8(4)), OP=O–Ln–OP=O (5: 72.5(16); 6: 71.4(16)).
Molecules 28 00048 g001
Figure 2. Normalized emission spectra of [Nd(L1)3Cl3]2 (2) obtained from amorphous bulk material at room temperature (RT): (a) 4F3/24I9/2 transition and 4F5/2, 2H9/24I11/2 (inset). (b) 4F3/24I11/2 transition and 4F5/2, 2H9/24I13/2 (inset).
Molecules 28 00048 g002
Figure 3. The normalized emission spectra of complex [Nd(L2)3(NO3)3] (3) obtained from amorphous bulk material (dashed line) and a solution in dry dichloromethane (DCM) (solid line, c = 4 × 10⁻³ mol/L) related to the transition from 4F3/2 to 4I9/2 (a),4I11/2 (b) and 4I13/2 (c). RT photoluminescence (PL) spectra of [Nd(L1)3(NO3)3] (1) (dot-dashed line), [Nd(L2)3(NO3)3] (3) (dashed line), and [Nd(L3)2(NO3)3] (5) (solid line) in dry DCM (c = 4 × 10⁻³ mol/L) of 4F3/24I9/2 (d), 4F3/24I11/2 (e), and 4F3/24I13/2 (f) transition. For data acquisition, laser power and excitation duration were kept constant. The spiky signal of the 4F3/24I13/2 transition (c,f) between 1350 nm and 1380 nm is related to setup noise.
Molecules 28 00048 g003
Figure 4. Nd3+ ion energy level diagram: The absorption transition 4I9/24F7/2, 4S3/2 (excitation at 750 nm) is followed by non-radiative decay to 4F5/2, 2H9/2 and 4F3/2 states, respectively. With depopulation of these states’ emission bands centered around 960 nm (4F5/2, 2H9/24I11/2) and 1180 nm (4F5/2, 2H9/24I13/2) as well as around 890 nm, 1060 nm, 1350 nm occur. Latter ones correspond to the 4F3/24I9/2, 4F3/24I11/2, and 4F3/24I13/2 transitions, respectively. Due to the ligand field splitting, the 4F3/2, 4I9/2, 4I11/2, and 4I13/2 states are split into two (R1, R2), five (Z1–Z5), six (Y1–Y6) and seven (X1–X7) Stark sublevels, respectively.
Molecules 28 00048 g004
Figure 5. Temperature-dependent emission spectra of amorphous bulk material of [Nd(L2)3(NO3)3] (3) assigned to 4F3/24I9/2 (a), 4F3/24I11/2 (b), and 4F3/24I13/2 (c) transitions, respectively. For the 4F3/24I9/2 transition the emission lines are labeled: Transition lines from R1 are marked in black (Z1-Z5) and from R2 to Z1-Z5 in red. The spiky signal of the 4F3/24I13/2 transition in (c) between 1350 nm and 1380 nm is related to setup noise.
Molecules 28 00048 g005
Figure 6. (a) The normalized PL emission spectra at 5 K of [Nd(L3)2(NO3)3] (5) corresponding to 4F3/24I9/2 transition from amorphous bulk sample (dashed line) and crystalline sample (solid line). (b) Low-temperature (5 K) PL spectra of crystalline [Nd(L3)2(NO3)3] (5) of the 4F3/24I9/2 transition taken at a polarization angle of 0° and 90°.
Molecules 28 00048 g006
Figure 7. Zero-order (dashed line) and second-order derivative spectrum (solid line) of [Nd(L2)3(NO3)3] (3) corresponding to the 4F3/24I9/2 transition.
Molecules 28 00048 g007
Figure 8. The normalized low-temperature (5 K) PL spectra of amorphous bulk [Nd(L1)3(NO3)3] (1) (black), [Nd(L1)3Cl3]2 (2) (red), [Nd(L2)3(NO3)3] (3) (green), and [Nd(L2)3Cl3]2 (4) (blue) for the 4F3/24I9/2 (a), 4F3/24I11/2 (b), and 4F3/24I13/2 (c) transitions, respectively. (df) Low-temperature (5 K) PL spectra of mono-phosphonate ester-supported compound [Nd(L2)3(NO3)3] (3) (dashed line) and geminal bisphosphonate ester complex [Nd(L3)2(NO3)3] (5) (solid line) for the three different emission bands.
Molecules 28 00048 g008
Figure 9. (a) Emission intensities of the R2 → Z1 and R1 → Z1 transition lines of compound [Nd(L3)2(NO3)3] (5); (b) λmax of the R2 → Z1 and R1 → Z1 transition lines of 5; (c) FWHM of the R1 → Z1 transition line of 5 as a function of the polarization angle.
Molecules 28 00048 g009
Figure 10. The light microscope images of samples of [Nd(L3)2(NO3)3] (5): (a) amorphous bulk material; (b) crystalline sample.
Molecules 28 00048 g010
Table 1. A summary of λmax values of 15 of transition lines corresponding to the 4F3/24I9/2 transition.
Complex[Nd(L1)3(NO3)3] (1)[Nd(L1)3Cl3]2 (2)[Nd(L2)3(NO3)3] (3)[Nd(L2)3Cl3]2 (4)[Nd(L3)2(NO3)3] (5)
Transitionλmax [nm]
R2 → Z1867.87873.55869.29875.45863.92
R1 → Z1871.26879.41872.29878.38-
R2 → Z2873.28-875.06-868.21
R1 → Z2876.54-878.06881.49871.95
R2 → Z3879.29-879.66883.36876.61
R1 → Z3882.74-882.73886.56880.89
R2 → Z4891.55-892.53891.67892.21
R1 → Z4895.34-895.60894.46-
R2 → Z5901.99900.21901.19901.48897.14
R1 → Z5905.56906.46904.19904.68901.97
Disclaimer/Publisher’s Note: The statements, opinions and data contained in all publications are solely those of the individual author(s) and contributor(s) and not of MDPI and/or the editor(s). MDPI and/or the editor(s) disclaim responsibility for any injury to people or property resulting from any ideas, methods, instructions or products referred to in the content.