
Biofortification of Three Cultivated Mushroom Species with Three Iron Salts—Potential for a New Iron-Rich Superfood

 ,
, 
 ,
,  ,
,  and
and 
Abstract
1. Introduction
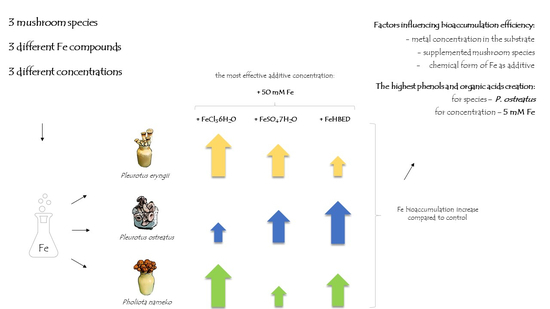
2. Results
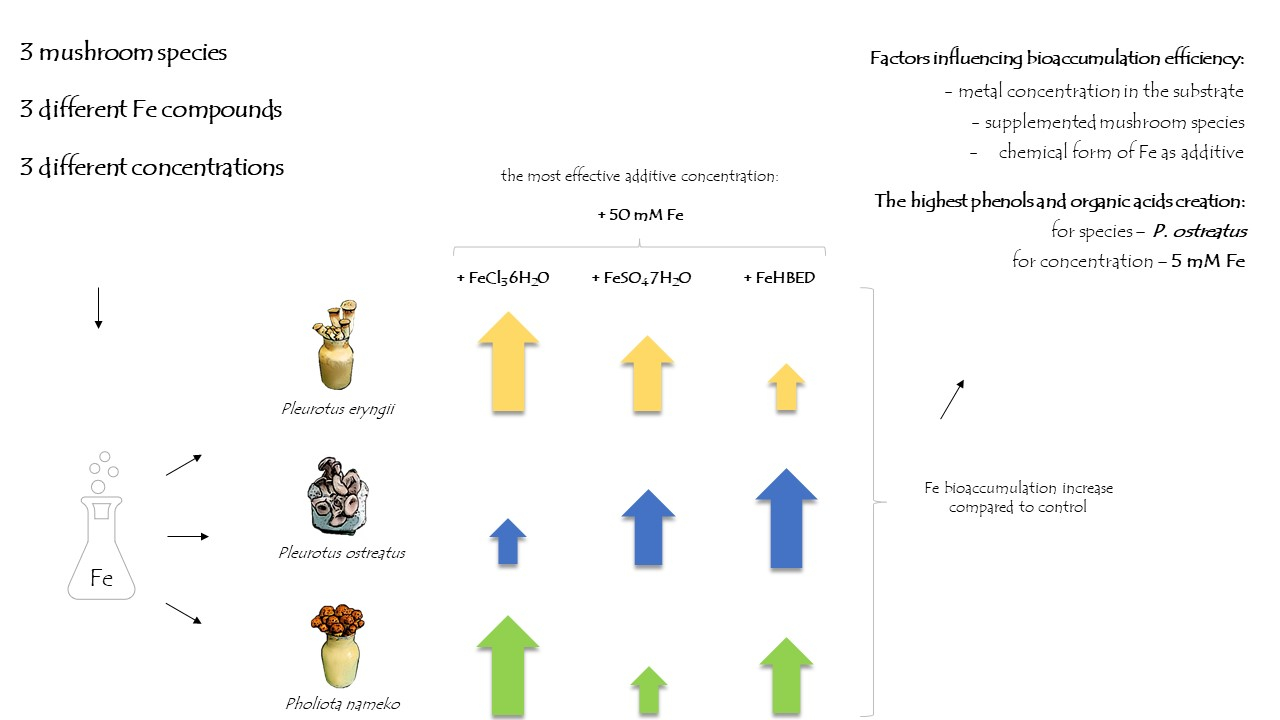
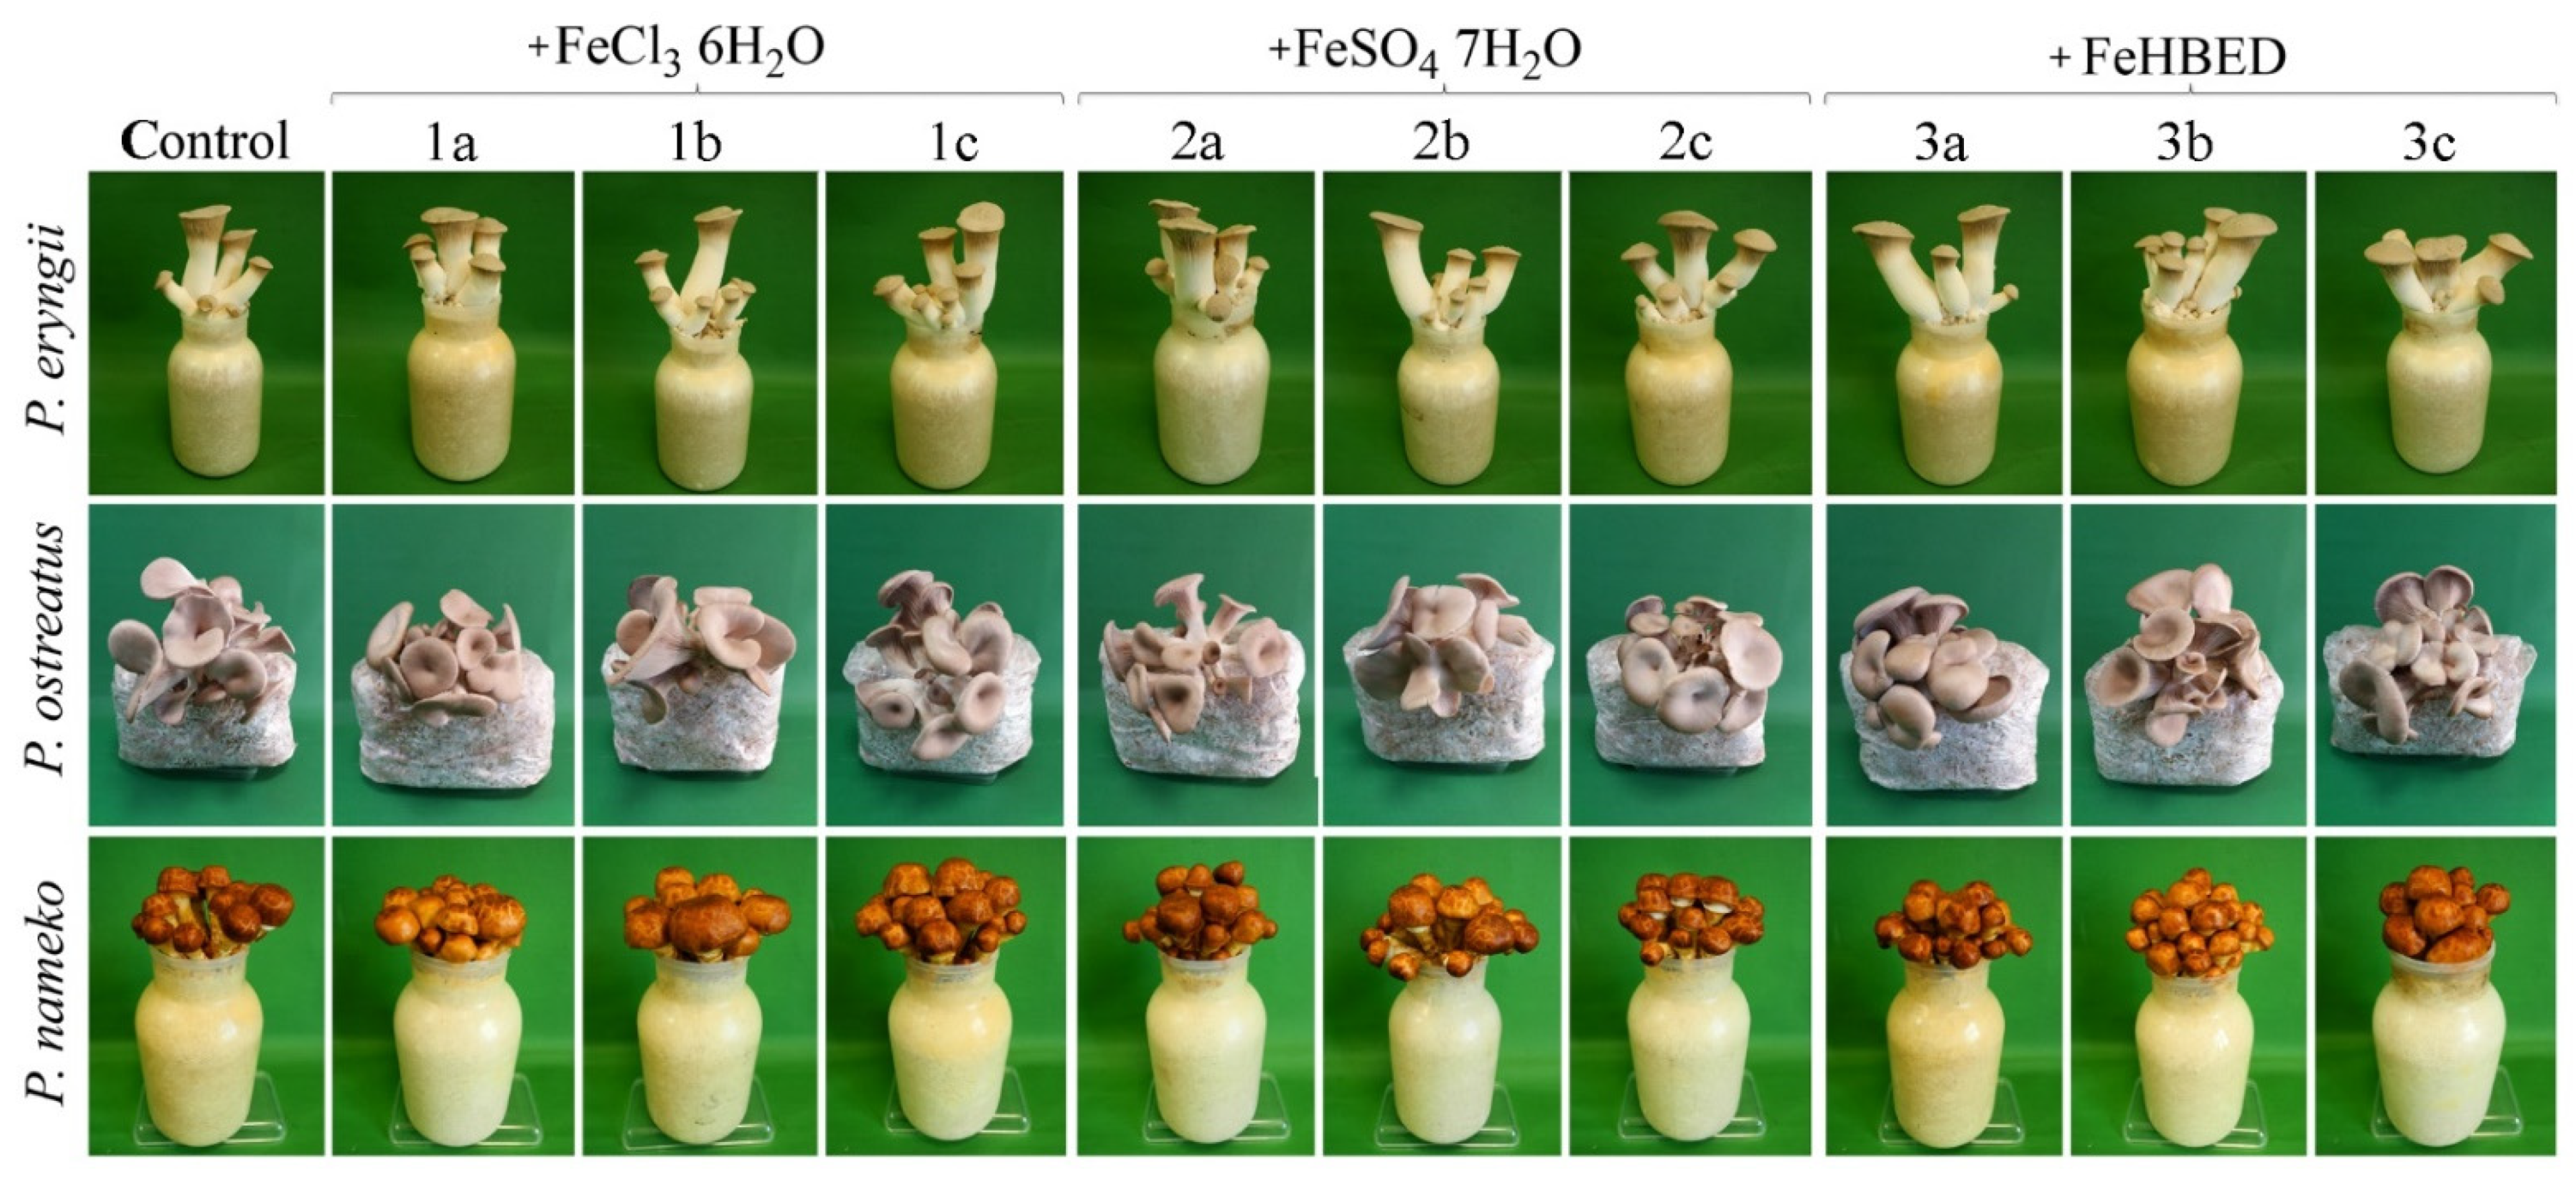
2.1. Morphology and Biomass of Fruit Bodies
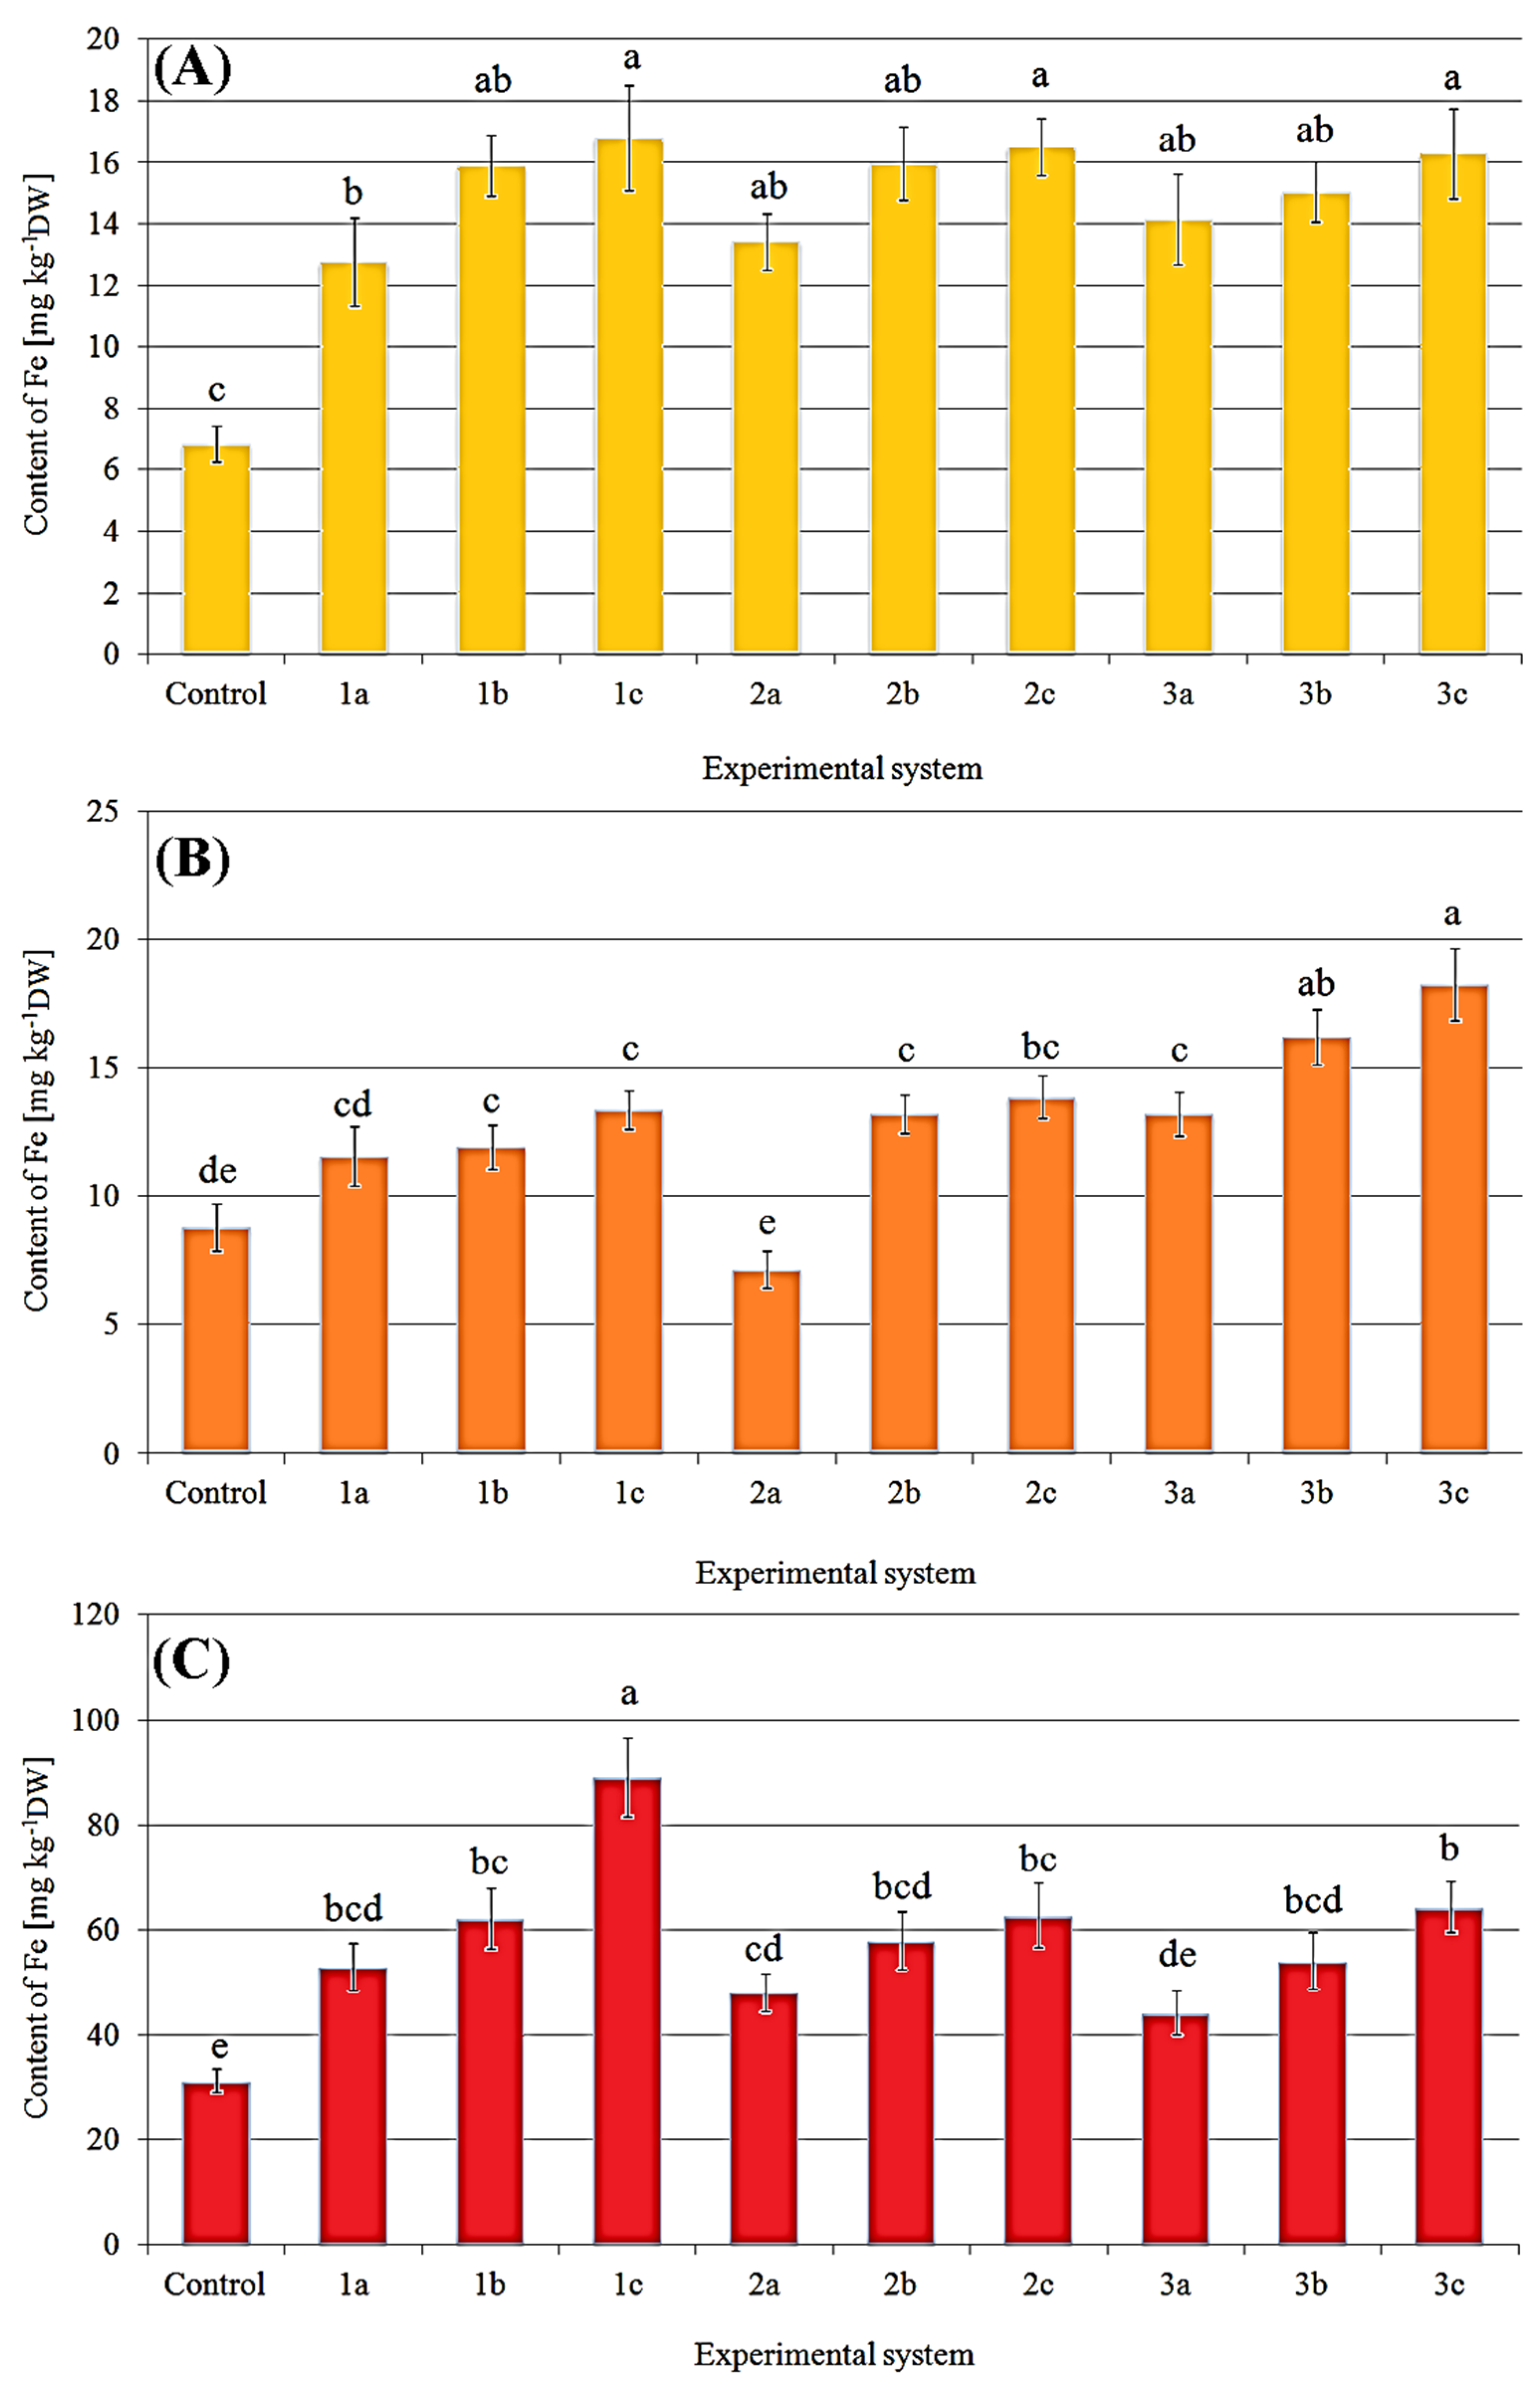
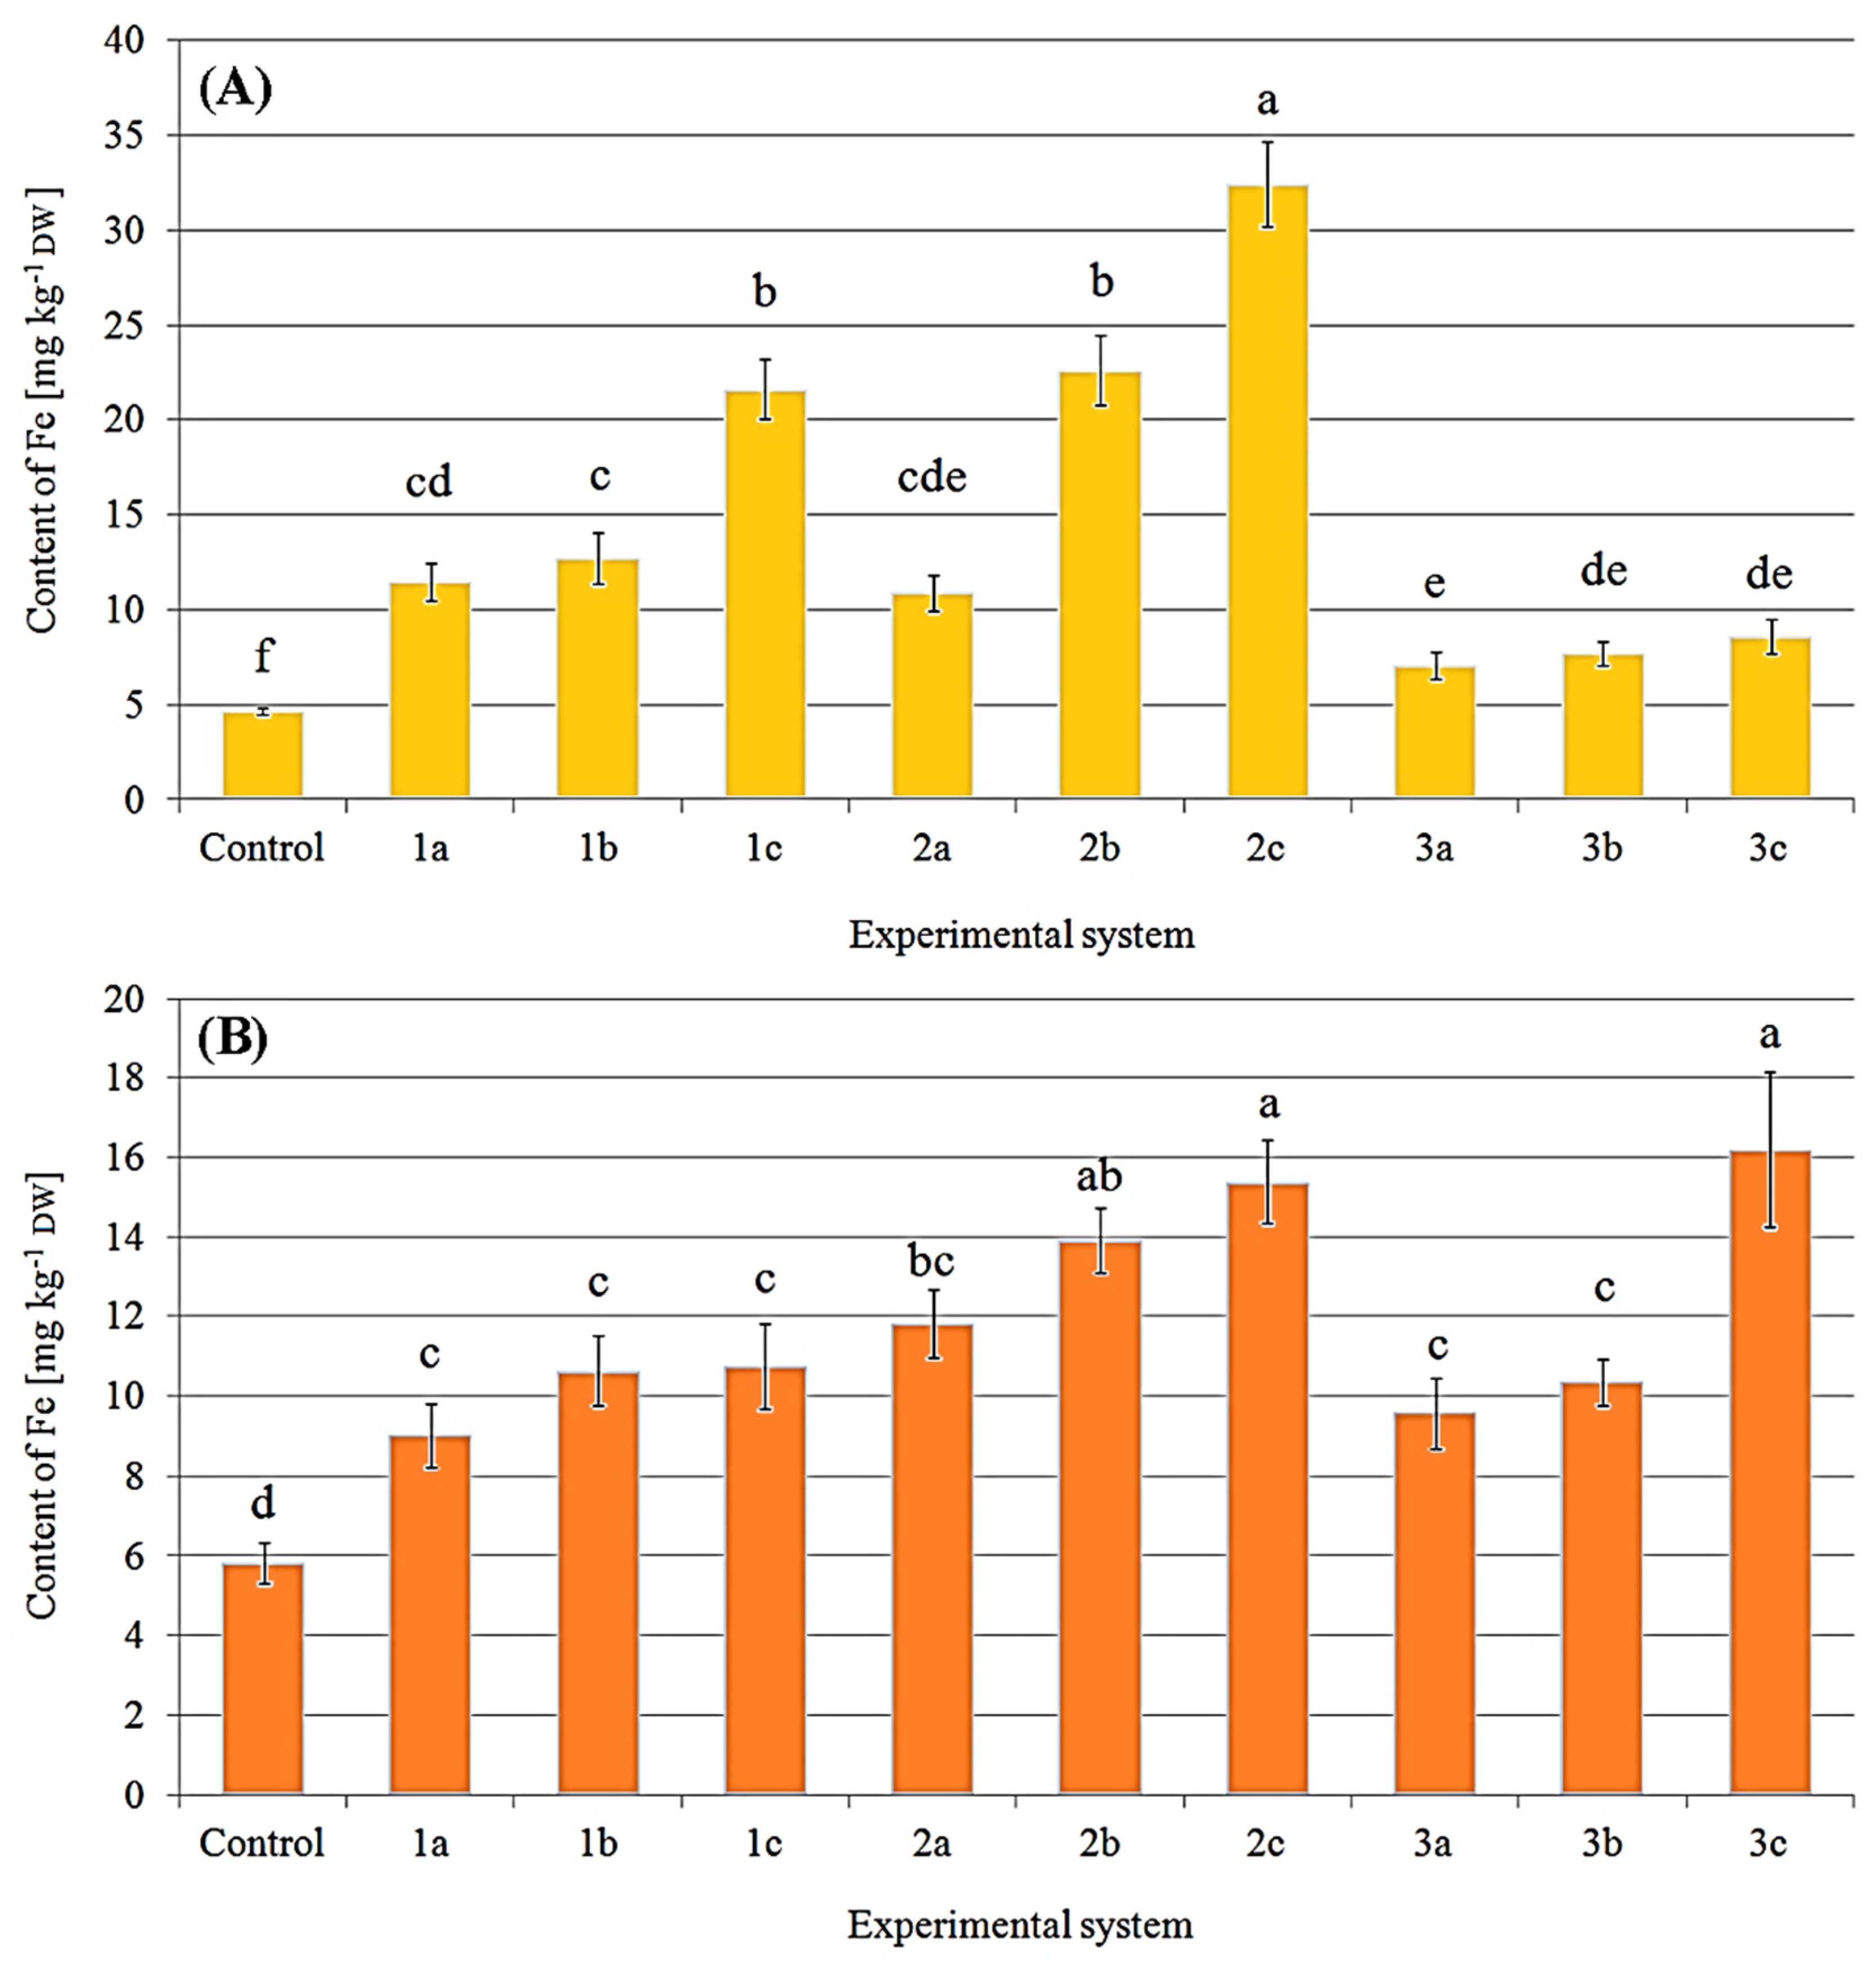
2.2. Content of Iron in Fruit Bodies
2.3. Content of Selected Elements in Mushrooms
2.4. Content of Phenolic Compounds in Supplemented Mushrooms
2.5. Content of Organic Acids in Supplemented Mushrooms
3. Discussion
4. Materials and Methods
4.1. Microorganisms and Spawn
4.2. Substrate Preparation
4.3. Determination of Fe, Ca, K, Mg, Na, Mn and S
4.3.1. Sample Preparation for Element Analysis
4.3.2. Instruments and Chemicals
4.3.3. Quality Assurance and Quality Control (QA/QC) of Samples
4.4. Sample Preparation and Analysis of Phenolic Compounds
4.5. Sample Preparation and Organic Acid Analysis
4.6. Statistical Analysis
5. Conclusions
Author Contributions
Funding
Institutional Review Board Statement
Informed Consent Statement
Data Availability Statement
Conflicts of Interest
Sample Availability
References
- Johnson, B.B.; Reinhold, J.; Holmes, T.L.; Moore, J.A.; Cowell, V.; Bernardo, A.S.; Rushworth, S.A.; Vassiliou, V.; Smith, J.G.W. Modelling Metabolic Shifts during Cardiomyocyte Differentiation, Iron Deficiency and Transferrin Rescue Using Human Pluripotent Stem Cells. Metabolites 2022, 12, 9. [Google Scholar] [CrossRef] [PubMed]
- Camaschella, C. New Insights into Iron Deficiency and Iron Deficiency Anemia. Blood Rev. 2017, 31, 225–233. [Google Scholar] [CrossRef] [PubMed]
- Blanco-Rojo, R.; Vaquero, M.P. Iron Bioavailability from Food Fortification to Precision Nutrition. A Review. Innov. Food Sci. Emerg. Technol. 2019, 51, 126–138. [Google Scholar] [CrossRef]
- Moll, R.; Davis, B. Iron, Vitamin B 12 and Folate. Medicine 2017, 45, 198–203. [Google Scholar] [CrossRef]
- Muckenthaler, M.U.; Rivella, S.; Hentze, M.W.; Galy, B. A Red Carpet for Iron Metabolism. Cell 2017, 168, 344–361. [Google Scholar] [CrossRef]
- Comín-Colet, J.; Frustaci, A.; Alnuwaysir, R.I.S.; Hoes, M.F.; van Veldhuisen, D.J.; van der Meer, P.; Beverborg, N.G. Iron Deficiency in Heart Failure: Mechanisms and Pathophysiology. J. Clin. Med. 2021, 11, 125. [Google Scholar] [CrossRef]
- Pettit, K.; Rowley, J.; Brown, N. Iron Deficiency. Paediatr. Child Health 2011, 21, 339–343. [Google Scholar] [CrossRef]
- van Dalen, D.H.; Kragten, J.A.; Emans, M.E.; van Ofwegen-Hanekamp, C.E.E.; Klaarwater, C.C.R.; Spanjers, M.H.A.; Hendrick, R.; van Deursen, C.T.B.M.; Brunner-La Rocca, H.P. Acute heart failure and iron deficiency: A prospective, multicentre, observational study. ESC Heart Failure. 2022, 9, 398–407. [Google Scholar] [CrossRef]
- Kumar, A.; Sharma, E.; Marley, A.; Samaan, M.A.; Brookes, M.J. Iron Deficiency Anaemia: Pathophysiology, Assessment, Practical Management. BMJ Open Gastroenterol. 2022, 9, e000759. [Google Scholar] [CrossRef]
- WHO. The Global Prevalence of Anaemia in 2011; WHO: Geneva, Switzerland, 2015. [Google Scholar]
- Saini, R.K.; Nile, S.H.; Keum, Y.S. Food Science and Technology for Management of Iron Deficiency in Humans: A Review. Trends Food Sci. Technol. 2016, 53, 13–22. [Google Scholar] [CrossRef]
- Li, S.; Guo, T.; Guo, W.; Cui, X.; Zeng, M.; Wu, H. Polyphosphates as an Effective Vehicle for Delivery of Bioavailable Nanoparticulate Iron(III). Food Chem. 2022, 373, 131477. [Google Scholar] [CrossRef] [PubMed]
- Zimmermann, M.B.; Hurrell, R.F. Nutritional Iron Deficiency. Lancet 2007, 370, 511–520. [Google Scholar] [CrossRef]
- Hurrell, R.F. Preventing Iron Deficiency through Food Fortification. Nutr. Rev. 1997, 55, 210–222. [Google Scholar] [CrossRef] [PubMed]
- Haas, J.D.; Luna, S.V.; Lung’aho, M.G.; Wenger, M.J.; Murray-Kolb, L.E.; Beebe, S.; Gahutu, J.B.; Egli, I.M. Consuming Iron Biofortified Beans Increases Iron Status in Rwandan Women after 128 Days in a Randomized Controlled Feeding Trial. J. Nutr. 2016, 146, 1586–1592. [Google Scholar] [CrossRef] [PubMed]
- Márquez-Quiroz, C.; De-la-Cruz-Lázaro, E.; Osorio-Osorio, R.; Sánchez-Chávez, E. Biofortification of Cowpea Beans with Iron: Iron’s Influence on Mineral Content and Yield. J. Soil Sci. Plant Nutr. 2015, 15, 839–847. [Google Scholar] [CrossRef]
- Finkelstein, J.L.; Mehta, S.; Udipi, S.A.; Ghugre, P.S.; Luna, S.V.; Wenger, M.J.; Murray-Kolb, L.E.; Przybyszewski, E.M.; Haas, J.D. A Randomized Trial of Iron-Biofortified Pearl Millet in School Children in India. J. Nutr. 2015, 145, 1576–1581. [Google Scholar] [CrossRef]
- Losso, J.N.; Karki, N.; Muyonga, J.; Wu, Y.; Fusilier, K.; Jacob, G.; Yu, Y.; Rood, J.C.; Finley, J.W.; Greenway, F.L. Iron Retention in Iron-Fortified Rice and Use of Iron-Fortified Rice to Treat Women with Iron Deficiency: A Pilot Study. BBA Clin. 2017, 8, 78–83. [Google Scholar] [CrossRef]
- Makowska, A.; Zielińska-Dawidziak, M.; Niedzielski, P.; Michalak, M. Effect of Extrusion Conditions on Iron Stability and Physical and Textural Properties of Corn Snacks Enriched with Soybean Ferritin. Int. J. Food Sci. Technol. 2018, 53, 296–303. [Google Scholar] [CrossRef]
- Cakmak, I.; Pfeiffer, W.H.; McClafferty, B. REVIEW: Biofortification of Durum Wheat with Zinc and Iron. Cereal Chem. J. 2010, 87, 10–20. [Google Scholar] [CrossRef]
- Rzymski, P.; Mleczek, M.; Niedzielski, P.; Siwulski, M.; Gasecka, M. Potential of Cultivated Ganoderma Lucidum Mushrooms for the Production of Supplements Enriched with Essential Elements. J. Food Sci. 2016, 81, C587–C592. [Google Scholar] [CrossRef]
- Niedzielski, P.; Mleczek, M.; Siwulski, M.; Gąsecka, M.; Kozak, L.; Rissmann, I.; Mikołajczak, P. Efficacy of Supplementation of Selected Medicinal Mushrooms with Inorganic Selenium Salts. J. Environ. Sci. Health Part B 2014, 49, 929–937. [Google Scholar] [CrossRef] [PubMed]
- De Assunão, L.S.; da Luz, J.M.R.; da Silva, M.D.C.S.; Vieira, P.A.F.; Bazzolli, D.M.S.; Vanetti, M.C.D.; Kasuya, M.C.M. Enrichment of Mushrooms: An Interesting Strategy for the Acquisition of Lithium. Food Chem. 2012, 134, 1123–1127. [Google Scholar] [CrossRef] [PubMed]
- Fontes Vieira, P.A.; Gontijo, D.C.; Vieira, B.C.; Fontes, E.A.F.; de Assunção, L.S.; Leite, J.P.V.; Oliveira, M.G.d.A.; Kasuya, M.C.M. Antioxidant Activities, Total Phenolics and Metal Contents in Pleurotus Ostreatus Mushrooms Enriched with Iron, Zinc or Lithium. LWT Food Sci. Technol. 2013, 54, 421–425. [Google Scholar] [CrossRef]
- Ogidi, O.C.; Dias Nunes, M.; Oyetayo, V.O.; Akinyele, B.J.; Catarina, M.; Kasuya, M. Mycelial Growth, Biomass Production and Iron Uptake by Mushrooms of Pleurotus Species Cultivated on Urochloa Decumbens (Stapf) R. D. Webster. J. Food Res. 2016, 5, 13. [Google Scholar] [CrossRef]
- Almeida, S.M.; Umeo, S.H.; Marcante, R.C.; Yokota, M.E.; Valle, J.S.; Dragunski, D.C.; Colauto, N.B.; Linde, G.A. Iron Bioaccumulation in Mycelium of Pleurotus Ostreatus. Braz. J. Microbiol. 2015, 46, 195–200. [Google Scholar] [CrossRef] [PubMed]
- Petrović, J.; Glamočlija, J.; Stojković, D.; Ćirić, A.; Barros, L.; Ferreira, I.C.F.R.; Soković, M. Nutritional Value, Chemical Composition, Antioxidant Activity and Enrichment of Cream Cheese with Chestnut Mushroom Agrocybe aegerita (Brig.) Sing. J. Food Sci. Technol. 2015, 52, 6711–6718. [Google Scholar] [CrossRef] [PubMed]
- Popovic, V.; Zivkovic, J.; Davidovic, S.; Stevanovic, M.; Stojkovic, D. Mycotherapy of Cancer: An Update on Cytotoxic and Antitumor Activities of Mushrooms, Bioactive Principles and Molecular Mechanisms of Their Action. Curr. Top. Med. Chem. 2013, 13, 2791–2806. [Google Scholar] [CrossRef]
- Stojković, D.; Reis, F.S.; Barros, L.; Glamočlija, J.; irić, A.; van Griensven, L.J.I.D.; Soković, M.; Ferreira, I.C.F.R. Nutrients and Non-Nutrients Composition and Bioactivity of Wild and Cultivated Coprinus comatus (O.F.Müll.) Pers. Food Chem. Toxicol. 2013, 59, 289–296. [Google Scholar] [CrossRef]
- Reis, F.S.; Martins, A.; Barros, L.; Ferreira, I.C.F.R. Antioxidant Properties and Phenolic Profile of the Most Widely Appreciated Cultivated Mushrooms: A Comparative Study between in Vivo and in Vitro Samples. Food Chem. Toxicol. 2012, 50, 1201–1207. [Google Scholar] [CrossRef]
- Muszyńska, B.; Sukowska-Ziaja, K.; Ekiert, H. Phenolic Acids in Selected Edible Basidiomycota Species: Armillaria Mellea, Boletus Badius, Boletus Edulis, Cantharellus Cibarius, Lactarius Deliciosus and Pleurotus Ostreatus. Acta Sci. Pol. Hortorum Cultus 2013, 12, 107–116. [Google Scholar]
- Moon, M.K.; Lee, Y.J.; Kim, J.S.; Kang, D.G.; Lee, H.S. Effect of Caffeic Acid on Tumor Necrosis Factor-Alpha-Induced Vascular Inflammation in Human Umbilical Vein Endothelial Cells. Biol. Pharm. Bull. 2009, 32, 1371–1377. [Google Scholar] [CrossRef] [PubMed]
- Stanikunaite, R.; Khan, S.I.; Trappe, J.M.; Ross, S.A. Cyclooxygenase-2 Inhibitory and Antioxidant Compounds from the Truffle Elaphomyces Granulatus. Phytother. Res. 2009, 23, 575–578. [Google Scholar] [CrossRef] [PubMed]
- Ferreira, I.C.F.R.; Barros, L.; Abreu, R.M.V. Antioxidants in Wild Mushrooms. Curr. Med. Chem. 2009, 16, 1543–1560. [Google Scholar] [CrossRef] [PubMed]
- Çayan, F.; Tel, G.; Duru, M.E.; Öztürk, M.; Türkoğlu, A.; Harmandar, M. Application of GC, GC-MSD, ICP-MS and Spectrophotometric Methods for the Determination of Chemical Composition and In Vitro Bioactivities of Chroogomphus Rutilus: The Edible Mushroom Species. Food Anal. Methods 2013, 7, 449–458. [Google Scholar] [CrossRef]
- Silva, B.M.; Andrade, P.B.; Valentão, P.; Ferreres, F.; Seabra, R.M.; Ferreira, M.A. Quince (Cydonia oblonga Miller) Fruit (Pulp, Peel, and Seed) and Jam: Antioxidant Activity. J. Agric. Food Chem. 2004, 52, 4705–4712. [Google Scholar] [CrossRef]
- Lee, D.N.; Liu, S.R.; Chen, Y.T.; Wang, R.C.; Lin, S.Y.; Weng, C.F. Effects of Diets Supplemented with Organic Acids and Nucleotides on Growth, Immune Responses and Digestive Tract Development in Weaned Pigs. J. Anim. Physiol. Anim. Nutr. 2007, 91, 508–518. [Google Scholar] [CrossRef]
- Zhang, H.; Lu, T.; Shang, Z.; Li, Y.; He, J.; Liu, S.; Li, D.; Zhou, Y.; Qi, Z. Transport of Cd2+ through Saturated Porous Media: Insight into the Effects of Low-Molecular-Weight Organic Acids. Water Res. 2020, 168, 115182. [Google Scholar] [CrossRef]
- Liu, J.; Jia, L.; Kan, J.; Jin, C. In Vitro and in Vivo Antioxidant Activity of Ethanolic Extract of White Button Mushroom (Agaricus Bisporus). Food Chem. Toxicol. 2013, 51, 310–316. [Google Scholar] [CrossRef]
- Gąsecka, M.; Siwulski, M.; Mleczek, M. Evaluation of Bioactive Compounds Content and Antioxidant Properties of Soil-Growing and Wood-Growing Edible Mushrooms. J. Food Processing Preserv. 2018, 42, e13386. [Google Scholar] [CrossRef]
- Magdziak, Z.; Siwulski, M.; Mleczek, M. Characteristics of Organic Acid Profiles in 16 Species of Wild Growing Edible Mushrooms. J. Environ. Sci. Health Part B 2017, 52, 784–789. [Google Scholar] [CrossRef]
- Partearroyo, T.; Varela-Moreiras, G.; Samson, K.L.I.; Fischer, J.A.J.; Roche, M.L. Iron Status, Anemia, and Iron Interventions and Their Associations with Cognitive and Academic Performance in Adolescents: A Systematic Review. Nutrients 2022, 14, 224. [Google Scholar] [CrossRef]
- Verna, G.; Sila, A.; Liso, M.; Mastronardi, M.; Chieppa, M.; Cena, H.; Campiglia, P. Iron-Enriched Nutritional Supplements for the 2030 Pharmacy Shelves. Nutrients 2021, 13, 378. [Google Scholar] [CrossRef] [PubMed]
- Lynch, S.R. Why Nutritional Iron Deficiency Persists as a Worldwide Problem. J. Nutr. 2011, 141, 763S–768S. [Google Scholar] [CrossRef] [PubMed]
- Jagdale, Y.D.; Mahale, S.V.; Zohra, B.; Nayik, G.A.; Dar, A.H.; Ali Khan, K.; Abdi, G.; Karabagias, I.K. Nutritional Profile and Potential Health Benefits of Super Foods: A Review. Sustainability 2021, 13, 9240. [Google Scholar] [CrossRef]
- Gupta, E.; Mishra, P. Functional Food with Some Health Benefits, So Called Superfood: A Review. Curr. Nutr. Food Sci. 2021, 17, 144–166. [Google Scholar] [CrossRef]
- Zięba, P.; Kała, K.; Włodarczyk, A.; Szewczyk, A.; Kunicki, E.; Sękara, A.; Muszyńska, B. Selenium and Zinc Biofortification of Pleurotus Eryngii Mycelium and Fruiting Bodies as a Tool for Controlling Their Biological Activity. Molecules 2020, 25, 889. [Google Scholar] [CrossRef]
- Rzymski, P.; Niedzielski, P.; Siwulski, M.; Mleczek, M.; Budzyńska, S.; Gąsecka, M.; Poniedziałek, B. Lithium Biofortification of Medicinal Mushrooms Agrocybe Cylindracea and Hericium Erinaceus. J. Food Sci. Technol. 2017, 54, 2387–2393. [Google Scholar] [CrossRef]
- Gąsecka, M.; Mleczek, M.; Siwulski, M.; Niedzielski, P. Phenolic Composition and Antioxidant Properties of Pleurotus Ostreatus and Pleurotus Eryngii Enriched with Selenium and Zinc. Eur. Food Res. Technol. 2015, 242, 723–732. [Google Scholar] [CrossRef]
- Budzyńska, S.; Siwulski, M.; Magdziak, Z.; Budka, A.; Gąsecka, M.; Kalač, P.; Rzymski, P.; Niedzielski, P.; Mleczek, M. Influence of Iron Addition (Alone or with Calcium) to Elements Biofortification and Antioxidants in Pholiota Nameko. Plants 2021, 10, 2275. [Google Scholar] [CrossRef]
- Siwulski, M.; Budzyńska, S.; Rzymski, P.; Gąsecka, M.; Niedzielski, P.; Kalač, P.; Mleczek, M. The Effects of Germanium and Selenium on Growth, Metalloid Accumulation and Ergosterol Content in Mushrooms: Experimental Study in Pleurotus Ostreatus and Ganoderma Lucidum. Eur. Food Res. Technol. 2019, 245, 1799–1810. [Google Scholar] [CrossRef]
- Ho, L.-H.; Tan, T.-C.; Chong, L.-C. Designer Foods as an Effective Approach to Enhance Disease Preventative Properties of Food through Its Health Functionalities. In Future Foods; Bhat, R., Ed.; Academic Press: Cambridge, MA, USA, 2022; pp. 469–497. [Google Scholar] [CrossRef]
- Meniqueti, A.B.; Ruiz, S.P.; Faria, M.G.I.; do Valle, J.S.; Gonçalves, A.C.; Dragunski, D.C.; Colauto, N.B.; Linde, G.A. Iron Bioaccumulation in Lentinus Crinitus Mycelia Cultivated in Agroindustrial Byproducts. Waste Biomass Valorization 2021, 12, 4965–4974. [Google Scholar] [CrossRef]
- Meniqueti, A.B.; Ruiz, S.P.; Faria, M.G.I.; do Valle, J.S.; Gonçalves, A.C.; Dragunski, D.C.; Colauto, N.B.; Linde, G.A. Iron-Enriched Mycelia of Edible and Medicinal Basidiomycetes. Environ. Technol. 2020, 43, 1248–1254. [Google Scholar] [CrossRef]
- Oyetayo, V.O.; Ogidi, C.O.; Bayode, S.O.; Enikanselu, F.F. Evaluation of Biological Efficiency, Nutrient Contents and Antioxidant Activity of Pleurotus Pulmonarius Enriched with Zinc and Iron. Indian Phytopathol. 2021, 74, 901–910. [Google Scholar] [CrossRef]
- Scheid, S.S.; Faria, M.G.I.; Velasquez, L.G.; do Valle, J.S.; Gonçalves, A.C.; Dragunski, D.C.; Colauto, N.B.; Linde, G.A. Iron Biofortification and Availability in the Mycelial Biomass of Edible and Medicinal Basidiomycetes Cultivated in Sugarcane Molasses. Sci. Rep. 2020, 10, 12875. [Google Scholar] [CrossRef] [PubMed]
- Umeo, S.H.; Faria, M.G.I.; Dragunski, D.C.; do Valle, J.S.; Colauto, N.B.; Linde, G.A. Iron Or Zinc Bioaccumulated In Mycelial Biomass Of Edible Basidiomycetes. An. Acad. Bras. Ciências 2020, 92, 1–10. [Google Scholar] [CrossRef]
- Condé, V.F.; Oliveira, J.E.Z.; Oliveira, D.M.F. Pleurotus Ostreatus (Jacq.) P. Kumm. Flour (Hiratake Mushroom) Enriched in Iron. Ciência Nat. 2017, 39, 1. [Google Scholar] [CrossRef]
- Connorton, J.M.; Balk, J. Iron Biofortification of Staple Crops: Lessons and Challenges in Plant Genetics. Plant Cell Physiol. 2019, 60, 1447–1456. [Google Scholar] [CrossRef]
- Shumayla; Upadhyay, S.K. Mechanism of Iron Uptake and Homeostasis in Plants. In Cation Transporters in Plants; Upadhyay, S.K., Ed.; Academic Press: Cambridge, MA, USA, 2022; pp. 147–165. [Google Scholar] [CrossRef]
- Sida-Arreola, J.P.; Sánchez, E.; Ávila-Quezada, G.D.; Zamudio-Flores, P.B.; Acosta-Muñiz, C.H. Can Improve Iron Biofortification Antioxidant Response, Yield and Nutritional Quality in Green Bean? Agric. Sci. 2015, 6, 1324–1332. [Google Scholar] [CrossRef]
- Zang, L.Y.; Cosma, G.; Gardner, H.; Shi, X.; Castranova, V.; Vallyathan, V. Effect of Antioxidant Protection by P-Coumaric Acid on Low-Density Lipoprotein Cholesterol Oxidation. Am. J. Physiol. Cell Physiol. 2000, 279, C954–C960. [Google Scholar] [CrossRef]
- Kiliç, I.; Yeşiloǧlu, Y. Spectroscopic Studies on the Antioxidant Activity of P-Coumaric Acid. Spectrochim. Acta Part A: Mol. Biomol. Spectrosc. 2013, 115, 719–724. [Google Scholar] [CrossRef]
- Przybysz, A.; Wrochna, M.; Małecka-Przybysz, M.; Gawrońska, H.; Gawroński, S.W. Vegetable Sprouts Enriched with Iron: Effects on Yield, ROS Generation and Antioxidative System. Sci. Hortic. 2016, 203, 110–117. [Google Scholar] [CrossRef]
- Li, K.; Hu, G.; Yu, S.; Tang, Q.; Liu, J. Effect of the Iron Biofortification on Enzymes Activities and Antioxidant Properties in Germinated Brown Rice. J. Food Meas. Charact 2018, 12, 789–799. [Google Scholar] [CrossRef]
- Dias, D.M.; Kolba, N.; Binyamin, D.; Ziv, O.; Nutti, M.R.; Martino, H.S.D.; Glahn, R.P.; Koren, O.; Tako, E. Iron Biofortified Carioca Bean (Phaseolus Vulgaris L.)—Based Brazilian Diet Delivers More Absorbable Iron and Affects the Gut Microbiota In Vivo (Gallus Gallus). Nutrients 2018, 10, 1970. [Google Scholar] [CrossRef] [PubMed]
- Tako, E.; Beebe, S.E.; Reed, S.; Hart, J.J.; Glahn, R.P. Polyphenolic Compounds Appear to Limit the Nutritional Benefit of Biofortified Higher Iron Black Bean (Phaseolus Vulgaris L.). Nutr. J. 2014, 13, 28. [Google Scholar] [CrossRef] [PubMed]
- Lesjak, M.; Hoque, R.; Balesaria, S.; Skinner, V.; Debnam, E.S.; Srai, S.K.S.; Sharp, P.A. Quercetin Inhibits Intestinal Iron Absorption and Ferroportin Transporter Expression In Vivo and In Vitro. PLoS ONE 2014, 9, e102900. [Google Scholar] [CrossRef]
- Petry, N.; Egli, I.; Zeder, C.; Walczyk, T.; Hurrell, R. Polyphenols and Phytic Acid Contribute to the Low Iron Bioavailability from Common Beans in Young Women. J. Nutr. 2010, 140, 1977–1982. [Google Scholar] [CrossRef] [PubMed]
- Kakoti, M.; Hazarika, D.J.; Kumar, A.; Barooah, M.; Modi, M.K.; Bhattacharyya, A.; Boro, R.C. Genetic Diversity and DNA Barcoding of Wild Mushrooms from Northeast India. Iran. J. Sci. Technol. Trans. A: Sci. 2021, 45, 469–479. [Google Scholar] [CrossRef]
- Silva, B.M.; Andrade, P.B.; Gonçalves, A.C.; Seabra, R.M.; Oliveira, M.B.; Ferreira, M.A. Influence of Jam Processing upon the Contents of Phenolics, Organic Acids and Free Amino Acids in Quince Fruit (Cydonia oblonga Miller). Eur. Food Res. Technol. 2004, 218, 385–389. [Google Scholar] [CrossRef]
- Wagay, J.A.; Alanazi, A.M.; Vyas, D.; Pala, S.A.; Rahman, Q.I. Antioxidant and Organic Acid Evaluation of Geaster Saccatum Mushroom by Chemical and Electrochemical Assay at Carbon Nanotube Paste Electrode. J. King Saud Univ. Sci. 2021, 33, 101336. [Google Scholar] [CrossRef]
- Siwulski, M.; Budka, A.; Rzymski, P.; Gąsecka, M.; Kalač, P.; Budzyńska, S.; Magdziak, Z.; Niedzielski, P.; Mleczek, P.; Mleczek, M. Worldwide Basket Survey of Multielemental Composition of White Button Mushroom Agaricus Bisporus. Chemosphere 2020, 239, 124718. [Google Scholar] [CrossRef]
- Harmens, H.; Koevoets, P.L.M.; Verkleij, J.A.C.; Ernst, W.H.O. The Role of Low Molecular Weight Organic Acids in the Mechanism of Increased Zinc Tolerance in Silene Vulgaris (Moench) Garcke. New Phytol. 1994, 126, 615–621. [Google Scholar] [CrossRef]
- Ribeiro, B.; Andrade, P.B.; Baptista, P.; Barros, L.; Ferreira, I.C.F.R.; Seabra, R.M.; Valentão, P. Leucopaxillus Giganteus Mycelium: Effect of Nitrogen Source on Organic Acids and Alkaloids. J. Agric. Food Chem. 2008, 56, 4769–4774. [Google Scholar] [CrossRef] [PubMed]
- Stamets, P. Growing Gourmet and Medicinal Mushrooms, 3rd ed.; Ten Speed Press: Berkeley, CA, USA, 2000; ISBN 978-1-58008-175-7. [Google Scholar]


| Experimental System | Ca | K | Mg | Mn | Na | S |
|---|---|---|---|---|---|---|
| I Crop | ||||||
| Control | 361 e ± 37.4 | 10,076 e ± 1160 | 583 cd ± 49.2 | 2.61 c ± 0.21 | 153 e ± 15.1 | 4099 a ± 476 |
| 1a | 562 cd ± 57.8 | 12,460 cde ± 1351 | 637 bcd ± 60.7 | 5.51 ab ± 0.40 | 152 e ± 14.9 | 4355 a ± 318 |
| 1b | 791b ± 70.5 | 16,168 abc ± 1543 | 784 ab ± 89.2 | 5.35 ab ± 0.37 | 181 de ± 13.8 | 4451 a ± 499 |
| 1c | 860b ± 72.1 | 18,805 a ± 1776 | 908 a ± 64.5 | 6.38 a ± 0.37 | 180 de ± 16.2 | 4814 a ± 514 |
| 2a | 566 cd ± 49.4 | 11,552 de ± 983 | 562 d ± 49.3 | 4.38 b ± 0.30 | 180 de ± 7.50 | 3949 a ± 262 |
| 2b | 1131 a ± 121 | 16,835 ab ± 1052 | 752 abc ± 70.8 | 5.98 a ± 0.55 | 238 bc ± 17.2 | 4676 a ± 346 |
| 2c | 680 bc ± 74.2 | 14,525 bcd ± 1561 | 744 abc ± 47.0 | 5.64 a ± 0.56 | 285 ab ± 19.4 | 4699 a ± 301 |
| 3a | 818 b ± 82.8 | 14,862 abcd ± 1367 | 729 bcd ± 45.3 | 6.09 a ± 0.36 | 212 cd ± 19.5 | 4368 a ± 374 |
| 3b | 704 bc ± 66.6 | 14,827 abcd ± 1543 | 764 ab ± 55.4 | 5.23 ab ± 0.37 | 270 ab ± 29.8 | 4256 a ± 248 |
| 3c | 695 bc ± 48.4 | 14,886 abcd ± 1563 | 761 ab ± 46.3 | 5.65 a ± 0.59 | 292 a ± 16.6 | 4547 a ± 306 |
| II crop | ||||||
| Control | 242 f ± 26.2 | 9005 d ± 413 | 365 d ± 27.8 | 2.47 c ± 0.19 | 138 e ± 9.89 | 836 d ± 87.9 |
| 1a | 743 d ± 75.3 | 10,511 d ± 1181 | 379 d ± 32.7 | 3.90 b ± 0.44 | 266 c ± 19.6 | 806 d ± 47.0 |
| 1b | 658 de ± 67.5 | 21,406 b ± 1394 | 677 b ± 45.5 | 4.33 b ± 0.43 | 263 cd ± 19.3 | 1335 cd ± 86.5 |
| 1c | 1335 b ± 121 | 28,030 a ± 2860 | 930 a ± 88.3 | 5.67 a ± 0.33 | 530 a ± 59.9 | 1634 cd ± 135 |
| 2a | 446 ef ± 28.1 | 10,602 d ± 1092 | 500 cd ± 65.9 | 2.55 c ± 0.16 | 191de ± 16.2 | 1749 c ± 126 |
| 2b | 480 ef ± 24.4 | 10,463 d ± 718 | 610 bc ± 44.9 | 2.44 c ± 0.25 | 166 e ± 9.89 | 3912 ab ± 458 |
| 2c | 1566 a ± 82.6 | 15,513 c ± 1322 | 689 b ± 48.4 | 2.95 c ± 0.25 | 377 b ± 21.3 | 4608 a ± 444 |
| 3a | 263 f ± 16.8 | 9121 d ± 526 | 504 cd ± 55.8 | 2.56 c ± 0.11 | 193de ± 22.0 | 3579 b ± 356 |
| 3b | 515 de ± 36.3 | 10,962 d ± 932 | 579 bc ± 58.8 | 2.66 c ± 0.17 | 149 e ± 8.38 | 3872 ab ± 333 |
| 3c | 1008 c ± 84.3 | 10,159 d ± 1059 | 556 bc ± 59.4 | 2.98 c ± 0.27 | 156 e ± 8.36 | 4337 ab ± 282 |
| Experimental System | Ca | K | Mg | Mn | Na | S |
|---|---|---|---|---|---|---|
| I Crop | ||||||
| Control | 538 d ± 42.7 | 16,265 de ± 1393 | 637 de ± 36.4 | 1.97 e ± 0.20 | 90.2 ef ± 7.68 | 576 e ± 64.4 |
| 1a | 611 cd ± 43.7 | 19,985 cd ± 2104 | 839 cd ± 80.8 | 2.29 cde ± 0.18 | 117 de ± 12.7 | 421 e ± 12.5 |
| 1b | 535 d ± 34.1 | 17,887 cd ± 1010 | 860 c ± 97.2 | 2.36 cde ± 0.14 | 96.0 def ± 4.42 | 444 e ± 21.8 |
| 1c | 623 cd ± 46.1 | 19,765 cd ± 2124 | 946 bc ± 70.5 | 2.45 cde ± 0.18 | 160 bc ± 16.8 | 365 e ± 35.4 |
| 2a | 758 c ± 78.3 | 15,467 de ± 1018 | 737 cde ± 47.1 | 2.35 cde ± 0.21 | 62.5 f ± 7.26 | 1480 d ± 14.4 |
| 2b | 973 ab ± 54.6 | 16,417 de ± 1701 | 800 cd ± 52.2 | 2.14 de ± 0.16 | 160 bc ± 18.2 | 4183 a ± 475 |
| 2c | 1115 a ± 100 | 31,057 a ± 2077 | 556e ± 45.0 | 2.29 cde ± 0.23 | 194 ab ± 21.0 | 3896 ab ± 407 |
| 3a | 778 bc ± 40.7 | 11,529 e ± 1221 | 1127 ab ± 83.8 | 2.81 bc ± 0.27 | 136 cd ± 11.2 | 4515 a ± 428 |
| 3b | 967 ab ± 87.7 | 21,747 bc ± 1420 | 1162 ab ± 123 | 3.19 ab ± 0.20 | 190 ab ± 17.9 | 2053 c ± 136 |
| 3c | 1011 a ± 107 | 26,084 b ± 2348 | 1268 a ± 84.0 | 3.74 a ± 0.18 | 205 a ± 16.3 | 3225 b ± 211 |
| II crop | ||||||
| Control | 583 c ± 41.3 | 14,685 c ± 1423 | 557 b ± 63.7 | 1.85 d ± 0.28 | 158 e ± 10.9 | 402 e ± 26.6 |
| 1a | 707 b ± 60.9 | 15,000 c ± 1330 | 767 ab ± 57.5 | 2.62 abcd ± 0.19 | 161 e ± 15.8 | 392 e ± 37.0 |
| 1b | 553 b ± 50.0 | 16,307 bc ± 1821 | 702 ab ± 60.8 | 2.17 cd ± 0.24 | 272 c ± 26.1 | 416 e ± 32.7 |
| 1c | 590 b ± 56.5 | 16,564 bc ± 1896 | 745 ab ± 71.4 | 2.38 bcd ± 0.20 | 364 a ± 27.4 | 536 de ± 33.3 |
| 2a | 953 a ± 97.3 | 21,206 ab ± 1520 | 821 a ± 79.7 | 2.36 bcd ± 0.25 | 193 de ± 11.1 | 659 cd ± 56.7 |
| 2b | 942 a ± 79.9 | 21,217 ab ± 1402 | 825 a ± 80.4 | 2.06 d ± 0.21 | 344 ab ± 29.8 | 685 cd ± 49.5 |
| 2c | 733 b ± 70.6 | 23,363 a ± 2673 | 838 a ± 83.5 | 2.29 bcd ± 0.24 | 304 abc ± 24.2 | 587 d ± 46.3 |
| 3a | 559 b ± 42.2 | 19,369 abc ± 1346 | 779 ab ± 86.4 | 2.79 ab ± 0.15 | 291 bc ± 30.2 | 917 ab ± 68.5 |
| 3b | 690 b ± 22.3 | 20,128 ab ± 1672 | 727 ab ± 79.4 | 3.02 a ± 0.18 | 238 cd ± 22.6 | 784 bc ± 66.3 |
| 3c | 1031 a ± 70.7 | 21,731 a ± 1833 | 593 b ± 56.3 | 2.73 abc ± 0.22 | 343 ab ± 25.6 | 1017 a ± 97.9 |
| Experimental System | Ca | K | Mg | Mn | Na | S |
|---|---|---|---|---|---|---|
| Control | 208 ef ± 15.4 | 10,675 a ± 1002 | 626 de ± 60.4 | 6.45 cd ± 0.55 | 215 e ± 20.5 | 6076 abc ± 333 |
| 1a | 367 ab ± 28.4 | 10,293 a ± 653 | 677 cde ± 73.6 | 8.89 ab ± 0.78 | 457 a ± 31.4 | 5268 c ± 505 |
| 1b | 331 bc ± 30.1 | 11,828 a ± 585 | 1074 ab ± 86.0 | 8.24 abc ± 0.71 | 372 bc ± 24.6 | 6493 abc ± 544 |
| 1c | 356 b ± 30.2 | 11,430 a ± 974 | 909 b ± 88.2 | 9.14 a ± 0.88 | 381 b ± 28.1 | 6011 abc ± 576 |
| 2a | 221 ef ± 13.0 | 11,977 a ± 900 | 849 bcd ± 82.4 | 7.14 bcd ± 0.52 | 265 de ± 18.1 | 6189 abc ± 633 |
| 2b | 202 f ± 16.8 | 12,549 a ± 824 | 1063 ab ± 75.8 | 7.46 abcd ± 0.72 | 277 de ± 24.7 | 7192 a ± 688 |
| 2c | 432 a ± 37.0 | 11,488 a ± 1244 | 1237 a ± 108 | 6.38 cd ± 0.58 | 253 de ± 23.8 | 6300 abc ± 375 |
| 3a | 257 def ± 18.9 | 11,586 a ± 991 | 559 e ± 40.9 | 6.40 cd ± 0.57 | 373 bc ± 21.1 | 5949 abc ± 462 |
| 3b | 273 cde ± 23.0 | 10,932 a ± 930 | 863 bc ± 75.3 | 6.18 d ± 0.67 | 364 bc ± 23.0 | 6967 ab ± 396 |
| 3c | 314 bcd ± 26.8 | 10,012 a ± 592 | 871 bc ± 68.4 | 6.15 d ± 0.54 | 305 cd ± 25.5 | 5655 bc ± 429 |
| Experimental System | Control | 1a | 1b | 1c | 2a | 2b | 2c | 3a | 3b | 3c | p-Value (S × C) |
|---|---|---|---|---|---|---|---|---|---|---|---|
| P. ostreatus | |||||||||||
| gallic | 42.0 b ± 3.03 | 82.0 a ± 3.04 | 2.22 g ± 0.08 | 2.05 g ± 0.15 | 3.21 fg ± 0.32 | 31.8 c ± 0.79 | 22.1 d ± 1.18 | 7.41 ef ± 0.34 | 9.33 e ± 0.31 | 23.2 d ± 2.23 | 0.000 |
| 2,5-dihydroxybenzoic | 12.4 a ± 1.34 | bDL | bDL | bDL | bDL | 9.19 b ± 0.54 | 2.23 c ± 0.13 | 0.910 d ± 0.08 | 10.1 b ± 0.39 | bDL | 0.000 |
| 4-hydroxybenzoic | 75.3 b ± 3.57 | 108 a ± 6.36 | 6.68 ef ± 0.42 | 2.71 f ± 0.5 | 7.26 ef ± 0.28 | 59.9 c ± 1.29 | 22.5 d ± 1.91 | 5.39 ef ± 0.45 | 11.8 e ± 1.76 | 22.0 d ± 2.26 | 0.000 |
| vanillic | 21.0 b ± 2.24 | 43.3 a ± 2.37 | 5.55 de ± 0.28 | 4.43 de ± 0.26 | 5.49 de ± 0.24 | 7.87 cd ± 0.30 | 11.1 c ± 2.01 | 3.25 e ± 0.17 | 11.4 c ± 2.48 | 11.5 c ± 0.70 | 0.000 |
| caffeic | 0.700 b ± 0.03 | bDL | 0.280 c ± 0.02 | bDL | bDL | 1.59 a ± 0.12 | bDL | 0.600 b ± 0.02 | bDL | 0.220 c ± 0.03 | 0.000 |
| syringic | 12.6b ± 1.89 | 44.8 a ± 2.18 | 0.270 e ± 0.23 | 0.31 e ± 0.02 | 0.57 de ± 0.05 | 6.37 c ± 0.34 | 3.24 d ± 0.30 | 1.33 de ± 0.17 | 1.11 de ± 0.18 | 5.98 c ± 0.018 | 0.000 |
| p-coumaric | bDL | 2.61 a ± 0.17 | 0.850 b ± 0.07 | 0.14 e ± 0.02 | bDL | 0.31 cd ± 0.02 | 0.40 c ± 0.02 | 0.21 d ± 0.02 | 0.160 de ± 0.02 | 0.680 b ± 0.05 | 0.000 |
| chlorogenic | 1.37 b ± 0.15 | 8.66 a ± 0.42 | bDL | bDL | 0.20 b ± 0.02 | 1.55 b ± 0.12 | 0.60 b ± 0.03 | 1.21 b ± 1.60 | 0.230 b ± 0.04 | 1.93 b ± 2.56 | 0.000 |
| ferulic | 0.470 c ± 0.06 | 2.37 a ± 0.26 | bDL | bDL | bDL | 0.20 d ± 0.01 | bDL | 0.590 c ± 0.02 | 0.470 c ± 0.02 | 0.92 b ± 0.03 | 0.000 |
| sinapic | 27.8 a ± 2.13 | 3.79 b ± 0.27 | 0.250 c ± 0.01 | 0.22 c ± 0.02 | 0.50 c ± 0.64 | 0.46 c ± 0.03 | 0.25 c ± 0.03 | 0.12 c ± 0.03 | 0.200 c ±0.08 | 0.160 c ± 0.01 | 0.000 |
| sum of acids | 194b ± 13.51 | 295 a ± 9.69 | 16.1 f ± 0.69 | 9.75 f ± 0.60 | 17.2 f ± 0.90 | 119 c ± 1.61 | 62.6 d ± 2.07 | 21.0 f ± 1.61 | 44.8 e ± 1.34 | 66.7 d ± 7.31 | 0.000 |
| P. eryngii | |||||||||||
| gallic | 6.99c ± 0.20 | 14.3 a ± 1.10 | 1.57 e ± 0.18 | bDL | 8.33 b ± 0.38 | 3.12 d ± 0.13 | bDL | 6.48 c ± 0.33 | 3.39 d ± 0.42 | 0.780 ef ± 0.03 | 0.000 |
| vanillic | 10.0c ± 0.90 | 8.17 d ± 0.13 | 0.590 f ± 0.02 | bDL | 23.8 a ± 0.73 | 11.5 c ± 0.92 | 18.4 b ± 1.09 | 4.57 e ± 0.38 | 4.56 e ± 0.18 | 0.580 f ± 0.03 | 0.000 |
| caffeic | 0.16 d ± 0.05 | 0.290 d ± 0.08 | bDL | bDL | bDL | 1.07 b ± 0.04 | 1.47 a ± 0.08 | 0.390 c ± 0.02 | bDL | bDL | 0.000 |
| syringic | 2.14 b ± 0.77 | 2.07 b ± 0.10 | 0.880 d ± 0.04 | bDL | 2.80 a ± 0.16 | 0.800 d ± 0.07 | 0.940 d ± 0.06 | 1.24 c ± 0.13 | bDL | bDL | 0.000 |
| p-coumaric | 0.450 c ± 0.05 | 0.260 e ± 0.02 | 0.810 a ± 0.02 | bDL | 0.570 b ± 0.03 | 0.180 e ± 0.02 | 0.340 d ± 0.02 | bDL | bDL | bDL | 0.000 |
| chlorogenic | 0.780 a ± 0.05 | 0.630 bc ± 0.04 | 0.540 d ± 0.02 | bDL | 0.680 ab ± 0.02 | 0.720 ab ± 0.07 | 0.660 b ± 0.04 | 0.160 e ± 0.02 | bDL | bDL | 0.000 |
| ferulic | 0.770 a ± 0.03 | 0.650 b ± 0.02 | 0.140 d ± 0.02 | bDL | 0.450 c ± 0.04 | 0.120 d ± 0.04 | 0.150 d ± 0.02 | 0.120 d ± 0.01 | bDL | bDL | 0.000 |
| sinapic | 0.570 a ± 0.06 | 0.190 c ± 0.02 | bDL | bDL | 0.240 c ± 0.00 | 0.310 b ± 0.02 | bDL | 0.210 c ± 0.01 | bDL | bDL | 0.000 |
| sum of acids | 21.9 c ± 0.63 | 26.6 b ± 1.01 | 4.53 g ± 0.12 | bDL | 36.9 a ± 0.97 | 17.9 d ± 0.93 | 22.0 c ± 1.17 | 13.2 e ± 0.67 | 7.95 f ± 0.46 | 1.36 d ± 0.05 | 0.000 |
| P. nameko | |||||||||||
| gallic | 12.8 a ± 0.65 | 4.74 b ± 0.26 | 1.91 d ± 0.23 | 2.63 c ± 0.21 | bDL | bDL | bDL | bDL | bDL | bDL | 0.000 |
| 4-hydroxybenzoic | bDL | 2.79 c ± 0.61 | 9.09 a ± 0.20 | 3.73 b ± 0.23 | bDL | bDL | bDL | bDL | bDL | bDL | 0.000 |
| t-cinnamic | 6.69 a ± 0.61 | 1.51 c ± 0.06 | 0.220 f ± 0.05 | 0.890 de ± 0.02 | 3.97 b ± 0.16 | 2.44 ef ± 0.02 | 0.610 ef ± 0.02 | 1.82 c ± 0.18 | 0.590 ef ± 0.03 | 1.33 cd ± 0.33 | 0.000 |
| sum | 19.5 a ± 1.06 | 9.03 bc ± 3.85 | 11.2 b ± 0.47 | 7.26 cd ± 0.16 | 3.97 de ± 0.16 | 0.240 f ± 0.02 | 0.610 ef ± 0.02 | 1.83 ef ± 0.18 | 0.580 ef ± 0.03 | 1.33 ef ± 0.33 | 0.004 |
| Experimental System | Control | 1a | 1b | 1c | 2a | 2b | 2c | 3a | 3b | 3c |
|---|---|---|---|---|---|---|---|---|---|---|
| P. ostreatus | ||||||||||
| oxalic | bDL | 3.74 a ± 0.13 | 0.140 f ± 0.01 | 0.170 ef ± 0.01 | 0.460 d ± 0.02 | 2.32 b ± 0.08 | bDL | 1.29 c ± 0.05 | 0.350 de ± 0.01 | bDL |
| quinic | 16.7 a ± 2.59 | bDL | bDL | bDL | bDL | bDL | bDL | bDL | bDL | bDL |
| malic | 0.630 de ± 0.02 | 1.44 d ± 0.05 | bDL | bDL | bDL | 0.870 de ± 0.03 | 19.6 a ± 0.69 | 8.11 c ± 0.28 | 17.6 b ± 1.61 | |
| malonic | 1.89c ± 0.07 | 3.84 a ± 0.14 | 0.400 f ± 0.01 | 0.160 g ± 0.01 | 0.270 fg ± 0.01 | 3.11 b ± 0.11 | 1.26 d ± 0.04 | 1.90 c ± 0.07 | 0.860 e ± 0.03 | 0.110 g ± 0.01 |
| lactic | bDL | bDL | bDL | bDL | bDL | bDL | 0.010 a ± 0.01 | bDL | bDL | bDL |
| citic | bDL | bDL | 0.630 b ± 0.02 | 0.700 a ± 0.02 | bDL | bDL | bDL | bDL | bDL | bDL |
| acetic | 45.5 a ± 1.60 | 40.8 b ± 1.43 | 4.97 ef ± 0.17 | 2.74 f ± 0.10 | 9.07 e ± 0.32 | 43.4 ab ± 1.53 | 46.2 a ± 1.63 | 21.0 d ± 0.74 | 31.0 c ± 1.09 | 47.3 a ± 1.67 |
| fumaric | 0.250 b ± 0.01 | 0.230 c ± 0.01 | bDL | 4.38×10⁻⁴ e ± 1×10⁻⁶ | bDL | 0.200 d ± 0.01 | 0.320 a ± 0.04 | bDL | bDL | bDL |
| succinic | bDL | 0.790 c ± 0.03 | bDL | bDL | 0.170 d ± 0.01 | bDL | bDL | bDL | 6.45 b ± 0.23 | 8.63 a ± 0.30 |
| sum | 64.9 b ± 2.28 | 50.8 c ± 1.79 | 6.15 ef ± 0.22 | 3.78 f ± 0.13 | 9.96 e ± 0.35 | 49.9 c ± 1.75 | 67.4 b ± 2.37 | 24.2 d ± 1.85 | 46.7 c ± 1.64 | 73.8 a ± 2.59 |
| P.eryngii | ||||||||||
| oxalic | 0.160 gh ± 0.01 | 1.28 c ± 0.04 | 0.230 g ± 0.01 | bDL | 2.80 a ± 0.09 | 1.93 b ± 0.07 | 0.650 e ± 0.02 | 0.930 d ± 0.03 | 0.500 f ± 0.01 | 0.070 hi ± 0.01 |
| quinic | bDL | bDL | bDL | bDL | bDL | bDL | bDL | bDL | bDL | bDL |
| malic | 10.7 a ± 1.37 | 0.520 e ± 0.02 | bDL | bDL | bDL | 5.32 b ± 0.48 | 2.28 d ± 0.08 | 4.36 c ± 0.35 | 0.580 e ± 0.02 | 0.900 e ± 0.03 |
| malonic | 0.730 e ± 0.02 | 2.28 a ± 0.09 | 0.130 h ± 0.01 | bDL | 0.120 h ± 0.01 | 2.13 b ± 0.07 | 1.21 c ± 0.04 | 0.500 f ± 0.01 | 0.900 d ± 0.03 | 0.330 g ± 0.01 |
| lactic | bDL | bDL | bDL | bDL | bDL | bDL | bDL | bDL | bDL | bDL |
| citric | bDL | bDL | 3.18 a ± 0.11 | bDL | bDL | bDL | bDL | bDL | 2.69 b ± 0.09 | bDL |
| acetic | 23.7 c ± 1.83 | 29.3 b ± 1.03 | bDL | bDL | 32.8 a ± 1.15 | 25.9 c ± 0.91 | 15.6 d ± 0.55 | 33.6 a ± 1.18 | 1.59 e ± 0.06 | 1.72e ± 0.06 |
| fumaric | bDL | bDL | bDL | bDL | bDL | bDL | bDL | bDL | bDL | bDL |
| succinic | bDL | bDL | bDL | bDL | bDL | bDL | bDL | bDL | bDL | bDL |
| sum | 35.3 b ± 1.24 | 33.4 b ± 1.17 | 3.55 d ± 0.12 | bDL | 35.7 b ± 1.26 | 35.2 b ± 1.24 | 19.8 c ± 0.70 | 39.4 a ± 1.39 | 6.20 d ± 0.22 | 3.03 de ± 0.11 |
| P. nameko | ||||||||||
| oxalic | 1.16 a ± 0.04 | 0.050 b ± 0.01 | 0.070 b ± 0.01 | 0.070 b ± 0.01 | bDL | bDL | bDL | bDL | bDL | bDL |
| quinic | bDL | bDL | bDL | bDL | bDL | bDL | bDL | bDL | bDL | bDL |
| malic | bDL | 0.530 b ± 0.02 | 1.16 a ± 0.04 | 1.19 a ± 0.04 | bDL | bDL | bDL | bDL | bDL | 0.260 c ± 0.01 |
| malonic | 0.840 a ± 0.03 | 0.110 b ± 0.01 | 0.130 b ± 0.01 | 0.140 b ± 0.01 | bDL | bDL | bDL | bDL | bDL | bDL |
| lactic | bDL | bDL | bDL | bDL | bDL | bDL | bDL | bDL | bDL | bDL |
| cirtic | 2.42 a ± 0.08 | 0.170 b ± 0.01 | bDL | bDL | bDL | bDL | bDL | bDL | bDL | bDL |
| acetic | 11.7 a ± 0.42 | 0.350 c ± 0.01 | 2.29 b ± 0.08 | 2.19 b ± 0.07 | bDL | bDL | bDL | bDL | bDL | 0.160 c ± 0.01 |
| fumaric | 0.11 a ± 3.99×10⁻³ | bDL | bDL | 0.040 b ± 1.30×10⁻³ | bDL | bDL | bDL | bDL | bDL | bDL |
| succinic | bDL | bDL | bDL | bDL | bDL | bDL | bDL | bDL | bDL | bDL |
| sum | 16.3 a ± 1.57 | 1.22 c ± 1.04 | 3.64 b ± 0.12 | 3.63 b ± 0.12 | bDL | bDL | bDL | bDL | bDL | 0.420 d ± 0.01 |
Publisher’s Note: MDPI stays neutral with regard to jurisdictional claims in published maps and institutional affiliations. |
© 2022 by the authors. Licensee MDPI, Basel, Switzerland. This article is an open access article distributed under the terms and conditions of the Creative Commons Attribution (CC BY) license (https://creativecommons.org/licenses/by/4.0/).
Share and Cite
Budzyńska, S.; Siwulski, M.; Gąsecka, M.; Magdziak, Z.; Kalač, P.; Niedzielski, P.; Mleczek, M. Biofortification of Three Cultivated Mushroom Species with Three Iron Salts—Potential for a New Iron-Rich Superfood. Molecules 2022, 27, 2328. https://doi.org/10.3390/molecules27072328
Budzyńska S, Siwulski M, Gąsecka M, Magdziak Z, Kalač P, Niedzielski P, Mleczek M. Biofortification of Three Cultivated Mushroom Species with Three Iron Salts—Potential for a New Iron-Rich Superfood. Molecules. 2022; 27(7):2328. https://doi.org/10.3390/molecules27072328
Chicago/Turabian StyleBudzyńska, Sylwia, Marek Siwulski, Monika Gąsecka, Zuzanna Magdziak, Pavel Kalač, Przemysław Niedzielski, and Mirosław Mleczek. 2022. "Biofortification of Three Cultivated Mushroom Species with Three Iron Salts—Potential for a New Iron-Rich Superfood" Molecules 27, no. 7: 2328. https://doi.org/10.3390/molecules27072328
APA StyleBudzyńska, S., Siwulski, M., Gąsecka, M., Magdziak, Z., Kalač, P., Niedzielski, P., & Mleczek, M. (2022). Biofortification of Three Cultivated Mushroom Species with Three Iron Salts—Potential for a New Iron-Rich Superfood. Molecules, 27(7), 2328. https://doi.org/10.3390/molecules27072328