Article

Synchronous Extraction, Antioxidant Activity Evaluation, and Composition Analysis of Carbohydrates and Polyphenols Present in Artichoke Bud

1
College of Pharmacy, Shandong University of Traditional Chinese Medicine, Jinan 250355, China
2
School of Pharmaceutical Engineering, Shenyang Pharmaceutical University, Shenyang 110016, China
*
Author to whom correspondence should be addressed.
These authors contributed equally to this work.
Molecules 2022, 27(24), 8962; https://doi.org/10.3390/molecules27248962
Submission received: 20 November 2022 / Revised: 12 December 2022 / Accepted: 14 December 2022 / Published: 16 December 2022

Abstract

:
This study investigated the optimization of ultrasonic-assisted aqueous two-phase synchronous extraction of carbohydrates and polyphenols present in artichoke bud, evaluated their antioxidant activities in vitro, and analyzed the composition of carbohydrates and polyphenols by high-performance liquid chromatography (HPLC). The powder mass, ultrasonic time, ammonium sulfate concentration, and alcohol–water ratio were considered the influencing factors based on the single-factor experiment results, and a dual-response surface model was designed to optimize the synchronous extraction process to extract carbohydrates and polyphenols. The antioxidant activity was evaluated by measuring the scavenging capacity of ABTS+· and DPPH· and the reducing capacity of Fe3+. The optimal process conditions in this study were as follows: the powder mass of 1.4 g, ammonium sulfate concentration of 0.34 g/mL, alcohol–water ratio of 0.4, and ultrasonic time of 43 min. The polyphenol content in artichoke bud was 5.32 ± 0.13 mg/g, and the polysaccharide content was 74.78 ± 0.11 mg/g. An experiment on in vitro antioxidant activity showed that both carbohydrates and polyphenols had strong antioxidant activities, and the antioxidant activity of polyphenols was stronger than that of carbohydrates. The HPLC analysis revealed that the carbohydrates in artichoke bud were mannose, rhamnose, glucuronic acid, galacturonic acid, glucose, galactose, and arabinose, and the molar ratio was 10.77:25.22:2.37:15.74:125.39:48.62:34.70. The polyphenols comprised chlorogenic acid, 4-dicaffeoylquinic acid, caffeic acid, 1,3-dicaffeoylqunic acid, isochlorogenic acid B, isochlorogenic acid A, cynarin, and isochlorogenic acid C, and the contents were 0.503, 0.029, 0.022, 0.017, 0.008, 0.162, 1.621, 0.030 mg/g, respectively. This study also showed that the carbohydrates and polyphenols in artichoke bud could be important natural antioxidants, and the composition analysis of HPLC provided directions for their future research. Carbohydrates and polyphenols in artichoke buds can be separated and enriched using the optimized process technology, and it is an effective means of extracting ingredients from plants.

1. Introduction

Artichoke (Cynara scolymus L.), also known as chrysanthemum thistle, vegetable thistle, and so forth, is a perennial herb of the genus Cynara of the family Asteraceae [1]. This herb is native to the western and central Mediterranean regions [2] and is also cultivated in the Shanghai, Yunnan, and Zhejiang provinces of China. Nowadays, artichoke is widely used in pharmaceutical [3], food [4], and other industries. Modern pharmacological studies have shown that artichoke and its chemical components have various biological activities, such as antioxidant, antibacterial, antitumor, hepatoprotective, and cholesterol-lowering activities [1,5,6,7,8]. Artichoke not only has significant health benefits, it is also rich in a variety of functional components, such as flavonoids, carbohydrates, polyphenols, and terpenoids [3,9,10]. Besides its applications as a functional food and its bioactive ingredient sources, artichoke is recognized as a sustainable feedstock for biofuel production.
Reactive oxygen radicals are produced by the oxidative respiration metabolism of cells and have high reactivity because their outermost orbitals have unpaired electrons [11,12]. The activity of antioxidant enzymes in a body gradually decreases with increasing age, resulting in an accumulation of reactive oxygen radicals produced by cellular metabolism in the body. The accumulation of reactive oxygen radicals in the body leads to lipid peroxidation reactions [13,14], which can cause cell damage or even death. The body is prone to Alzheimer’s disease, Parkinson’s disease, diabetes, arthritis, cardiovascular diseases, tumors, and other diseases [15,16,17,18,19]. The research and development of antioxidants have become significant nowadays with experts trying to find ways to reduce damage caused by the presence of excessive reactive oxygen radicals in the human body, and natural drugs are gaining attention for their excellent antioxidant properties. Carbohydrates and polyphenolic compounds are the main natural components in artichokes with significant antioxidant activity [20,21], which is why they have become a significant topic of research for their use in pharmaceuticals, functional foods, and bioactive ingredient sources.
Carbohydrates or polyphenols are mainly extracted using the traditional solvent extraction method [22,23], enzymatic method [24], microwave method [25,26], ultrasonic method [25], and so forth. Although the traditional solvent extraction method is easy to operate, it is time-consuming and has low extraction efficiency [23]; the enzymatic method affects the extraction efficiency because of the easy inactivation of enzymes [27]; and the ultrasonic method uses cavitation and mechanical and thermal effects to significantly increase the extraction efficiency of active ingredients [28]. The dual-phase aqueous system can use environmentally friendly phase-forming components, such as ethanol and inorganic salts and can be rapidly phase-formed at room temperature, depending on the different partition coefficients of different substances in the two phases, thus enabling the rapid partitioning of the extracted substances in the two phases of this system [29,30,31]. The dual-phase aqueous extraction technique compared with the conventional extraction techniques used for the simultaneous extraction of active plant ingredients can reduce the associated energy consumption and has the advantages of high extraction efficiency, mild conditions, a nontoxic and environmentally-friendly nature, and simple operation [32,33]. Considering these advantages, the ultrasonic-assisted aqueous two-phase synchronous extraction method was used to extract carbohydrates and polyphenols out of artichoke bud.
The research on the extraction of the active components of artichoke currently focuses only on optimizing the extraction process targeting a single component (polyphenols) as an index [34,35]. In the absence of a multiple indicator extraction optimization process, the extraction of other active substances in artichoke cannot be performed, limiting the efficient development and utilization of artichoke resources. In this study, an ultrasonic-assisted ethanol–ammonium sulfate aqueous two-phase system was used to synchronously extract carbohydrates and polyphenols from artichoke bud. The extraction process was optimized using a dual-response surface model, and the composition and antioxidant activity in vitro were analyzed. It provided a theoretical basis for the in-depth study of the bioactive components of artichoke and also provided scientific guidance for the comprehensive development and utilization of artichoke.

2. Results and Discussion

2.1. Effects of the Investigated Factors on the Carbohydrate and Polyphenol Contents

2.1.1. Effects of Ultrasonic Powers on the Carbohydrate and Polyphenol Contents in Artichoke Bud

When the ultrasonic power was in the range of 300–350 W, the extraction rate of carbohydrates from artichoke bud increased significantly (p < 0.05), but when the ultrasonic power continued to increase, the carbohydrates content decreased significantly (p < 0.05) (Figure S1A). Within this range, the variation in extraction trends of polyphenols and carbohydrates was roughly the same, but not as significant as that of carbohydrates. It was mainly because the cavitation effect of ultrasound could effectively dissolve carbohydrates and polyphenols present in artichoke bud, but the powerful ultrasonic power destroys the cell wall, causing the dissolved polyphenols to interact with carbohydrates to form insoluble aggregates, resulting in the reduction of content [36,37]. Taking into consideration the polyphenol and carbohydrate contents and the energy they used, 350 W was considered the fixed power.

2.1.2. Effects of Different Powder Mass on the Carbohydrate and Polyphenol Contents in Artichoke Bud

When the powder mass was in the range of 0.5–1.5 g, the carbohydrate content increased significantly (p < 0.05), but when the powder mass continued to increase, the polyphenol and carbohydrate contents always showed an overall decreasing trend (p < 0.05) (Figure S1B). It was mainly because, in the aqueous two-phase system, the volume of the upper alcohol phase was small and the volume of the lower water phase was large. When 0.5 g of powder was added, the polyphenols in the upper phase reached a saturated state of dissolution while the carbohydrates did not reach the saturated state. If the mass of the material was increased continuously, other alcohol-soluble components were dissolved and distributed in the upper phase, which affected the extraction of polyphenols, but this had no significant effect on the extraction of carbohydrates in the lower phase [38,39]. A powder mass of 1.0–2.0 g was considered the next factor for response surface optimization taking into consideration the polyphenol and carbohydrate contents.

2.1.3. Effects of Different Extraction Temperatures on Carbohydrate and Polyphenol Contents in Artichoke Bud

The polyphenol and carbohydrate contents showed an increase within the ultrasonic temperature range, and this increasing trend was not altered (p < 0.05) (Figure S1C). The study for the extraction of polyphenols and carbohydrates was conducted at 80 °C and not beyond because of the ultrasonic instrument’s maximum allowed temperature limit at 80 °C.

2.1.4. Effects of Different Ultrasonic Times on the Carbohydrate and Polyphenol Contents in Artichoke Bud

The carbohydrate and polyphenol contents showed first an increasing trend and then a decreasing trend with the increase in ultrasonic time and reached their highest levels after 40 min (Figure S1D). This was because, in the early stage of extraction, the cavitation effect of ultrasonic waves promoted the transfer of solutes, accelerated the dissolution of polyphenols and carbohydrates, and increased the content [40]. A continuous increase in the ultrasonic time after the diffusion equilibrium did not cause the dissolution of carbohydrates and polyphenols. Instead, the content was decreased because, with increased ultrasonic power, polyphenols are more easily dissolved, interacting with dissolved carbs to produce insoluble aggregates [36,37]. Therefore, 30–50 min was considered a factor for further response surface optimization.

2.1.5. Effects of Different Concentrations of Ammonium Sulfate on the Carbohydrate and Polyphenol Contents in Artichoke Bud

When the concentration of ammonium sulfate was in the range of 0.27–0.33 g/mL, the carbohydrate content increased significantly (p < 0.05), but when the mass concentration of ammonium sulfate continued to increase, the extracted carbohydrate content decreased significantly (p < 0.05) (Figure S1E). The variation in the extraction trend of both polyphenols and carbohydrates in this range was roughly the same. The main reason behind it was that the aqueous two-phase system gradually became stable with the continuous increase in the concentration of ammonium sulfate, resulting in a significant increase in the polysaccharide and polyphenol contents. A continuous increase in the concentration of ammonium sulfate increased its solubilization effect, making it easier for polyphenols to distribute in the water phase, which in turn affected the extraction of upper-phase relative polyphenols and lower-phase relative carbohydrates [41]. Hence, the concentration of ammonium sulfate between 0.30 and 0.36 g/mL was considered a factor for response surface optimization.

2.1.6. Effects of Different Alcohol–Water Ratios on the Polysaccharide and Polyphenol Contents in Artichoke Bud

When the alcohol–water ratio was between 0.2 and 0.4, the polysaccharide and polyphenol contents increased significantly (p < 0.05), but when the alcohol–water ratio continued to increase, the carbohydrates and polyphenols decreased significantly (p < 0.05) (Figure S1F). It was mainly because, with the continuous increase in the volume of ethanol, the aqueous two-phase system was gradually stabilized and the polyphenol and polysaccharide contents increased. However, when the volume of ethanol continued to increase, some other substances (such as proteins) were precipitated, which adsorbed carbohydrates and polyphenols and reduced the polysaccharide and polyphenol contents [42]. Hence, the alcohol–water ratio of 0.3–0.5 was considered a factor for response surface optimization.

2.2. Box–Behnken Response Surface Experimental Results

Based on the results of the single-factor experiment, the powder mass (A), ultrasonic time (B), ammonium sulfate concentration (C), and alcohol–water ratio (D) were considered the influencing factors for further response surface optimization, and the polyphenol content (Y1) and polysaccharide content (Y2) were examined to design a response surface experiment. The response surface factor levels are presented in Table 1, and the experimental scheme and results are provided in Table 2.
The software Design-Expert 11 was used to perform multiple regression analysis and binomial analysis using the data presented in Table 3. The multiple regression equations were: Y1 = 5.24 − 0.2067 A + 0.0933 B − 0.0608 C + 0.8308 D + 0.0325 AB − 0.3125 AC + 0.1925 AD − 0.1613 BC − 0.1137 BD + 0.3688 CD − 0.5608 A2 − 0.5071 B2 − 0.7533 C2 − 0.6558 D2; Y2 = 74.72 − 2.16 A + 1.13 B + 3.33 C − 2.82 D + 0.5938 AB + 2.12 AC + 3.00 AD − 0.6425 BC − 0.3100 BD − 2.37 CD − 7.27 A2 − 3.74 B2 − 3.22 C2 − 5.62 D2; the correlation coefficients r of Y1 and Y2 were 0.9772 and 0.9389, respectively, indicating that the independent variable could reflect the change of 97.72% polyphenol content and the change of 93.89% polysaccharide content. The absolute values of the previous coefficients showed how much each factor affected the examined value: the quadratic coefficients of the two models were negative, the parabolic opening of the three-dimensional response surface for each model was downward, and because this could reach the maximum value, we knew that the optimal process could be optimized [43,44].
The results of the analysis of variance are presented in Table 3 and Table 4. The quadratic regression model of polyphenols had strong significance (p < 0.0001), the quadratic regression model of carbohydrates also had strong significance (p < 0.05), and the lack-of-fit term was not significant (p > 0.05), indicating that the two models were well fitted [45]. AC and CD had significant effects on polyphenol content (p < 0.05), and D, A2, B2, C2, and D2 had extremely significant effects on polyphenol content (p < 0.0001) (Table 3). Hence, the effect of polyphenols content was not just an ordinary linear relationship. Table 4 shows that A2, B2, and D2 all significantly affected the carbohydrates content (p < 0.05). According to the p value, the degree of influence of each factor on Y1 was D (alcohol–water ratio) > A (powder mass) > B (ultrasonic time) > C (ammonium sulfate concentration), and the degree of influence on Y2 was C (ammonium sulfate concentration) > D (alcohol–water ratio) > A (powder mass) > B (ultrasonic time).
The plane contour map and the three-dimensional response surface map are presented in Figure 1, revealing that the interaction of factors had a significant impact on the examined value. The change in the response surface of powder mass was steeper than that of the ammonium sulfate concentration, indicating that the effect of powder mass on polyphenol content was more significant than that of ammonium sulfate concentration. The change in the response surface of the alcohol–water ratio was steeper than that of the ammonium sulfate concentration, indicating that the effect of the alcohol–water ratio on the polyphenol content was more significant than that of the ammonium sulfate concentration. The contour lines on the graph were dense and elliptical in shape, and the corresponding response surface was steep, indicating that the interaction between the powder mass, ammonium sulfate concentration, and alcohol–water ratio had a significant effect on the polyphenol content [46]. The other contour plots and the response surface plots showed that although the overall trend was higher and then lower, the contour lines were sparse, and the response surface was moderate. Hence, the corresponding two factors did not have a significant effect on them. The effect of the two factors on the response values was not significant. The results of this analysis were consistent with the results of the binomial analysis.
The polyphenol content under the optimal process using the ethanol–ammonium sulfate aqueous two-phase system as the solvent in this study compared with the optimization of the extraction process carried out in other studies was significantly higher than those of the other traditional solvents (p < 0.05) [35,47]. Furthermore, the polysaccharide content in artichoke bud was significantly higher than that of the polyphenols (p < 0.05), which was consistent with the results of Bao et al. [48].

2.3. Optimal Process Validation

The optimal process obtained by the response surface software had the powder mass of 1.397 g, ammonium sulfate concentration of 0.335 g/mL, alcohol–water ratio of 0.409, ultrasonic time of 42.60 min, polyphenol content of 5.282 mg/g, and polysaccharide content of 74.845 mg/g. According to the actual situation, the powder mass was 1.4 g, ammonium sulfate concentration was 0.34 g/mL, alcohol–water ratio was 0.4, and ultrasonic time was 43 min. The polyphenol content in artichoke bud was 5.32 ± 0.13 mg/g and the polysaccharide content was 74.78 ± 0.11 mg/g, which were close to the predicted values of the software. Hence, carbohydrates and polyphenols could be effectively taken out of artichoke bud using this improved process.

2.4. Evaluation of Antioxidant Activity In Vitro

The higher the free radical scavenging rate, the stronger the antioxidant activity of the sample against the free radicals. Figure S2A,B show that polyphenols reached a scavenging rate of 97.8% at 0.06 mg/mL, while VC at the same concentration reached a scavenging rate of 97.4%. The IC50 value of polyphenols substances was 0.01108 mg/mL, and that of standard VC was 0.01294 mg/mL. The IC50 values of polyphenols were slightly lower than VC. Therefore, the ability of polyphenols to scavenge ABTS+· was extremely strong, which was slightly stronger than that of VC. Carbohydrates reached a scavenging rate of 99.16% at 1.5 mg/mL while VC at the same concentration reached a scavenging rate of 99.86%, which meant that it had a remarkable ability to scavenge ABTS+, but it was weaker than that of VC.
The magnitude of the free radical scavenging rate can indicate the strength of the antioxidant activity of the sample against free radicals. Figure S2C,D shows that polyphenols reached a scavenging rate of 70.10% at 0.1 mg/mL while VC at the same concentration reached a scavenging rate of 39.57%. The IC50 value of polyphenols was 0.04131 mg/mL, while the IC50 value of standard VC was 0.174 mg/mL. The IC50 value of polyphenols was significantly lower than that of VC. Therefore, the ability of polyphenols to scavenge DPPH· was strong, which was stronger than that of VC. Carbohydrates reached a scavenging rate of 45.35% at 1.5 mg/mL, while VC at the same concentration reached a scavenging rate of 60.38%, which meant that it had a good ability to scavenge DPPH but it was weaker than that of VC. However, different concentrations of DPPH solutions will lead to different IC50 values and low reference-ability. Therefore, we standardized the IC50 values of substances inhibiting the DPPH clearance rate according to the methods reported in the references [49], and the standardized results showed that the standardized IC50 value of polyphenols was 24.43 ng/nmol, the standardized IC50 value of VC was 102.9 ng/nmol, and that of carbohydrates was 1544.35 ng/nmol. These results indicated that the ability of polyphenols to inhibit the DPPH radical was much greater than that of VC, while that of carbohydrates was much less than that of VC.
The level of absorbance can reflect the strength of the reducing power of the sample. The greater the absorbance, the stronger the reducing power of the sample. Figure S2E,F shows that the Fe3+-reducing power of polyphenols and carbohydrates and the dose–effect relationship of the concentration of the experimental solution were good. The absorbance of polyphenols at 0.4 mg/mL was 1.3439, while VC at the same concentration reached an absorbance value of 1.2781. The IC50 value of polyphenols was 0.06345 mg/mL, and that of standard VC was 0.06976 mg/mL. The IC50 value of polyphenols is slightly lower than that of VC. Thus, the ability to reduce Fe3+ was extremely strong, which was stronger than that of VC. The absorbance of carbohydrates at 3.5 mg/mL was 1.2672, while VC at the same concentration reached an absorbance value of 3.132. The ability of polyphenols to reduce Fe3+ was strong but weaker than that of VC.
The smaller the IC50 value of the in vitro antioxidant activity, the stronger the antioxidant activity of the substance and the weaker the antioxidant activity of the substance. Table 5 shows that the antioxidant activity of polyphenols was extremely strong, the ability to scavenge ABTS+· was the strongest, and the ability to reduce Fe3+ was the weakest. Furthermore, the antioxidant activity of carbohydrates was stronger, and the ability to scavenge ABTS+· was the strongest, with the weakest ability to scavenge DPPH. The IC50 values of various in vitro antioxidant experiments of polyphenols were lower than those of carbohydrates, indicating that the antioxidant activity of polyphenols was stronger than that of carbohydrates, which was consistent with the findings of Bao et al. [48].

2.5. Results of HPLC Analysis of Polysaccharide and Polyphenol Compositions

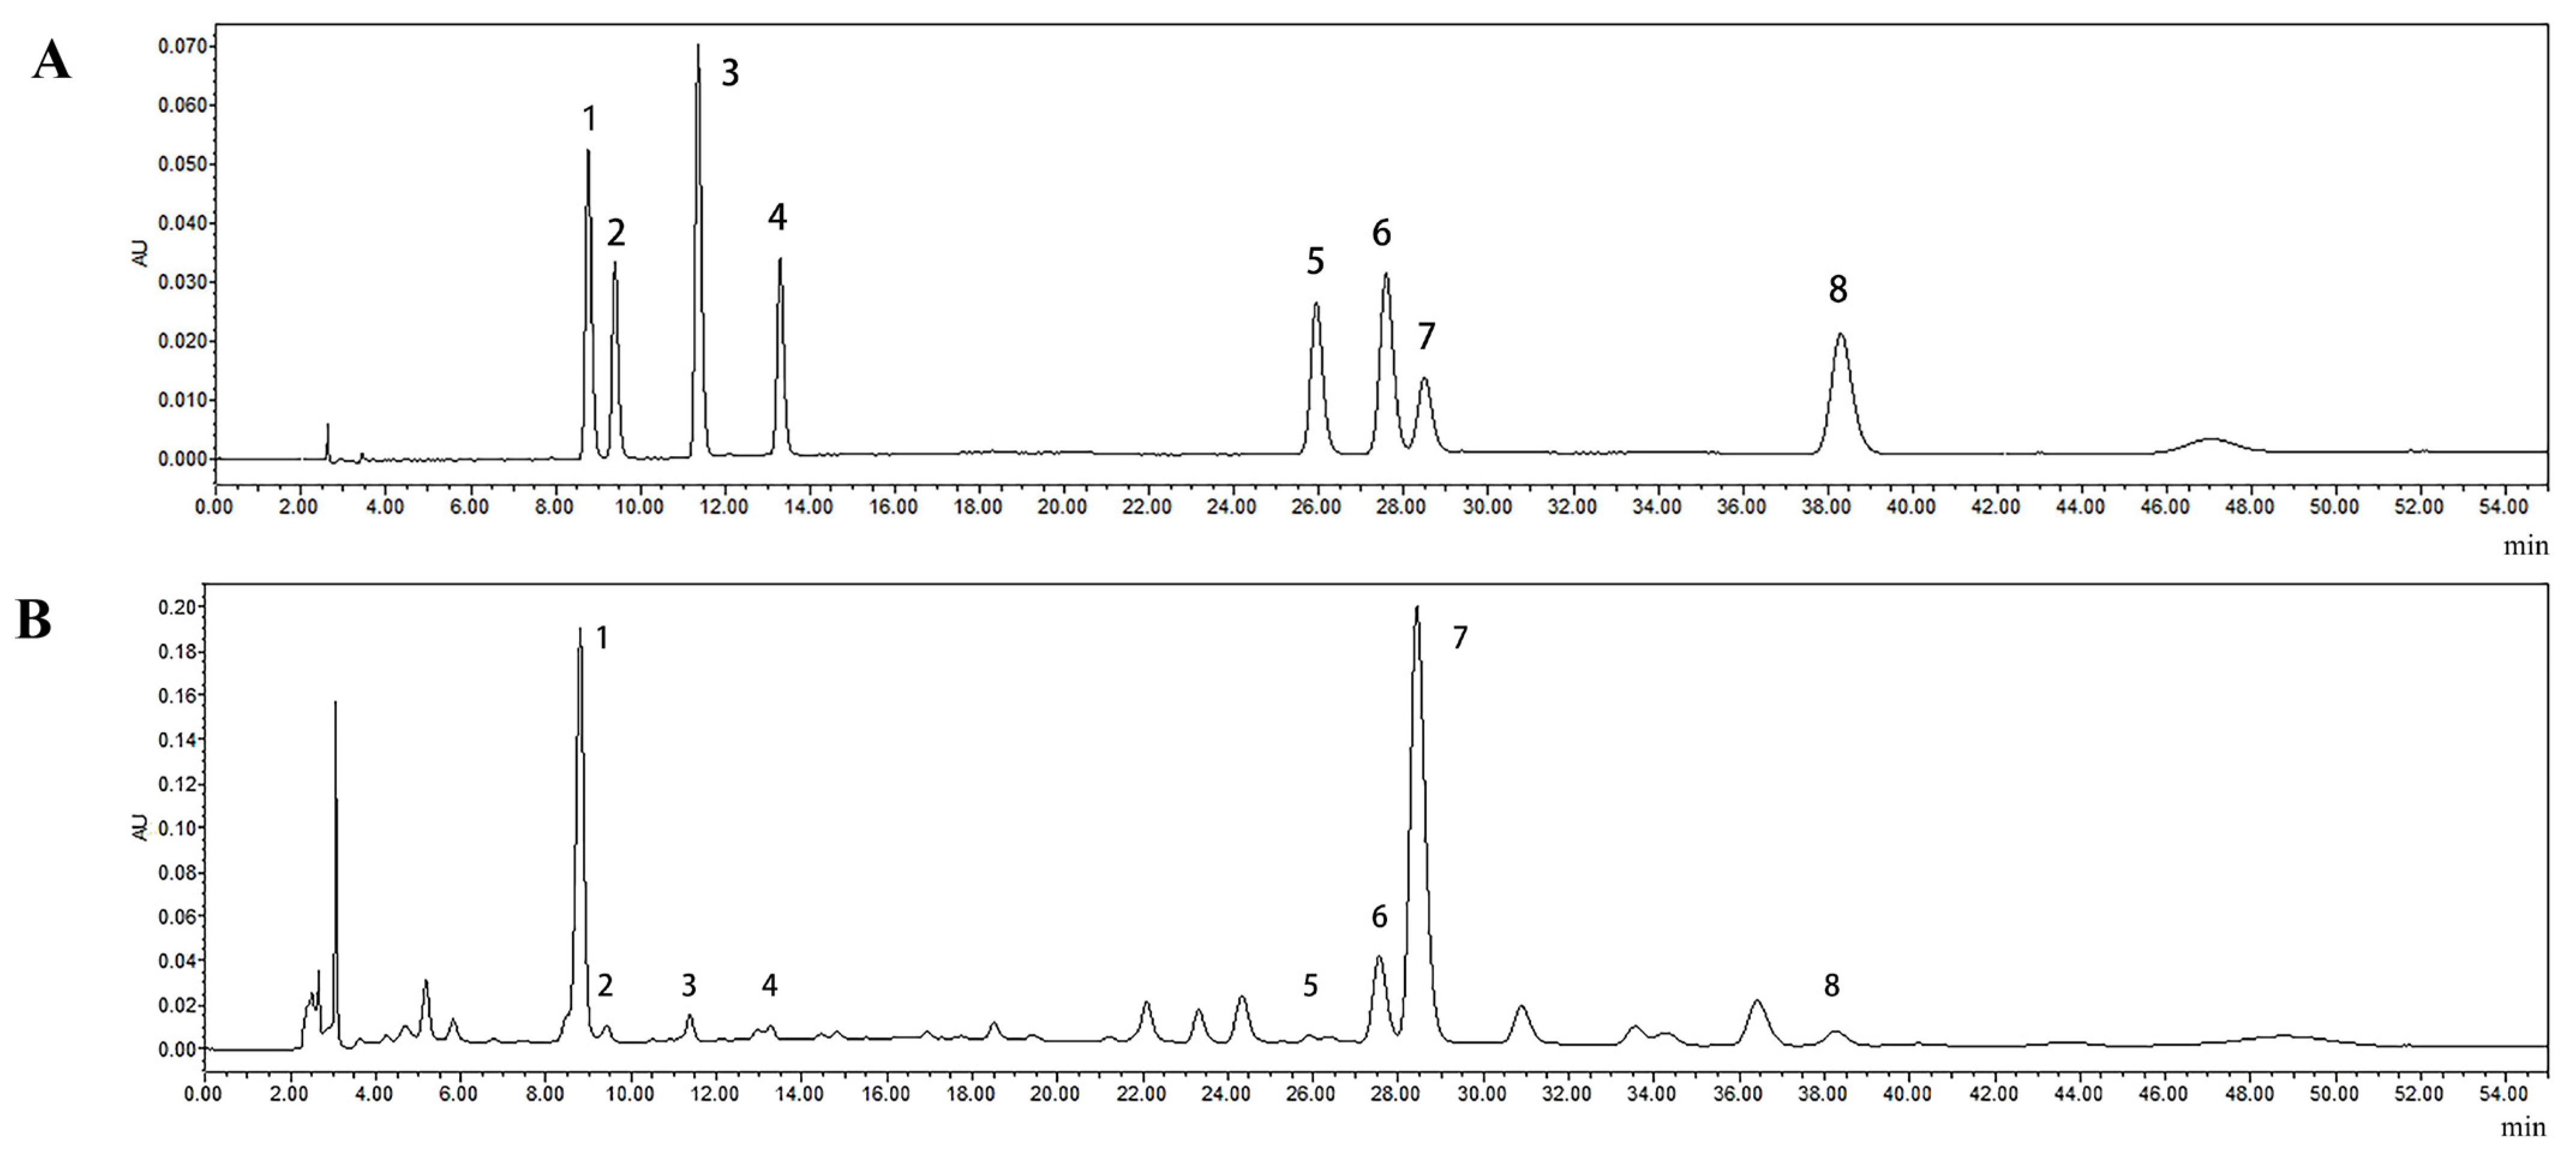
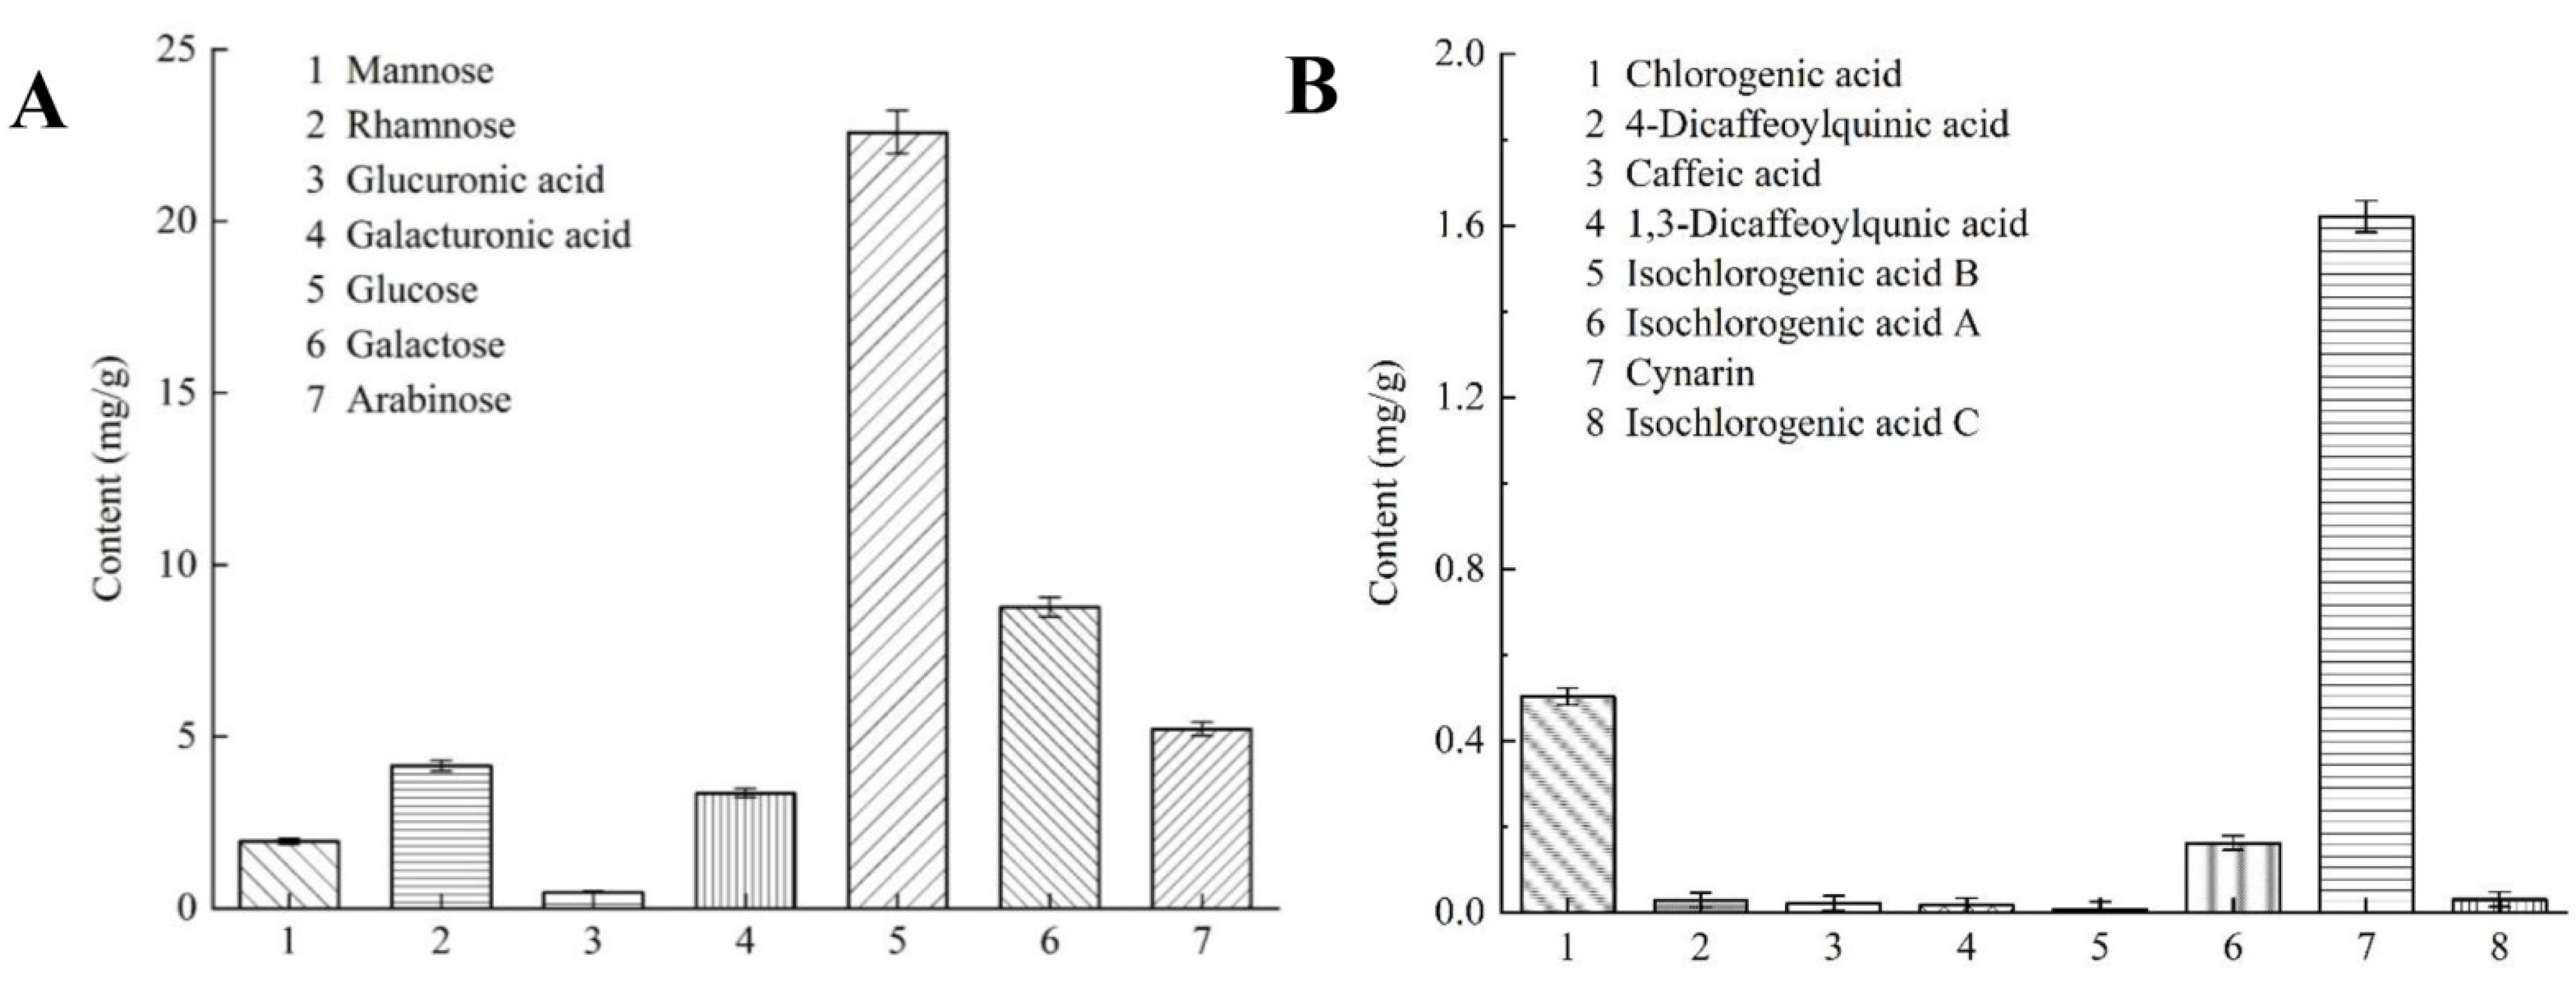
Each monosaccharide, alduronic acid, and phenolic acid standard had a good resolution in the mixed standard, and the peaks of the standard and the sample might be in one-to-one correspondence (Figure 2 and Figure 3). Figure 4A shows the different carbohydrates soluble in ammonium sulfate aqueous solution present in artichoke bud: mannose, rhamnose, glucuronic acid, galacturonic acid, glucose, galactose, and arabinose; the molar ratio was 10.77:25.22:2.37:15.74:125.39:48.62:34.70. Figure 4B shows the constituents of polyphenols present in artichoke bud: chlorogenic acid, 4-dicaffeoylquinic acid, caffeic acid, 1,3-dicaffeoylqunic acid, isochlorogenic acid B, isochlorogenic acid A, cynarin, and isochlorogenic acid C; the contents are 0.503, 0.029, 0.022, 0.017, 0.008, 0.162, 1.621, 0.030 mg/g, respectively. Compared with mass spectrometry, ultraviolet detector has poor sensitivity, so some components with low content may not be detected. With in-depth study, mass spectrometer will be applied to improve the limits of quantification.
As described in Section 2.4, polyphenols and carbohydrates in artichoke bud had strong antioxidant activity. Hence, the combinatory use of carbohydrates and polyphenols as a potential therapeutic alternative for treating relevant disorders with hyperoxidative conditions, such as aging, senescence, etc. Additionally, chlorogenic acid and cynarin were related to the antioxidant activity of artichoke polyphenols [50], but whether other components affected the antioxidant activity of polyphenols is still unknown. Although artichoke carbohydrates had strong antioxidant activity, related studies were few and the components that affected its antioxidant activity needed further exploration. In this study, the HPLC analysis was used to figure out how polyphenols and carbohydrates were made, and it gave us a reference point to learn more about their antioxidant activities.

3. Materials and Methods

3.1. Materials

Artichoke bud (originating in Yunnan) was obtained from Kunming Mingjian’an Biotechnology Co., Ltd. (Yunnan, China) and identified as dried bud of artichoke (Cynara scolymus L.) by Professor Li Jia of Shandong University of Traditional Chinese Medicine. Gallic acid (purity ≥ 98%) was purchased from Shanghai yuanye BioTechnoligy Co., Ltd. (Shanghai, China). Anhydrous Glucose (purity ≥ 99%) was obtained from Shanghai Macklin Biochemical Co., Ltd. (Shanghai, China). Folin phenol reagent, sodium carbonate, phenol, sulfuric acid, ethanol absolute, ammonium sulfate, DPPH, ABTS, potassium persulfate, potassium ferricyanide, trichloroacetic acid, iron trichloride hexahydrate, sodium dihydrogen phosphate, dibasic sodium phosphate, vitamin C (VC), trichloromethane, potassium dihydrogen phosphate, sodium hydroxide, acetic acid, 3-methyl-1-phenyl-2-pyrazolin-5-one, and trifluoroacetic acid are AR grade. Methanol and acetonitrile are HPLC grade. Mannose, Rhamnose, Glucuronic acid, Galacturonic acid, Glucose, Galactose, Arabinose, Chlorogenic acid, 4-Dicaffeoylquinic acid, Caffeic acid, Cynarin, Isochlorogenic acid B, Isochlorogenic acid A, 1,5-Dicaffeoylqunic acid, and Isochlorogenic acid C were purchased from Chengdu Must Biotech Co., LTD (Chengdu, China).

3.2. Synchronous Extraction Process

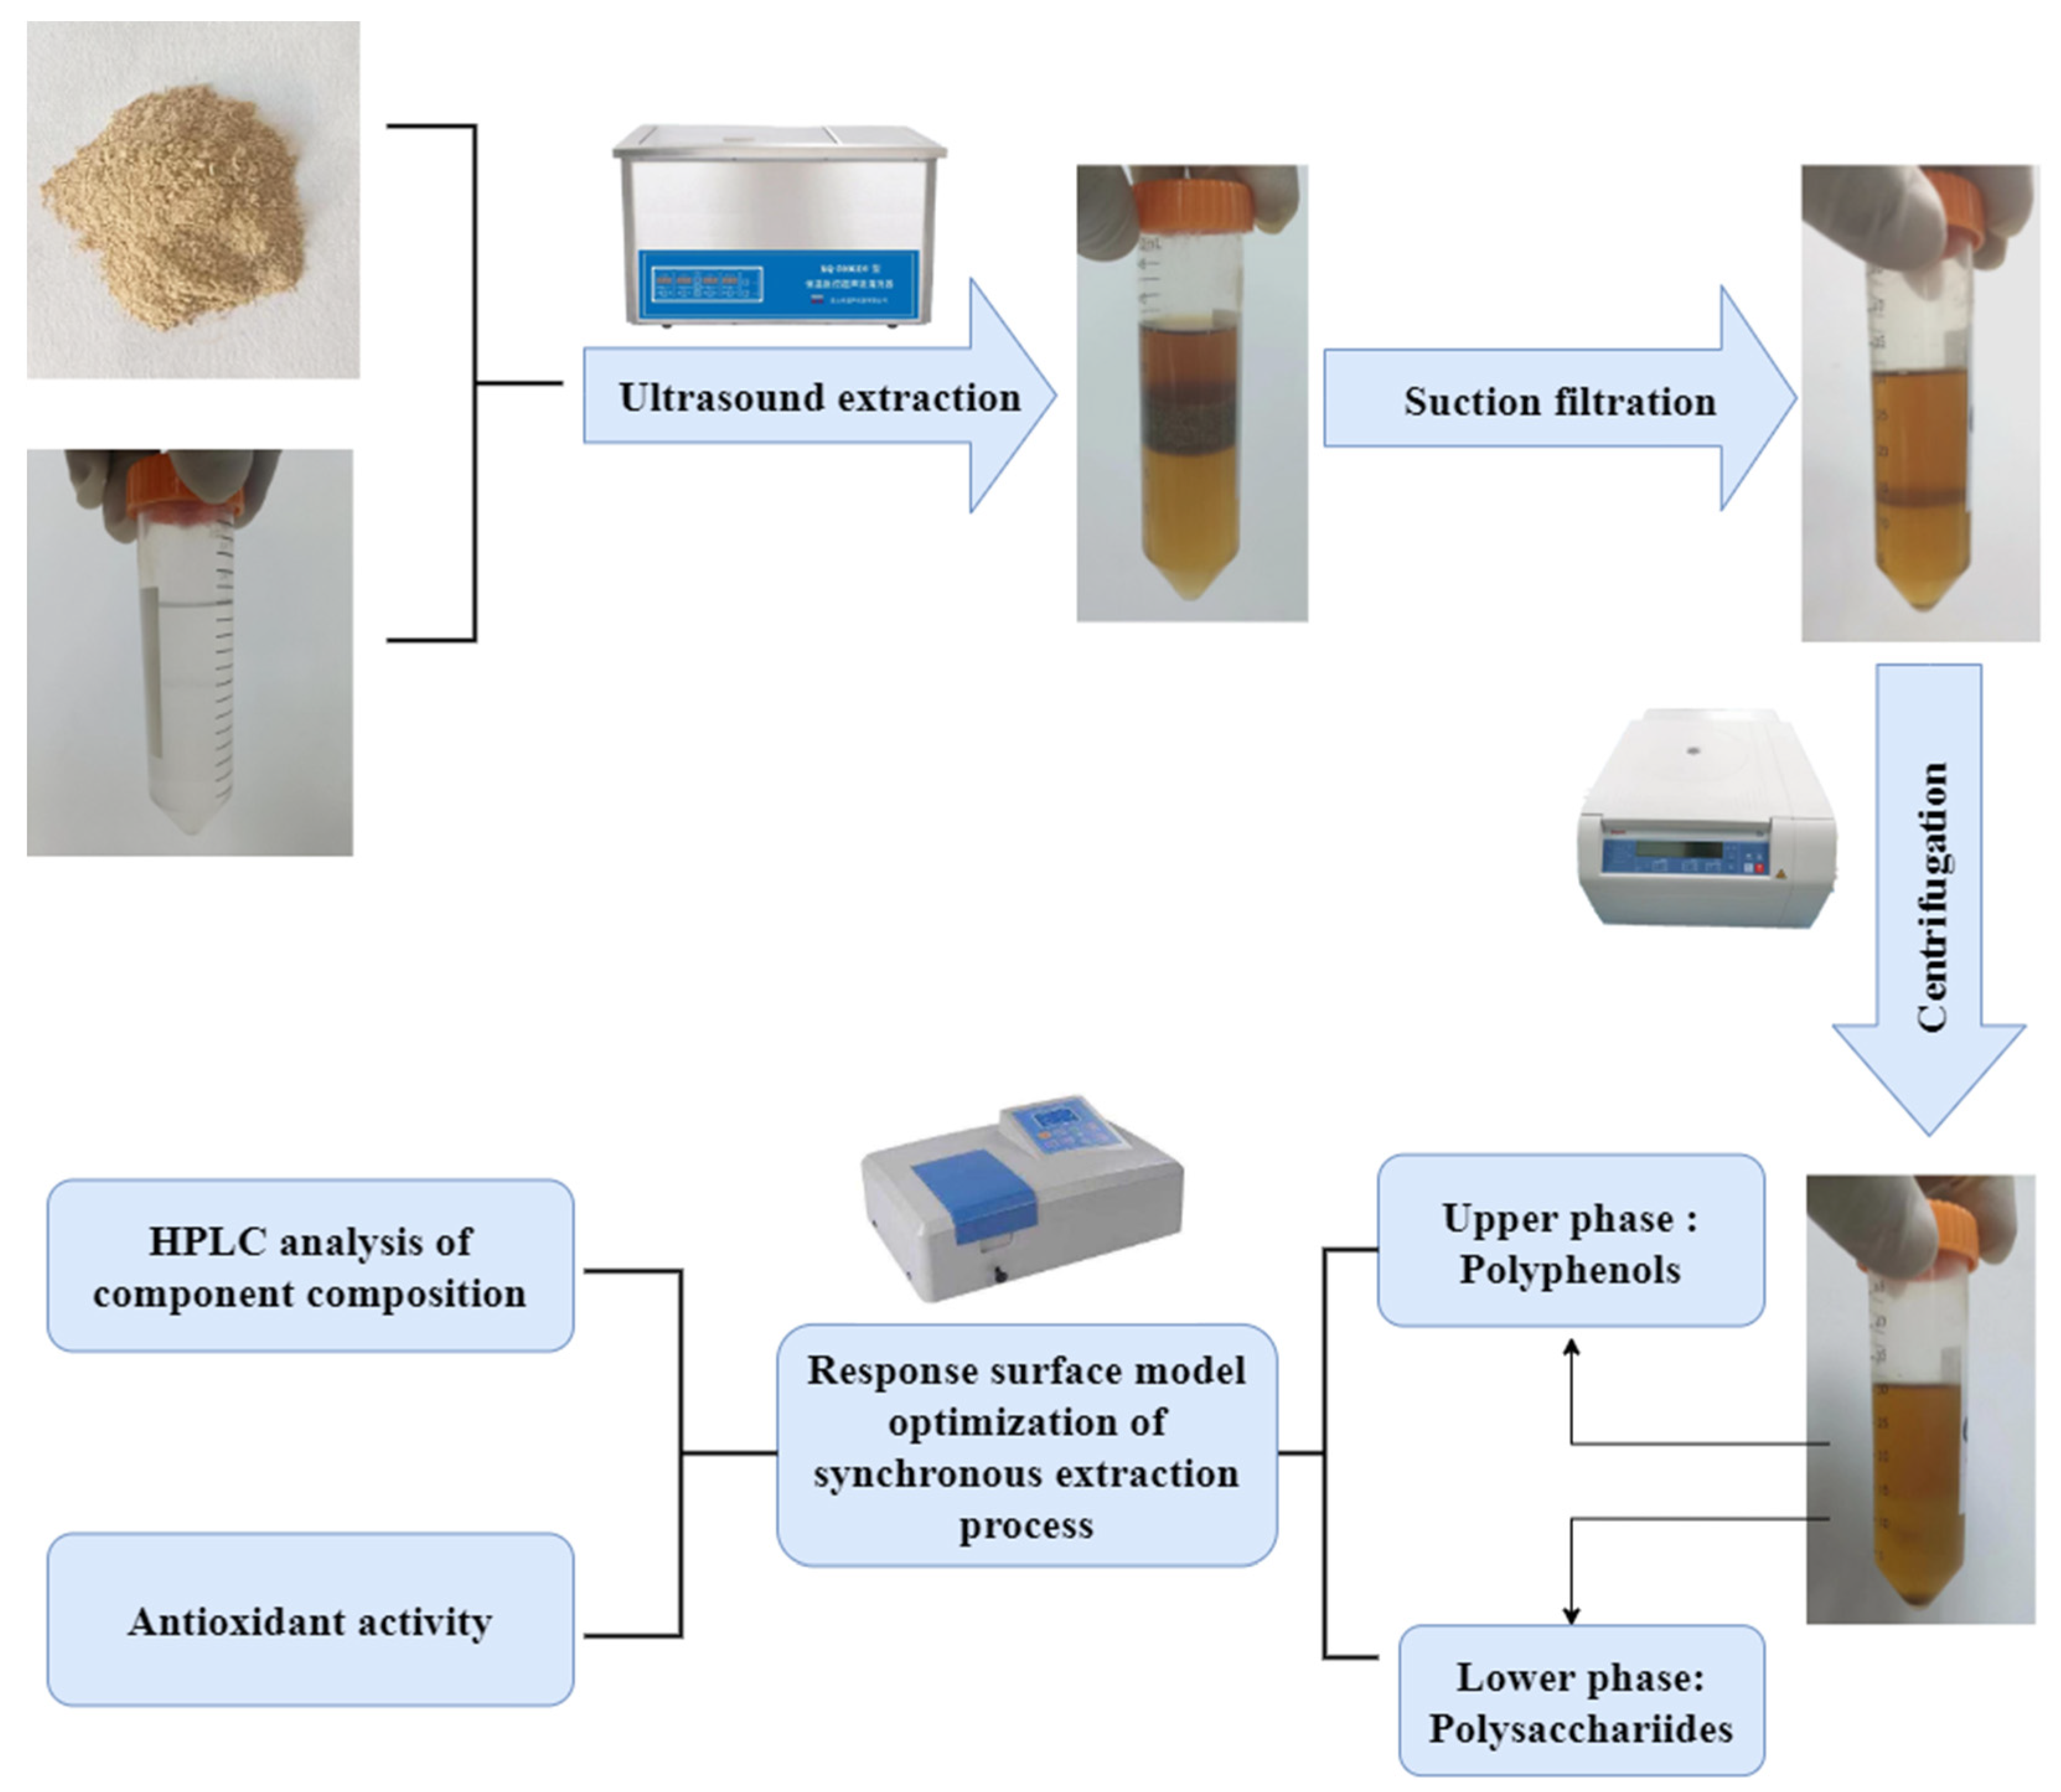
The synchronous extraction process for carbohydrates and polyphenols from artichoke bud is depicted in Figure 5. The sample solution was prepared as follows: a 50-mL centrifuge tube was filled with 1 g of artichoke bud powder. Then, a 35 mL ethanol-ammonium sulfate two-phase system was prepared by adding ammonium sulfate with a mass concentration of 0.33 g/mL and an alcohol–water ratio of 0.4. The extraction was carried out under fixed conditions of ultrasonic power of 500 W, an ultrasonic time of 30 min and an ultrasonic temperature of 60 °C in the ultrasonic cleaner. Suction filtration and centrifugation were at 7000 rpm for 10 min.

3.3. Determination of Carbohydrate Content

The phenol–sulfuric acid method was used with minor modifications to determine the carbohydrate content [51]. The precisely pipetted 1.0 mL of the lower-phase solution diluted 50 times, 1.0 mL of distilled water, and 1.0 mL of a 5% phenol solution were mixed well, making up to 8.0 mL with concentrated sulfuric acid. The mixture was then left for 10 min at room temperature, placed in a water bath at 40 °C for 15 min, and cooled at room temperature. The absorbance was measured at 490 nm, and the average value was taken in triplicate. Anhydrous glucose was used as a standard and the results were expressed as milligrams of anhydrous glucose equivalents per gram artichoke bud sample.

3.4. Determination of Polyphenol Content

The polyphenol content was determined using the Folin–Ciocalteu colorimetric method [34]. The precisely pipetted 0.5 mL of the upper-phase solution and 2.0 mL of the Folin–Ciocalteu reagent with a volume fraction of 50% were mixed well. The mixture was left at room temperature for 5 min, and 4.0 mL of 0.2 g/L Na2CO3 solution was added to the mixture, making up to 10 mL with distilled water. The mixture was kept away from light at room temperature for 2 h. The absorbance was measured at 760 nm, and the average value was taken in triplicate. Gallic acid was used as a standard and the results were expressed as milligrams of gallic acid equivalents per gram artichoke bud sample.

3.5. Single-Factor Experiment

The effects of various factors on carbohydrates and polyphenols were examined using on ultrasonic power (300, 350, 400, 450, and 500 W), powder mass (0.5, 1.0, 1.5, 2.0, and 2.5 g), extraction temperature (40, 50, 60, 70, and 80 °C), ultrasonic time (20, 30, 40, 50, and 60 min), ammonium sulfate mass concentration (0.27, 0.30, 0.33, 0.36, and 0.39 g/mL), and alcohol–water ratio (0.2, 0.3, 0.4, 0.5, and 0.6).

3.6. Response Surface Experiment

A response surface experiment was performed for optimization based on the high and low levels in the single-factor experiment using carbohydrates and polyphenol contents as variables.

3.7. Determination of Antioxidant Activity In Vitro

3.7.1. Determination of ABTS+· Scavenging Capacity

Referring to the method in the literature [52], we used 0.3 mL of specific concentration of lower-phase solution and upper-phase solution of 0.3 mL was aspirated to measure the ABTS+ scavenging capacity. The curves depicting the scavenging rates of carbohydrates and polyphenols to ABTS+· were drawn, and the IC50 value was calculated. The same concentration of VC was used as a positive control.

3.7.2. Determination of DPPH· Scavenging Capacity

We followed the method available in the literature with minor modifications to determine the scavenging capacity of DPPH [53]. For this, 0.3 mL of a specific concentration of the lower-phase solution and upper-phase solution was aspirated and mixed with 2.0 mL of DPPH· solution (0.1 mg/mL), making up to 10 mL with distilled water. The reaction was performed at room temperature for 30 min in the dark. The absorbance A1 was measured at 517 nm. Next, 0.3 mL of the lower-phase solution and upper-phase solution was mixed with 2.0 mL of absolute ethanol, making up to 10 mL with distilled water. The reaction was performed at room temperature for 30 min in the dark and then the absorbance A2 was measured at 517 nm. The curves depicting the scavenging rates of carbohydrates and polyphenols to DPPH· were drawn and IC50 values were calculated. The same concentration of VC was used as a positive control.
DPPH ·   scavenging   rate   % = 1 A 1 A 2 A 0 × 100 %

3.7.3. Determination of Fe3+-Reducing Power

The method available in the literature was followed with minor modifications to determine the reducing capacity of Fe3+ [54]. Further, 0.3 mL of the lower-phase solution or upper-phase solution, 2.5 mL of phosphate buffer solution (pH = 7.4), and 2.5 mL of 1% K3 [Fe(CN)6] solution were mixed. The mixture was then placed in a water bath for 30 min at 50 °C. It was taken out and cooled to room temperature. Further, 1.0 mL of TCA was added, and the mixture was allowed to stand for 20 min before adding 2.5 mL of the supernatant, 0.5 mL of 0.1% FeCl3, and 2.5 mL of distilled water to it. The mixture was mixed well and left for 10 min. The absorbance was measured at 700 nm. The curves depicting Abs of carbohydrates and polyphenols were drawn, and IC50 values were calculated. The same concentration of VC was used as a positive control.

3.8. High-Performance Liquid Chromatography Analysis

3.8.1. Standard Solution Preparation

Appropriate masses of monosaccharides and uronic acid standards were accurately weighed and dissolved to prepare a 1 mg/mL mixed standard solution.
An appropriate mass of each phenolic acid standard was accurately weighed and dissolved to prepare a 0.2 mg/mL mixed standard solution.

3.8.2. Sample Solution Preparation

The lower-phase carbohydrate stock solution was freeze-dried as described in Section 3.2, and an appropriate mass of freeze-dried powder was weighed and dissolved to prepare the carbohydrate solution. To obtain the mixed standard solution and sample solution, 2 mL of 4 mol/L TFA solution was added to the carbohydrate solution and mixed well. The mixture was then hydrolyzed in an oven at 110 °C for 2 h, taken out, cooled to room temperature, and adjusted to neutral with 4 mol/L NaOH, making up to 5 mL with distilled water. We then took 200 μL of this hydrolyzed solution and added 200 μL of 0.3 mol/L NaOH solution and 200 μL of 0.5 mol/L PMP methanol solution and mixed the solution well. The solution was then placed in a water bath for 70 min at 70 °C. The solution was allowed to cool to room temperature. The pH of the solution was then adjusted by adding 200 μL of a 0.3 mol/L acetic acid solution and 200 μL of a 0.1 mol/L KH2PO4 (pH = 6.0) solution. We then added 2 mL of CHCl4 and vortexed the solution well to remove the chloroform phase. It was done thrice. The chromatographic analysis was performed on the solution after passing it through a 0.45-μm aqueous film.
The polyphenol solution was obtained using an appropriate volume of the upper-phase stock solution prepared as described in Section 3.2.

3.8.3. Chromatographic Conditions

The high-performance liquid chromatography (HPLC) conditions of carbohydrates and polyphenols are listed in Supplementary Table S1.

3.9. Statistical Analyses

Origin Pro 8 (OriginLab Corporation, Northampton, MA, USA) was used to analyze and map the experimental data, and Design-Expert 11 (Stat-Ease, Inc., Minneapolis, MN, USA) was used to design and analyze response surface experiments. IC50 calculations were performed using Origin Pro 8 software.

4. Conclusions

In this study, the powder mass, ammonium sulfate concentration, alcohol–water ratio, and ultrasonic time were considered the optimizing factors, and the optimum process conditions were obtained by constructing a double-response surface model: powder mass of 1.4 g, ammonium sulfate concentration of 0.34 g/mL, alcohol–water ratio of 0.4, and ultrasonic time of 43 min. Under these conditions, the polyphenol content in artichoke bud was 5.32 ± 0.13 mg/g and the polysaccharide content was 74.78 ± 0.11 mg/g. The HPLC spectrum analysis revealed that the carbohydrates in artichoke bud comprised mannose, rhamnose, glucuronic acid, galacturonic acid, glucose, galactose, and arabinose, with a molar ratio of 10.77:25.22:2.37:15.74:125.39:48.62:34.70. The polyphenols comprised chlorogenic acid, 4-dicaffeoylquinic acid, caffeic acid, 1,3-dicaffeoylqunic acid, isochlorogenic acid B, isochlorogenic acid A, cynarin, and isochlorogenic acid C, and the contents were 0.503, 0.029, 0.022, 0.017, 0.008, 0.162, 1.621, 0.030 mg/g, respectively. The antioxidant activity of ABTS+· and DPPH· scavenging and Fe3+-reducing abilities was determined in vitro. The results showed that the antioxidant activity of carbohydrates and polyphenols in artichoke bud was strong, and the antioxidant activity of polyphenols was stronger than those of carbohydrates.
In an aqueous two-phase system, the combination of ethanol and saline solution can be considered an environmentally friendly method for extracting biologically active substances. These mixtures are not only low-cost and simple to prepare but also provide a mild and nontoxic environment. In addition, replacing traditional solvents with an aqueous two-phase system has shown great benefits in extracting natural plant components, such as shorter extraction times and higher extraction efficiencies. Its use in combination with ultrasonic power provides a rapid and effective method to extract polyphenols and carbohydrates from artichoke bud. The optimal extraction process obtained by optimizing the dual-response surface model was stable and feasible, the carbohydrates and polyphenols obtained by crude extraction had good antioxidative effects in vitro, and the material composition was obtained by HPLC analysis. These advantages provided a theoretical basis for exploring the biological activities of carbohydrates and polyphenols, and for resource development and utilization in more detail.

Supplementary Materials

The following supporting information can be downloaded at: https://www.mdpi.com/article/10.3390/molecules27248962/s1, Table S1 HPLC conditions of carbohydrates and polyphenols; Figure S1 Influence of ultrasonic power (A), powder mass (B), extraction temperature (C), ultrasonic time (D), mass concentration of ammonium sulphate (E), and alcohol-to-water ratio (F) on the extraction of carbohydrates and polyphenols from artichoke bud; Figure S2 In vitro antioxidant experimental evaluation of carbohydrates and polyphenols.

Author Contributions

Conceptualization, D.-S.Z.; methodology, X.L. and X.-K.L.; software, K.-H.Z., X.-Y.J.; investigation, X.L., K.-H.Z. and X.-K.L.; writing—original draft preparation, X.L. and X.-K.L.; writing—review and editing, D.-S.Z.; visualization, J.-C.C.; funding acquisition, P.-Z.Y. and D.-S.Z. All authors have read and agreed to the published version of the manuscript.

Funding

The authors thank the following funders: the Focus on Research and Development Plan in Shandong Province (2022TZXD0036), the National Natural Science Foundation of China (82004233), and the TCM Science and Technology Development Plan of Shandong Province (2019-0030).

Institutional Review Board Statement

Not applicable.

Informed Consent Statement

Not applicable.

Data Availability Statement

The data are contained within the article.

Conflicts of Interest

The authors declare no conflict of interest.

Sample Availability

Samples of the compounds chlorogenic acid, caffeic acid, isochlorogenic acid B, isochlorogenic acid A, cynarin, and isochlorogenic acid C are available from the authors.

References

  1. Wang, Z.S.; Chen, S.M.; Xin, S.Y.; Sheng, H.Y.; Jiang, H.T. Total Phenols and Flavonoids and Antioxidant Activity of Artichoke (Cynara scolymus L.) Bud Juices before and after Gastrointestinal Digestion in Vitro. Food Sci. 2019, 40, 136–142. [Google Scholar]
  2. Sgroi, F.; Fodera, M.; Di Trapani, A.M.; Tudisca, S.; Testa, R. Profitability of Artichoke Growing in the Mediterranean Area. Hortscience 2015, 50, 1349–1352. [Google Scholar] [CrossRef] [Green Version]
  3. Zhao, Y.M.; Wang, C.D.; Zhang, R.; Hou, X.J.; Zhao, F.; Zhang, J.J.; Wang, C. Study on literature of artichoke and properties of traditional Chinese medicine. China J. Chin. Mater. Med. 2020, 45, 3481–3488. [Google Scholar]
  4. Boubaker, M.; El Omri, A.; Blecker, C.; Bouzouita, N. Fibre concentrate from artichoke (Cynara scolymus L.) stem by-products: Characterization and application as a bakery product ingredient. Food Sci. Technol. Int. 2016, 22, 759–768. [Google Scholar] [CrossRef] [PubMed]
  5. Mileo, A.M.; Di Venere, D.; Linsalata, V.; Fraioli, R.; Miccadei, S. Artichoke polyphenols induce apoptosis and decrease the invasive potential of the human breast cancer cell line MDA-MB231. J. Cell. Physiol. 2012, 227, 3301–3309. [Google Scholar] [CrossRef]
  6. Zhu, X.F.; Zhang, H.X.; Lo, R. Antifungal activity of Cynara scolymus L. extracts. Fitoterapia 2005, 76, 108–111. [Google Scholar] [CrossRef]
  7. Wang, M.F.; Simon, J.E.; Aviles, I.F.; He, K.; Zheng, Q.Y.; Tadmor, Y. Analysis of antioxidative phenolic compounds in artichoke (Cynara scolymus L.). J. Agric. Food Chem. 2003, 51, 601–608. [Google Scholar] [CrossRef]
  8. Speroni, E.; Cervellati, R.; Govoni, P.; Guizzardi, S.; Renzulli, C.; Guerra, M.C. Efficacy of different Cynara scolymus preparations on liver complaints. J. Ethnopharmacol. 2003, 86, 203–211. [Google Scholar] [CrossRef]
  9. Sisto, A.; Luongo, D.; Treppiccione, L.; De Bellis, P.; Di Venere, D.; Lavermicocca, P.; Rossi, M. Effect of Lactobacillus paracasei Culture Filtrates and Artichoke Polyphenols on Cytokine Production by Dendritic Cells. Nutrients 2016, 8, 635. [Google Scholar] [CrossRef] [Green Version]
  10. Ruiz-Cano, D.; Perez-Llamas, F.; Frutos, M.J.; Arnao, M.B.; Espinosa, C.; Lopez-Jimenez, J.A.; Castillo, J.; Zamora, S. Chemical and functional properties of the different by-products of artichoke (Cynara scolymus L.) from industrial canning processing. Food Chem. 2014, 160, 134–140. [Google Scholar] [CrossRef]
  11. Hourieh, A. A Review on Free Radicals and Antioxidants. Infect. Disord. Drug Targets 2020, 20, 16–26. [Google Scholar]
  12. Zhao, D.; Liu, X.L.; Zheng, X.Q.; Fan, L. Antioxidant activity of pea protein hydrolysates in vitro and on HepG2 cells. Food Ferment. Ind. 2022, 48, 1–11. [Google Scholar]
  13. Li, M.R.; Zhou, Y.Z.; Du, G.H.; Qin, X.M. Research progress about the anti-aging effect and mechanism of flavonoids from traditional Chinese medicine. Acta Pharm. Sin. 2019, 54, 1382–1391. [Google Scholar]
  14. Ademowo, O.S.; Dias, H.K.I.; Burton, D.G.; Griffiths, H.R. Lipid (per) oxidation in mitochondria: An emerging target in the ageing process? Biogerontology 2017, 18, 859–879. [Google Scholar] [CrossRef] [Green Version]
  15. Li, J.M.; Han, Y.Q.; Wu, T.; Zhang, T.C.; Dong, X.H. Lipid peroxidation in ferroptosis and its relationship with Alzheimer disease. Chin. J. Pathophysiol. 2022, 38, 1142–1147. [Google Scholar]
  16. Simunkova, M.; Alwasel, S.H.; Alhazza, I.M.; Jomova, K.; Kollar, V.; Rusko, M.; Valko, M. Management of oxidative stress and other pathologies in Alzheimer’s disease. Arch. Toxicol. 2019, 93, 2491–2513. [Google Scholar] [CrossRef] [PubMed]
  17. Moloney, J.N.; Cotter, T.G. ROS signalling in the biology of cancer. Semin. Cell Dev. Biol. 2018, 80, 50–64. [Google Scholar] [CrossRef]
  18. Incalza, M.A.; D’Oria, R.; Natalicchio, A.; Perrini, S.; Laviola, L.; Giorgino, F. Oxidative stress and reactive oxygen species in endothelial dysfunction associated with cardiovascular and metabolic diseases. Vasc. Pharmacol. 2018, 100, 1–19. [Google Scholar] [CrossRef]
  19. Chandrasekaran, A.; Idelchik, M.D.S.; Melendez, J.A. Redox control of senescence and age-related disease. Redox Biol. 2017, 11, 91–102. [Google Scholar] [CrossRef] [Green Version]
  20. Xie, J.H.; Liu, H.M.; Liu, M.H.; Zheng, M.Z.; Xu, Q.; Liu, J.S. Extraction Process Optimization and Antioxidant Activity Analysis of Polyphenols from Azuki Bean Coats (Vigna angularis). J. Chin. Inst. Food Sci. Technol. 2020, 20, 147–157. [Google Scholar]
  21. Zheng, Q.R.; Li, W.F.; Zhang, H.; Gao, X.X.; Tan, S. Optimizing synchronous extraction and antioxidant activity evaluation of polyphenols and polysaccharides from Ya’an Tibetan tea (Camellia sinensis). Food Sci. Nutr. 2020, 8, 489–499. [Google Scholar] [CrossRef] [PubMed] [Green Version]
  22. Yang, S.M.; Guo, W.H.; Wang, Z.J.; Deng, L. Optimization of Polysaccharides Extraction from Lycopus Lucidus Turcz. by Response Surface Methodology and Study on Its Antioxidant Activity. Chin. J. Mod. Appl. Pharm. 2021, 38, 2554–2559. [Google Scholar]
  23. Zhang, Z.Y.; Zhao, Z.H.; Chen, X.; Liu, F.C.; Wang, J.G. Comparison of Polyphenols of Ziziphus Jujuba Extracted by Different Methods. Food Res. Dev. 2020, 41, 153–159. [Google Scholar]
  24. Wang, Y.H.; Wu, Q.; Chi, Y.L.; Yao, K.; Jia, D.Y. Properties of crude polysaccharides extracted from Tremella fuciformis by acid, alkali and enzyme-assisted methods. Food Sci. Technol. 2019, 44, 200–204. [Google Scholar]
  25. Jin, W.Q.; Peng, J.Y.; Wang, Y.S.; Tang, Y.J.; Tang, Z.Z.; Chen, H.; Sun, R.; Zheng, T.R.; Liu, M.Y.; Sun, W.J. Optimization of Response Surface Methodology for Microwave-assisted and Ultrasonic-assisted Extraction of Polysaccharides from Amaranthus hybridus L. Genom. Appl. Biol. 2019, 38, 757–765. [Google Scholar]
  26. Sahin, S.; Samli, R.; Tan, A.S.B.; Barba, F.J.; Chemat, F.; Cravotto, G.; Lorenzo, J.M. Solvent-Free Microwave-Assisted Extraction of Polyphenols from Olive Tree Leaves: Antioxidant and Antimicrobial Properties. Molecules 2017, 22, 1056. [Google Scholar] [CrossRef] [PubMed] [Green Version]
  27. Chen, L.; He, W.Q.; Cao, Q.Q. Optimization of Enzymatic Extraction Technology of Polysaccharide from Portulaca oleracea by Response Surface Methodology. Food Res. Dev. 2020, 41, 79–84. [Google Scholar]
  28. Anticona, M.; Blesa, J.; Frigola, A.; Esteve, M.J. High Biological Value Compounds Extraction from Citrus Waste with Non-Conventional Methods. Foods 2020, 9, 811. [Google Scholar] [CrossRef]
  29. Wang, J.H. Extraction of Flavonoid in Osmanthus Leaves by Aqueous Two-phase System Assisted Inner Ebullition Method. Food Res. Dev. 2022, 43, 22–28. [Google Scholar]
  30. Zhang, S.M.; Chen, M.Z. Extraction of Polysaccharides from Porphyra haitanensis Using Ethanol-Ammonium Sulfate Aqueous Two-Phase System. Food Sci. 2014, 35, 46–49. [Google Scholar]
  31. Sadeghi, R.; Jamehbozorg, B. The salting-out effect and phase separation in aqueous solutions of sodium phosphate salts and poly (propylene glycol). Fluid Phase Equilib. 2009, 280, 68–75. [Google Scholar] [CrossRef]
  32. Rang, F.J.; Liu, W.; Ouyang, Y. Aqueous Two-phase Extraction Process and Antioxidant Activity of the Polyphenols and Polysaccharides of Physalis alkekengi Fruit. Food Res. Dev. 2021, 42, 114–120. [Google Scholar]
  33. Hou, Q.Z.; Xin, H.J.; Liu, Z.J. Study on Aqueous Two-phase System Extraction of Flavones and Polysaccharides from Pineapple Peel. Food Res. Dev. 2018, 39, 72–76. [Google Scholar]
  34. Singleton, V.L.; Rossi, J.A. Colorimetry of Total Phenolics with Phosphomolybdic-Phosphotungstic Acid Reagents. Am. J. Enol. Vitic. 1965, 16, 144. [Google Scholar]
  35. Zhao, Y.Y.; Wang, Q.Z.; Zhang, J.H.; Feng, X.; Wang, M. Optimization of Extraction Conditions for Phenolic Acid of Cynara scolymus L. by Orthogonal Design. Food Res. Dev. 2013, 34, 15–17. [Google Scholar]
  36. Fernandes, P.A.R.; Le Bourvellec, C.; Renard, C.M.G.C.; Wessel, D.F.; Cardoso, S.M.; Coimbra, M.A. Interactions of arabinan-rich pectic polysaccharides with polyphenols. Carbohydr. Polym. 2020, 230, 115644. [Google Scholar] [CrossRef]
  37. Renard, C.M.G.C.; Watrelot, A.A.; Le Bourvellec, C. Interactions between polyphenols and polysaccharides: Mechanisms and consequences in food processing and digestion. Trends Food Sci. Technol. 2017, 60, 43–51. [Google Scholar] [CrossRef]
  38. Ye, Z.W.; Ye, R.; Hao, D.X.; Ren, S.W.; Li, J.P.; Chen, Q. Optimization of polysaccharide extraction from Xi Pinellia ternate by response surface methodology and its antioxidant activity. China Food Addit. 2022, 33, 90–98. [Google Scholar]
  39. Su, Y.L.; Zhang, J.H. Optimization of Ultrasonic-assisted Ethanol Extraction of Polyphenols from Kelp and Their Antioxidant Activities. Chin. Condiment 2020, 45, 174–180. [Google Scholar]
  40. Wu, Y.H.; Lu, W.J.; Liu, M.H.; Zhang, J.P.; Chen, A.H.; Shao, Y.; Wang, C.K.; Liu, E.Q. Optimization of ultrasonic-assisted aqueous two-phase extraction of burdock polysaccharide by response surface design and its antioxidant activities. Food Ferment. Ind. 2020, 46, 215–223. [Google Scholar]
  41. Liu, L.L.; Li, L.; Zhai, L.M.; Xiao, B.Z. Ultrasonic—assisted Aqueous Two—phase Extraction of Naringin from Pomelo Peel by Orthogonal Experimental Design. Sci. Technol. Food Ind. 2018, 39, 159–163, 171. [Google Scholar]
  42. Gong, X.H.; Li, M.C.; Xin, M.H.; Zhao, X.J.; Lu, G.; Xu, J.; Zhao, S.Y. Optimization of the Extraction Technology of Tea Polyphenols from Tea Waste by Aqueous Two—phase Systems with Ionic Liquids as Additives. Sci. Technol. Food Ind. 2020, 41, 158–166. [Google Scholar]
  43. Majd, M.H.; Rajaei, A.; Bashi, D.S.; Mortazavi, S.A.; Bolourian, S. Optimization of ultrasonic-assisted extraction of phenolic compounds from bovine pennyroyal (Phlomidoschema parviflorum) leaves using response surface methodology. Ind. Crops Prod. 2014, 57, 195–202. [Google Scholar] [CrossRef]
  44. Sahin, S.; Aybastier, O.; Isik, E. Optimisation of ultrasonic-assisted extraction of antioxidant compounds from Artemisia absinthium using response surface methodology. Food Chem. 2013, 141, 1361–1368. [Google Scholar] [CrossRef]
  45. Guo, C.; Li, C.; Hou, M.M.; Bai, M.Y.; Zhou, C.C.; Zhang, H.Y. Extraction optimization and its inoxidizability and hypoglycemic properties in vitro of polysaccharide from Salvia plebeia R. Br. Sci. Technol. Food Ind. 2022, 43, 211–219. [Google Scholar]
  46. Li, B.; Lei, Y.; Meng, X.J.; Jiao, X.Y.; Gao, N.X.; Zhao, Y.; Zhang, J.C. Optimization of Ultrasonic-Assisted Extraction of Polyphenols from Haskap Berries (Lonicera caerulea L.) Using Response Surface Methodology and Their Antioxidant Capacity. Food Sci. 2015, 36, 33–39. [Google Scholar]
  47. Song, S.; He, H.; Tang, X.; Wang, W. Determination of Polyphenols and Chlorogenic Acid in Artichoke. Life Sci. Instrum. 2007, 5, 47–49. [Google Scholar]
  48. Bao, F.; Yuan, H.Z.; Lin, X.; Liu, L.L.; Zhuang, H.; Zhao, D.S. Comparative study on the different parts of artichoke based on the correlation of “components-antioxidant”. Cereals Oils 2022, 35, 142–145. [Google Scholar]
  49. Martinez-Morales, F.; Alonso-Castro, A.J.; Zapata-Morales, J.R.; Carranza-Álvarez, C.; Aragon-Martinez, O.H. Use of standardized units for a correct interpretation of IC50 values obtained from the inhibition of the DPPH radical by natural antioxidants. Chem. Pap. 2020, 74, 3325–3334. [Google Scholar] [CrossRef]
  50. Garbetta, A.; Capotorto, I.; Cardinali, A.; D’Antuono, I.; Linsalata, V.; Pizzi, F.; Mineruini, F. Antioxidant activity induced by main polyphenols present in edible artichoke heads: Influence of in vitro gastro-intestinal digestion. Funct. Foods 2014, 10, 456–464. [Google Scholar] [CrossRef]
  51. DuBois, M.; Gilles, K.A.; Hamilton, J.K.; Rebers, P.A.; Smith, F. Colorimetric Method for Determination of Sugars and Related Substances. Anal. Chem. 1956, 28, 350–356. [Google Scholar] [CrossRef]
  52. Re, R.; Pellegrini, N.; Proteggente, A.; Pannala, A.; Yang, M.; Rice-Evans, C. Antioxidant activity applying an improved ABTS radical cation decolorization assay. Free. Radic. Biol. Med. 1999, 26, 1231–1237. [Google Scholar] [CrossRef] [PubMed]
  53. Brand-Williams, W.; Cuvelier, M.E.; Berset, C. Use of a free radical method to evaluate antioxidant activity. LWT Food Sci. Technol. 1995, 28, 25–30. [Google Scholar] [CrossRef]
  54. Benzie, I.F.F.; Strain, J.J. Ferric reducing/antioxidant power assay: Direct measure of total antioxidant activity of biological fluids and modified version for simultaneous measurement of total antioxidant power and ascorbic acid concentration. Methods Enzymol. 1999, 28, 15–27. [Google Scholar]
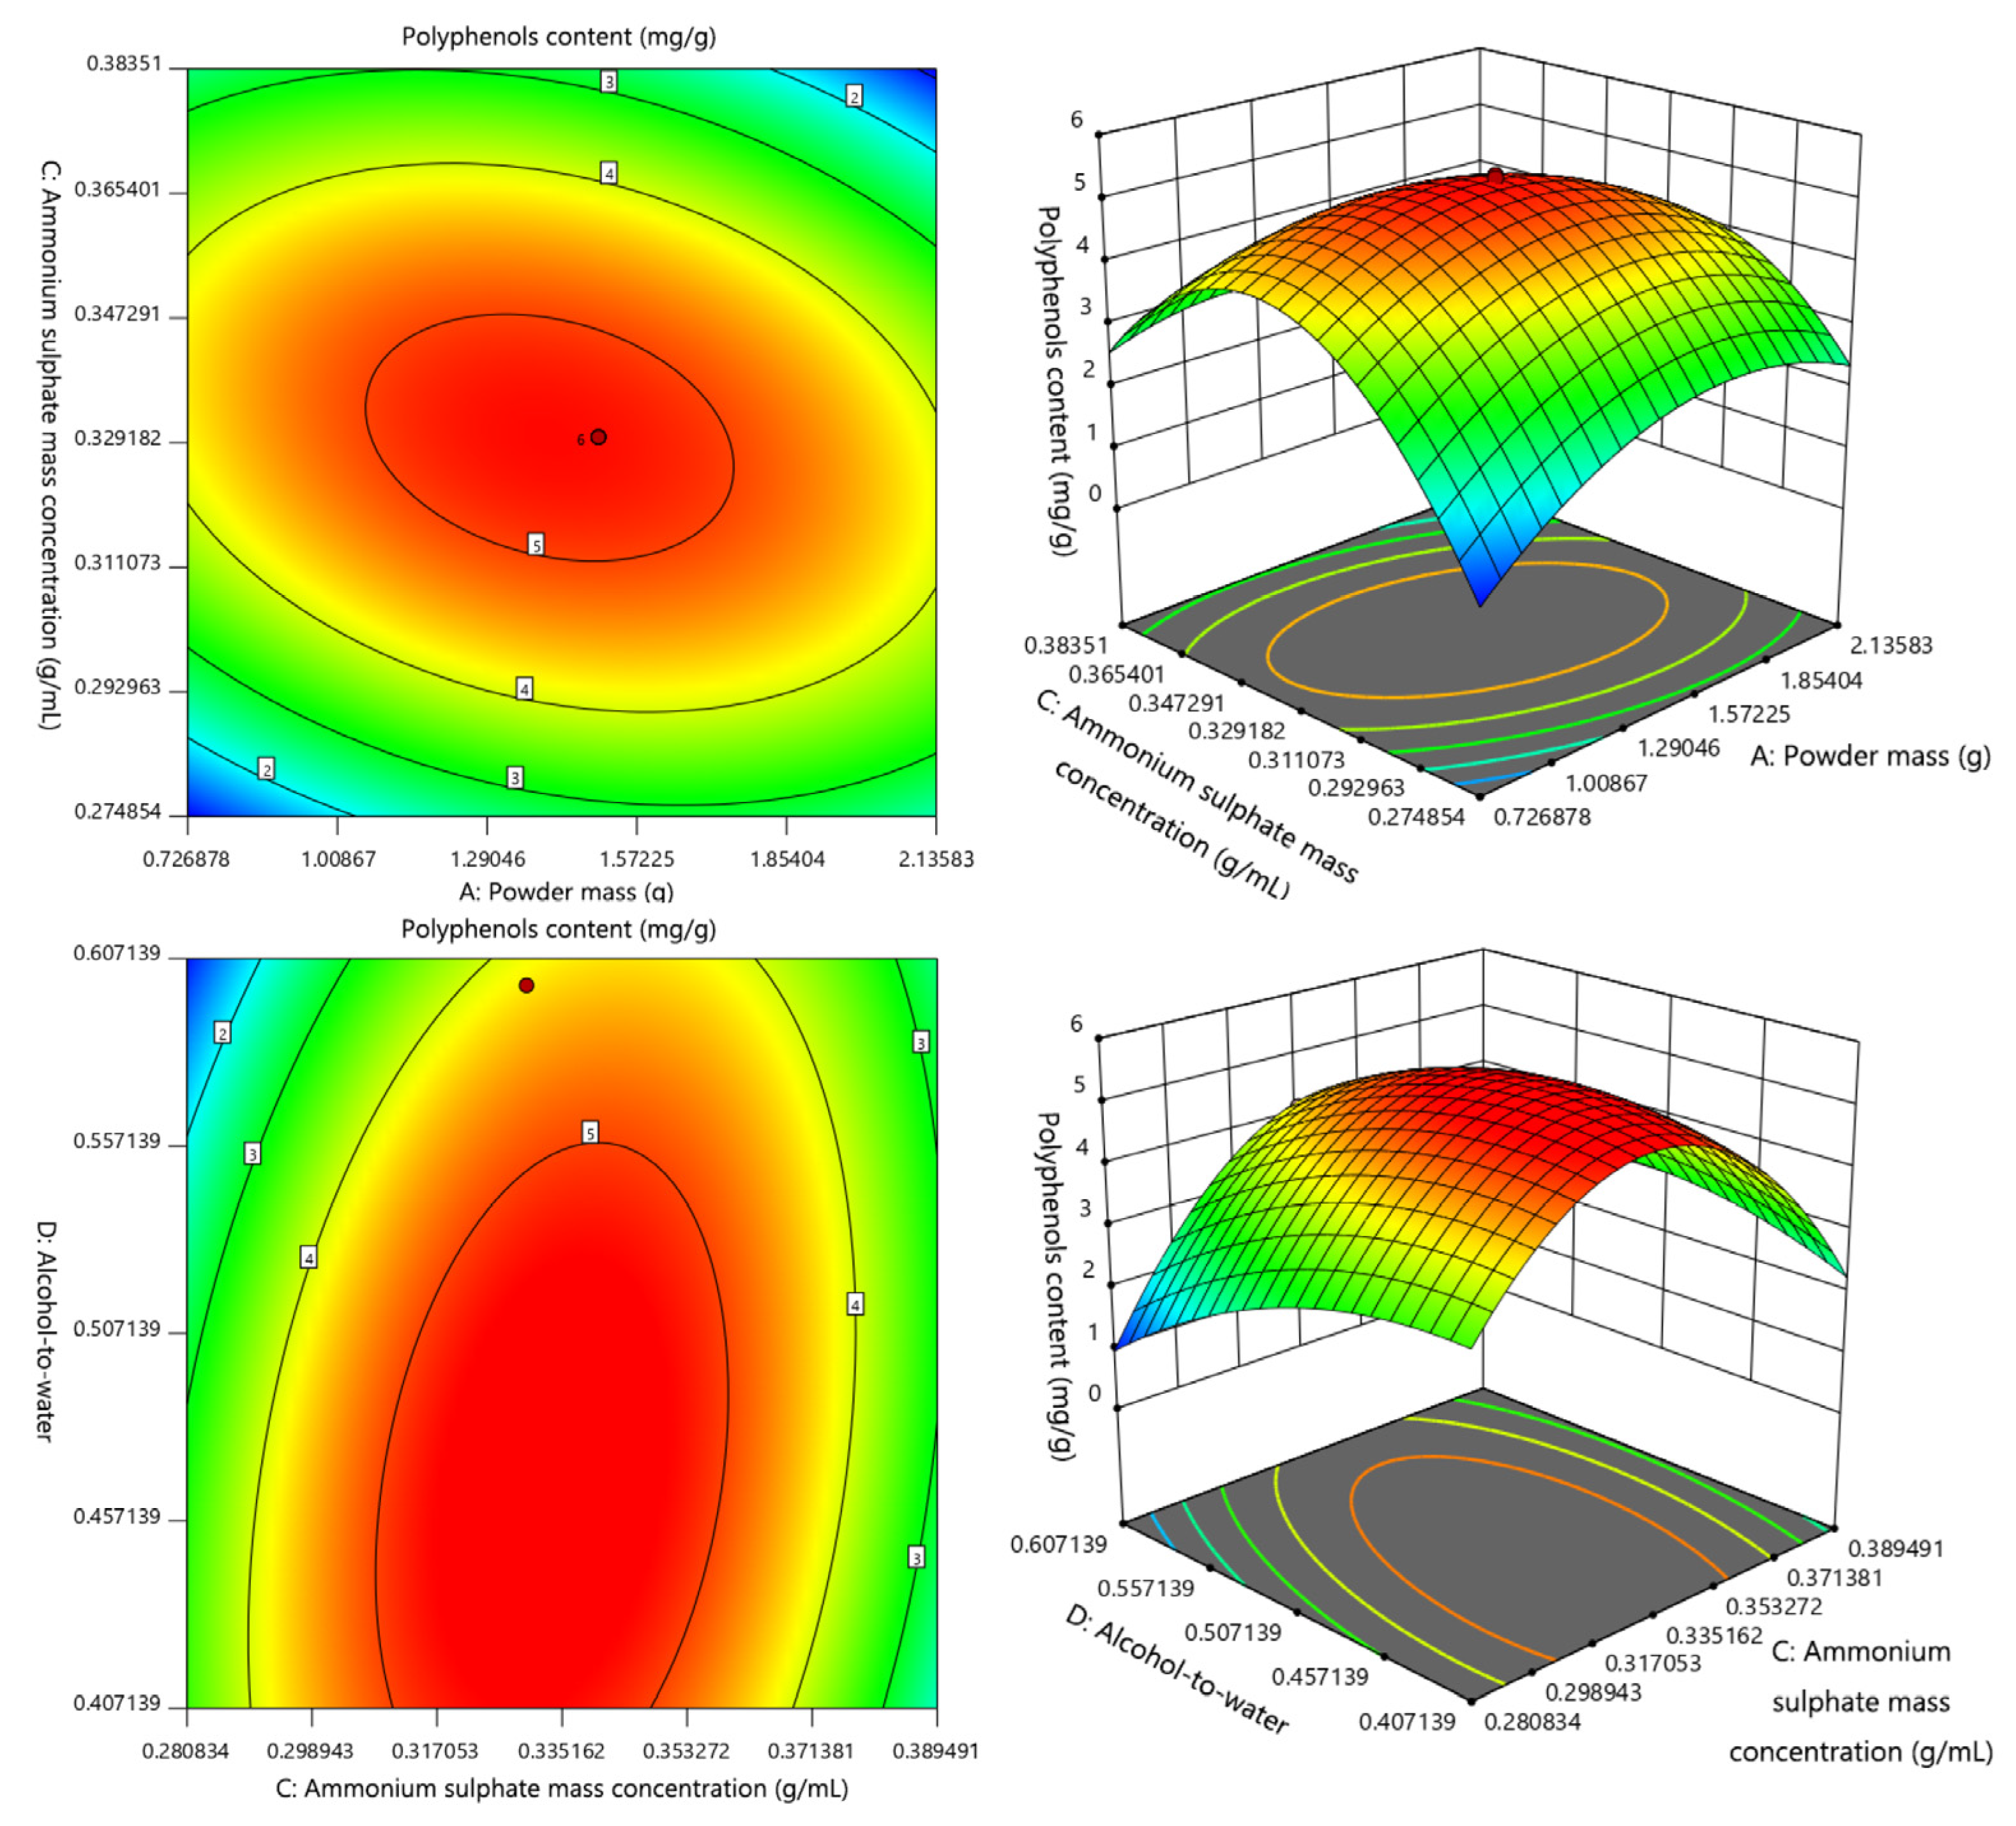
Figure 1. Effect of interaction between the powder mass (A) and the ammonium sulfate concentration (C) or the alcohol–water ratio (D) on the polyphenol content.
Molecules 27 08962 g001
Figure 2. HPLC profile of monosaccharide, alduronic acid mixed standard (A) and polysaccharide samples (B). 1. Mannose, 2. rhamnose, 3. glucuronic acid, 4. galacturonic acid, 5. glucose, 6. galactose, 7. arabinose.
Molecules 27 08962 g002
Figure 3. HPLC profile of phenolic acid mixed standard (A) and polyphenol samples (B). 1. Chlorogenic acid, 2. 4-dicaffeoylquinic acid, 3. caffeic acid, 4. 1,3-dicaffeoylqunic acid, 5. isochlorogenic acid B, 6. isochlorogenic acid A, 7. cynarin, 8. isochlorogenic acid C.
Molecules 27 08962 g003
Figure 4. Concentrations of monosaccharides and alduronic acid in carbohydrates (A) and concentrations of eight phenolic acids in polyphenols (B).
Molecules 27 08962 g004
Figure 5. The synchronous extraction process for carbohydrates and polyphenols from artichoke bud.
Molecules 27 08962 g005
Table 1. Response surface factor levels.
LevelsFactors
A
Powder Mass
(g)
B
Ultrasound Time
(min)
C
Ammonium Sulphate Mass Concentration
(g/mL)
D
Alcohol–Water Ratio
−11.0300.300.3
01.5400.330.4
12.0500.360.5
Table 2. Response Surface Experiment Scheme and Results.
No.ABCDThe Content of Polyphenols
(mg/g)
The Content of Carbohydrates
(mg/g)
11300.30.32.1756.61
22300.30.31.5626.60
31500.30.33.1452.37
42500.30.32.6850.80
51300.360.31.6457.57
62300.360.31.4563.11
71500.360.31.8267.23
82500.360.31.1856.64
91300.30.52.5646.12
102300.30.53.9146.85
111500.30.52.4548.81
122500.30.54.3150.01
131300.360.54.5346.76
142300.360.53.3653.08
151500.360.54.3254.57
162500.360.53.4657.61
170.5400.330.44.0057.69
182.5400.330.41.8844.41
191.5200.330.43.1468.72
201.5600.330.43.1761.63
211.5400.270.42.2866.85
221.5400.390.42.0667.61
231.5400.330.20.8967.77
241.5400.330.64.2347.53
251.5400.330.45.2174.77
261.5400.330.45.2274.69
271.5400.330.45.2374.72
281.5400.330.45.2874.76
291.5400.330.45.2374.68
301.5400.330.45.2474.72
Table 3. Analysis of variance for polyphenols content.
SourceSum of Squares of Deviation from MeanDegrees of FreedomMean SquareF Valuep Value
Model53.44143.8215.99<0.0001
A1.0311.034.290.0559
B0.209110.20910.87550.3643
C0.088810.08880.37190.5511
D16.57116.5769.380.0001
AB0.016910.01690.07080.7938
AC1.5611.566.540.0218
AD0.592910.59292.480.1359
BC0.416010.41601.740.2066
BD0.207010.20700.86700.3665
CD2.1812.189.110.0086
A28.6318.6336.13<0.0001
B27.0517.0529.54<0.0001
C215.57115.5765.19<0.0001
D211.80111.8049.41<0.0001
Residual3.58150.2388
Lack of fit1.29100.12904.230.1969
Pure Error0.003050.0006
Sum error57.0329
Table 4. Analysis of variance for carbohydrates content.
SourceSum of Squares of Deviation from MeanDegrees of FreedomMean SquareF Valuep Value
Model3138.9914224.213.480.0112
A112.231112.231.740.2069
B30.74130.740.47660.5005
C266.131266.134.130.0603
D190.411190.412.950.1063
AB5.6415.640.08750.7715
AC72.08172.081.120.3071
AD143.521143.522.230.1565
BC6.6016.600.10240.7534
BD1.5411.540.02380.8793
CD89.97189.971.400.2559
A21449.3511449.3522.470.0003
B2383.231383.235.940.0277
C2285.131285.134.420.0528
D2866.061866.0613.430.0023
Residual967.321564.49
Lack of fit1.56100.15601.620.3191
Pure Error0.006550.0013
Sum error4106.3229
Table 5. In vitro antioxidant experimental IC50 values.
Experiment NameCarbohydratesPolyphenolsVC
Clear ABTS+0.4141 mg/mL0.01108 mg/mL0.01294 mg/mL
Clear DPPH2.6110 mg/mL0.04131 mg/mL0.17400 mg/mL
Fe3+ reducing power0.9363 mg/mL0.06345 mg/mL0.06976 mg/mL
Publisher’s Note: MDPI stays neutral with regard to jurisdictional claims in published maps and institutional affiliations.