Article

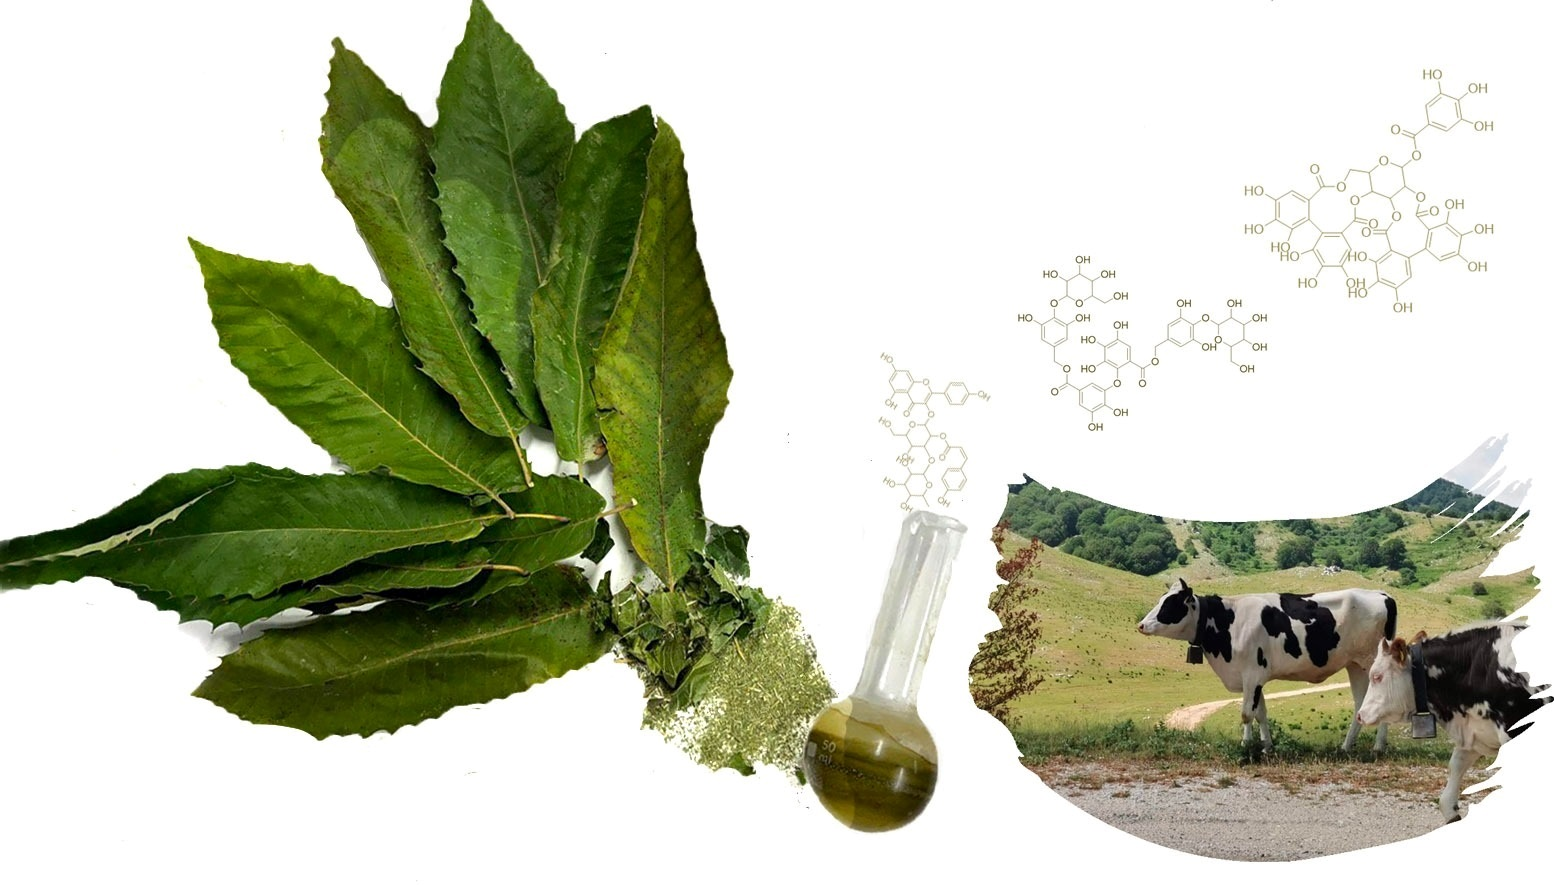
Castanea sativa Mill. Leaf: UHPLC-HR MS/MS Analysis and Effects on In Vitro Rumen Fermentation and Methanogenesis

by
Marialuisa Formato
1,
Alessandro Vastolo
2,
Simona Piccolella
1,
Serena Calabrò
2,
Monica Isabella Cutrignelli
2,
Christian Zidorn
3 and
Severina Pacifico
1,*
1
Department of Environmental, Biological and Pharmaceutical Sciences and Technologies, University of Campania ‘Luigi Vanvitelli’, Via Vivaldi 43, 81100 Caserta, Italy
2
Department of Veterinary Medicine and Animal Production, University of Naples Federico II, Via Federico Delpino 1, 80137 Napoli, Italy
3
Pharmazeutisches Institut, Abteilung Pharmazeutische Biologie, Christian-Albrechts-Universität zu Kiel, Gutenbergstraße 76, 24118 Kiel, Germany
*
Author to whom correspondence should be addressed.
Molecules 2022, 27(24), 8662; https://doi.org/10.3390/molecules27248662
Submission received: 23 October 2022 / Revised: 2 December 2022 / Accepted: 2 December 2022 / Published: 7 December 2022

Abstract

:
Castanea sativa Mill. (Fagaceae) is a deciduous tree grown for its wood and edible fruits. Chestnut processing produces residues (burs, shells, and leaves) exploitable for their diversity in bioactive compounds in animal nutrition. In fact, plant-specialized metabolites likely act as rumen modifiers. Thus, the recovery of residual plant parts as feed ingredients is an evaluable strategy. In this context, European chestnut leaves from northern Germany have been investigated, proving to be a good source of flavonoids as well as gallo- and ellagitannins. To this purpose, an alcoholic extract was obtained and an untargeted profiling carried out, mainly by means of ultra-high-performance liquid chromatography/high-resolution tandem mass spectrometry (UHPLC-HR MS/MS) techniques. To better unravel the polyphenol constituents, fractionation strategies were employed to obtain a lipophilic fraction and a polar one. This latter was highly responsive to total phenolic and flavonoid content analyses, as well as to antiradical (DPPH and ABTS+●) and reducing activity (PFRAP) assays. The effect of the alcoholic extract and its fractions on rumen liquor was also evaluated in vitro in terms of fermentative parameter changes and impact on methanogenesis. The data acquired confirm that chestnut leaf extract and the fractions therefrom promote an increase in total volatile fatty acids, while decreasing acetate/propionate ratio and CH4 production.

Graphical Abstract

1. Introduction

The genus Castanea (Fagaceae family) consists of twelve species of deciduous trees native to temperate regions of the northern hemisphere. Among them, Castanea sativa Mill. (European or sweet chestnut) is the most representative species in Southern Europe, with Italy representing the largest chestnut-producing area, although its worldwide distribution area is very extensive (Figure S1), ranging from Southern Europe and North Africa to North-Western Europe and eastward to Western Asia [1].
C. sativa Mill. is of interest for its precious wood and its edible seed (nut), which is composed of the fruit, the pericarp (outer shell), the integument (inner shell), and the surrounding bur. In recent years, the consumption of fresh or processed chestnuts has significantly increased due to their positive effects on health. In fact, chestnut fruits can be used as an energy source due to their content of carbohydrates (especially starch) and fatty acids (mainly linoleic, oleic, and palmitic acids). In addition, chestnuts, as purée and chestnut flour, are finding a new nutritional application as ingredients in gluten-free diets [2]. Indeed, because only the nuts are used for food processing, the shells, leaves, and burs represent common waste products of the chestnut food industry, even if these residual components contain promising bioactives [3]. In this context, recent studies have shown that by-products and waste from chestnut processing are rich in bioactive compounds with antioxidant, antimicrobial, and anti-inflammatory properties that make them good candidates in various fields of application, such as pharmaceuticals, food, or cosmetics [4,5,6,7]. Shells are the most commonly investigated form of chestnut waste, being applicable as a natural antioxidant and prebiotic for human consumption, due to the presence of tannins (condensed and hydrolysable), flavonoids (derivatives of quercetin, rutin, catechin, and apigenin) [8], vitamins E, lignin, and nondigestible oligosaccharides (fiber, cellulose, and hemicellulose) [9,10]. The diversity in bioactive compounds also involves foliar biomass, which is not highly valued since it is considered an agroforestry residue that does not impact the food industry. Exploiting all the non-edible components of the chestnut, including the leaves, enables the production of quality products [11] with a sustainable reduction in environmental pollution in a circular economy scenario. One of the most promising applications is the recovery of forest biomass and chestnut waste (e.g., leaves, shells, burs) for the optimization of feed ingredients as a strategy to achieve sustainable animal production [12,13]. The growing demand for animal products has led to the adoption of intensive production systems that could compromise animal health, affecting the metabolic status and immunological systems of animals. Moreover, this breeding approach is characterized by a higher environmental impact. Thus, there is renewed interest in the use of dietary phytochemicals as natural rumen modifiers, considering the potential concerns related to the use, over the presence, of chemical residues in animal products and the development of bacterial resistance to antibiotics [14]. Indeed, plant material, or its extracts, could be an interesting source for novel food additives in livestock feed [15] as an alternative and natural strategy to ensure animal welfare and product quality. The different nutritional strategies are in tune with the induction of changes in the rumen microbiome, which affects metabolism, productivity, environmental emissions (methane and nitrogen), and the quality of food derived from ruminants. It is known that the integration of polyphenols into the diets of ruminants can modulate the diversity and activity of rumen microorganisms, the degradability of nutrients, and the methanogenesis of the rumen, with effects on the final fermentation products (i.e., N-NH3, pH, acetate, butyrate, propionate, etc.). In this regard, the mainly hydrolysable chestnut tannins (HTs) have in some cases shown inhibitory effects on Ruminococcus flavefaciens, Butyrivibrio proteoclasticus, methanogenic microbiome, and the increase in B. fibrisolvens, and in other cases have shown no effect on the microbial community of the rumen [16,17,18,19]. Different types of tannins (HTs vs. condensed tannins, CTs), as well as flavonoids, can have controversial effects on rumen fermentation and microbiome, so much so that a careful chemical analysis is mandatory. It has been further observed that condensed tannins, due to their difficult hydrolysis, exert a greater effect on nutritional profile and digestibility than hydrolysable ones [20].
Herein, renewable Castanea sativa Mill. leaves were of interest, and the alcoholic extract obtained by maceration was first investigated through an untargeted UHPLC-HRMS/MS approach. Furthermore, the extract underwent fractionation, obtaining fractions variously enriched in bioactives, as confirmed by a preliminary screening of total phenol content (TPC) and total flavonoid content (TFC). The antiradical and reducing activity of the alcoholic extract and fractions therefrom was also evaluated by means of DPPH and ABTS●+ tests, and by ferricyanide FRAP assay. The further chemical investigation of fractions was carried out by means of UV-Vis spectroscopy and ultra-high-performance liquid chromatography coupled to quadrupole time-of-flight tandem mass spectrometry (UHPLC-QqTOF-MS/MS) analyses. Because the bioactivity assessment is closely coupled to chemical composition, all the differently constituted fractions were tested to evaluate their effects on in vitro ruminal fermentation (cumulative gas production, organic matter degradability, fermentation kinetics, pH, and end products), including methanogenesis.

2. Results and Discussion

Leaves of C. sativa were preliminarily investigated in terms of dry matter (DM), ash, neutral (NDF) and acid (ADF) detergent fiber, acid detergent lignin (ADL), ether extract (EE), non-structural carbohydrates (NSC), and crude protein (CP). Data acquired are reported in Figure 1 as % of dry matter (DM). In particular, it was observed that NDF and ADF were 31.7 and 19.5% of DM, respectively, whereas the acid detergent lignin (ADL) was equal to 6.28% of DM. The NDF and ADF contents in chestnut leaves, which provide the level of structural carbohydrates, define the good quality of the chestnut biomass and its capability to ensure adequate amounts of fiber and provide a valuable source of energy. Indeed, as is well-known, NDF and ADF values vary widely, based on soil type and other environmental factors, which affect lignin and hemicellulose content and nutrient digestibility [21]. The low crude protein value instead suggests the need to properly balance the dietary composition. In the investigation of the use of chestnut leaves for bioactive compounds, leaves previously collected in Northern Germany were exsiccated and pulverized and subjected to alcoholic ultrasound-assisted maceration. The alcoholic extract obtained, hereafter Cs/1/1, was subjected to fractionation to achieve a non-polar fraction Cs/2/1 and a hydroalcoholic one, which further provided the alcoholic fraction Cs/3/2.
The chemical composition assessment, preliminarily carried out using colorimetric assays, markedly differentiated Cs/1/1 and its fractions Cs/2/1 and Cs/3/2. The first one showed TPC and TFC values equal to 288.1 ± 1.1 gallic acid equivalents (GAEs) and 52.9 ± 4.4 mg quercetin equivalents (QUEs) per g of extract, respectively (Figure 2A(a,b)). These values are in line with those by Cerulli et al. [22], who, evaluating the TPC and TFC of a chestnut leaf methanol extract, found that total phenols were 299.0 ± 14.8 mg GAEs, while flavonoids were 45.54 ± 0.99 mg RUEs per g of extract. Indeed, due to fractionation, Cs/3/2 appeared to be enriched in phenolic and flavonoid compounds, exhibiting a TPC value threefold higher than Cs/1/1, while flavonoids accounted for 83.2 ± 10.7 mg QUEs per g of extract. To clarify the main actors of Cs/3/2 TP content, which could be attributable to gallo- and ellagitannins [23,24], UHPLC-ESI-QqTOF tandem mass spectrometry analysis was carried out, as well as antiradical and reducing power assessment. In this latter regard, Cs/3/2 showed marked scavenging activity with both ABTS●+ and DPPH, with relative ID50 values equal to 11.2 ± 0.3 µg/mL and 30.3 ± 0.8 µg/mL. Moreover, Cs/3/2 effectively reduced ferric ions at the lowest tested doses, so much so that ID50 and TEAC (Trolox Equivalents Antioxidant Capacity) values were 0.37 ± 0.02 µg/mL and 4.7, respectively (Figure 2B(a–c)).

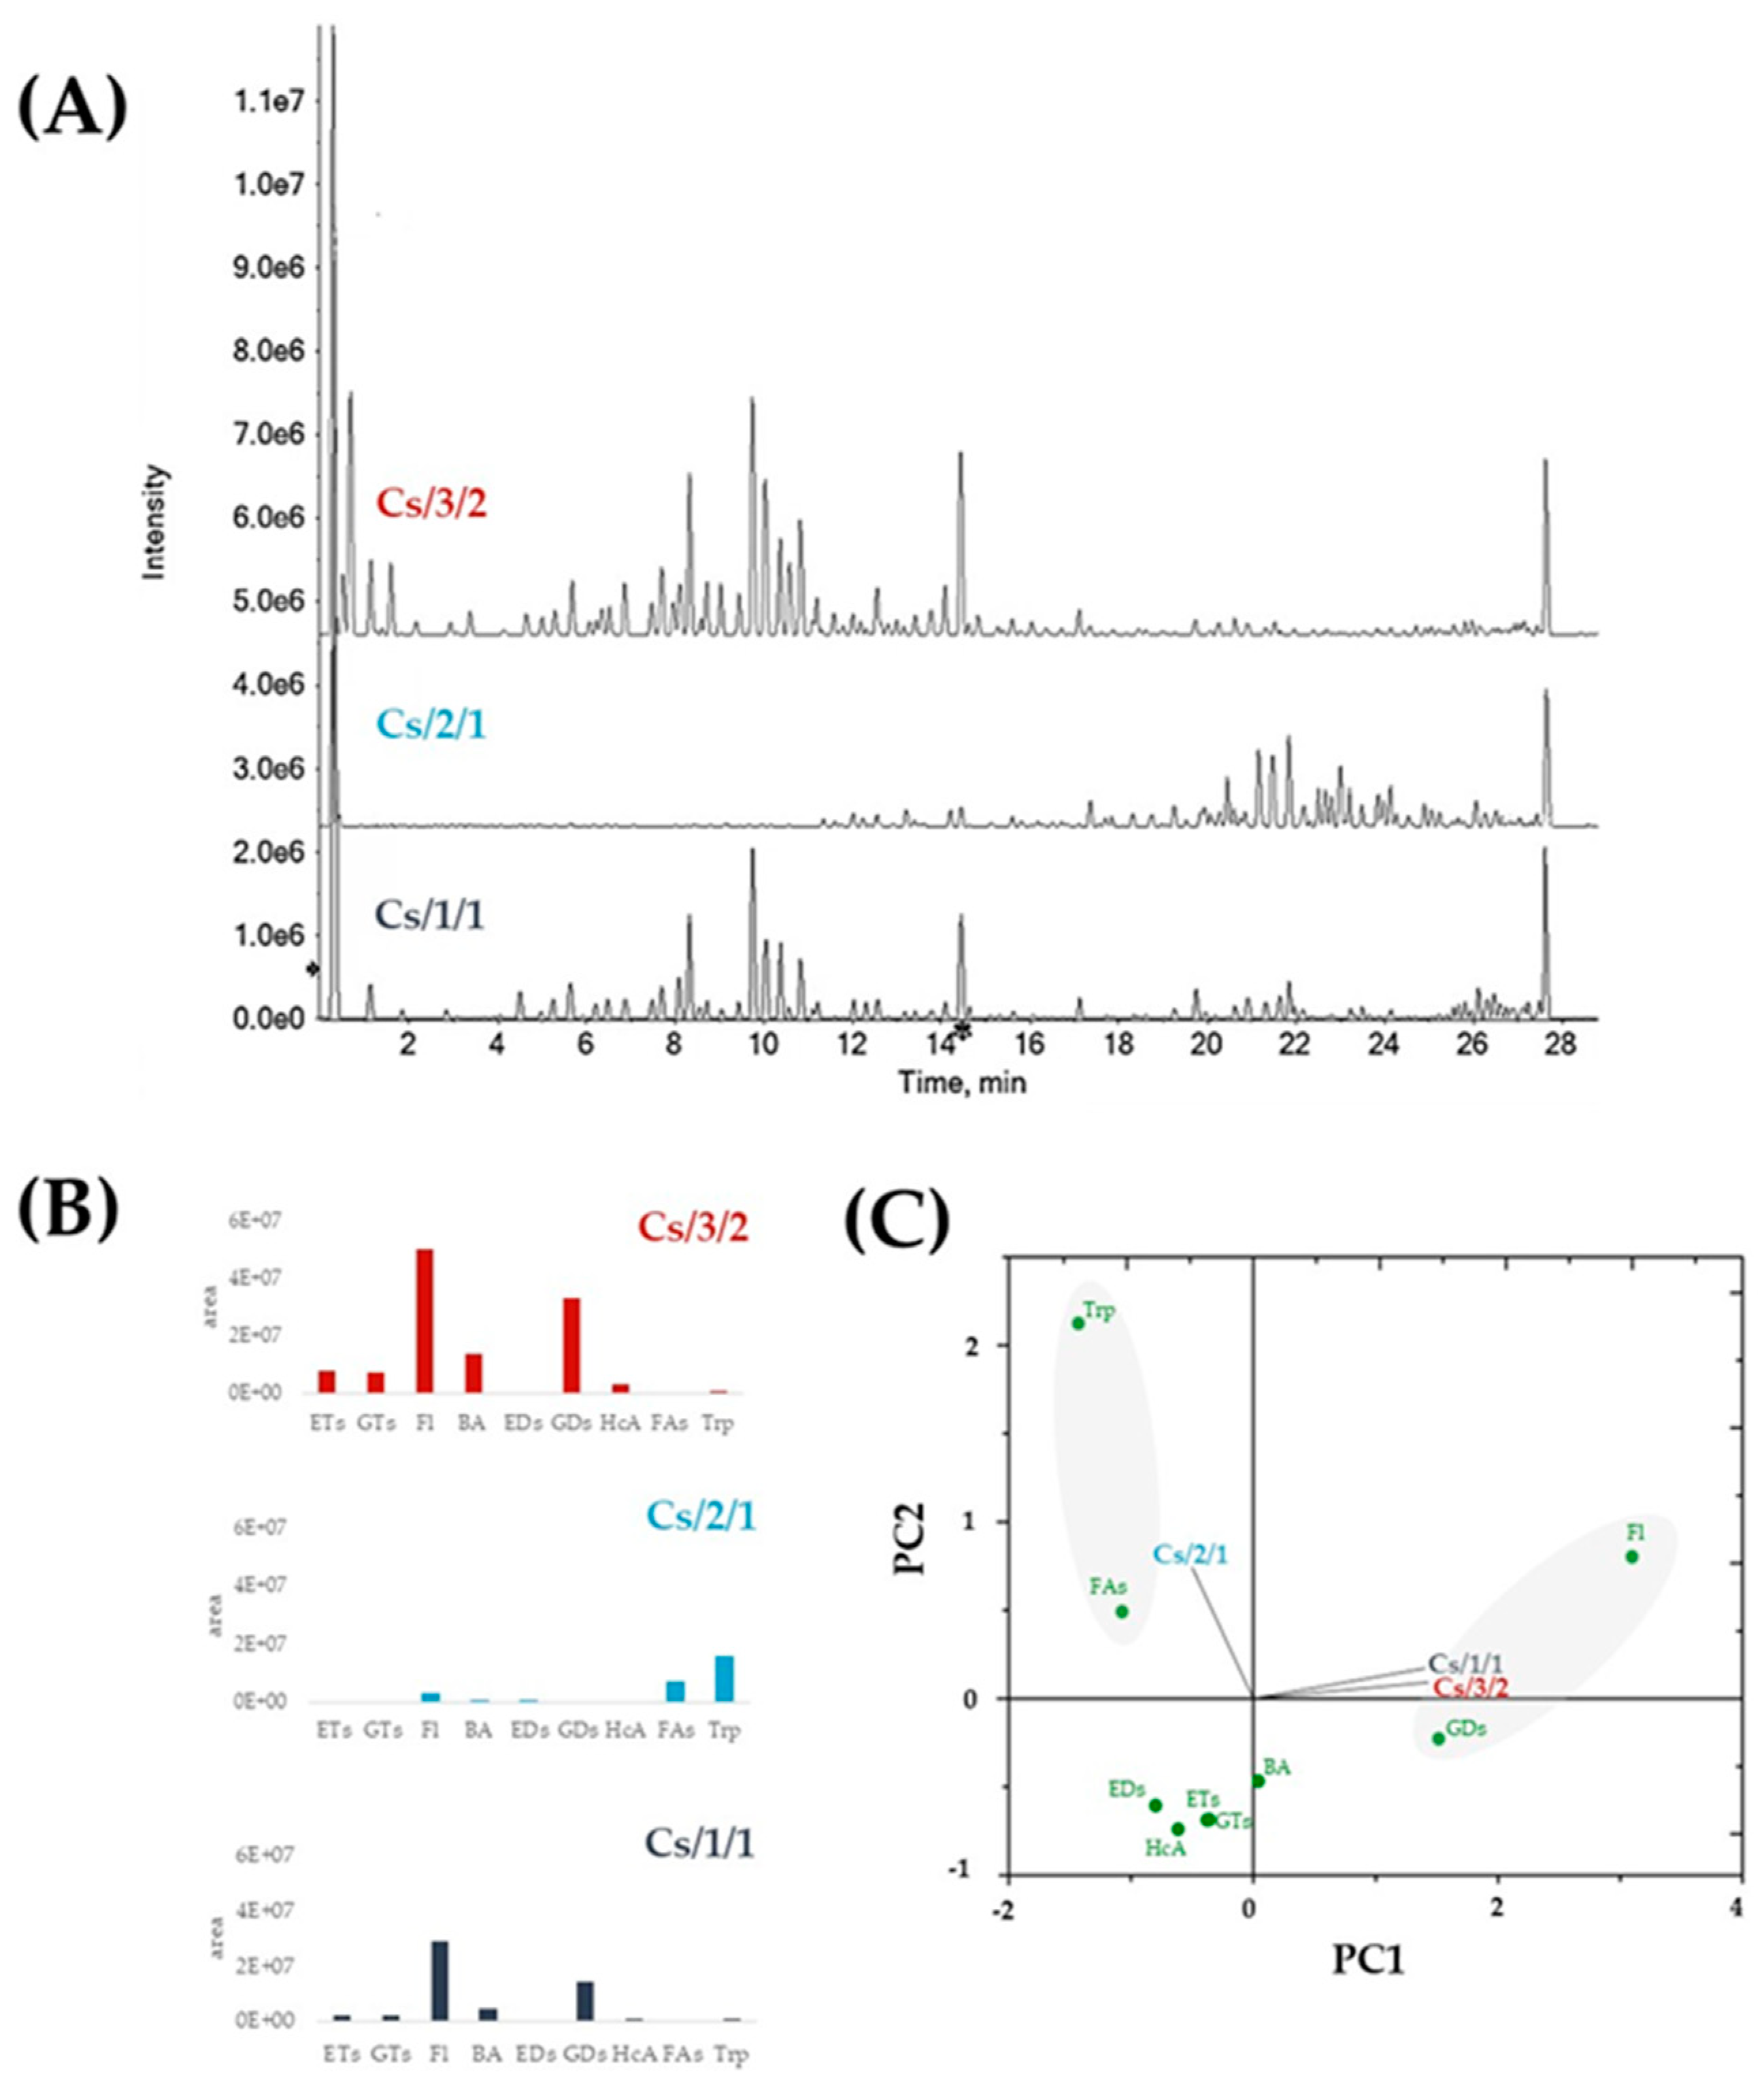
2.1. Chemical Investigation of Alcoholic Leaf Extract and Cs/2/1 and Cs/3/2 Fractions

According to literature data, C. sativa leaf extracts, obtained using different alcoholic or hydroalcoholic extractants, are a promising source of natural antioxidants [25,26]. The bioactivity of chestnut leaf extracts is involved in suppressing the Nrf2-mediated antioxidant system in cancer stem cells through ROS accumulation and apoptosis-inducing effects [25], as well as by attenuating TLR2- and TLR4-induced inflammatory responses [26]. These and other properties made chestnut leaves usable in topical applications for preventing and/or treating oxidative stress-mediated diseases and photo-ageing [6,27,28,29]. In addition, Castanea sativa leaf showed antimicrobial activity against such multiresistant bacteria as Staphylococcus epidermidis, S. aureus, and Pseudomonas aeruginosa [30]. Herein, in order to hypothesize the use of this forest residue in ruminant feeding, the chemical composition in terms of specialized metabolites was tentatively determined by means of UHPLC-HR MS/MS analyses. These latter, firstly carried out on the alcoholic chestnut leaf extract, highlighted the occurrence of ellagitannins, and flavonoid mono- and di-glycosides, beyond fatty acids and terpene compounds. When fractionation was carried out, tannins and flavonoids appeared to constitute Cs/3/2. This was confirmed by the UV-Vis spectrum of the fraction (Figure S2, Supplementary Material), whose bands at 365, 267, and 215 nm were in line with flavonoid and gallo- and ellagitannin electronic transitions [31]. Different spectroscopic and spectrometric behavior was noted for Cs/2/1 fraction. In fact, the UV-Vis absorption bands occurred at 667 and 415, attributable to chlorophylls and carotenoids, and at 236 and 205 nm. These latter are commonly ascribed to fatty acids and their oxidative derivatives, as well as to triterpenoids. Indeed, the mass spectra of Cs/2/1 compounds ascertained a complexity greater than that of Cs/1/1, due to the triterpenes, acylated flavonoids, and ellagic acid methyl derivatives. In Table 1, Table 2, Table 3 and Table 4, as well as Table S1, data from UHPLC-QqTOF-MS/MS analyses on all three extracts are reported. The relative quantification assessment was also performed and plotted using principal component analysis (PCA; Figure 3C).

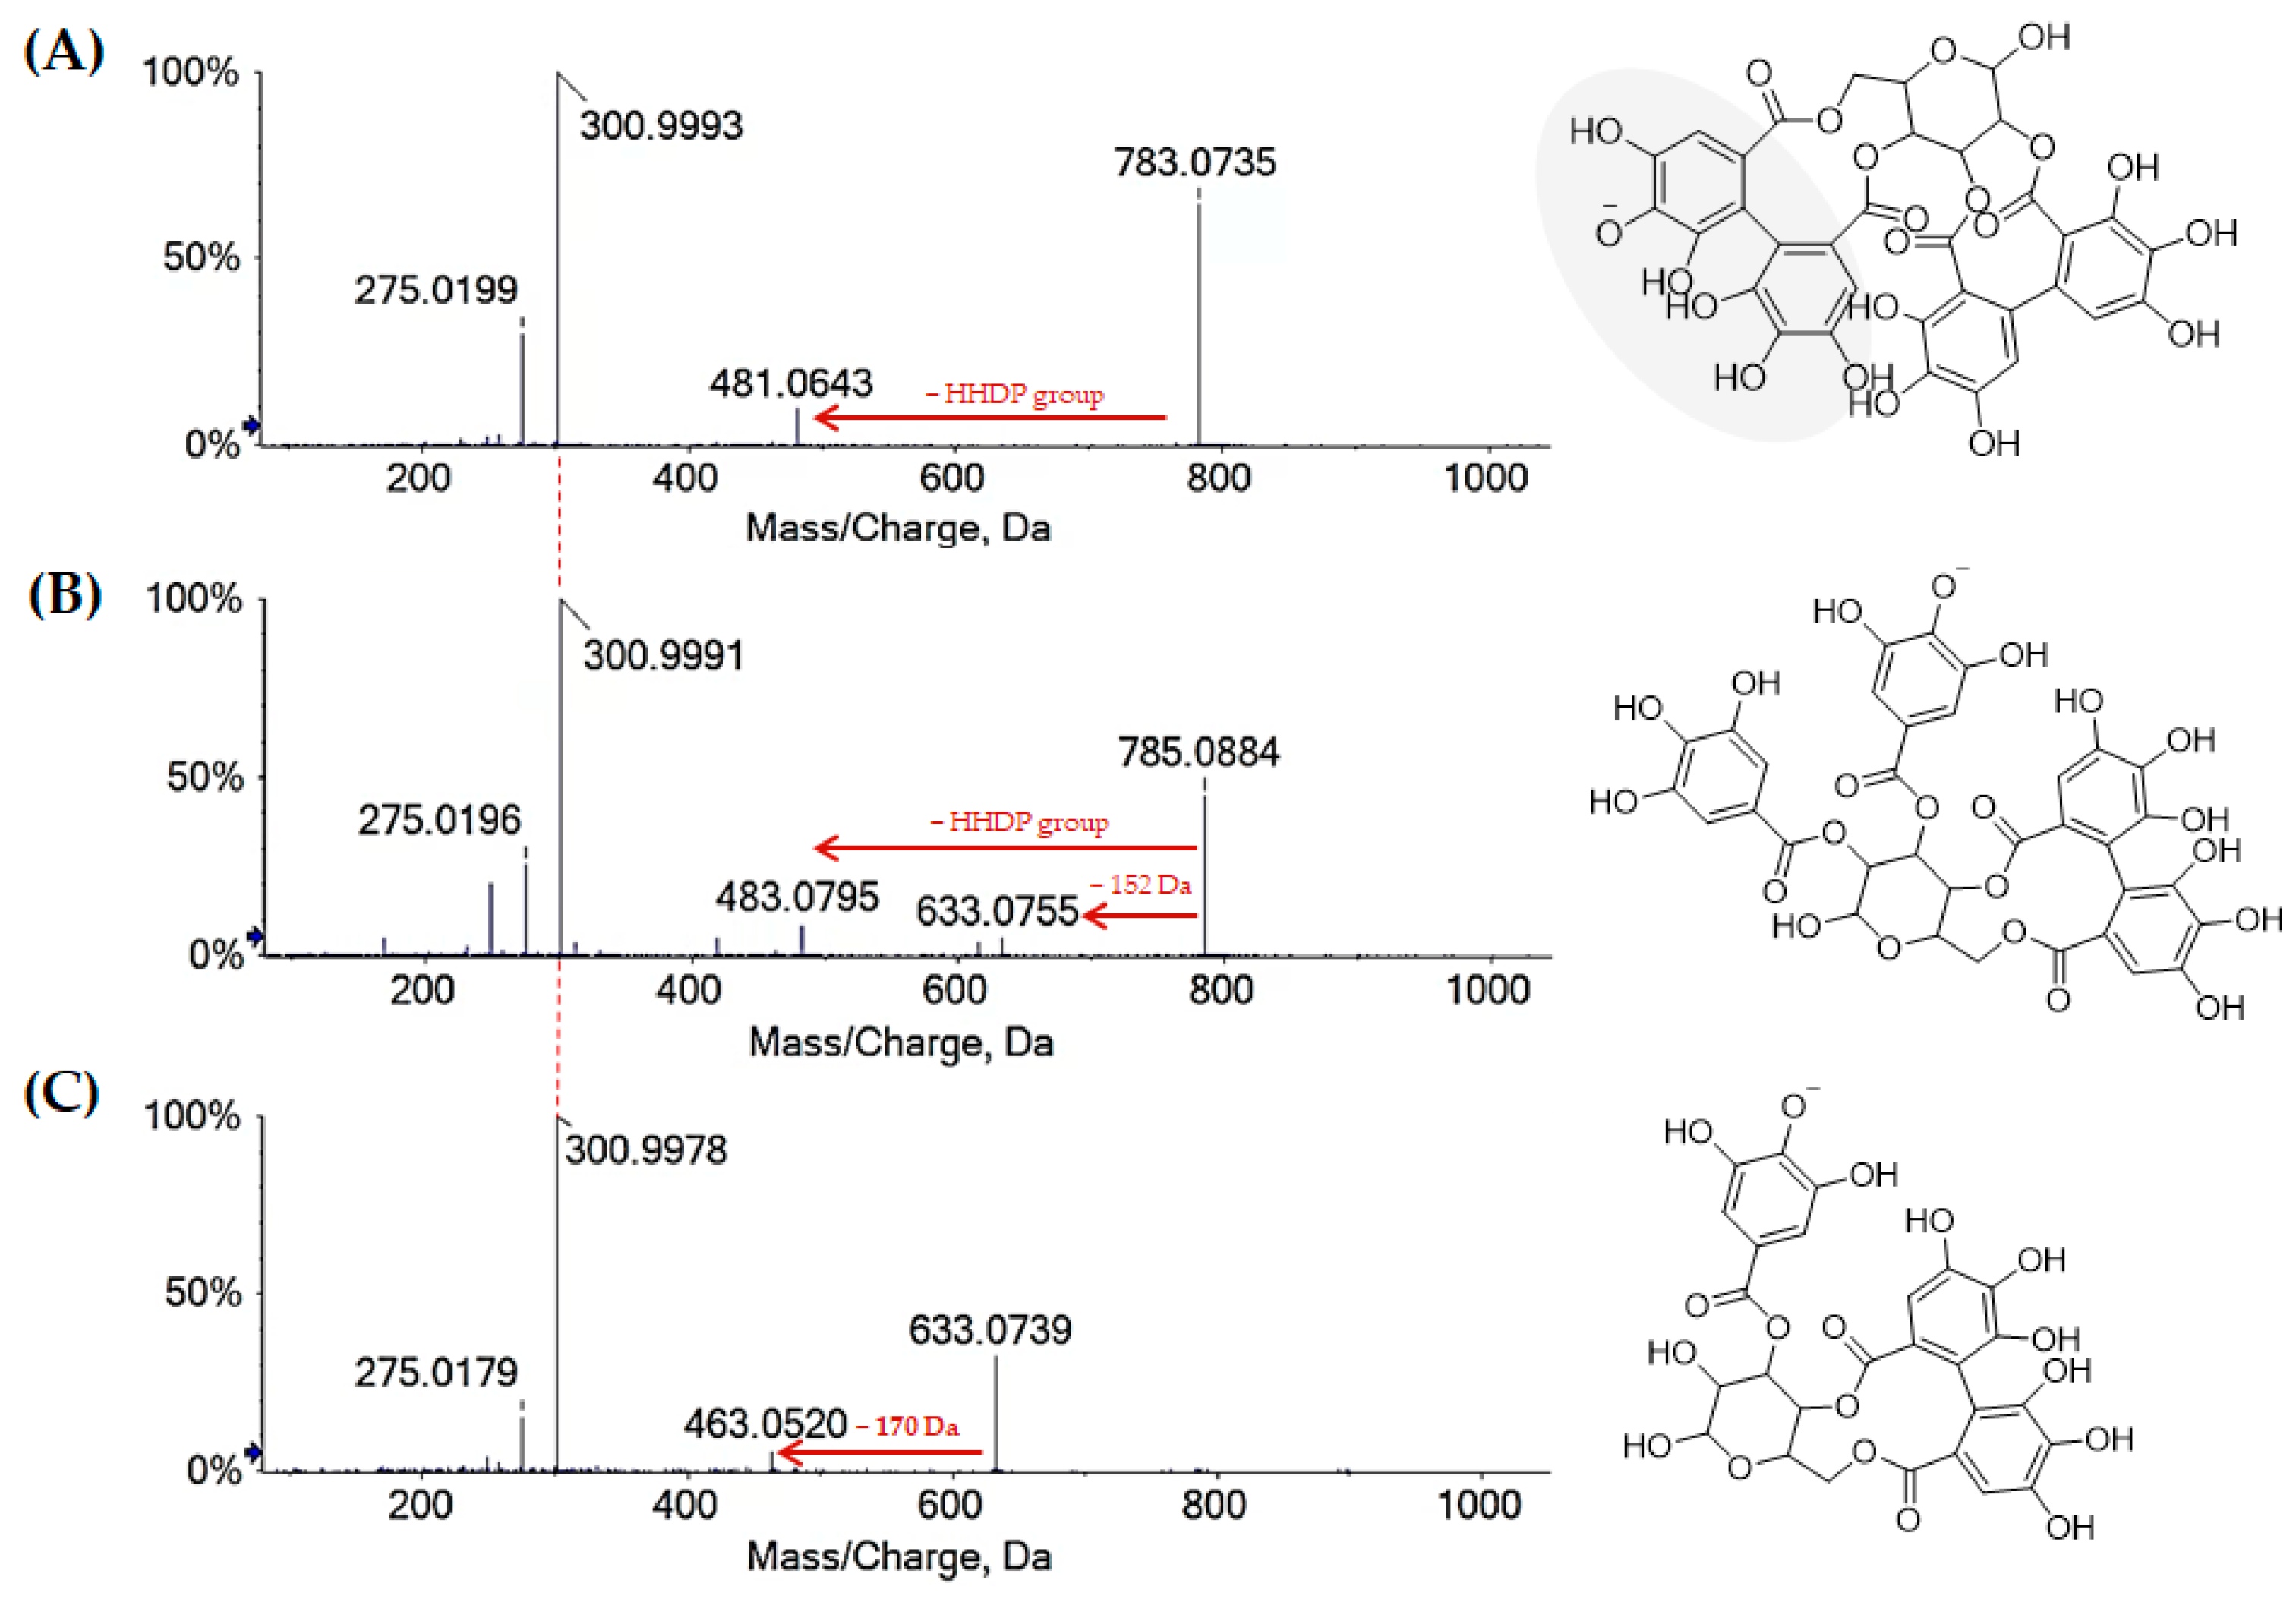
2.1.1. Chestnut Leaf Tannins and Beyond

Among the polar minor constituents of the chestnut alcoholic extract (Table 1 and Table 2), the greater part was found only in the Cs/3/2 fraction together with gallo- and ellagitannins.
Quinic acid (1) and a dihydroxybenzoic acid hexoside ([M-H] at m/z 315.0724; 10; Figure S3, Supplementary Material) were mainly found together with gallic acid (5), hexahydroxydiphenic acid (4; Figure S4, Supplementary Material) with deprotonated molecular ion at m/z 337.02, and its decarboxylated derivative with [M-H] at m/z 293.03 (3). Three galloyl hexose isomers (2, 6, 12; Figure S5, Supplementary Material; Table 2), mainly differing in the glycosylation site, the digalloyl hexoses 7 and 30 (Figure S6), and digalloyl deoxyhexoside (38) with [M-H] ion at m/z 467.0843 were tentatively identified. Tri- and tetragalloyl hexosides were also recognized (33, 43, and 47). Galloyl moiety was identified based on the characteristic loss of 152.01 Da and fragment ions at m/z 169.01 and 125.02, and radical ions at m/z 124.01. It was found in galloyl shikimic acids (14, 16, and 18), which shared the [M-H] ion at m/z 325.05 and the loss of 156.05 Da, as well as in galloyl dihydroxybenzoic acid (17; Figure S7, Supplementary Material). Galloyl benzyl alcohol (8 and 11) and phenol (40 and 42) hexosides, previously identified in chestnut and reported as crenatin and cretanin isomers [32], were also tentatively identified (Figure S8, Supplementary Material). Chestanin (49) and isochestanin (58), both with the [M-H] ion at m/z 937.19, were identified. The TOF-MS/MS spectra of these compounds differed for the fragment ion at m/z 637.1067, detectable only for compound 49, which was from the loss of the terminal trihydroxy benzyl hexose unit (Figure S9, Supplementary Material). Among the hydroxycinnamoyl based compounds (Table 1), 5-O-caffeoyl quinic acid (26), and p-coumaroyl quinic acid isomers (35 and 36) were detected, as well as the hexosides of p-coumaric acid (20 and 22) and caffeic acid (24) [33].
Ellagitannins (ETs) and flavonoids accounted for a large part of Cs/3/2. Indeed, although some acylated flavonoids derivatives were also found as constituents of the apolar Cs/2/1 fraction, ellagitannins were only found in Cs/3/2 in higher amounts than in Cs/1/1 (Figure 3B; Table 2). The negative UHPLC-HRMS spectra of these compounds mostly showed, other than the deprotonated molecular ion, the doubly charged molecular ion [M-2H]2−. Highly diagnostic fragment ions, due to neutral losses of ellagic acid or hexahydroxydiphenoyl moiety (302 Da), galloyl moiety (152 Da), galloyl-hexose (332 Da), HHDP-hexose (482 Da), and galloyl-HHDP-hexose (634 Da), allowed ETs to be putatively identified [31]. The hexahydroxydiphenoyl (HHDP) residue, whose intra-molecular esterification reaction provided ellagic acid, was the main chemical feature of most of ETs monomers. This residue can oxidize, forming the dehydrohexahydroxydiphenoyl (DHHDP) residue, which in turn gives rise to the chebuloyl moiety. Furthermore, the coupling of HHDP with another galloyl residue provides the nonahydroxytriphenoyl (NHTP) group, characteristic of C-glycosidic ETs with an opened hexose core [31]. Herein, different ETs, also sharing chebuloyl or valenoyl groups, were tentatively identified. Compounds 9 and 15, with [M-2H]2− ion at m/z 466.0328(6), in accordance with the molecular formula C41H26O26, were tentatively identified as NHTP-HHDP-hexose isomers (e.g., castalagin/vescalagin). These compounds were previously found as constituents of an antioxidant and cardioprotective alcoholic extract from Castanea sativa Mill. burk, together with ellagic acid and other minor ETs [34]. Compounds 28 and 31, with the [M-H] ion at m/z 935.0818(01), as well as compound 41, were tentatively galloyl-bis-HHDP-hexose. The TOF-MS/MS spectra showed the consecutive losses of H2O and CO2, providing fragment ions at m/z 917.07 and 873.08, respectively, whereas the losses of 152 Da (galloyl moiety) and 302 Da (HHDP group) led to fragment ions at m/z 783.07 and 633.07, respectively.
Compounds 21 and 32 were likely derivatives of compounds 28 and 31 through a putative HHDP oxidation. In fact, TOF MS/MS spectra of both the isomers highlighted the loss of a chebuloyl moiety to achieve, from the deprotonated molecular ion at m/z 953.09, the ions at m/z 785.08 and 633.07, respectively. Furthermore, compound 32 showed the [M-H-H2O] and [M-H-CO2] ions at m/z 935.0828 and 909.1031, while only the decarboxylated ion was found for compound 21, possibly due to a different accessibility of hydroxyl group. Bis-HHDP-hexose isomers ([M-H] at m/z 783.07) were compounds 13 and 19, most likely casuariin or pedunculagin isomer. Additionally in this case, the loss of HHDP-group (302 Da) provided the ion [M-H-HHDP] at m/z 481.0624(43), corresponding to HHDP-hexose structure (Figure 4A). A key reaction of ellagitannins is the release of the bislactone and formation of a HHDP ester group, which undergoes rapid lactonization to yield ellagic acid.
Compounds 25 and 37 were tentatively identified as digalloyl-HHDP-hexoses (Figure 4B). In the TOF-MS/MS spectra of both the compounds, the typical losses of galloyl, gallic acid, and HHDP group were observed within fragment ions at m/z 633.0775, 615.0650, and 483.0795 for compound 25, and 633.0755, 615.0645, and 483.0799 for compound 37. Compound 27 ([M-H] at m/z 633.0742) was tentatively identified as galloyl-HHDP-hexose (Figure 4C).
The TOF-MS/MS spectrum of the compound 23 ([M-H] at m/z 951.0761) suggested HHDP-valoneoyl-hexose occurrence (Figure S10). The 168 Da loss provided the fragment ion at m/z 783.0708. This loss could be attributable to the decarboxylation of the [M-H] ion to give the [M-H-CO2] ion at m/z 907.0857, which further lost 124 Da. When the [M-H-CO2] ion lost 302 Da, the ion at m/z 605.0796 was formed, whereas the loss of the HHDP residue from the ion at m/z 783.0708 supplied the ion at m/z 481.0693. Methylvaloneoyl-NHTP-hexose was also recognized (29); the ions at m/z 933.0706 and 631.0572 were in line with [M-H-C8H6O5] and [M-H-C22H14O13], whereas methylation on valoneoyl group was also confirmed by the base peak at m/z 181.0132. Instead, compound 44 with [M-2H]2− ion at m/z 552.0490 was tentatively identified as tri-galloyl-valoneoyl-HHDP-hexose (e.g., rugosin A). The structural hypothesis was confirmed by the TOF-MS/MS spectrum, which, beyond the characteristic losses of 152 (galloyl), 170 (gallic acid), and 302 Da (HHDP), showed the loss of 168.00 Da from the deprotonated molecular ion to provide the fragment ion at m/z 937.1942.
Chesnatin (34) was differentiable from isochesnatin (39), while compound 45 was tentatively identified as trigalloyl-HHDP-hexose. Furthermore, compound 48 with [M-H] at m/z 433.0415 was likely an ellagic acid pentoside; TOF-MS/MS spectrum showed the neutral loss of dehydrated pentose providing fragment ions at m/z 300.9979 and 299.9902, diagnostic for ellagic acid. In the apolar fraction Cs/2/1, trimethylellagic acid isomers (82 and 87) and their hexosyl (69) or deoxyhexosyl (81) derivatives occurred. Trimethylellagic acid glycosides were detected in the TOF-MS spectra as formic acid adducts with [M+HCOOH] ion at m/z 551.1057 (69) and 535.1106 (81) for the lack of a primarily acid site being all phenolic hydroxy groups methylated or involved in the glycosidic bond.

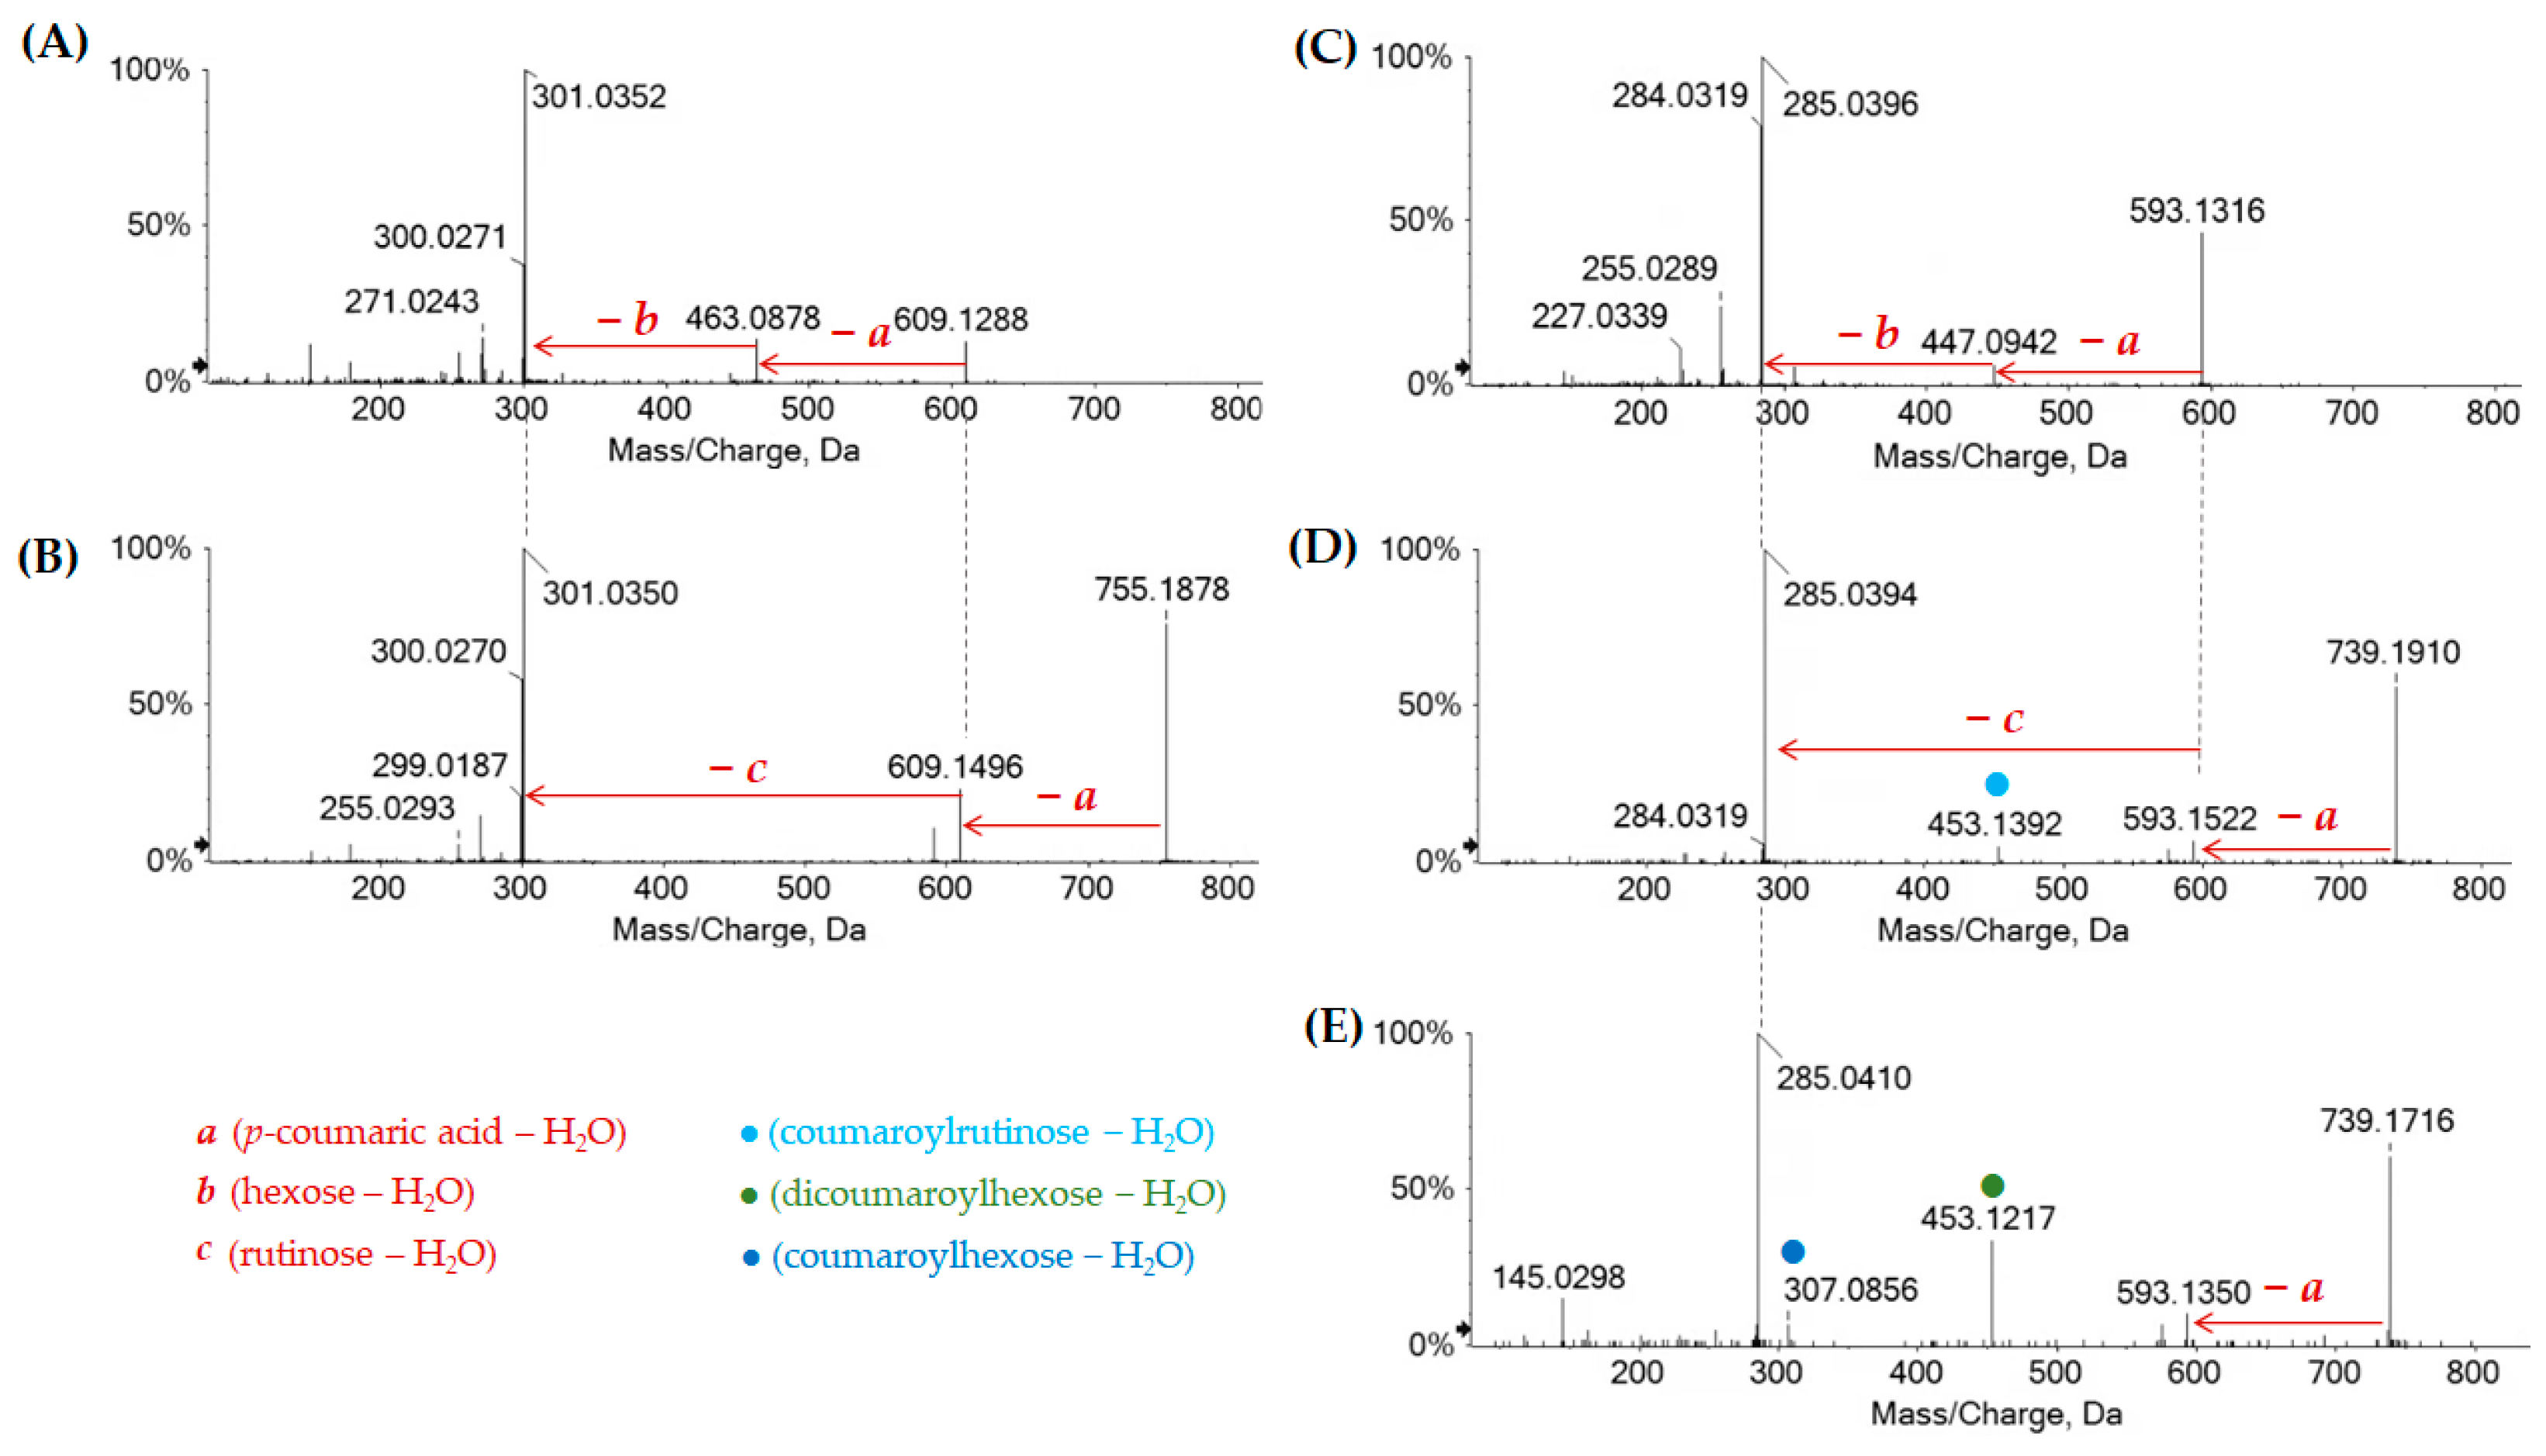
2.1.2. Chestnut Leaf Flavonoids

Flavonoids in the investigated chestnut leaf extract and derived fractions are listed in Table 3. Quercetin (71, [M-H] ion at m/z 301.0354), kaempferol (80, [M-H] ion at m/z 285.0403), isorhamnetin, and methylkaempferol (89, [M-H] ion at m/z 299.0559) were found as the most abundant flavonol aglycone cores. Flavones, such as luteolin (72, [M-H] ion at m/z 285.0398), and acacetin (93, [M-H] ion m/z 283.0611), were also tentatively identified as constituents of Cs/2/1 and Cs/3/2 fractions. The discrimination between kaempferol and luteolin was based on their relative retention time and the presence/absence of the luteolin diagnostic fragment ion at m/z 133.0297. Quercetin pentosyl-hexoside (46), quercetin hexuronides (50 and 54), quercetin 3-O-hexosides (51, 53, and 55), quercetin 3-O-pentoside (57) and rutin (52) were tentatively identified. Neutral losses of 294.09 (dehydrated hexose + pentose), 176.03 Da (dehydrated hexuronic acid), 162.05 Da (dehydrated hexose), 132.04 Da (dehydrated pentose), and 308.11 (dehydrated hexose + deoxyhexose) suggested the glyconic moiety identity. Different mono- (61, 64–66, and 68) and diglycosidic (62 and 67) derivatives of isorhamnetin were also identified. TOF-MS/MS spectra of compounds showed the classic neutral losses of hexose, deoxyhexose (−146.05 Da), hexuronidyl, and deoxyhexosyl-hexose, providing the [aglycone-H] and [aglycone-H]●+ ions at m/z 315.05 and 314.04, respectively, from which the loss of 15 Da occurred, generating fragment ions at m/z 300.02 and 299.0195. Quercetin and kaempferol acylated derivatives were also recognized in fraction Cs/2/1. Metabolite 75 ([M-H] ion at m/z 609.1258) and metabolites 76 and 79 ([M-H] ion at m/z 755.1850(4)) were tentatively identified as quercetin p-coumaroyl-hexoside and quercetin p-coumaroyl deoxyhexosyl hexoside, respectively (Figure 5A,B). Furthermore, mono- and di-p-coumaroyl kaempferol glycosides were also detected (77, 83, 85, 86, 91 and 92) (Figure 5C–E).
Acyl glycosides of quercetin and kaempferol were putatively identified through the neutral losses of 308.09 Da (p-coumaroylhexose-H2O), 454.15 Da (p-coumaroyldeoxyhexosylhexose-H2O), and 454.13 Da (di-p-coumaroylhexose-H2O). The TOF-MS/MS spectrum of compound 78 ([M-H] at m/z 533.1316) was in accordance with the butyl-ester of quercetin hexuronide. In fact, the loss of dehydrated glucuronic acid (−176 Da) and the neutral distinctive loss for butyl group (−56 Da) were observed. This compound was also identified in Gaultheria procumbens L. [35] and Vitis vinifera L. leaf [36], showing an inhibition and synergic effect in combination with clarithromycin against Helicobacter pylori. Among the kaempferol derivatives, two kaempferol deoxyhexosyl-hexosides (60 and 63) and acetylhexosides (70 and 73) were also tentatively identified, together with mono- and diacetylated kaempferol p-coumaroylhexoside and di-p-coumaroylhexoside (88, 96, 97, 100 and 102), which were only in the apolar Cs/2/1.

2.1.3. Chestnut Leaf Lipids

Beyond flavonoids, the alcoholic extract and mainly its fraction Cs/2/1 contained fatty acids and terpenoids (Table 4). Among fatty acids, there were dodecanedioic acid (84, [M-H] at m/z 227.1291), likely traumatic acid, 9-oxooctadeca-10,12-dienoic acid (106, [M-H] at m/z 293.2123) and 9-oxooctadeca-10,12,15 trienoic acid (108, [M-H] at m/z 291.1965). These latter were previously identified in F. sylvatica L. apolar leaf fraction [15]. Tri- and di- unsaturated C18 fatty acids were also recognized as linolenic (116) and linoleic (119) acids, respectively. Furthermore, a glycerolipid (105) and glycerophospholipids (109 and 111) were also detected [22,37]. Compounds 109 and 111 were tentatively identified as lyso-PA (18:3) and lyso-PA (16:0), respectively for low intensities of their linked fatty acids [38].
Furthermore, fraction Cs/2/1 accounted for a substantial triterpene component. According to literature data, different cycloartane-type triterpenoids were found in Castanea cornata burs [39], and ursane and oleanane derivatives were found in C. sativa leaf [40]. The [M+HCOOH] ion for the compound 90 at m/z 695.4037 was in accordance with the 3,7,24-trihydroxy-cycloartene-28-oic acid hexoside [22,39]. The TOF-MS/MS spectrum displayed the ion at m/z 487.3450 (formed by the loss of 162.05 Da from the detectable deprotonated molecular ion, with a theoretical m/z value of 649.3972), which gave the fragment ion at m/z 469.3326 and 441.3377 through the relative losses of 18 Da and 44 Da.
Compound 94, with [M-H] ion at m/z 461.2921 and molecular formula C27H42O6, was tentatively identified as 3,7-dihydroxynorcycloartane 24,28-dioic acid [39]. The consecutive losses of H2O (18 Da) and CO2 (44 Da) from the deprotonated molecular ion provided fragment ions at m/z 443.2808 and 397.2786, whereas the direct loss of carbon dioxide provided fragment ion at m/z 415.2846. Indeed, compound 98 was likely a derivative of the previous compound, in which aldehydic group was instead of carboxylic one in the chain. Compounds 99, 101, and 103, with [M-H] ion at m/z 487.34 could be also cycloartane-type terpenoids, while compound 98 was putatively identified as a hydroxyl derivative of compound 95. Recently, castaartancrenoic acids D and E, sharing the molecular formula C30H47O5, were isolated from the burs of Castanea crenata [39]. Compounds 104, 107, 111, 112115, and 117 were likely ursane/oleanane type triterpenoids [40]. Recently, two new ursane-type triterpenoid saponins named chestnoside A and chestnoside B were identified [41]; however, little information is available in the literature on the isolation and identification of these metabolites in Castanea sativa Mill.

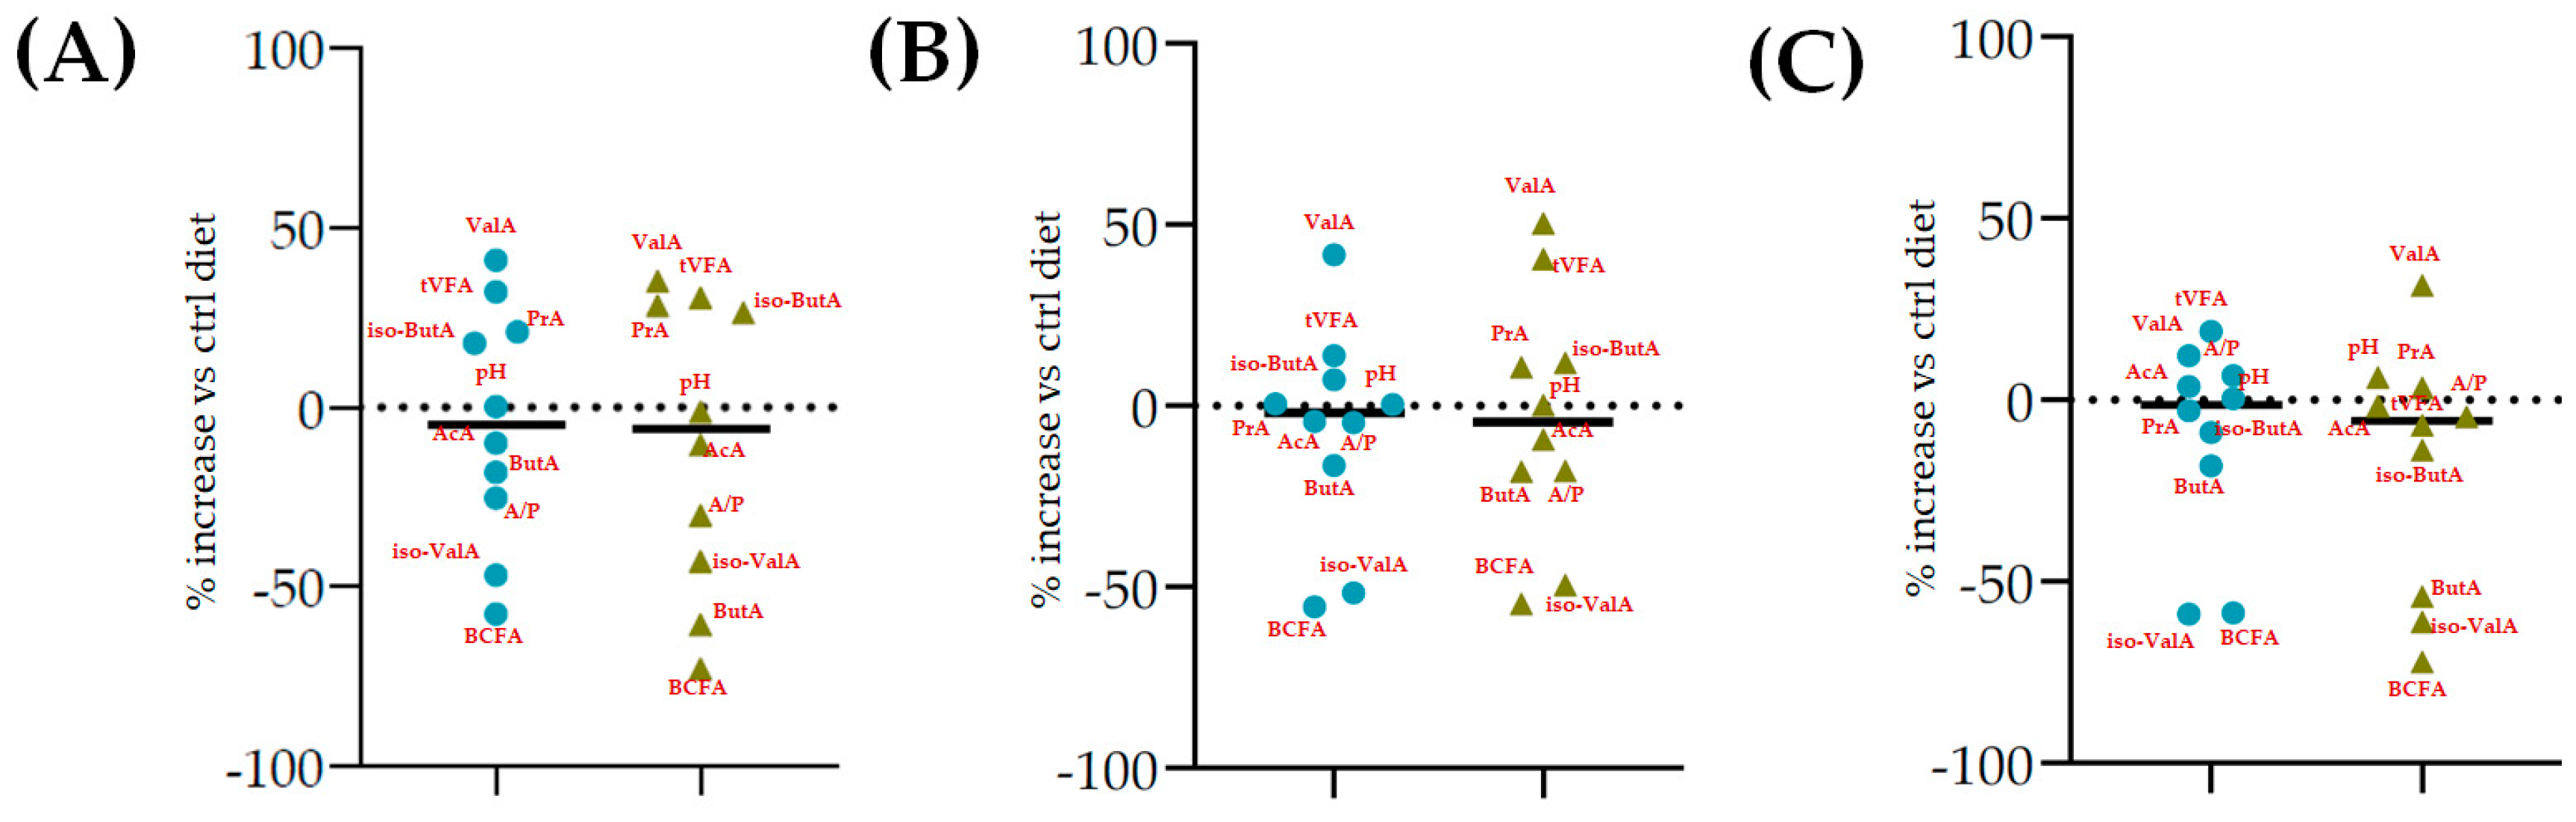
2.2. Effects of Chestnut Leaf Alcoholic Extract and Its Fractions on In Vitro Rumen Fermentative Activity

The use of bioactive compounds as natural feed supplements has been extensively studied as a strategy to manipulate rumen fermentative activities, and the effects of flavonoid and tannin extract as supplements in animal nutrition have been increasingly investigated, especially for ruminants. The availability of literature for condensed tannins (CTs) is extensive, whereas hydrolysable tannins (HTs) have been less extensively explored in animal nutrition, even if little attention is given to the chemical composition of the treated extracts. Data about the rumen fermentation effects of Castanea sativa extracts leaf and/or only leaves are scarce [42]; however, different studies reported the effects of chestnut involucre or tannin wood extracts on ruminal fermentation [13,43,44,45].
Nonetheless, herein, the presence of other bioactive compounds, such as flavonoids, triterpenes, or fatty acids, in the Cs/1/1 and Cs/3/2 fractions might interfere and modulate the tannin effects. Tannins generally exert a dual mechanism: high doses reduce voluntary feed intake and nutrient digestibility, whereas moderate concentrations can improve nutrient utilization. Moreover, tannins modify the digestive processes of ruminants not only by binding dietary protein, but also through modulation of rumen microbiota; not surprisingly, hydrolysable and condensed tannins as well as flavonoids are considered as antimicrobial feed additives, due to their antibacterial and antiparasitic activity [46]. Furthermore, these secondary metabolites can inhibit the enzymatic activity of microbial protease and urease into the rumen [47]. The supplementation of polyphenols in ruminant diet can modulate the diversity and activity of rumen microorganisms, the nutrient degradability and rumen methanogenesis. The differences between substrates in the fermentation process are clearly illustrated in Table 5 and Figure 6, where the gas production rate and in vitro fermentation rate over time are shown. The organic matter degradability (OMD) after 120 h of incubation showed, for the all-chestnut-based diet, values lower than the control diet. It was observed that chestnut tannins linearly decreased OMD [48] as well as Castanea sativa leaves [42]. Analyzing the fermentation effects of tannic acid (HT) and quebracho tannins (CTs) on wheat and corn grain, Martìnez et al. [49] highlighted a reduction in gas production after 24 h of incubation by means of a physical mechanism. Scanning electron microscopy (SEM) revealed that both sources of tannins slowed starch hydrolysis through degradation of the endosperm protein matrix. Due to their chemical structure, tannins can bind protein through hydrogen bonds forming tannin–protein complexes that are stable at the rumen pH (5.0–7.0) [50]. Similarly, except for Cs/1/1 at the 200-mg dose level, the tested samples produced a lower amount of gas (OMCV) than the control diet. In particular, the lipophilic fraction Cs/2/1 exhibited the lowest values (p < 0.001) for OMD and OMCV at both tested dose levels. Furthermore, the Cs/2/1-200 mg sample showed the lowest value for Tmax and a significative decrease (p < 0.05) for Rmax. Beyond the Cs/2/1-200 mg dose level, for the Cs/3/2-50 mg sample, a reduction in both parameters Tmax and Rmax was also noted.
The fermentation rates after 24 h of incubation following the different C. sativa extract supplementations are reported in Table 6, while data acquired in terms of pH and the relative concentration of the fermentation end products are listed in Table S2 and represented by the scatter plot in Figure 7. In vitro fermentation end products after 120 h of incubation were reported in Table 7, and according to the single volatile fatty acids, are reported as proportion (%) of single volatile fatty acids within the total volatile fatty acid (VFAs) content, expressed as mmol/L (Table 7).
The results after 24 h of incubation showed that supplementation with the extract does not depress degradability; even the 200 mg dose levels of three extracts seemed to significantly improve organic matter degradability (OMD). The rumen pH did not appear to change after 24 h. By contrast, Hassanat and Benchaar [43] demonstrated a significant increase in rumen pH after only 24 h of incubation with different tannin extracts sources (i.e., chestnuts, acacia, quebracho, and valonia). In our case, after 120 h, the rumen pH was significantly modified by the chestnut alcoholic extract and its fractions. In particular, the Cs/2/1-50 mg sample showed the highest value of rumen pH followed by Cs/1/1-50 mg and Cs/1/1-200 mg samples. Only the Cs/3/2-200 mg sample showed a slight increase (p < 0.05) in rumen pH. Dìaz-Carrasco et al. [51], evaluating the effects of chestnuts and quebracho tannins on rumen microbiota, highlighted that tannin addiction increased ruminal pH.
Furthermore, all the extracts depressed methane production related to incubated organic matter and organic matter degradability. This was particularly true of Cs/1/1 and Cs/2/1 supplementation, and appeared to correlate with acetate and propionate production data (Figure 7). Hydrolysable tannins, as well as condensed ones, decreased the total methanogen population, with a positive effect on methane production [16]. Generally, the ability of polyphenols to reduce methane emissions could be due to the decrease in NDF degradation, which leads to a reduction in acetate synthesis, and eventually, to a decrease in the availability of electron donors for the methanogens [52]. Indeed, the reduction in acetate with the increase in propionate plays a key role in establishing an internal hydrogen balance by regulating methanogenesis. The formation of acetate from pyruvate produces metabolic hydrogen, the main substrate of methanogenesis, which is consumed by the formation of propionate from pyruvate [53]. After 24 h of incubation, acetic acid was reduced in all samples tested, with the sole exception of Cs/3/2-50 mg, which favors a 3.7% increase over the control diet. Instead, propionate increased significantly following treatment with Cs/1/1, and decreased only by Cs/3/2-50 mg. The higher molar proportion of propionate in the in vitro fermentation system may be associated with a lower count of protozoa produced by tannins [47,50]. Unsurprisingly, the Cs/3/2-50 mg fraction showed the lowest inhibition of methanogenesis and the highest increase in the A/P ratio, which was reduced by all treatments. Total VFAs increased to the highest percentage with Cs/2/1-200 mg treatment, followed by alcoholic extract at both dosages, which increased by between 32.2% and 30.5%. In contrast, Castanea sativa leaf reduced total VFAs with a higher percentage of propionate after 24 h incubation, producing low total gas and CH4/digestible organic matter. This, as previously hypothesized, could be achieved without a significant reduction in bacterial and protozoal counts [42]. Unlike the 120 h of incubation, during the first 24 h, butyric acid underwent a notable decrease, mainly at the dose of 200 mg of both the Cs/1/1 extract and its Cs/3/2 fraction. These results are only partially in line with Castro-Montoya et al. [48], who, testing different doses of chestnut tannins (0.5, 0.75, 1 mg/mL) for 24 h of incubation, found a significant decrease in acetate and A/P with a linear increase in propionate. An opposite trend was obtained for total VFAs, butyrate, valerate, and branched-chain fatty acids (BCFA). In addition, valerate increased at all doses tested by up to 50.3% after treatment with Cs/2/1-200 mg.
After 120 h of incubation, while some parameters maintained their trend (e.g., total VFAs, acetate, propionate, iso-valerate), others showed an inversion (e.g., pH, butyrate, valerate, iso-butyrate). Furthermore, the total VFAs increased, and the observed effect for all the tested samples appeared to be dose-dependent (Table 7), except for Cs/3/2. Cs/2/1-200 mg increased the VFA content by a percentage of 54.2% compared to the control diet, followed by Cs/3/2-50 mg, which was able to increase its VFAs by 1.4 times. However, previous reports on chestnut wood tannins (CTWs) highlighted that CTWs did not significantly increase total VFAs [45], or even observed a reduction in VFAs with CTWs [43,54]. The significant effect on VFAs in this study was probably attributable to the high flavonoid content of chestnut leaves [15]. Among the main volatile fatty acids (acetate, propionate, and butyrate), only for propionic and butyric acid was an increase recorded for all the dose fractions tested, while acetate decreased. Propionate increased in various degrees; the Cs/1/1 extract at 50 and 200 mg dose levels was able to increase it by 42.4 and 64.9%, respectively. Both dose levels of Cs/2/1 fraction enhanced propionic acid production, whereas Cs/3/2 resulted in a dose-dependent reduction. Data on acetate levels could be justified by the ability of compounds therein to inhibit acetate-producing bacteria (e.g., Ruminococcus albus, Butyrivibrio fibrisolvens), either by direct action or by inhibiting the production of their substrates [48]. To support this hypothesis, in a previous study testing increasing levels (0, 5, 10, 15, and 20 g/kg of diet DM) of A. mearnsii CTs in the diets of Jersey steers, it was found that the ruminal protozoa population was not affected by CTs, while protein digestibility, ruminal pH, and acetate proportion decreased [55]. The A:P ratio appeared to significantly (p < 0.001) decrease at all diet dose levels. Furthermore, Cs/1/1-50 mg and Cs/2/1 at both doses showed a similar increase in butyrate. Moreover, a non-significant variation intra-dose of butyrate was recorded for the Cs/3/2 fraction. The Cs/3/2-200 mg dose level showed the lowest decrease in acetate, with a value equal to 60.3% VFA. It was seen that a chestnut/quebracho tannin supplementation (ratio 1:2) was effective in reducing ruminal NH3-N concentration and molar proportion of branched-chain fatty acids, providing a decrease in amino acid deamination [56]. Herein, the same trend was observed for BCFAs, which decreased at all the tested doses (p < 0.001), mainly at the Cs/3/2-50 mg dose level. Iso-valerate is a branched-chain VFA from the deamination of leucine, and in the present study, its proportion decreased after only 24 h of incubation at greater doses of polyphenols (fraction Cs/3/2). The decrease in iso-valerate with a higher dose of tannins may indicate a reduction in ruminal protein degradation [54]. Analogously, iso-butyrate, which showed an increase after 24 h, decreased (p < 0.05) after 120 h, but not as significantly as iso-valerate. Fraction Cs/2/1 further modified some fermentation parameters (e.g., pH, total VFAs, propionic acid, butyric acid, and valeric acid) for its terpenoid constituents, which are able to influence fermentation process with effects also on the methanogenesis [57] and milk production [58]. Valerate, as opposed to 24 h of incubation, was significantly reduced in all tested fractions, mainly by means of the Cs/3/2-200 mg sample.
The dendrograms related to the results of total VFAs and related to a diet at the dose level of 50 and 200 mg are in Figure S11A. Both dendrograms showed three clusters: the first group included total VFA and acetic acid, the second consisted of propionic and butyric acid, and the third included two subgroups with valeric acid, A/P, BCFA, iso-valeric acid (IIIa) and iso-butyric acid (IIIb). Principal component analysis (PCA) (Figure S11B) at 50 mg showed the positive correlation of total VFA with the enriched polyphenol fraction (Cs/3/2), which showed the highest amount of TFC (r = 0.998) and TPC (r = 0.913) and acetate at the apolar fraction (named Cs/2/1) (r = 0.207 in correlation with TFC; r = −0.153 in correlation with TPC). An opposite trend was displayed at the 200 mg dosage. Other volatile fatty acids showed similar distribution at both strengths, with the exception of propionate and butyrate.

3. Material and Methods

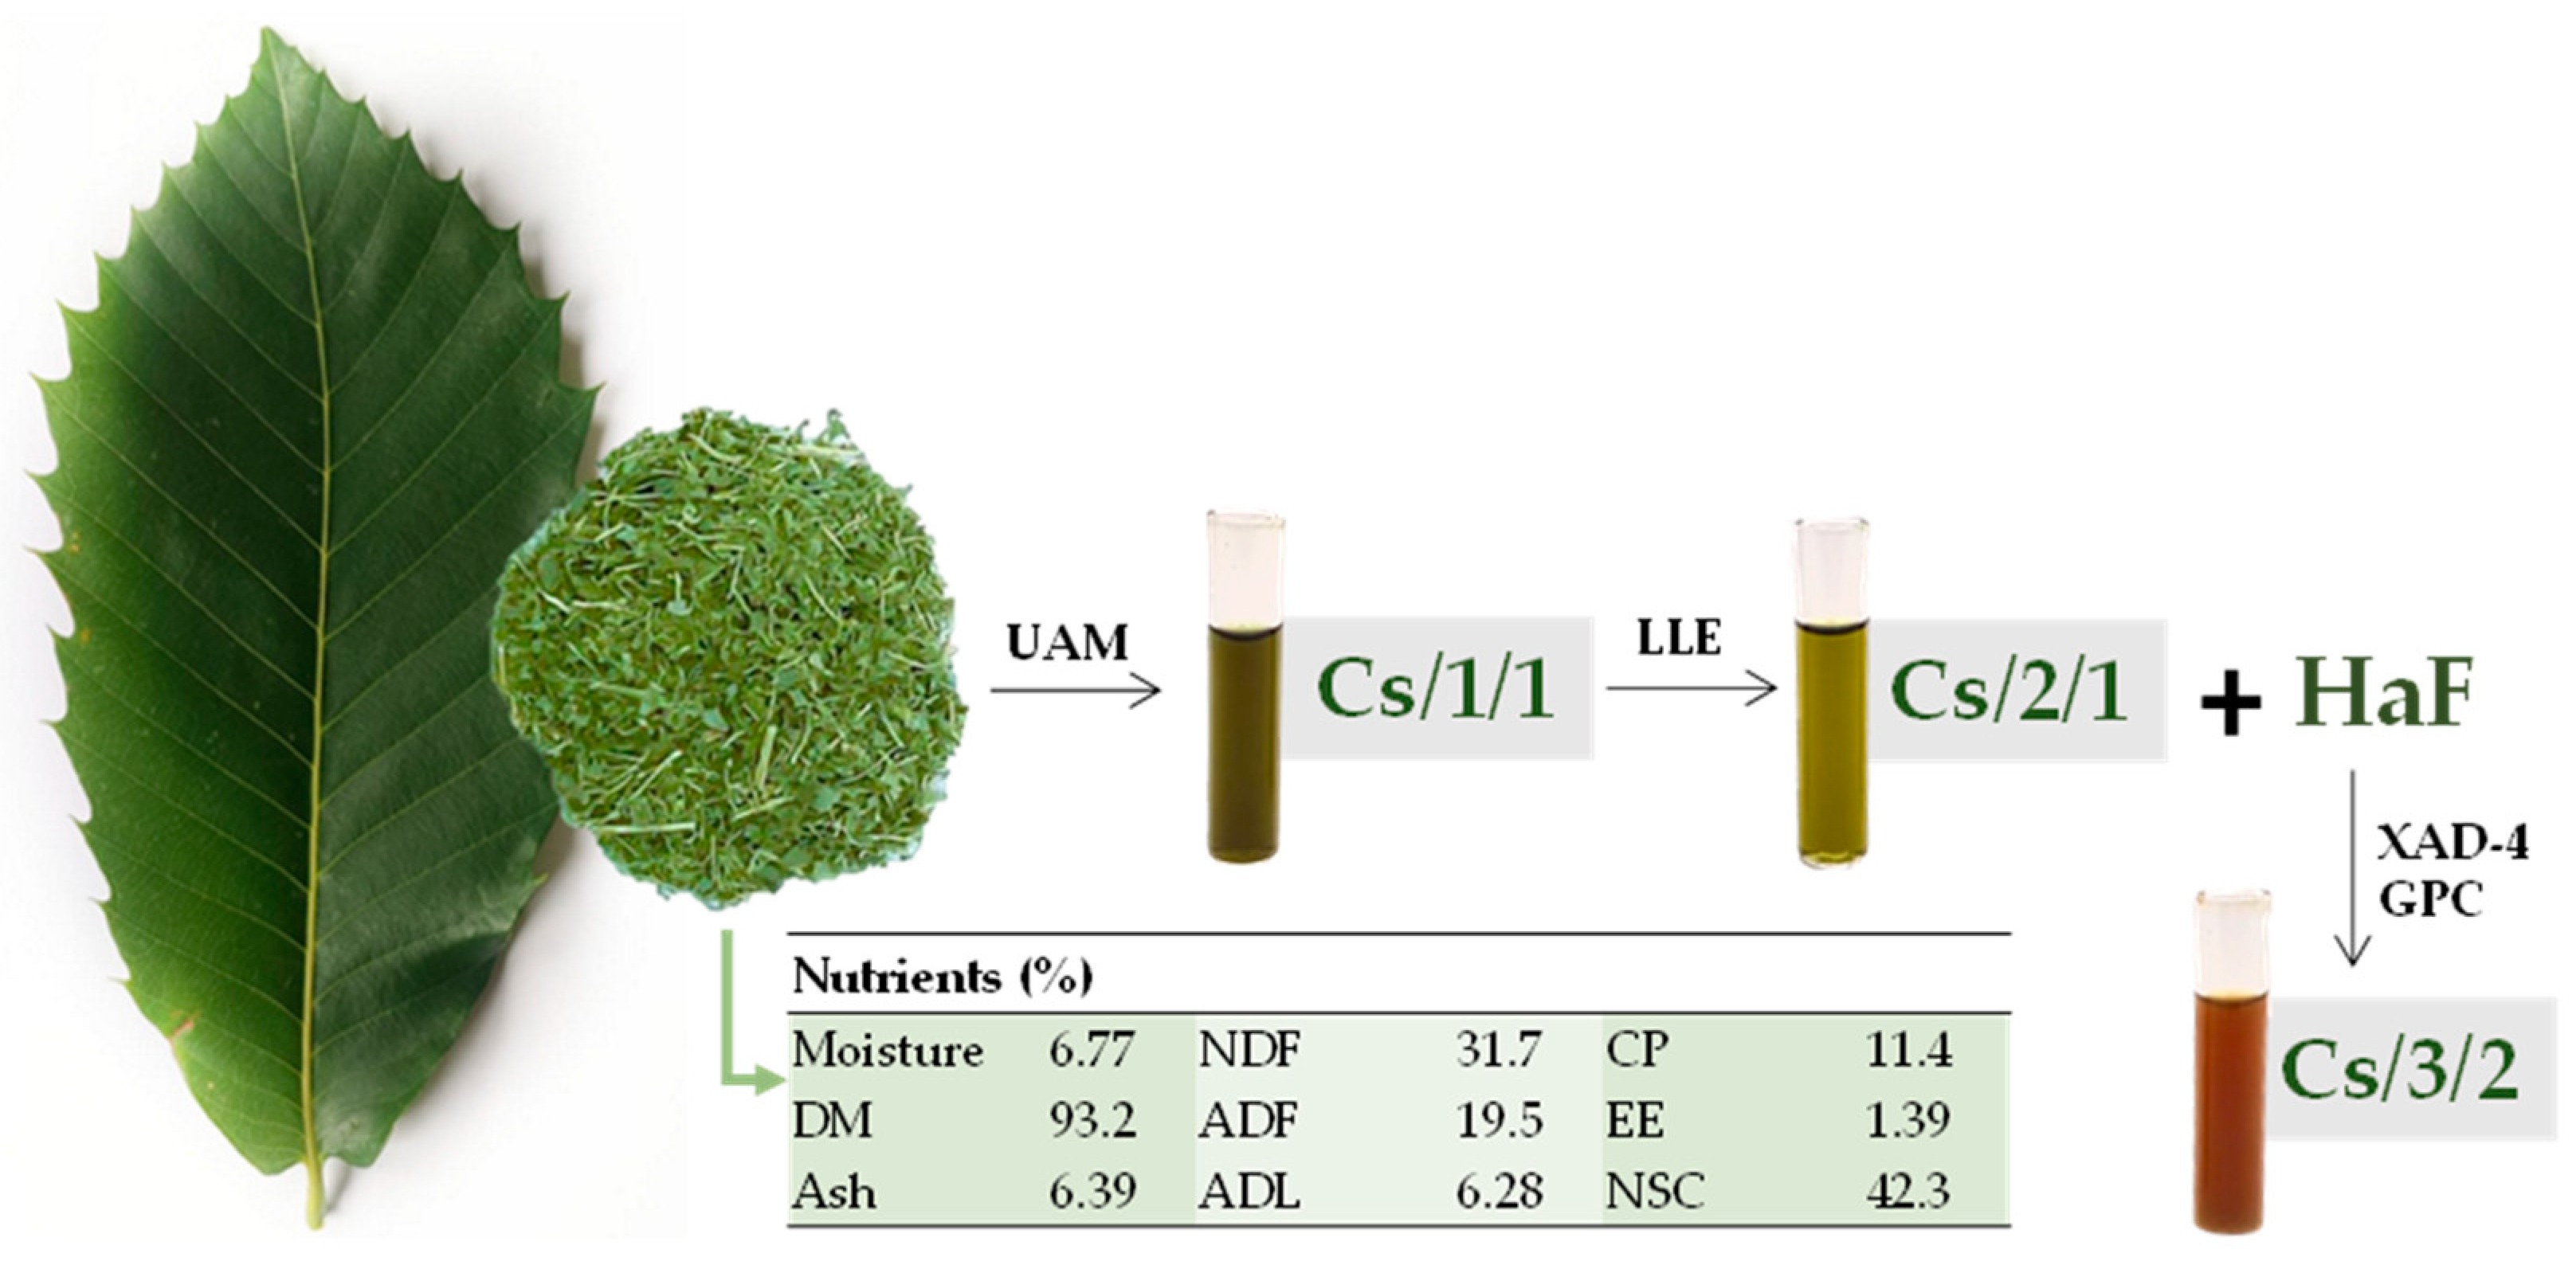
3.1. Plant Collection, Fractionation, and Evaluation of Leaf Chemical Composition

The leaves of C. sativa Mill. were collected in August 2021. Voucher specimens were deposited in the private herbarium of CZ (CZ-20190628A-1) and in the Herbarium of Kiel University (KIEL0005015); leaves for phytochemical analyses and twigs for the vouchers were collected in the Botanical Garden of the Pharmaceutical Institute of Kiel University in Kiel/Schleswig-Holstein/Germany, N 54°20′00.8″, E 10°06′58.3″, 33 m a.m.s.l., 28.06.2019, leg.: C. Zidorn, det.: C. Zidorn. The identity of the single cultivated tree was confirmed using the German standard reference flora by Jäger [59].
The leaves were first lyophilized and pulverized using a rotating knife homogenizer. Dried leaves underwent ultrasound-assisted maceration (UAM; Branson UltrasonicsTM BransonicTM M3800-E; Danbury, CT, USA) using methanol as extractive solvent. The raw material/solvent ratio was 1:5 (g raw material: mL solvent). Three sonication cycles were carried out, each one of 30 min, to obtain the Cs/1/1 extract. The extract yield (%) was equal to 24.3% (103.7 g). The alcoholic extract was then dissolved in a biphasic solution CHCl3:MeOH:H2O (13:7:6, v:v:v), and discontinuous liquid–liquid extraction (LLE) was performed. Thus, an organic fraction (Cs/2/1; 16.2% of Cs/1/1) and a hydroalcoholic one (Cs/2/2) were obtained. The fraction Cs/2/2 was further chromatographed on XAD-4 resin, using water first and then methanol. The alcoholic fraction Cs/3/2 was obtained with a 26.6% yield.
Chestnut leaves were also analyzed according to the procedures of the Association of Official Agricultural Chemists [60] to determine dry matter (DM), ether extract (EE), crude protein (CP) and ash. The fiber fractions (neutral detergent fiber on organic matter basis, NDFom; acid detergent fiber on organic matter basis, ADFom; acid detergent lignin, ADL) were also determined according to Van Soest et al. [61].

3.2. UHPLC-HRMS and MS/MS Parameters and UV-Vis Analyses

The alcoholic extract, Cs/1/1, and the fractions therefrom were first analyzed by UV-Vis spectrophotometry in the range 200–800 nm by a Cary 100 spectrophotometer. The three samples (10 mg/mL) were profiled by a NEXERA UHPLC system (Shimadzu; Tokyo, Japan) equipped with Luna® Omega C-18 column (1.6-µm particle size, 50 × 2.1 mm i.d.) and 2.0 µL of each sample were injected. The separation was achieved using a binary solution: (A) H2O and (B) CH3CN both with 0.1% formic acid (HCOOH). A linear gradient was used in which the percentage of solvent B increased as follows: 0–3 min, 2% B; 3–7 min, 2% → 10% B; 7–15 min, 10% → 30% B; 15–20 min, 30% → 45% B; 20–23 min, 45% → 75% B, 23–25 min, 75% → 95% B; 25–27 min, 95% B and 27.01–29.00 min, column re-equilibration. The flow rate was set at 500 µL/min. The AB SCIEX TripleTOF® 4600 (AB Sciex, Concord, ON, Canada) system was equipped with a DuoSprayTM ion source, with the ESI probe used for MS investigations in negative ionization mode, and the APCI probe used for fully automatic mass calibration, using the calibrant delivery system (CDS). A full-scan time-of-flight (TOF) survey (dwell time 250 ms, 100–1500 Da) and eight IDA MS/MS scans (dwell time 100 ms, 80–1300 Da) were acquired, using the following parameters: curtain gas (CUR) 35 psi, nebulizer (GS1) and heated (GS2) gases 60 psi, ion spray voltage (ISVF) 4500 V, ion source temperature (TEM) 600 °C, and declustering potential (DP) −80 V. The collision energy (CE) applied was −45 V, with a collision energy spread (CES) of 15 V. The instrument was controlled by Analyst® TF 1.7 software (AB Sciex, Concord, ON, Canada, 2016), while data processing was carried out using PeakView® software version 2.2 (AB Sciex, Concord, ON, Canada, 2016).

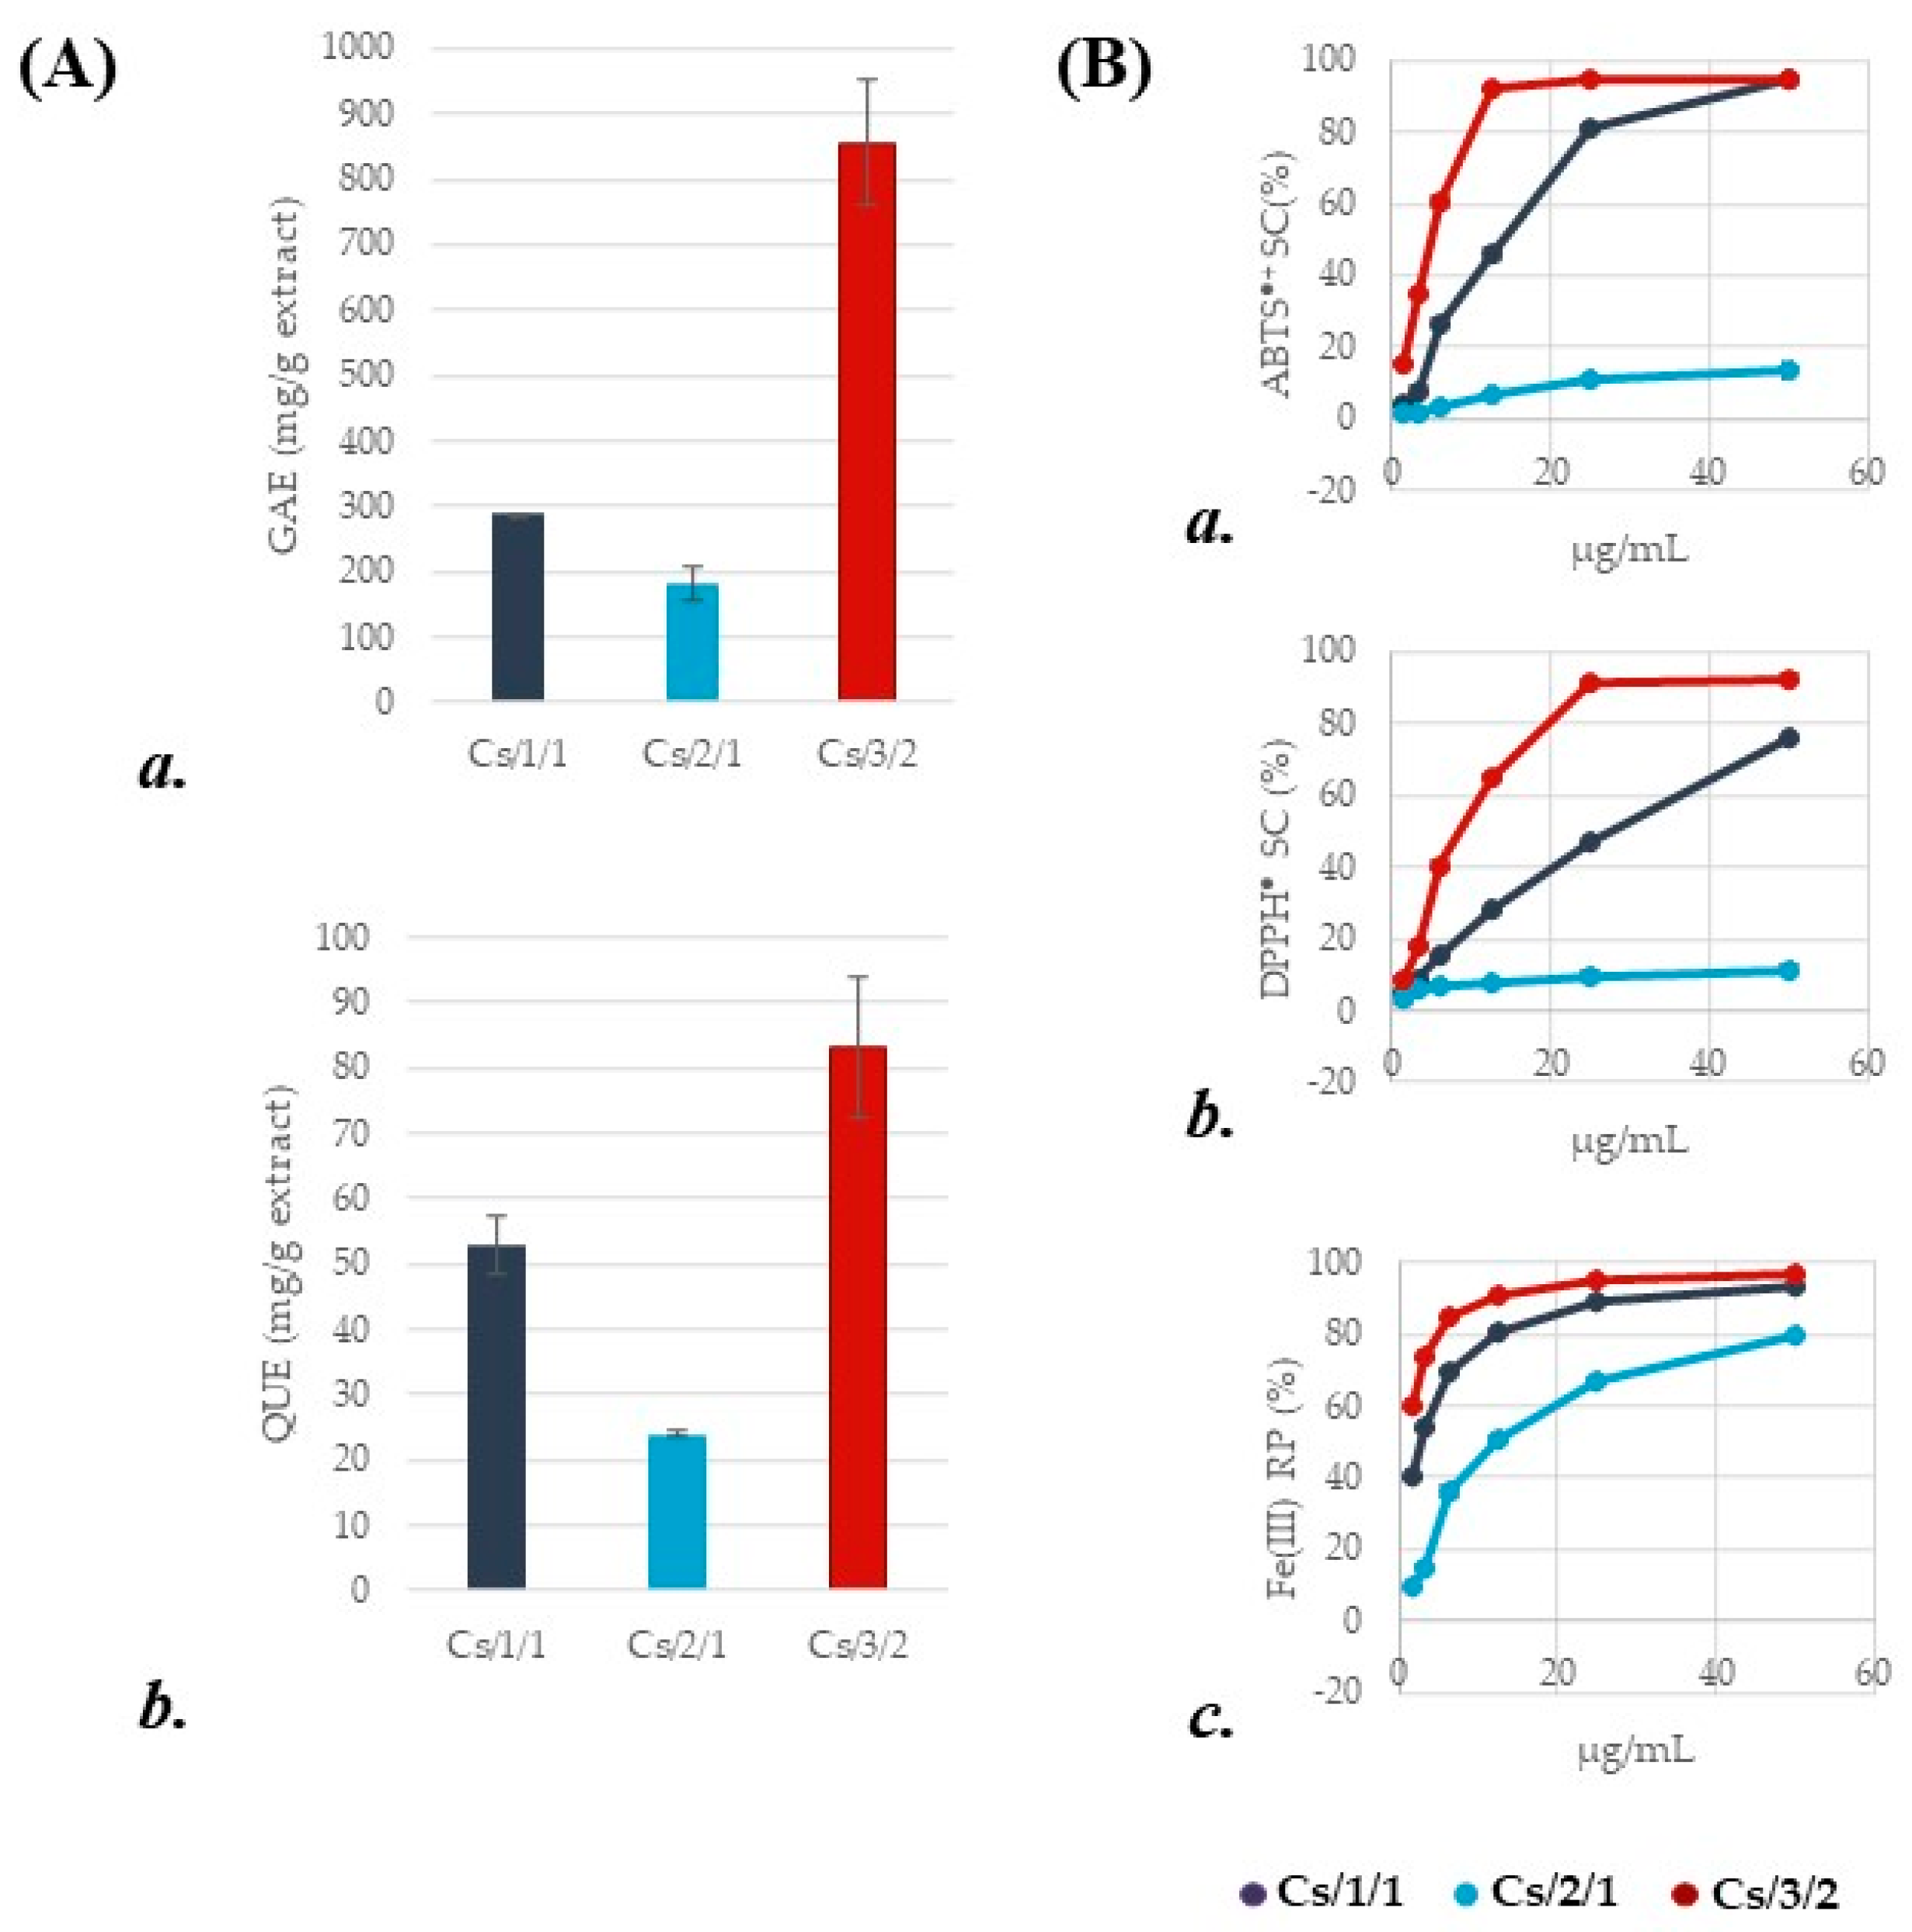
3.3. Antioxidant Assessment

The leaf extract and its fractions were tested at 200, 100, 50, 25, 12.5, 6.25, and 3.125 µg/mL (final concentration), by assessing ABTS [2,2′-azinobis-(3-ethylbenzothiazolin-6-sulfonic acid)] radical cation scavenging capacity and 2,2′-diphenyl-1-picrylhydrazyl (DPPH) radical scavenging capability. Ferricyanide PFRAP assay was also carried out. Each test was performed for three replicate measurements. Recorded activities were compared to a blank treated in the same manner as the samples. The ID50 and TEAC values were calculated.

3.3.1. Determination of DPPH (2,2′-Diphenyl-1-Picrylhydrazyl) Radical Scavenging Capacity

Samples were mixed into a DPPH methanol solution (9.4 × 10⁻⁵ M). Mixtures were stirred for 15 min; after that, the absorption was read at 517 nm by a Wallac Victor3 spectrophotometer with reference to a blank. The results were expressed in terms of the percentage reduction in the initial radical adsorption by the tested samples [62]. Trolox (2, 4, 8, 16, and 32 µM) was used as positive standard.

3.3.2. Determination of ABTS [2,2′-Azinobis-(3-Ethylbenzothiazolin-6-Sulfonic Acid)] Radical Cation Scavenging Capacity

The radical cation ABTS, previously produced by reacting (2,2′-azinobis-(3-ethylbenzothiazolin-6-sulfonic acid); 7 mM) and potassium persulfate (K2S2O8; 2.45 mM), in the dark for 12 h, was diluted with phosphate-buffered saline (pH 7.4) until it reached an absorbance equal to 0.7 at 734 nm. Thus, samples were added to the ABTS●+ solution. After 6 min, the absorbance was measured using a Wallac Victor3 spectrophotometer in reference to a blank [62]. Trolox (2, 4, 8, 16, and 32 µM) was used as positive standard.

3.3.3. Determination of Potassium Ferricyanide Reducing Power (PFRAP)

The ability to reduce the Fe(III) of chestnut leaf Cs/1/1 extract and its fractions were estimated using the ferricyanide FRAP assay, according to PFRAP procedure. The absorbance was measured at 700 nm and the increase in absorbance with reference to the blank was considered to value the reducing power [63]. Trolox (2, 4, 8, 16, 32 µM) was used as positive standard.

3.4. Determination of Total Phenolic Content

The total phenolic content (TPC) was measured according to the Folin-Ciocalteau procedure [62]. Samples (0.25 and 0.125 mg) were mixed with Na2CO3 (2.25 mL; 7.5% w/v) and Folin-Ciocalteu reagent (0.25 mL) and allowed to stand for 3 h at room temperature. The absorbance was read at 765 nm using a Synergy spectrophotometer (Biotek, Winooski, VT, USA). Data were expressed as milligrams of gallic acid equivalents (GAEs) per g of extract. To this purpose, a gallic acid calibration curve (y = 0.0247x − 0.0063; R2 = 0.9998) was built up in the range 0.78–25 µg/mL (final concentration levels).

3.5. Determination of Total Flavonoid Content

The total flavonoid content (TFC) was determined, with NaNO2 (5%, w/v; 0.3 mL) previously solubilized into 5 mL of distillate water being added to the samples. After 10 min, AlCl3 solution (10%, w/v; 0.6 mL) was added. The reaction was carried out for 6 min. Then, NaOH aqueous solution (1.0 M, 2.0 mL) was added, and the mixture was further diluted to 10 mL with distillate water. The absorbance was read at 510 nm against the blank (water) using a Synergy spectrophotometer (Biotek, Winooski, VT, USA). The flavonoid content was expressed as milligrams of quercetin equivalents (QUEs) per g of extract. To this purpose, a quercetin calibration curve (y = 0.0243x − 0.0038; R2 = 0.9978) was built up in the range 0.78–50 µg/mL (final concentration levels).

3.6. In Vitro Fermentation

The alcoholic extract of C. sativa Mill. (Cs/1/1), fractions Cs/2/1 and Cs/3/2, and a standard diet (as control), were tested to evaluate fermentation characteristics and kinetics by means of the in vitro gas production technique [64]. The extracts were incubated for 24 and 120 h at two dosage levels (50 and 200 mg) with the control diet (1.0055 ± 0.0024 g). This latter consisted in corn silage, oat hay, and concentrate (NDF: 44.2% and CP: 13.7%). All the samples were incubated in hermetically closed serum flasks (120 mL each, three replications for each extract and dosage (3 × 3 × 2)) with rumen fluid (10 mL) at 39°C under anaerobic conditions, and buffered medium (75 mL) and reducing agent (4 mL) were added [65]. The rumen fluid was collected in a pre-warmed thermos at a slaughterhouse, as authorized according to EU legislation [66], from six healthy young bulls (Bos taurus) to increase the variability of the microbial population. All procedures concerning animals were accepted by the Ethical Animal Care and Use Committee of the University of Napoli Federico II (Prot. 2019/0013729 of 08/02/2019). Then, the collected rumen liquor was transferred to the laboratory of the Department of Veterinary Medicine and Animal Production. There, it was pooled, flushing with CO2, filtered through a cheesecloth, and added to the flasks. After 24 h of incubation, the gas-phase from each flask was sampled (3 mL) in duplicate with a gastight syringe and injected into a gas chromatograph (ThermoQuest 8000top Italia SpA, Rodano, Milan, Italy), equipped with a loop TC detector and a packed column (HaySepQ SUPELCO, 3/16-inch, 80/100 mesh) to detect the methane (CH4) production related to incubate organic matter (CH4, mL/g iOM) and degraded organic matter (CH4 (mL/g dOM). The gas produced during the 120 h of incubation was reordered using a manual pressure transducer (Cole and Palmer Instrument Co, Vernon Hills, IL, USA) and related to incubated OM (OMCV, mL/g). After 120 h of incubation, the fermentation was stopped and the pH of the fermentation liquor was measured using a pH meter (ThermoOrion 720 A+, Fort Collins, CO, USA). Then, the organic matter degradability (OMD, %) at both the incubation times was assessed by the weight differences of the incubated OM and the undegraded filtered (sintered glass crucibles; Schott Duran, Mainz, Germany, porosity # 2) residue burned at 550 °C overnight [67].

3.7. Fermentation End-Product Assessment

The fermentation liquor of each bottle after 24 and 120 h of incubation was collected to measure the volatile fatty acids (VFAs) content [68]. The collected fermentation liquors were centrifuged at 12,000× g for 10 min at 4 °C (Universal 32R centrifuge, Hettich FurnTech Division DIY, Melle-Neuenkirchen, Germany), and the supernatant (1 mL) was mixed with oxalic acid (1 mL: 0.06 mol). The VFA composition was evaluated by gas chromatography (ThermoQuest 8000top Italia SpA, Rodano, Milan, Italy) equipped with a fused silica capillary column (30 m, 0.25 mm ID, 0.25 μm film thickness) by means of an external standard solution composed of pure acetic, propionic, butyric, iso-butyric, valeric and iso-valeric acids. BCFA percentages were calculated as follows: [(iso-butyric acid + iso-valeric acid)/total VFAs] × 100.

3.8. Data Processing and Statistical Analysis

Colorimetric tests were carried out in three replicate measurements for three samples (n = 3) of the extracts (in total, 3 × 3 measurements). All data were expressed as mean ± SD values.
To estimate the fermentation kinetic parameters, the gas production profiles were fitted to the sigmoidal model [69]:
G = A / ( 1 + ( B t ) C )
G is the total gas produced (mL/g of incubated OM) at time t (h), A is the asymptotic gas production (mL/g), B is the time at which one-half of A is reached (h), and C is the curve switch. The maximum fermentation rate (Rmax, mL/h) and the time at which it occurred (Tmax, h) were determined using model parameters [70]:
R max = ( A × C B ) ×   B   ×   T max ( B 1 ) ( ( 1 + C B ) × ( T max B ) ) 2
T max = C × (   B 1 B + 1 ) 1 B
Statistical analyses were performed by ANOVA (JMP®, Version 14 SW, SAS Institute Inc., Cary, NC, USA, 1989–2019). A post-hoc Dunnett’s test was performed to observe the differences between the control and experimental diets. The significance level was verified at p < 0.05, p < 0.01, and p < 0.001. A statistical comparison Shapiro–Wilk test for normally distributed data was performed. The correlations between the colorimetric assay values and fermentation parameters were also evaluated using the Pearson correlation coefficient (Tables S3 and S4). Dendrograms of fermentation end-product data were made based on mean values of parameters obtained by three fractions (Cs/1/1, Cs/2/1 and Cs/3/2) at both doses (50 and 200 mg). In addition, principal component analyses (PCA), as well as scatter plots, were carried out for two doses by Origin2015 and GraphPad Prism 8.4.2, respectively.

4. Conclusions

Chestnut leaf extracts can provide modulation of rumen parameters and can be used as supplements in the livestock diet, thus creating added economic value for the chestnut industry. Chestnut leaves have been shown to be a “reservoir” of structurally different metabolites capable of exerting effects both at 24 and 120 h of incubation, with an increase in total VFAs and propionate and a reduction in BCFA, A/P, acetate, and CH4. As for the positive effects on CH4 production, one of the most important challenges in livestock is to mitigate the production and emission of this greenhouse gas (GHG). Herein, it has been shown that the alcoholic extract and its polar fraction (Cs/3/2) are rich in polyphenols, including flavonoids and tannins (gallo- and ellagitannins). These are known to be considered “anti-nutritional” because they influence the feed palatability in ruminants by exerting negative effects on rumen fermentation. However, the effects of tannins can be variable depending on the sub-class (condensed or hydrolysable), the plant source and the molecular structure, which plays a key role in determining “structure-effect” in any complex biological system. Furthermore, their effects were also modulated by the synergistic action of flavonoids, which are present in a moderate percentage in the alcoholic extract and Cs/3/2 fraction. However, the non-polar fraction (Cs/2/1) also gave positive results, which were attributable to the presence of fatty acids and triterpenes. Therefore, in the light of the data obtained, it is essential to accurately attribute specific effects to an extract consisting of a well-defined class of metabolites, even better if they are pure molecules. The dose–response efficacy of the chestnut extract/fractions and the evaluation of pure isolated compounds are in line with our future perspectives.

Supplementary Materials

The following are available online at https://www.mdpi.com/article/10.3390/molecules27248662/s1. Figure S1: Worldwide distribution of Castanea sativa Mill. Figure S2: UV/Visible spectra of fractions Cs/2/1 and Cs/3/2. Figure S3: (A) TOF-MS/MS spectrum of compound 10; (B) putative fragmentation patterns; theoretical mass is reported under each structure. Figure S4: TOF-MS/MS spectra of (A) compound 4 and (B) compound 3. Putative fragmentation patterns are depicted; theoretical mass is reported under each structure. Figure S5: Galloyl hexose isomers (2, 6, 12) TOF-MS/MS spectra. (A) Compound 2; (B) compound 6; (C) compound 12. Putative fragmentation patterns are depicted; theoretical mass is reported under each structure. Figure S6: Digalloyl hexoses (A) 7, and (B) 30 TOF-MS/MS spectra and their putative fragmentation patterns; theoretical mass is reported under each structure. Figure S7: TOF-MS/MS spectra of compound 17, tentatively identified as galloyl dihydroxybenzoic acid. Figure S8: TOF-MS/MS spectra of compounds 8 (A) and 11 (B). In panel (C) the putative fragmentation pattern of compound 8 is depicted. Figure S9: TOF-MS/MS spectra of (A) chestanin (49) and (B) isochestanin (58). Putative fragmentation patterns are depicted; theoretical mass is reported under each structure. Figure S10: TOF-MS/MS spectra of compound 23 with [M-H] ion at m/z 951.0907. Structures of observed neutral losses are depicted. Figure S11: (A) Dendrograms of different volatile fatty acids obtained by treatment at 50 (i.) and 200 mg (ii.); (B) (i.) PCA (% variance on PC1 99.8; on PC2 0.2) of VFAs at 50 mg-dose level; (ii.) PCA (% variance on PC1 99.6; on PC2 0.4) of VFAs 200 of Cs/1/1, Cs/2/1 and Cs/3/2 fractions. Table S1: Compounds tentatively identified in the chestnut Cs/1/1 alcoholic extract and its Cs/2/1 and Cs/3/2 fractions. Rt = retention time; RDB = ring double bond equivalent value. Base peak fragments are reported in bold. Table S2: Effects of C. sativa L. extracts at different doses (50 and 200 mg) on fermentation end products after 24 h of incubation. Total VFA: total volatile fatty acids (acetate + propionate + butyrate + iso-butyrate + valerate + iso-valerate); AcA = acetic acid; PrA = propionic acid; ButA = butyric acid; ValA = valeric acid; iso-ButA = iso-butyric acid; iso-ValA = iso-valeric acid; BCFA= branched chain fatty acids (iso-butyrate + iso-valerate/tVFA); A/P = acetate/propionate. Along the row * p < 0.05, ** p < 0.01 and *** p< 0.001; NS: not significant; MSE: mean square error. Table S3: Values of Pearson coefficient correlation between antiradical (DPPH, ABTS●+) activities, reducing activity (PFRAP), total phenol content (TPC), and total flavonoid content (TFC), with fermentation parameters at the dose level of 50 mg. tVFA: total volatile fatty acids; AcA = acetic acid; PrA = propionic acid; ButA = butyric acid; ValA = valeric acid; iso-ButA = iso-butyric acid; iso-ValA = iso-valeric acid; BCFA: branched chain fatty acids (iso-butyrate + iso-valerate/total VFAs); A/P = acetate/propionate; OMD: organic matter degradability; OMCV: cumulative volume of gas related to incubated organic matter. Rmax: maximum fermentation rate; Tmax: time at which Rmax occurs. Table S4: Values of Pearson’s coefficient correlation, between antiradical (DPPH, ABTS●+) activities, reducing activity (PFRAP), total phenol content (TPC), total flavonoid content (TFC) with fermentation parameters at the dose level of 200 mg. tVFA: total volatile fatty acids; AcA = acetic acid; PrA = propionic acid; ButA = butyric acid; ValA = valeric acid; iso-ButA = iso-butyric acid; iso-ValA = iso-valeric acid; BCFA: branched chain fatty acids (iso-butyrate + iso-valerate/total VFAs); A/P = acetate/propionate; OMD: organic matter degradability; OMCV: cumulative volume of gas related to incubated organic matter. Rmax: maximum fermentation rate; Tmax: time at which Rmax occurs.

Author Contributions

Conceptualization, M.I.C., C.Z. and S.P. (Severina Pacifico); methodology, S.C., M.I.C., C.Z. and S.P. (Severina Pacifico); validation, A.V. and M.F.; formal analysis, A.V. and M.F.; investigation, A.V. and M.F.; resources, S.P. (Severina Pacifico); data curation, M.F. and S.P. (Severina Pacifico); writing—original draft preparation, M.F. and S.P. (Severina Pacifico); writing—review and editing, S.P. (Severina Pacifico); visualization, M.I.C., C.Z., S.C. and S.P. (Simona Piccolella); supervision, S.P. (Severina Pacifico); funding acquisition, S.P. (Severina Pacifico). All authors have read and agreed to the published version of the manuscript.

Funding

This research received no external funding.

Institutional Review Board Statement

All procedures concerning animals were accepted by the Ethical Animal Care and Use Committee of the University of Napoli Federico II (Prot. 2019/0013729 of 08/02/2019).

Informed Consent Statement

Not applicable.

Data Availability Statement

Data are within the manuscript and related Supplement Materials.

Acknowledgments

The study was supported by the grant “Programma Dottorato VALERE XXXV ciclo” from the University of Campania “Luigi Vanvitelli”. The authors thank the gardeners of the Botanical Garden of the Pharmaceutical Institute of Kiel University (Germany) Stefanie Offt and Olaf Zölck. The authors further thank Maria Tommasina Pecoraro for designing the Graphical Abstract.

Conflicts of Interest

The authors declare no conflict of interest.

Sample Availability

Samples of the investigated extract and its fractions are available from the authors.

References

  1. FAO. FAOSTAT. Available online: http://www.fao.org/faostat/en/#home (accessed on 4 September 2022).
  2. Demirkesen, I.; Mert, B.; Sumnu, G.; Sahin, S. Utilization of chestnut flour in gluten-free bread formulations. J. Food Eng. 2010, 101, 329–336. [Google Scholar] [CrossRef]
  3. Braga, N.; Rodrigues, F.; Oliveira, M.B.P.P. Castanea sativa by-products: A review on added value and sustainable application. Nat. Prod. Res. 2014, 29, 1–18. [Google Scholar] [CrossRef] [PubMed]
  4. Aires, A.; Carvalho, R.; Saavedra, M.J. Valorization of solid wastes from chestnut industry processing: Extraction and optimization of polyphenols, tannins and ellagitannins and its potential for adhesives, cosmetic and pharmaceutical industry. J.Waste Manag. 2016, 48, 457–464. [Google Scholar] [CrossRef] [PubMed]
  5. Pinto, D.; de la Luz Cádiz-Gurrea, M.; de Freitas, V.; Costa, P.C.; Sarmento, B.; Delerue-Matos, C.; Rodrigues, F. Castanea sativa shells: Is cosmetic industry a prominent opportunity to valorize this agro-waste? Biol. Life Sci. Forum 2021, 6, 24. [Google Scholar]
  6. Almeida, I.F.; Valentão, P.; Andrade, P.B.; Seabra, R.M.; Pereira, T.M.; Amaral, M.H.; Paulo, C.C.; Bahia, M.F. In vivo skin irritation potential of a Castanea sativa (Chestnut) leaf extract, a putative natural antioxidant for topical application. Basic Clin. Pharmacol. Toxicol. 2008, 103, 461–467. [Google Scholar] [CrossRef]
  7. Esposito, T.; Celano, R.; Pane, C.; Piccinelli, A.L.; Sansone, F.; Picerno, P.; Zaccardelli, M.; Aquino, R.P.; Mencherini, T. Chestnut (Castanea sativa Miller.) Burs Extracts and Functional Compounds: UHPLC-UV-HRMS Profiling, Antioxidant Activity, and Inhibitory Effects on Phytopathogenic Fungi. Molecules 2019, 24, 302. [Google Scholar] [CrossRef] [Green Version]
  8. Pinto, D.; Silva, A.M.; Freitas, V.; Vallverdú-Queralt, A.; Delerue-Matos, C.; Rodrigues, F. Microwave-Assisted Extraction as a Green Technology Approach to Recover Polyphenols from Castanea sativa Shells. ACS Food Sci. Technol. 2021, 1, 229–241. [Google Scholar] [CrossRef]
  9. Gullón, B.; Eibes, G.; Dávila, I.; Moreira, M.T.; Labidi, J.; Gullón, P. Hydrothermal treatment of chestnut shells (Castanea sativa) to produce oligosaccharides and antioxidant compounds. Carbohydr. Polym. 2018, 192, 75–83. [Google Scholar] [CrossRef]
  10. Rodrigues, F.; Santos, J.; Pimentel, F.B.; Braga, N.; Palmeira-de-Oliveira, A.; Oliveira, M.B.P.P. Promising new applications of Castanea sativa shell: Nutritional composition, antioxidant activity, amino acids and vitamin E profile. Food Funct. 2015, 6, 2854–2860. [Google Scholar] [CrossRef]
  11. Vella, F.M.; Laratta, B.; La Cara, F.; Morana, A. Recovery of bioactive molecules from chestnut (Castanea sativa Mill.) by-products through extraction by different solvents. Nat. Prod. Res. 2017, 32, 1022–1032. [Google Scholar] [CrossRef]
  12. Śliwiński, B.J.; Soliva, C.R.; Machmüller, A.; Kreuzer, M. Efficacy of plant extracts rich in secondary constituents to modify rumen fermentation. Anim. Feed Scie. Tech. 2002, 101, 101–114. [Google Scholar] [CrossRef]
  13. Wang, Y.; Yu, S.; Li, Y.; Zhang, S.; Qi, X.; Guo, K.; Guo, Y.; Fortina, R. Pilot Study of the effects of polyphenols from chestnut involucre on methane production, volatile fatty acids, and ammonia concentration during in vitro rumen fermentation. Animals 2021, 11, 108. [Google Scholar] [CrossRef]
  14. Patra, A.K.; Saxena, J. Dietary phytochemicals as rumen modifiers: A review of the effects on microbial populations. Antonie Van Leeuwenhoek 2009, 96, 363–375. [Google Scholar] [CrossRef]
  15. Formato, M.; Piccolella, S.; Zidorn, C.; Vastolo, A.; Calabrò, S.; Cutrignelli, M.I.; Pacifico, S. UHPLC-ESI-QqTOF analysis and in vitro rumen fermentation for exploiting Fagus sylvatica leaf in ruminant diet. Molecules 2022, 27, 2217. [Google Scholar] [CrossRef]
  16. Jayanegara, A.; Goel, G.; Makkar, H.P.S.; Becker, K. Divergence between purified hydrolysable and condensed tannin effects on methane emission, rumen fermentation and microbial population in vitro. Anim. Feed Sci. Technol. 2015, 209, 60–68. [Google Scholar] [CrossRef]
  17. Buccioni, A.; Cappucci, A.; Mele, M. Methane Emission from enteric fermentation: Methanogenesis and fermentation. In Climate Change Impact on Livestock: Adaptation and Mitigation; Sejian, V., Gaughan, J., Baumgard, L., Prasad, C., Eds.; Springer: New Delhi, India, 2015; pp. 171–186. [Google Scholar]
  18. Salami, S.A.; Valenti, B.; Bella, M.; O’Grady, M.N.; Luciano, G.; Kerry, J.P.; Jones, E.; Priolo, A.; Newbold, C.J. Characterisation of the ruminal fermentation and microbiome in lambs supplemented with hydrolysable and condensed tannins. FEMS Microbiol Ecol. 2018, 94, 61. [Google Scholar]
  19. Mannelli, F.; Daghio, M.; Alves, S.P.; Bessa, R.J.B.; Minieri, S.; Giovannetti, L.; Conte, G.; Mele, M.; Messini, A.; Rapaccini, A.; et al. Effects of chestnut tannin extract, vescalagin and gallic acid on the dimethyl acetals profile and microbial community composition in rumen liquor: An in vitro study. Microorganisms 2019, 7, 202. [Google Scholar] [CrossRef] [Green Version]
  20. Yanza, Y.R.; Fitri, A.; Suwignyo, B.; Elfahmi; Hidayatik, N.; Kumalasari, N.R.; Irawan, A.; Jayanegara, A. The utilisation of tannin extract as a dietary additive in ruminant nutrition: A meta-analysis. Animals 2021, 11, 3317. [Google Scholar] [CrossRef]
  21. Sariyildiz, T.; Anderson, J.M. Variation in the chemical composition of green leaves and leaf litters from three deciduous tree species growing on different soil types. For. Ecol. Manag. 2005, 210, 303–319. [Google Scholar] [CrossRef]
  22. Cerulli, A.; Napolitano, A.; Hošek, J.; Masullo, M.; Pizza, C.; Piacente, S. Antioxidant and in vitro preliminary anti-inflammatory activity of Castanea sativa (Italian Cultivar “Marrone di Roccadaspide” PGI) burs, leaves, and chestnuts extracts and their metabolite profiles by LC-ESI/LTQOrbitrap/MS/MS. Antioxidants 2021, 10, 278. [Google Scholar] [CrossRef]
  23. Campo, M.; Pinelli, P.; Romani, A. Hydrolyzable tannins from sweet chestnut fractions obtained by a sustainable and eco-friendly industrial process. Nat. Prod. Commun. 2016, 11, 409–415. [Google Scholar] [CrossRef] [PubMed] [Green Version]
  24. Galvão, M.A.M.; de Arruda, A.O.; Bezerra, I.C.F.; Ferreira, M.R.A.; Soares, L.A.L. Evaluation of the Folin-Ciocalteu Method and Quantification of Total Tannins in Stem Barks and Pods from Libidibia ferrea (Mart. ex Tul) L. P. Queiroz. Braz. Arch. Biol. Technol. 2018, 61, 586. [Google Scholar] [CrossRef]
  25. Woo, Y.; Oh, J.; Kim, J.-S. Suppression of Nrf2 Activity by Chestnut Leaf Extract Increases Chemosensitivity of Breast Cancer Stem Cells to Paclitaxel. Nutrients 2017, 9, 760. [Google Scholar] [CrossRef] [PubMed]
  26. Schink, A.; Neumann, J.; Leifke, A.L.; Ziegler, K.; Fröhlich-Nowoisky, J.; Cremer, C.; Eckhard, T.; Weber, B.; Poshl, U.; Schuppan, D.; et al. Screening of herbal extracts for TLR2- and TLR4-dependent anti-inflammatory effects. PLoS ONE 2018, 13, e0203907. [Google Scholar] [CrossRef] [PubMed]
  27. Barreira, J.; Ferreira, I.; Oliveira, M.; Pereira, J. Antioxidant activities of the extracts from chestnut flower, leaf, skins and fruit. Food Chem. 2008, 107, 1106–1113. [Google Scholar] [CrossRef]
  28. Barreira, J.C.M.; Ferreira, I.C.F.R.; Oliveira, M.B.P.P.; Pereira, J.A. Antioxidant Potential of Chestnut (Castanea sativa L.) and Almond (Prunus dulcis L.) By-products. Int. J. Food Sci. 2010, 16, 209–221. [Google Scholar] [CrossRef] [Green Version]
  29. Almeida, I.F.; Fernandes, E.; Lima, J.L.F.C.; Costa, P.C.; Bahia, M.F. Protective effect of Castanea sativa and Quercus robur leaf extracts against oxygen and nitrogen reactive species. J. Photochem. Photobiol. 2008, 91, 87–95. [Google Scholar] [CrossRef]
  30. Silva, V.; Falco, V.; Dias, M.I.; Barros, L.; Silva, A.; Capita, R.; Alonso-Calleja, C.; Amaral, J.S.; Igrejas, G.; Ferreira, I.C.F.R.; et al. Evaluation of the Phenolic Profile of Castanea sativa Mill. By-Products and Their Antioxidant and Antimicrobial Activity against Multiresistant Bacteria. Antioxidants 2020, 9, 87. [Google Scholar] [CrossRef] [Green Version]
  31. Moilanen, J.; Sinkkonen, J.; Salminen, J.-P. Characterization of bioactive plant ellagitannins by chromatographic, spectroscopic and mass spectrometric methods. Chemoecology 2013, 23, 165–179. [Google Scholar] [CrossRef]
  32. Cerulli, A.; Masullo, M.; Mari, A.; Balato, A.; Filosa, R.; Lembo, S.; Napolitano, A.; Piacente, S. Phenolics from Castanea sativa leaves and their effects on UVB-induced damage. Nat. Prod. Res. 2018, 32, 1170–1175. [Google Scholar] [CrossRef]
  33. Pacifico, S.; Piccolella, S.; Nocera, P.; Tranquillo, E.; Dal Poggetto, F.; Catauro, M. New insights into phenol and polyphenol composition of Stevia rebaudiana leaves. J. Pharm. Biomed. Anal. 2019, 163, 45–57. [Google Scholar] [CrossRef] [PubMed]
  34. Chiarini, A.; Micucci, M.; Malaguti, M.; Budriesi, R.; Ioan, P.; Lenzi, M.; Fimognari, C.; Comandini, P.; Hrelia, S. Sweet Chestnut (Castanea sativa Mill.) bark extract: Cardiovascular activity and myocyte protection against oxidative damage. Oxid. Med. Cell. Longev. 2013, 2013, 471790. [Google Scholar] [CrossRef] [PubMed]
  35. Michel, P.; Dobrowolska, A.; Kicel, A.; Owczarek, A.; Bazylko, A.; Granica, S.; Piwowarski, J.P.; Olszewska, M.A. Polyphenolic profile, antioxidant and anti-inflammatory activity of eastern teaberry (Gaultheria procumbens L.) leaf extracts. Molecules 2014, 19, 20498–20520. [Google Scholar] [CrossRef] [PubMed] [Green Version]
  36. Elraey, M.; Elgamal, A. Quercetin -3-O-β-D-glucuronide butyl ester from Vitis vinifera leaves of potent anti-helicobacter pylori activity and impact of its combination with clarithromycin. Egypt. J. Chem. 2022, 65, 2–4. [Google Scholar]
  37. Liebisch, G.; Fahy, E.; Aoki, J.; Dennis, E.A.; Durand, T.; Ejsing, C.S.; Fedorova, M.; Feussner, I.; Griffiths, W.J.; Köfeler, H.; et al. Update on LIPID MAPS classification, nomenclature, and shorthand notation for MS-derived lipid structures. J. Lipid Res. 2020, 61, 1539–1555. [Google Scholar] [CrossRef]
  38. Hou, W.; Zhou, H.; Khalil, M.B.; Seebun, D.; Bennett, S.A.L.; Figeys, D. Lyso-form fragment ions facilitate the determination of stereospecificity of diacyl glycerophospholipids. Rapid Commun. Mass Spectrom. 2010, 25, 205–217. [Google Scholar] [CrossRef]
  39. Kim, N.; Park, S.; Nhiem, N.X.; Song, J.-H.; Ko, H.-J.; Kim, S.H. Cycloartane-type triterpenoid derivatives and a flavonoid glycoside from the burs of Castanea crenata. Phytochemistry 2019, 158, 135–141. [Google Scholar] [CrossRef]
  40. Quave, C.L.; Lyles, J.T.; Kavanaugh, J.S.; Nelson, K.; Parlet, C.P.; Crosby, H.A.; Heilmann, P.K.; Horswill, A.R. Castanea sativa (European Chestnut) leaf extracts rich in ursene and oleanene derivatives block Staphylococcus aureus virulence and pathogenesis without detectable resistance. PLoS ONE 2015, 10, e0136486. [Google Scholar] [CrossRef] [Green Version]
  41. Pérez, A.J.; Pecio, Ł.; Kowalczyk, M.; Kontek, R.; Gajek, G.; Stopinsek, L.; Mirt, I.; Stochmal, A.; Oleszek, W. Cytotoxic triterpenoids isolated from sweet chestnut heartwood (Castanea sativa) and their health benefits implication. Food Chem. Toxicol. 2017, 109, 863–870. [Google Scholar] [CrossRef]
  42. Jayanegara, A.; Marquardt, S.; Kreuzer, M.; Leiber, F. Nutrient and energy content, in vitro ruminal fermentation characteristics and methanogenic potential of alpine forage plant species during early summer. J. Sci Food Agric. 2011, 91, 1863–1870. [Google Scholar] [CrossRef]
  43. Hassanat, F.; Benchaar, C. Assessment of the effect of condensed (acacia and quebracho) and hydrolysable (chestnut and valonea) tannins on rumen fermentation and methane production in vitro. J. Sci. Food Agric. 2012, 93, 332–339. [Google Scholar] [CrossRef]
  44. Witzig, M.; Zeder, M.; Rodehutscord, M. Effect of the ionophore monensin and tannin extracts supplemented to grass silage on populations of ruminal cellulolytics and methanogens in vitro. Anaerobe 2018, 50, 44–54. [Google Scholar] [CrossRef]
  45. Sarnataro, C.; Spanghero, M. In vitro rumen fermentation of feed substrates added with chestnut tannins or an extract from Stevia rebaudiana Bertoni. Anim Nutr. 2020, 6, 54–60. [Google Scholar] [CrossRef]
  46. Huang, Q.; Liu, X.; Zhao, G.; Hu, T.; Wang, Y. Potential and challenges of tannins as an alternative to in-feed antibiotics for farm animal production. Anim. Nutr. 2017, 4, 137–150. [Google Scholar] [CrossRef]
  47. Patra, A.K.; Saxena, J. Exploitation of dietary tannins to improve rumen metabolism and ruminant nutrition. J. Sci. Food Agric. 2010, 91, 24–37. [Google Scholar] [CrossRef]
  48. Castro-Montoya, J.M.; Makkar, H.P.S.; Becker, K. Chemical composition of rumen microbial fraction and fermentation parameters as affected by tannins and saponins using an in vitro rumen fermentation system. Can. J. Anim. Sci. 2011, 91, 433–448. [Google Scholar] [CrossRef]
  49. Martínez, T.F.; McAllister, T.A.; Wang, Y.; Reuter, T. Effects of tannic acid and quebracho tannins on in vitro ruminal fermentation of wheat and corn grain. J. Sci. Food Agric. 2006, 86, 1244–1256. [Google Scholar] [CrossRef]
  50. Makkar, H.P. Effects and fate of tannins in ruminant animals, adaptation to tannins, and strategies to overcome detrimental effects of feeding tannin-rich feeds. Small Rumin. Res. 2003, 49, 241–256. [Google Scholar] [CrossRef]
  51. Díaz Carrasco, J.M.; Cabral, C.; Redondo, L.M.; Pin Viso, N.D.; Colombatto, D.; Farber, M.D.; Fernández Miyakawa, M.E. Impact of Chestnut and Quebracho Tannins on Rumen Microbiota of Bovines. Biomed Res. Int. 2017, 2017, 9610810. [Google Scholar] [CrossRef] [Green Version]
  52. Buccioni, A.; Pauselli, M.; Viti, C.; Minieri, S.; Pallara, G.; Roscini, V.; Rapaccini, S.; Trabalza, M.M.; Lupi, P.; Conte, G.; et al. Milk fatty acid composition, rumen microbial population, and animal performances in response to diets rich in linoleic acid supplemented with chestnut or quebracho tannins in dairy ewes. J. Dairy Sci. 2015, 98, 1145–1156. [Google Scholar] [CrossRef] [Green Version]
  53. Moss, A.R.; Jouany, J.P.; Newbold, J. Methane production by ruminants: Its contribution to global warming. Ann. Zootech. 2000, 49, 231–253. [Google Scholar] [CrossRef] [Green Version]
  54. Aboagye, I.A.; Oba, M.; Castillo, A.R.; Koenig, K.M.; Iwaasa, A.D.; Beauchemin, K.A. Effects of hydrolyzable tannin with or without condensed tannin on methane emissions, nitrogen use, and performance of beef cattle fed a high forage diet 1,2. J. Anim. Sci. 2018, 96, 5276–5286. [Google Scholar] [CrossRef] [PubMed]
  55. Avila, A.S.; Zambom, M.A.; Faccenda, A.; Werle, C.H.; Almeida, A.R.E.; Schneider, C.R.; Grunevald, D.G.; Faciola, A.P. Black Wattle (Acacia mearnsii) condensed tannins as feed additives to lactating dairy cows. Animals 2020, 10, 662. [Google Scholar] [CrossRef] [PubMed]
  56. Aguerre, M.J.; Capozzolo, M.C.; Lencioni, P.; Cabral, C.; Wattiaux, M.A. Effect of quebracho-chestnut tannin extracts at 2 dietary crude protein levels on performance, rumen fermentation, and nitrogen partitioning in dairy cows. Int. J. Dairy Sci. 2016, 99, 4476–4486. [Google Scholar] [CrossRef] [PubMed] [Green Version]
  57. Cangiano, L.R.; Henry, D.D.; Ciriaco, F.M.; Quintela, J.C.; DiLorenzo, N.; Ipharraguerre, I.R. Triterpenes from Olea europaea modulate in vitro ruminal fermentation. Transl. Anim. Sci. 2022, 6, txac056. [Google Scholar] [CrossRef] [PubMed]
  58. Benchaar, C.; McAllister, T.A.; Chouinard, P.Y. Digestion, Ruminal Fermentation, Ciliate Protozoal Populations, and Milk Production from Dairy Cows Fed Cinnamaldehyde, Quebracho Condensed Tannin, or Yucca schidigera Saponin Extracts. Int. J. Dairy Sci. 2008, 91, 4765–4777. [Google Scholar] [CrossRef] [Green Version]
  59. Jäger, E.J. Rothmaler-Exkursionsflora Von Deutschland; Springer: Berlin/Heidelberg, Germany, 2017; p. 930. [Google Scholar]
  60. AOAC. Official Methods of Analysis, 18th ed.; AOAC International: Rockville, MD, USA, 2005; p. 24. [Google Scholar]
  61. Van Soest, P.J.; Robertson, J.B.; Lewis, B.A. Methods for dietary fibre, neutral detergent fibre, and no starch polysaccharides in relation to animal nutrition. J. Dairy Sci. 1991, 74, 3583–3597. [Google Scholar] [CrossRef]
  62. Pacifico, S.; Gallicchio, M.; Lorenz, P.; Duckstein, S.M.; Potenza, N.; Galasso, S.; Marciano, S.; Fiorentino, A.; Stintzing, F.C.; Monaco, P. Neuroprotective potential of Laurus nobilis antioxidant polyphenol-enriched leaf extracts. Chem. Res. Toxicol. 2014, 27, 611–626. [Google Scholar] [CrossRef]
  63. Formato, M.; Piccolella, S.; Zidorn, C.; Pacifico, S. UHPLC-HRMS Analysis of Fagus sylvatica (Fagaceae) Leaves: A Renewable Source of Antioxidant Polyphenols. Antioxidants 2021, 10, 1140. [Google Scholar] [CrossRef]
  64. Theodorou, M.K.; Williams, B.A.; Dhanoa, M.S.; McAllan, A.B.; and France, J.A. Simple gas production method using a pressure transducer to determine the fermentation kinetics of ruminant feeds. Anim. Feed Sci. Technol. 1994, 48, 185–197. [Google Scholar] [CrossRef]
  65. Vastolo, A.; Calabrò, S.; Cutrignelli, M.I.; Raso, G.; Todaro, M. Silage of prickly pears (Opuntia spp.) juice by-products. Animals 2020, 10, 1716. [Google Scholar] [CrossRef]
  66. EC Council. Regulation 882/2004 on Official controls performed to ensure verification of compliance with feed and food law, animal health and animal welfare rules. Off. J. Eur. Union 2004, L191/1, 1–52. [Google Scholar]
  67. Pelagalli, A.; Musco, N.; Trotta, N.; Cutrignelli, M.I.; Di Francia, A.; Infascelli, F.; Tudisco, R.; Lombardi, P.; Vastolo, A.; Calabrò, S. Chemical characterisation and in vitro gas production kinetics of eight faba bean varieties. Animals 2020, 10, 398. [Google Scholar] [CrossRef] [Green Version]
  68. Calabrò, S.; Musco, N.; Roberti, F.; Vastolo, A.; Coppola, M.; Esposito, L.; Cutrignelli, M.I. Fermentability characteristics of different Saccharomyces cerevisiae cell wall using cat faeces as inoculum. Ital. J. Anim. Sci. 2020, 19, 186–193. [Google Scholar] [CrossRef]
  69. Groot, J.C.J.; Cone, J.W.; Williams, B.A.; Debersaques, F.M.A.; Lantinga, E.A. Multiphasic analysis of gas production kinetics for in vitro fermentation of ruminant feeds. Anim. Feed Sci. Technol. 1996, 64, 77–89. [Google Scholar] [CrossRef]
  70. Bauer, E.; Williams, B.A.; Voigt, C.; Mosenthin, R.; Verstegen, M.W.A. Microbial activities of faeces from unweaned and adult pigs, in relation to selected fermentable carbohydrates. Anim. Sci. J. 2001, 73, 313–322. [Google Scholar] [CrossRef]
Figure 1. Castanea sativa Mill. leaf chemical composition parameters expressed as % of DM, and fractionation scheme to achieve bioactive fractions. DM: dry matter; NDF: neutral detergent fiber; ADF: acid detergent fiber; ADL: acid detergent lignin; CP: crude protein; EE: ether extract; NSC: no structural carbohydrates; UAM: ultrasound assisted maceration; LLE: liquid–liquid extraction; HaF: hydroalcoholic fraction; XAD-4 GPC: gel permeation chromatography on Amberlite XAD-4 absorbent resin.
Molecules 27 08662 g001
Figure 2. (A) (a) Total phenolic content (TPC), expressed as mg of gallic acid equivalents (GAEs) per g of extract; (b) total flavonoid content (TFC), expressed as mg of quercetin equivalents (QUEs) per g of extract. Values reported are the mean ± SD of three independent measurements. (B) (a) Scavenging capability (SC%) vs. 2,2′-azino-bis(3-ethylbenzothiazoline)-6-sulfonic acid (ABTS) radical cation; (b) scavenging capability (SC%) vs. 2,2-diphenyl-1-picrylhydrazy (DPPH) radical, and (c) Fe(III) reducing power (RP%) of C. sativa extract and organic fractions therefrom. Values reported are the mean ± SD of three independent measurements.
Molecules 27 08662 g002
Figure 3. (A) Total ion current (TIC) chromatograms of Cs/1/1 extract, Cs/2/1 fraction, and Cs/3/2 fraction. (B) The relative content of each extract/fraction in derivatives of benzoic acid (BA), hydroxycinnamic acid (HcA), derivatives of gallic (GDs) and ellagic acid (EDs) as well as flavonoids (Fl), gallotannins (GTs), ellagitannins (ETs), fatty acids (FAs), and triterpenes (Trp), is shown. (C) Principal component analysis (PCA), based on different classes of identified compounds. PC1 % variance = 68.3; PC2 % variance = 31.3.
Molecules 27 08662 g003
Figure 4. TOF-MS/MS spectra of ellagitannins 13 (A), 25 (B) and 27 (C) with [M-H] ions at m/z 783.0735, 785.0884 and 633.0739, which were detected in alcoholic extract Cs/1/1 and its polyphenols enriched extract Cs/3/2.
Molecules 27 08662 g004
Figure 5. TOF-MS/MS spectra of the acylated quercetin glycosides 75 (A) and 76 (B) and acylated kaempferol glycosides 77 (C), 86 (D) and 92 (E), which were detected also in the apolar fraction Cs/2/1.
Molecules 27 08662 g005
Figure 6. In vitro fermentation rate over time of C. sativa Cs/1/1 extract (A) and its fractions Cs/2/1 (B) and Cs/3/2 (C) at the 50-mg () and 200-mg () dose levels and control diet ().
Molecules 27 08662 g006
Figure 7. Scatter plots of the percentage increase or decrease in each volatile fatty acid and pH after 24 of incubation for different tested dose levels ( 50 mg and 200 mg) vs. % in the control diet, considering Cs/1/1 extract (A) and its fractions Cs/2/1 (B) and Cs/3/2 (C).
Molecules 27 08662 g007
Table 1. Quinic acid and phenolic acid glycosides tentatively identified in the chestnut Cs/1/1 alcoholic extract and its Cs/2/1 and Cs/3/2 fractions. RT = retention time; RDB = ring double bond equivalent value. Base peak fragments are reported in bold. Detected (Grey color box = not detected).
PeakRtTentative AssignmentFormula[M-H]
Found
(m/z)
Error
(ppm)
RDBCs/1/1Cs/2/1Cs/3/2
10.288Quinic acid C7H12O6191.05620.52
101.260Dihydroxybenzoic acid hexoside C13H16O9315.07240.86
203.929p-Coumaric acid hexoside IC15H18O8325.0926−0.97
224.609p-Coumaric acid hexoside IIC15H18O8325.0926−0.97
244.988Caffeic acid hexosideC15H18O9341.0871−1.27
265.6285-O-Caffeoyl quinic acidC16H18O9353.08841.78
357.0803-O-p-Coumaroyl quinic acid C16H18O8337.0925−1.28
367.2183-O-p-Coumaroyl quinic acid C16H18O8337.09331.28
5610.379Benzyl-dihydroxybenzoate-O-pentosyl hexoside IC25H30O13537.16241.911
5910.635Benzyl-dihydroxybenzoate-O-hexoside C20H22O9405.11920.210
7413.160Benzyl-dihydroxybenzoate-O-pentosyl hexoside IIC25H30O13537.16354.011
Table 2. Gallo- and ellagitannin compounds (and their metabolic precursors) tentatively identified in the chestnut Cs/1/1 alcoholic extract and its fractions. Rt = retention time. Base peak fragments are reported in bold. Detected (Grey color box = not detected).
PeakRtTentative AssignmentFormula[M-H]
Found
(m/z)
Error
(ppm)
Cs/1/1Cs/2/1Cs/3/2
20.602Galloyl hexose IC13H16O10331.0670−0.2
30.680Pyrogallol gallic acidC13H10O8293.03020.1
40.680Hexahydroxydiphenic acidC14H10O10337.02040.8
50.721Gallic acidC7H6O5169.01515.0
60.776Galloyl hexose IIC13H16O10331.0669−0.5
71.008Digalloyl hexose IC20H20O14483.07851.0
81.1243,4,5-trihydroxybenzyl hexoside I (e.g., crenatin)C13H18O9317.08790.3
91.163NHTP-HHDP-hexose I C41H26O26933.0640;
466.0328 [M-2H]2−
1.8
111.4173,4,5-trihydroxybenzyl hexoside IIC13H18O9317.0877−0.3
121.535Galloyl hexose IIIC13H16O10331.06741.0
131.632Bis-HHDP-hexose IC34H24O22783.07001.7
141.768Galloyl shikimic acid IC14H14O9325.0554−3.4
151.827NHTP-HHDP-hexose IIC41H26O26933.0641;
466.0326 [M-2H]2−
0.2
162.087Galloyl shikimic acid IIC14H14O9325.0563−0.6
172.187Galloyl dihydroxybenzoic acidC14H10O8305.03050.7
182.385Galloyl shikimic acid IIIC14H14O9325.0566−0.1
193.314Bis-HHDP-hexose IIC34H24O22783.06961.2
214.589Galloyl-chebuloyl-HHDP-hexose IC41H30O27953.0901−0.1
234.966HHDP-valoneoyl-hexoseC41H28O27951.07611.7
255.268Digalloyl-HHDP-hexose IC34H26O22785.08571.8
276.004Galloyl-HHDP-hexoseC27H22O18633.07421.8
286.004Galloyl-bis-HHDP-hexose IC41H28O26935.08182.1
296.244Methylvaloneoyl–NHTP–hexoseC49H32O31557.0405 [M-2H]2−1.8
306.165Digalloyl hexose IIC20H20O14483.07881.6
316.560Galloyl-bis-HHDP-hexose II
(e.g., stachyurin/casuarinin)
C41H28O26935.08010.5
326.500Galloyl-chebuloyl-HHDP-hexose II
(e.g., chebulagic acid)
C41H30O27953.09090.8
336.546Trigalloyl hexose IC27H24O18635.08920.3
346.819Chesnatin C27H26O18637.10642.8
377.297Digalloyl-HHDP-hexose IIC34H26O22785.08561.7
387.417Digalloyl deoxyhexoseC20H20O13467.08432.5
398.110Isochesnatin C27H26O18637.10632.6
408.327Galloyl phenol hexoside I (e.g., cretanin)C20H22O13469.09961.8
418.581Galloyl-bis-HHDP-hexose IIIC41H28O26935.0797;
467.0375 [M-2H]2−
0.1
428.721Galloyl phenol hexoside IIC20H22O13469.09972.0
438.919Trigalloyl hexose IIC27H24O18635.09052.4
449.000Trigalloyl-valoneoyl-HHDP-hexoseC48H34O31552.0490 [M-2H]2−1.1
459.455Trigalloyl-HHDP-hexoseC41H30O26937.0947;
468.0454 [M-2H]2−
−0.6
479.704Tetragalloyl hexoseC34H28O22787.10071.0
489.704Ellagic acid pentosideC19H14O12433.04150.6
499.754ChestaninC40H42O26937.18940.3
5810.592IsochestaninC40H42O26937.19041.3
6911.980Trimethylellagic acid hexoseC23H24O13551.057 [M+FA]n.c.
8114.174Trimethylellagic acid deoxyhexoseC23H22O12535.1106 [M+FA]n.c.
8214.174Trimethylellagic acid IC17H12O8343.0455−1.3
8715.139Trimethylellagic acid IIC17H12O8343.0459−0.1
Table 3. Flavonoid compounds tentatively identified in the chestnut Cs/1/1 alcoholic extract and its Cs/2/1 and Cs/3/2 fractions. Rt = retention time. Base peak fragments are reported in bold. Detected (Grey color box = not detected).
PeakRtTentative AssignmentFormula[M-H]
Found
(m/z)
Error
(ppm)
Cs/1/1Cs/2/1Cs/3/2
469.595Quercetin pentosyl-hexosideC26H28O16595.13182.3
509.969Quercetin hexuronide IC21H18O13477.06862.6
519.911Quercetin 3-O-hexoside IC12H20O12463.08932.4
5210.009RutinC27H30O16609.14792.9
5310.067Quercetin 3-O-hexoside IIC12H20O12463.08922.2
5410.315Quercetin hexuronide IIC21H18O13477.06801.1
5510.315Quercetin 3-O-hexoside IIIC12H20O12463.08901.7
5710.515Quercetin 3-O-pentosideC20H18O11433.07861.5
6010.810Kaempferol deoxyhexosyl-hexoside IC27H30O15593.15333.5
6110.887Isorhamnetin deoxyhexoside IC21H20O11447.09411.8
6211.099Isorhamnetin deoxyhexosyl-hexoside IC28H32O16623.16322.2
6311.176Kaempferol deoxyhexosyl-hexoside IIC27H30O15593.15262.4
6411.196Isorhamnetin 3-O-hexoside IC22H22O12477.10461.6
6511.293Isorhamnetin deoxyhexoside IIC21H20O11447.09350.5
6611.293Isorhamnetin hexuronideC22H20O13491.08412.0
6711.510Isorhamnetin deoxyhexosyl-hexoside IIC28H32O16623.16332.3
6811.570Isorhamnetin 3-O-hexoside IIC22H22O12477.10512.6
7012.181Kaempferol acetylhexoside IC23H22O12489.10584.0
7112.402QuercetinC15H10O7301.0354−0.3
7212.737LuteolinC15H10O6285.0398−2.3
7312.819Kaempferol acetylhexoside IIC23H22O12489.10512.6
7513.729Quercetin p-coumaroyl-hexosideC30H26O14609.12581.3
7613.749Quercetin p-coumaroyl- deoxyhexosyl-hexoside IC36H36O18755.18543.3
7713.769Kaempferol p-coumaroyl-hexoside IC30H26O13593.13262.4
7813.968Quercetin hexuronide butyl-esterC25H26O14533.13162.9
7913.968Quercetin p-coumaroyl- deoxyhexosil-hexoside IIC36H36O18755.18503.3
8013.984KaempferolC15H10O6285.0403−0.6
8314.366Kaempferol p-coumaroyl deoxyhexosyl hexoside IC36H36O17739.18941.9
8514.561Kaempferol p-coumaroyl-hexoside IIC30H26O13593.13111.7
8614.643Kaempferol p-coumaroyl deoxyhexosyl hexoside IIC36H36O17739.18992.9
8815.563Kaempferol acetyl p-coumaroyl-hexoside C32H28O14635.14324.0
8915.799MethylkaempferolC16H12O6299.0559−0.7
9117.088Kaempferol di-p-coumaroyl hexoside IC39H32O15739.16953.6
9217.284Kaempferol di-p-coumaroyl hexoside IIC39H32O15739.16943.3
9317.313AcacetinC16H12O5283.0611−0.3
9618.337Kaempferol acetyl di-p-coumaroyl
hexoside I
C41H34O16781.17922.3
9718.594Kaempferol acetyl di-p-coumaroyl
hexoside II
C41H34O16781.17972.9
10019.954Kaempferol di-acetyl di-p-coumaroyl hexoside IC43H36O17823.1879−0.1
10220.144Kaempferol di-acetyl di-p-coumaroyl hexoside IIC43H36O17823.18850.6
Table 4. Lipid compounds tentatively identified in the chestnut Cs/1/1 alcoholic extract and its Cs/2/1 and Cs/3/2 fractions. Rt = retention time; RDB = ring double bond equivalent value. Base peak fragments are reported in bold. Detected (Gray color box = not detected).
PeakRtTentative AssignmentFormula[M-H]
Found
(m/z)
Error
(ppm)
Cs/1/1Cs/2/1Cs/3/2
8414.436Traumatic acidC12H20O4227.12911.0
9016.0193,7,24-trihydroxy-cycloartene-28-oic acid hexoside C36H58O10695.4037
[M+FA]
n.c.
9417.3433,7-dihydroxynorcycloartane 24,28-dioic acid
(e.g., castaartancrenoic acid A)
C27H42O6461.29212.7
9517.856Cycloartane-type triterpene C30H50O6505.35441.9
9818.752Cycloartane-type triterpene C27H42O5445.2956−0.8
9919.845Cycloartane-type triterpene C30H48O5487.34351.2
10120.044Cycloartane-type triterpene C30H48O5487.34371.6
10320.256Cycloartane-type triterpene C30H48O5487.34381.8
10420.425Pentacyclic triterpene C30H48O6503.33831.0
10520.606DGMG (18:3) C33H56O14675.36010.5
10620.7219-oxooctadeca-10,12-dienoic acidC18H32O3293.21230.3
10720.721Pentacyclic triterpeneC30H48O6503.33851.4
10821.1009-oxooctadeca-10,12,15 trienoic acidC18H28O3291.1965−0.2
10921.318l-PA (18:3)C21H37O7P431.22121.8
11021.846Pentacyclic triterpeneC30H48O4471.3501
517.3558
[M+FA]
4.5
11122.313l-PA (16:0)C19H39O7P409.2358−0.6
11222.513Pentacyclic triterpeneC30H48O4471.34871.5
11322.654Pentacyclic triterpeneC30H48O5487.34402.9
11422.695Pentacyclic triterpeneC30H48O4471.34800.1
11522.784Pentacyclic triterpeneC30H48O5487.34330.8
11622.975Linolenic acidC18H30O2277.2172−0.4
11723.115Pentacyclic triterpeneC30H48O4471.34830.6
11823.215Pentacyclic triterpene (e.g., ursolic or oleanolic acid)C30H48O3455.35371.4
11923.496Linoleic acidC18H32O2279.2324−2.0
Table 5. (A) In vitro cumulative gas production, organic matter degradability, and fermentation kinetics parameters of different C. sativa extracts. OMD: organic matter degradability; OMCV: cumulative volume of gas related to incubated OM. Rmax: maximum fermentation rate; Tmax: time at which Rmax occurs. * p < 0.05, ** p < 0.01 and *** p < 0.001. NS: not significant. (B) In vitro gas production over time of C. sativa Cs/1/1 extract and its fractions Cs/2/1 and Cs/3/2 at 50-mg () and 200-mg () dose levels and control diet ().
(A) (B)
control dietCs/1/1Molecules 27 08662 i001
Parameter 50 mg200 mg
OMD (%)74.965.0 **68.9 **
OMCV (mL/g)244208 ***234 NS
Tmax (h)3.111.49 **1.24 **
Rmax (mL/h)10.69.14 NS10.1 NS
control dietCs/2/1Molecules 27 08662 i002
50 mg200 mg
OMD (%)74.964.9 **65.9 ***
OMCV (mL/g)244194 ***184 ***
Tmax (h)3.110.46 ***0.33 ***
Rmax (mL/h)10.69.25 NS8.69 *
control dietCs/3/2Molecules 27 08662 i003
50 mg200 mg
OMD (%)74.967.7 **67.5 **
OMCV (mL/g)244215 **219 **
Tmax (h)3.111.07 **3.91 NS
Rmax (mL/h)10.68.17 *7.04 **
Table 6. In vitro gas production and fermentation rate of different C. sativa extracts after 24 h of incubation. OMD: organic matter degradability; CH4 (mL/g iOM): methane production related to incubate organic matter; CH4 (mL/d OM): mL of methane production related to degraded OM. Along the row ** p < 0.01 and *** p < 0.001; NS: not significant; MSE: mean square error.
Control DietCs/1/1Cs/2/1Cs/3/2MSE
50 mg200 mg50 mg200 mg50 mg200 mg
OMD44.744.8 NS56.3 ***47.3 NS54.6 ***47.0 NS56.3 ***0.61
CH4 (mL/g iOM)10.32.41 ***2.14 ***2.56 ***2.43 ***6.96 **6.63 ***0.15
CH4(mL/d OM)23.15.38 ***3.79 ***5.41 ***4.45 ***14.8 **11.8 ***0.71
Table 7. Effects of C. sativa Cs/1/1 extract and its fractions Cs/2/1 and Cs/3/2 at 50-mg and 200-mg dose levels on fermentation end products after 120 h of incubation. Total VFA: total volatile fatty acids (acetate + propionate + butyrate + iso-butyrate + valerate + iso-valerate); AcA = acetic acid; PrA = propionic acid; ButA = Butyric acid; ValA = valeric acid; iso-ButA = iso-butyric acid; iso-ValA = iso-valeric acid; BCFA= branched chain fatty acids (iso-butyrate + iso-valerate/total VFAs); A/P = acetate/propionate. Along the row * p < 0.05, ** p < 0.01 and *** p < 0.001; NS: not significant; MSE: mean square error. In the lower panel, the percentage increase or decrease in each volatile fatty acid is plotted for different tested dose levels ( 50 mg and 200 mg) vs. FA% in the control diet.
Control
Diet
Cs/1/1Cs/2/1Cs/3/2MSE
50 mg200 mg50 mg200 mg50 mg200 mg
pH6.206.46 ***6.43 ***6.49 ***6.35 **6.34 **6.31 *0.0006
Total VFA
(mmol/L)
57.275.0 ***76.9 ***68.7 **88.2 ***80.4 ***73.5 ***1.33
AcA
(% VFA)
64.756.8 **54.8 **55.5 **55.9 **55.8 **60.3 *1.59
PrA
(% VFA)
15.121.5 **24.9 ***22.3 ***22.3 ***23.5 **19.7 ***0.98
ButA
(% VFA)
11.916.5 *15.4 *16.5 *16.6 *16.1 *16.0 *1.03
ValA
(% VFA)
3.982.21 ***2.25 ***3.05 **2.28 ***2.53 **1.73 ***0.020
iso-ButA
(% VFA)
0.990.80 *0.69 *0.72 *0.93 NS0.77 *0.62 **0.002
iso-ValA
(% VFA)
3.252.17 ***2.24 ***1.89 ***1.96 ***1.29 ***1.65 ***0.003
BCFA
(% VFA)
7.423.95 ***3.80 ***3.08 ***3.28 ***2.56 ***3.09 ***0.014
A/P4.272.64 ***2.20 ***2.50 ***2.50 ***2.38 ***3.06 ***0.03
AcA
PrA
ButA
ValA
iso-ButA
iso-ValA
Molecules 27 08662 i004Molecules 27 08662 i005Molecules 27 08662 i006
Publisher’s Note: MDPI stays neutral with regard to jurisdictional claims in published maps and institutional affiliations.

