Article

Integrated Adsorption–Photodegradation of Organic Pollutants by Carbon Xerogel/Titania Composites

1
Department of Chemical and Process Engineering, University of Strathclyde, Glasgow G1 1XJ, UK
2
College of Medicine and Surgery, The Shaheed Zulfiqar Ali Bhutto Medical University Islamabad, Islamabad 44000, Pakistan
3
Pakistan Council of Research in Water Resources (PCRWR), Islamabad 44000, Pakistan
*
Author to whom correspondence should be addressed.
Molecules 2022, 27(23), 8483; https://doi.org/10.3390/molecules27238483
Submission received: 1 November 2022 / Revised: 25 November 2022 / Accepted: 28 November 2022 / Published: 2 December 2022
(This article belongs to the Special Issue Innovative Adsorbents for Water Treatment)

Abstract

:
Recent studies on the removal of pollutants via adsorption include the use of carbon-based adsorbents, due to their high porosity and large surface area; however, such materials lack photoactive properties. This study evaluates the synergistic effect of integrated mesoporous carbon xerogel (derived from resorcinol formaldehyde) and titanium dioxide (TiO2) for combined adsorption and photodegradation application. The complex formed between carbon xerogel and TiO2 phase was investigated through FTIR, proving the presence of a Ti-O–C chemical linkage. The physicochemical properties of the synthesised adsorbent–photocatalyst were probed using FESEM, BET analysis and UV–Vis analysis. The kinetics, equilibrium adsorption, effect of pH, and effect of adsorbent dosage were investigated. The expansion of the absorbance range to the visible range was verified, and the corresponding band gap evaluated. These properties enabled a visible light response when the system was exposed to visible light post adsorption. Hence, an assistive adsorption–photodegradation phenomenon was successfully executed. The adsorption performance exhibited 85% dye degradation which improved to 99% following photodegradation. Further experiments showed the reduction of microorganisms under visible light, where no microbial colonies were observed after treatment, indicating the potential application of these composite materials.

1. Introduction

Amongst several conventional water treatment techniques, adsorption is recognised as one of the most simple, reliable, and effective methods. New techniques use nano adsorbents, of which one of the main groups for wastewater treatment are carbon-based adsorbents [1]. Generally, carbon is preferred, due to its high effectiveness, abundant availability, and low cost. However, adsorption using basic carbon materials is restricted by slow kinetics, while advanced adsorbents, for example, zeolites or metal-based nano-adsorbents are expensive, and experience a loss of adsorption sites during the desorption process, resulting in pollution during the application process and requiring high energy for their regeneration [2].
Photodegradation techniques use light irradiance for the activation of a photocatalyst, upon which they generate charge carriers which transfer to the surface and undergo a series of chemical reactions to generate reactive oxide species or hydroxyl radicals. These species target the pollutant surface and chemically decompose it into harmless substances [3]. Titanium dioxide (TiO2) is widely studied in this regard, due to its non-toxicity, cost efficiency and ability to oxidise organic pollutants and eventually convert them to carbon dioxide and water [4]. The major limitations encountered by TiO2, which restricts the process efficiency, include agglomeration, wide band gap and rapid recombination of photogenerated charge carriers. Nevertheless, the adsorption capacity on the surface of TiO2 is poor; therefore, the degradation process is restricted. The use of carbon as a support matrix can not only enhance the adsorption capacity, but also solve the problem of charge recombination [5]. Additionally, chemical functionalisation can modify the bandgap of TiO2; hence, enhanced performance of an integrated system under visible light is possible.
As a consequence of the likelihood of improved performance through composite development, several studies have reported on the functional crosslinking of carbon and TiO2 through a wide range of synthesis procedures [6]. Sol–gel is commonly employed, as the synthesis process can be controlled to achieve strong chemical bonding and dispersibility of TiO2 nanoparticles. Other methods are expensive, time-consuming and difficult to implement, due to stringent control of factors [7]. With regard to material properties, studies related to chemical interactions between carbon and TiO2 are limited. Not many studies report on the complex formation between functional moieties of carbon and TiO2, which is theoretically responsible for the modification of the electronic structure and thus enables visible light response [8]. In this study, we have integrated TiO2 in a nano mesoporous carbon xerogel (CX) to obtain a visible light-activated adsorbent–photocatalyst. CX was derived from the polycondensation of resorcinol and formaldehyde in the presence of a base catalyst. Resorcinol formaldehyde gels have been utilised for several applications including thermal insulation [9], electrical conductivity [10], adsorption, and gas storage [11]. However, less attention has been paid to studying their application in the water treatment sector, particularly for visible light photocatalysis. Our reasons for choosing resorcinol–formaldehyde as a carbon source to produce CX were (i) it is composed of a unique structure (aromatic rings and OH groups), which can bind with TiO2 to produce new electronic interactions between CX and TiO2 and activate visible light response; and (ii) the materials are generally highly mesoporous structures, possessing large surface areas for effective adsorption of pollutants. Within the nanostructure, homogenously distributed TiO2 forms a heterojunction with the carbon substrate, due to the chemical interaction between CX and TiO2, resulting in complex formation at the interface of the material. Remarkably, such structures can absorb visible light and exhibit photoactivity under visible light irradiation.
This indicates that integrated CX and TiO2 may be an effective adsorbent–photocatalyst to target a wide range of pollutants in contaminated water, including dyes and microbes. Thus, a combined photocatalytic adsorbent, CXTi, was synthesised to exploit the synergistic effect of both adsorption and photocatalysis. The ratios of CX and TiO2 were carefully selected to optimise the physicochemical and optical properties imperative to maximise adsorbent–adsorbate interactions and utilisation of a wide fraction of the electromagnetic spectrum. The synthesised CXTi was tested against adsorption and photodegradation of methylene blue (MB) from aqueous solutions, and the acquired data analysed using kinetic and isothermal analysis. Additionally, antimicrobial tests were performed against the reduction of an indicator microorganism, i.e., total faecal coliform.

2. Results and Discussion

2.1. Structural Properties of CXTi

Figure 1a–c show micrographs of synthesised CXTi at different magnifications, which confirm that the carbons phase developed as a spherical form, as previously reported for carbons derived from the polycondensation and subsequent pyrolysis of resorcinol and formaldehyde gels [12]. The micrographs reveal uniform microclusters of interconnected microspheres with diameters in the range 1.2–1.5 μm. The surface heterogeneity/roughness observed in a section of the micrograph in Figure 1c, marked by red arrows, denotes carbon xerogel spheres engulfed by TiO2 nanoparticles. The yellow arrows show the porosity in the CXTi structure. The chemical bonding between carbon and TiO2 was confirmed by the recorded FTIR spectrum, shown in Figure 1d, where characteristic peaks of a typical resorcinol–formaldehyde-derived carbon were observed, including signals from C-H, C=C, C-O-C of aromatic rings and methylene bridges [13]. The broad peak at 3300 cm−1 is associated with OH of the phenolic groups. The vibrations in the range 2000–1700 are ascribed to C-H bending of aromatic moieties. The aromatic ether bridges formed during the polycondensation of resorcinol (R) and formaldehyde (F) result in the absorption bands observed at 1605 and 1473 cm−1. These observations are in agreement with those reported by Awadallah et al., for the mesoporous RF xerogels [14]. The chemical bonding between the carbon xerogel and TiO2 was confirmed by Ti-O-C functionalities in the range 1200–1000 cm−1 [15], indicating that the surface moieties of carbon xerogel support the attachment of TiO2. This heterojunction has been reported as a charge–transfer complex, which promotes electronic interactions and enhances the visible light response of the integrated carbon and TiO2 material [16,17]. Furthermore, signals below 1000 cm−1 are attributed to functional groups of titanium ethoxide and Ti-O-Ti linkages [18].
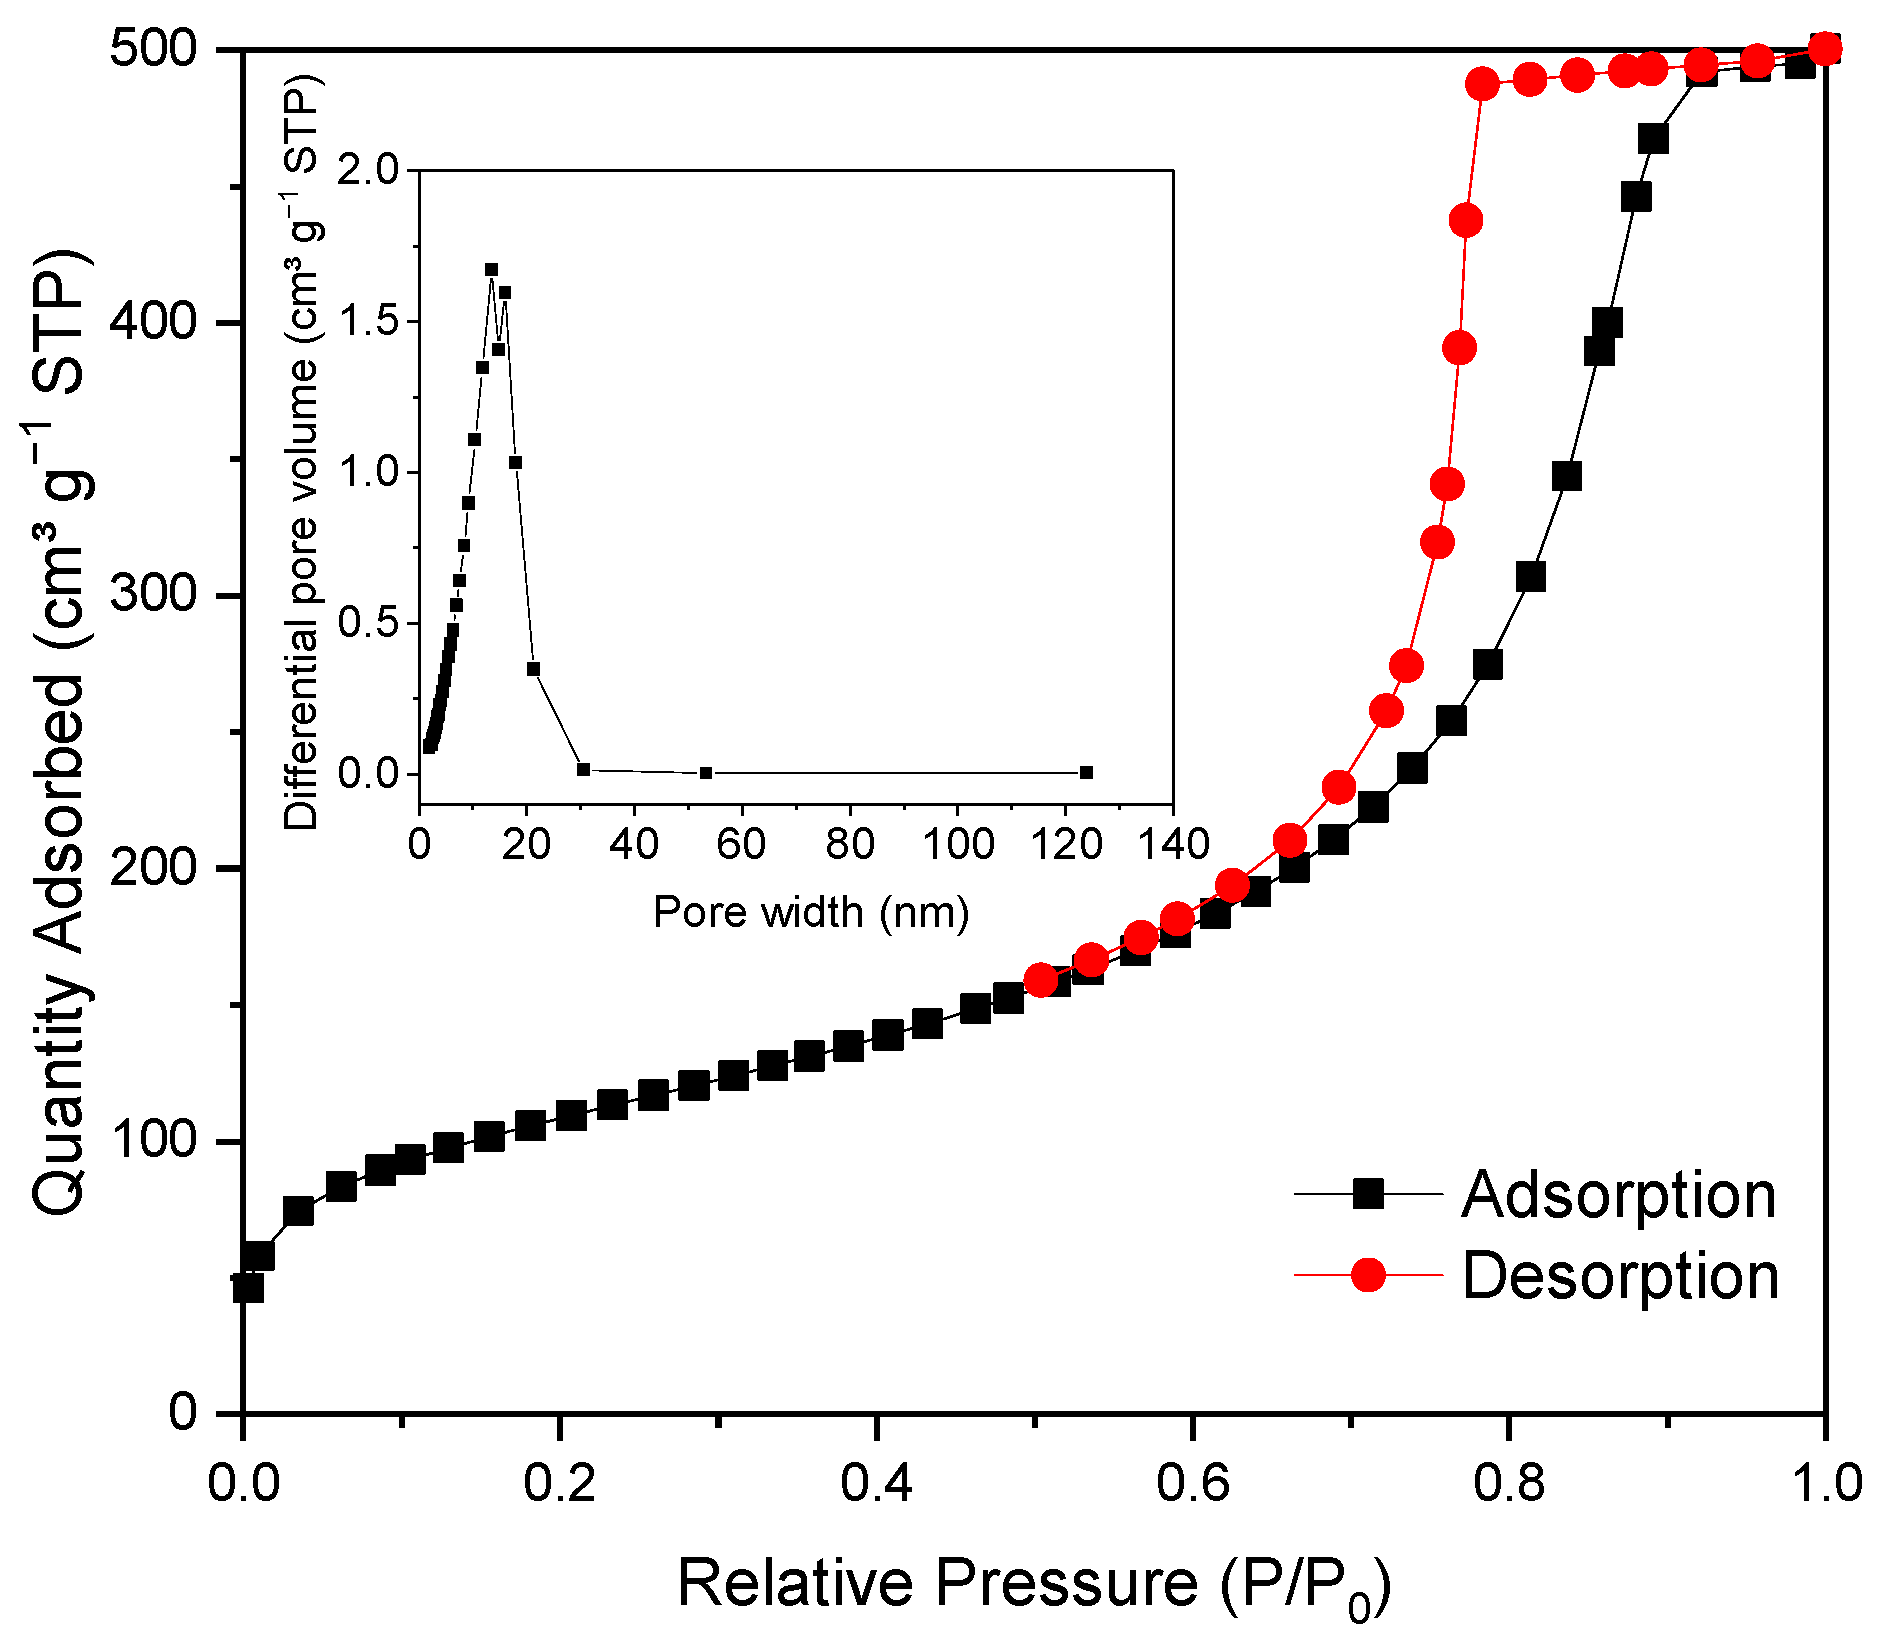
The surface area and porosity of synthesised CXTi were obtained using nitrogen sorption isotherms and subsequent BJH analysis to determine the pore size distributions [19], as shown in Figure 2. The isotherm shows that the characteristics of a typical mesoporous carbon xerogel derived from resorcinol–formaldehyde are retained [12]. The BET surface area and pore volume were calculated to be 384 m2 g−1 and 0.8 cm3 g−1, respectively. A narrow pore size distribution was observed, and the average pore width was calculated to be ~9 nm, as represented in the inset of Figure 2. It is evident that the shape of the isotherm is Type IV with a distinct hysteresis loop of Type H1 [20]. These findings suggest the presence of ordered mesopores with a uniform cylindrical shaped, open-ended three-dimensional pore network [20]. The calculated mesoporosity in the structure was 93%. These textural properties, comprising high surface area and well-developed mesoporous structure, are expected to facilitate the adsorption process and enhance the photocatalytic activity.
High adsorbent loading appears to reduce adsorption performance, while low adsorbent loading results in fewer pollutant molecules interacting with the active sites on the adsorbent; hence, the amount of adsorbent used is crucial in determining the ultimate adsorption performance. The study of the effect of dosage rate of CXTi on adsorption performance was performed at an initial concentration of 100 mg L−1 of MB (Figure 3a). It was observed that the amount of MB adsorbed increased rapidly with increasing adsorbent dose, from 0.005 to 0.01 g, tested against 25 mL of MB solution. This is attributed to the large surface area, mesoporous character and availability of vacant adsorptive sites associated with the CXTi sorbent. Further increase in adsorbent dose, up to 0.10 g, showed no significant increase in removal of MB. At this point, the concentration of adsorbate on the surface of the adsorbent, and the adsorptive in solution, reach equilibrium. Accordingly, 0.01 g was chosen as the optimal amount of adsorbent per 25 mL to conduct the following adsorption experiments.
Additionally, for optimum adsorption performance, it is important to determine a suitable operating pH, since this affects the surface charge and ionisation of pollutant molecules, while unfavourable adsorption, dissolution and decomposition lead to low adsorption uptakes [21]. Figure 3b shows the effect of pH on the adsorption of MB by CXTi, as a function of pH value. The adsorption capacity of MB at acidic pH (≤6) was low, which may be due to the positively charged sample surface repelling the cationic MB dye molecules. At higher pH values, i.e., more basic, in the range of 8–12, the interface of CXTi is negatively charged, which means it can favourably adsorb the cationic MB molecule; hence, enhanced adsorption capacity is observed. Therefore, a pH of ~7.2 was maintained for all remaining adsorption experiments.

2.2. Adsorption Kinetics

Figure 4 shows the kinetic data obtained for MB adsorption on CXTi at different initial concentrations (50–200 mg L−1) and contact times (0–240 min). It was observed that the adsorption capacity increases with increase in initial concentration, as time elapsed. This is attributed to increased frequency of collisions between MB molecules and the sample surface, which overcomes the resistance to mass transfer between the adsorbate and the adsorbent, and results in the immediate occupancy of available active sites [22]. Rapid attainment of equilibrium is attributed to the highly porous nature of the sample with abundant active sites. In this case, π-π interactions between the MB dye molecules and the aromatic groups of the carbon xerogel, along with electrostatic interactions between the MB dye molecules and the hydroxyl groups of TiO2, are predominant binding strengths between the adsorbent and adsorbate. The adsorption process slows after this initial phase and eventually attains equilibrium at 90 min, as the mass transfer rate slows down due to saturation of the active sites, thus making it difficult for the MB molecules to further adsorb on the sample surface. In addition to this, higher initial concentrations of the adsorptive may result in aggregation of MB or charge repulsion of MB dye species, thereby decelerating the adsorption process [23]; thus, it takes longer for the adsorptive to diffuse deeper into the pores of the adsorbent.
To gain a better understanding of the kinetic and diffusion behaviour of the adsorptive–adsorbent system, the experimental data were analysed by models including Pseudo First Order (PFO), Pseudo Second Order (PSO), Elovich, and Intra-Particle Diffusion (IPD) [24]. The PFO model has frequently been used to describe kinetic processes under non-equilibrium conditions. PFO assumes that the rate of adsorption is proportional to the driving force, i.e., the difference between equilibrium concentration and solid phase concentration. The integrated form of the PFO model is given in Equation (1):
q t   =   q e ( 1 e k 1 t )
By contrast, the PSO equation assumes that the overall adsorption rate is proportional to the square of the driving force. The integrated form of PSO model is given in Equation (2):
q t = k 2 tq e 2 1 + k 2 tq e
In both Equations (1) and (2), qt (mg g−1) and qe (mg g−1) are the concentrations of MB dye molecules at time t and at equilibrium, respectively. k1 (g mg−1 min−1) and k2 (g−1 mg min−1) are the PFO and PSO rate constants, respectively.
Figure 5 shows the experimentally determined adsorption (qexp) data fitted to the PFO and PSO models. The evaluated parameters, including qexp, qt (adsorption calculated at given time), first order rate constant k1, second order rate constant k2, and regression coefficient, are presented in Table 1. It was observed that PFO is incompatible with the experimental data, as the regression coefficient deviates from 1 throughout the concentration range; hence, physisorption is less likely to be the primary adsorption phenomenon.
By contrast, the regression coefficient values obtained for PSO are much closer to 1, indicating a better fit to the experimental data, and the calculated adsorption capacities through PSO equation closely match with the experimentally determined adsorption capacities (qexp), as shown in Table 1. Hence, the system can be best interpreted by the PSO model, and thus it can be concluded that the interaction between the surface of CXTi and MB is chemical in nature, and MB is mainly removed by a chemisorption phenomenon [25].
To further verify the chemisorption phenomenon of adsorption, the kinetic data was fitted to the Elovich equation, as shown in Equation (3) [24].
q t = 1 B ln ( AB ) + 1 B ln ( t )
where A (mg g−1 min−1) and B (g mg−1) are the initial rate constant of adsorption and desorption, respectively. This equation has been applied to wastewater treatment systems and is useful in describing chemisorption processes, which involve valence forces through sharing or exchange between the adsorbate and the adsorbent. The equation also signifies that the removal efficiency decreases with time because of the coverage of active sites [24]. The fit of the experimental data to the Elovich model is shown in Figure 6, and the obtained fits are good (R2 > 0.97), therefore verifying chemisorption within the adsorption process [26]. In addition, FTIR spectra of the adsorbent were recorded after adsorption treatment to confirm that the functional groups on CXTi are responsible for the observed adsorption activity. As shown in Figure 7, the change in spectra before and after adsorption of MB is evident, where the peaks associated with C-H, C=C and C-O-C vibrations appeared intense in comparison with CXTi before adsorption. Thus, it can be concluded that the adsorption of MB onto CXTi occurred predominantly via π–π interactions due to the aromatic rings of carbon xerogel [27].
To further understand the internal diffusion mechanism within the adsorbate–adsorbent system, the IPD model was applied to the experimental data. The IPD model is commonly applied to study the rate limiting step during the adsorption process, which is defined by either mass transfer or the diffusion of adsorbate and pore diffusion. IPD is studied by fitting the data to Equation (4) [24].
q t = k ip t 0.5 + C
kip is the rate constant (mg−1 g min0.5) and the intercept C is the boundary layer thickness. The value of C defines the boundary layer effect. A plot of qt vs. t0.5 gives a linear function; if the line passes through the origin, IP diffusion controls the adsorption process. If the line does not pass through origin and shows multiple linear segments, these segments correspond to different mechanisms that control the adsorption process [24].
Figure 8 shows the plot of MB adsorption onto CXTi fitted to the IPD equation plotted against t0.5. The multistep adsorption process is evident through the multi-linearity of the data (marked as stages 1, 2 and 3), which indicates that intra-particle diffusion was not rate limiting, and other adsorption mechanisms were also involved [25]. This means that the adsorption process, stage 1, began with rapid diffusion of MB from the bulk phase to the external surface of the sample, adsorbing swiftly due to the immediate availability of a large proportion of adsorption sites. The second stage was slower due to the boundary layer effect causing slow diffusion of the adsorptive into the porous structure of the sample. The third stage suggests an equilibrium stage, where intra-particle diffusion starts to slow down due to low adsorptive concentration or saturation of the active sites, preventing surface reactions from occurring [24,25]. The calculated parameters obtained by piecewise fitting are shown in Supplementary Materials, Table S1.

2.3. Adsorption Isotherm Study

The maximum equilibrium adsorption capacity was determined over the concentration range 0–200 mg L−1, recorded at intervals of 20 mg L−1. It can be observed that the adsorption capacity of CXTi increased with the increase in initial concentration of MB. A rapid increase in adsorption capacity was observed at low concentration, suggesting that CXTi has abundant active sites. With increasing MB concentration, the adsorption capacity reached a saturation plateau, indicating that the active sites were completely occupied by MB dye molecules. To understand the interactions between the adsorbent and adsorbate at equilibrium, adsorption isotherms obtained in this study were analysed according to the nonlinear form of Langmuir, Freundlich, and Sips isotherm models, and values of the associated model parameters were determined. The model showing the best fit to the experimental data, based on determination of the regression coefficient (R2), was selected for adsorption interpretation. The Langmuir isotherm model is relevant for the prediction of monolayer adsorption on energetically uniform homogenous adsorption sites, whereas the Freundlich isotherm model predicts multilayer adsorption [28]. Langmuir and Freundlich models are expressed in Equations (5) and (7), respectively.
q e = q L K L C e 1 + C e K L
where qe (mg g−1) is the MB uptake at equilibrium, Ce (mg L−1) is the equilibrium concentration, qL (mg g−1) is the amount of adsorbate at complete monolayer coverage, and KL is the Langmuir constant related to the energy of adsorption, which can be used to determine the extent of adsorbate–adsorbent interaction. Furthermore, adsorption favourability can be determined by a dimensionless constant called the separation factor, RL, expressed in Equation (6):
R L = 1 ( 1 + K L C 0 )
where, C0 refers to the initial concentration of the adsorbate in (mg L−1), and KL is Langmuir constant related to the adsorption capacity. If the value of RL > 1, the adsorption is unfavourable, and favourable when 0 < RL < 1. The Freundlich isotherm model is represented by:
q e = K F C e 1 / nF
where qe (mg g−1) and Ce (mg L−1) are as defined in the Langmuir equation, adsorption affinity is related to the adsorption constant KF, and nF indicates the magnitude of the adsorption driving force and is used to evaluate the adsorption favourability. When 1/nF is greater than 0 (0 < 1/nF < 1), adsorption is favourable; whereas, when 1/nF is greater than 1, the adsorption process is unfavourable. Moreover, the adsorption intensity or surface heterogeneity and the energy distribution, as well as the adsorbate site heterogeneity, is indicated by 1/nF. A value of nF between 2 and 10 represents good adsorption, indicating a high adsorption capacity, while values between 1 and 2 indicate moderate adsorption capacity, and values less than 1 indicate a small adsorption capacity.
Sips, a three-parameter model, is a combination of Langmuir and Freundlich adsorption isotherm models. It is stated that the Sips model predicts characteristics of the Langmuir isotherm at higher concentrations, while predicting Freundlich isotherm behaviour at lower concentrations [29]. The Sips model is expressed in Equation (8):
q e = q s K s C e n s 1 + K s C e n s
where qe (mg g−1) and Ce (mg L−1) are as defined in the Langmuir and Freundlich equations, 𝐾𝑠 is the Sips isotherm model constant (L g−1), and ns is the Sips isotherm exponent, which is related to the heterogeneity factor that represents the deviation of the linearity of adsorption. The heterogeneity of adsorbents in the equation is illustrated by 1/ns; if 1/ns < 1, the adsorbent surface is heterogeneous, and if 1/ns ~ 1, the surface can be described as homogenous [29].
The fittings of the Langmuir, Freundlich and Sips isotherm models to adsorption data obtained for MB on CXTi are presented in Figure 9, and the calculated parameters are shown in Table 2. The fitting results based on regression coefficient values indicate that the Sips isotherm model exhibits the best fit to the experimentally obtained adsorption equilibrium data. The maximum adsorption capacity obtained from the Sips model (qs = 217 mg g−1) was closest to the experimentally determined value (qe = 218 mg g−1). The heterogeneity factor, ns, is greater than 1; therefore, the suggestion is that the adsorption surface is heterogeneous. The evaluated parameters from the Freundlich model also validate the heterogeneous nature of the sorbent, since the value of nF is greater than 1. Additionally, the separation factor, RL is less than 1, which indicates favourable adsorption. The isotherm models fit most appropriately in the order Sips > Langmuir > Freundlich.

2.4. Photocatalytic Study

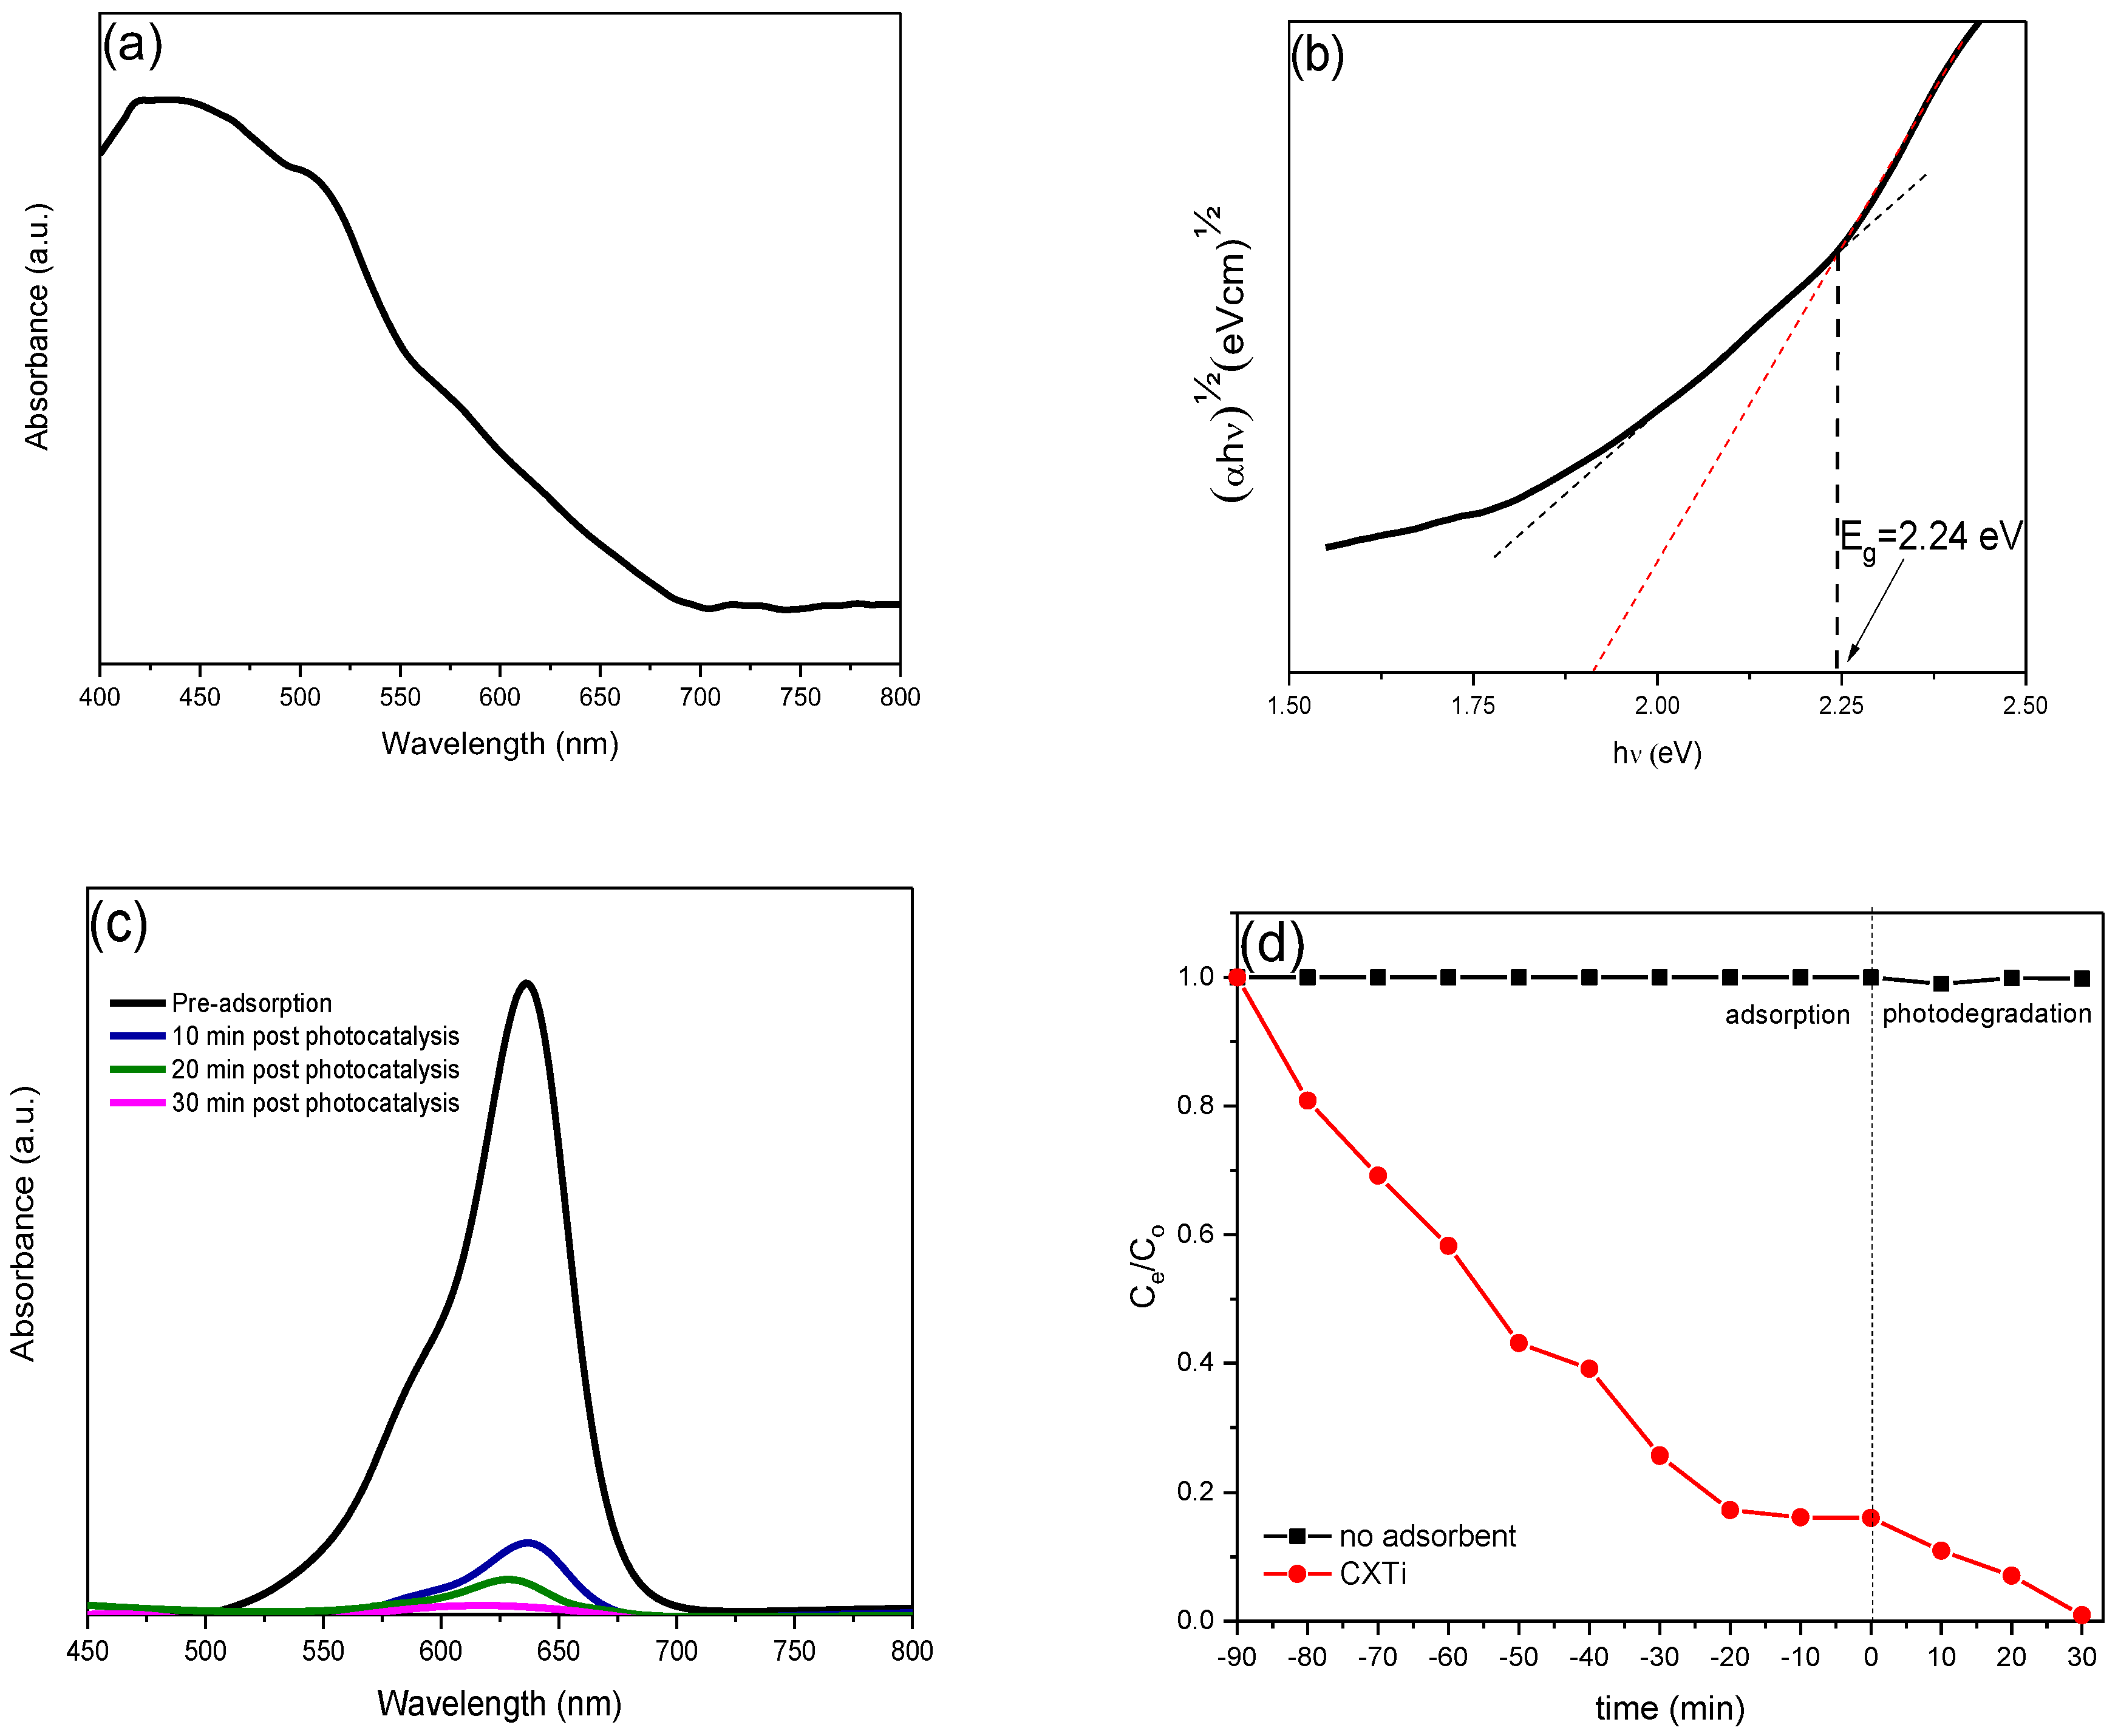
As reflected in Figure 10a, absorption extends broadly to the visible region of the electromagnetic spectrum, with maximum absorption observed at 509 nm. The corresponding band gap calculated through the Tauc method was 2.24 eV [30]; meaning that CXTi can absorb and activate under visible light irradiation. This point was proven by performing further experiments post adsorption to observe decolourisation of MB under visible light. Figure 10c validates the reduction of MB, with a flattened curve observed after 30 min of exposure to light irradiation. Consequent reduction in MB concentration by combined adsorption–photocatalysis is shown in Figure 10d. It was observed that the MB removal capacity of CXTi increased from ~85 to 99% upon light irradiation. As can be seen in Table 3, these results are more efficient than those of similar systems. The photocatalytic activity in this work arises from the synergy of CX and TiO2. The chemical linkage between CX and TiO2 forms a surface complex via a hydroxyl group, where a single oxygen atom separates the phenolic ligand from the TiO2 surface [16]. This binding phenomenon is similar to that previously described for aromatic compounds with phenolic hydroxyl groups, which can chemically bind with functional groups of TiO2 [31]. Binding through the hydroxyl group enables strong coupling due to ligand–metal charge transfer (LMCT). The formation of LMCT complexes modifies the overall electronic structure and creates a new absorption band in the visible light [31,32], as illustrated in Scheme 1. The visible light photocatalytic activity occurs when light falls on the surface of CXTi, resulting in generation of photoexcited charge carriers (electron and hole pairs). These charge carriers transfer from the highest occupied molecular orbital (HOMO) of the CX to the conduction band of TiO2, similar to other chemically combined carbon/TiO2 systems [33]. Charge carriers successfully transferred to the surface of the photocatalyst take part in redox reactions and produce reactive oxide species (ROS), including hydroxy radicals (OH) and superoxide radicals (O2●−) that can efficiently decompose adsorbed MB species [23,34].
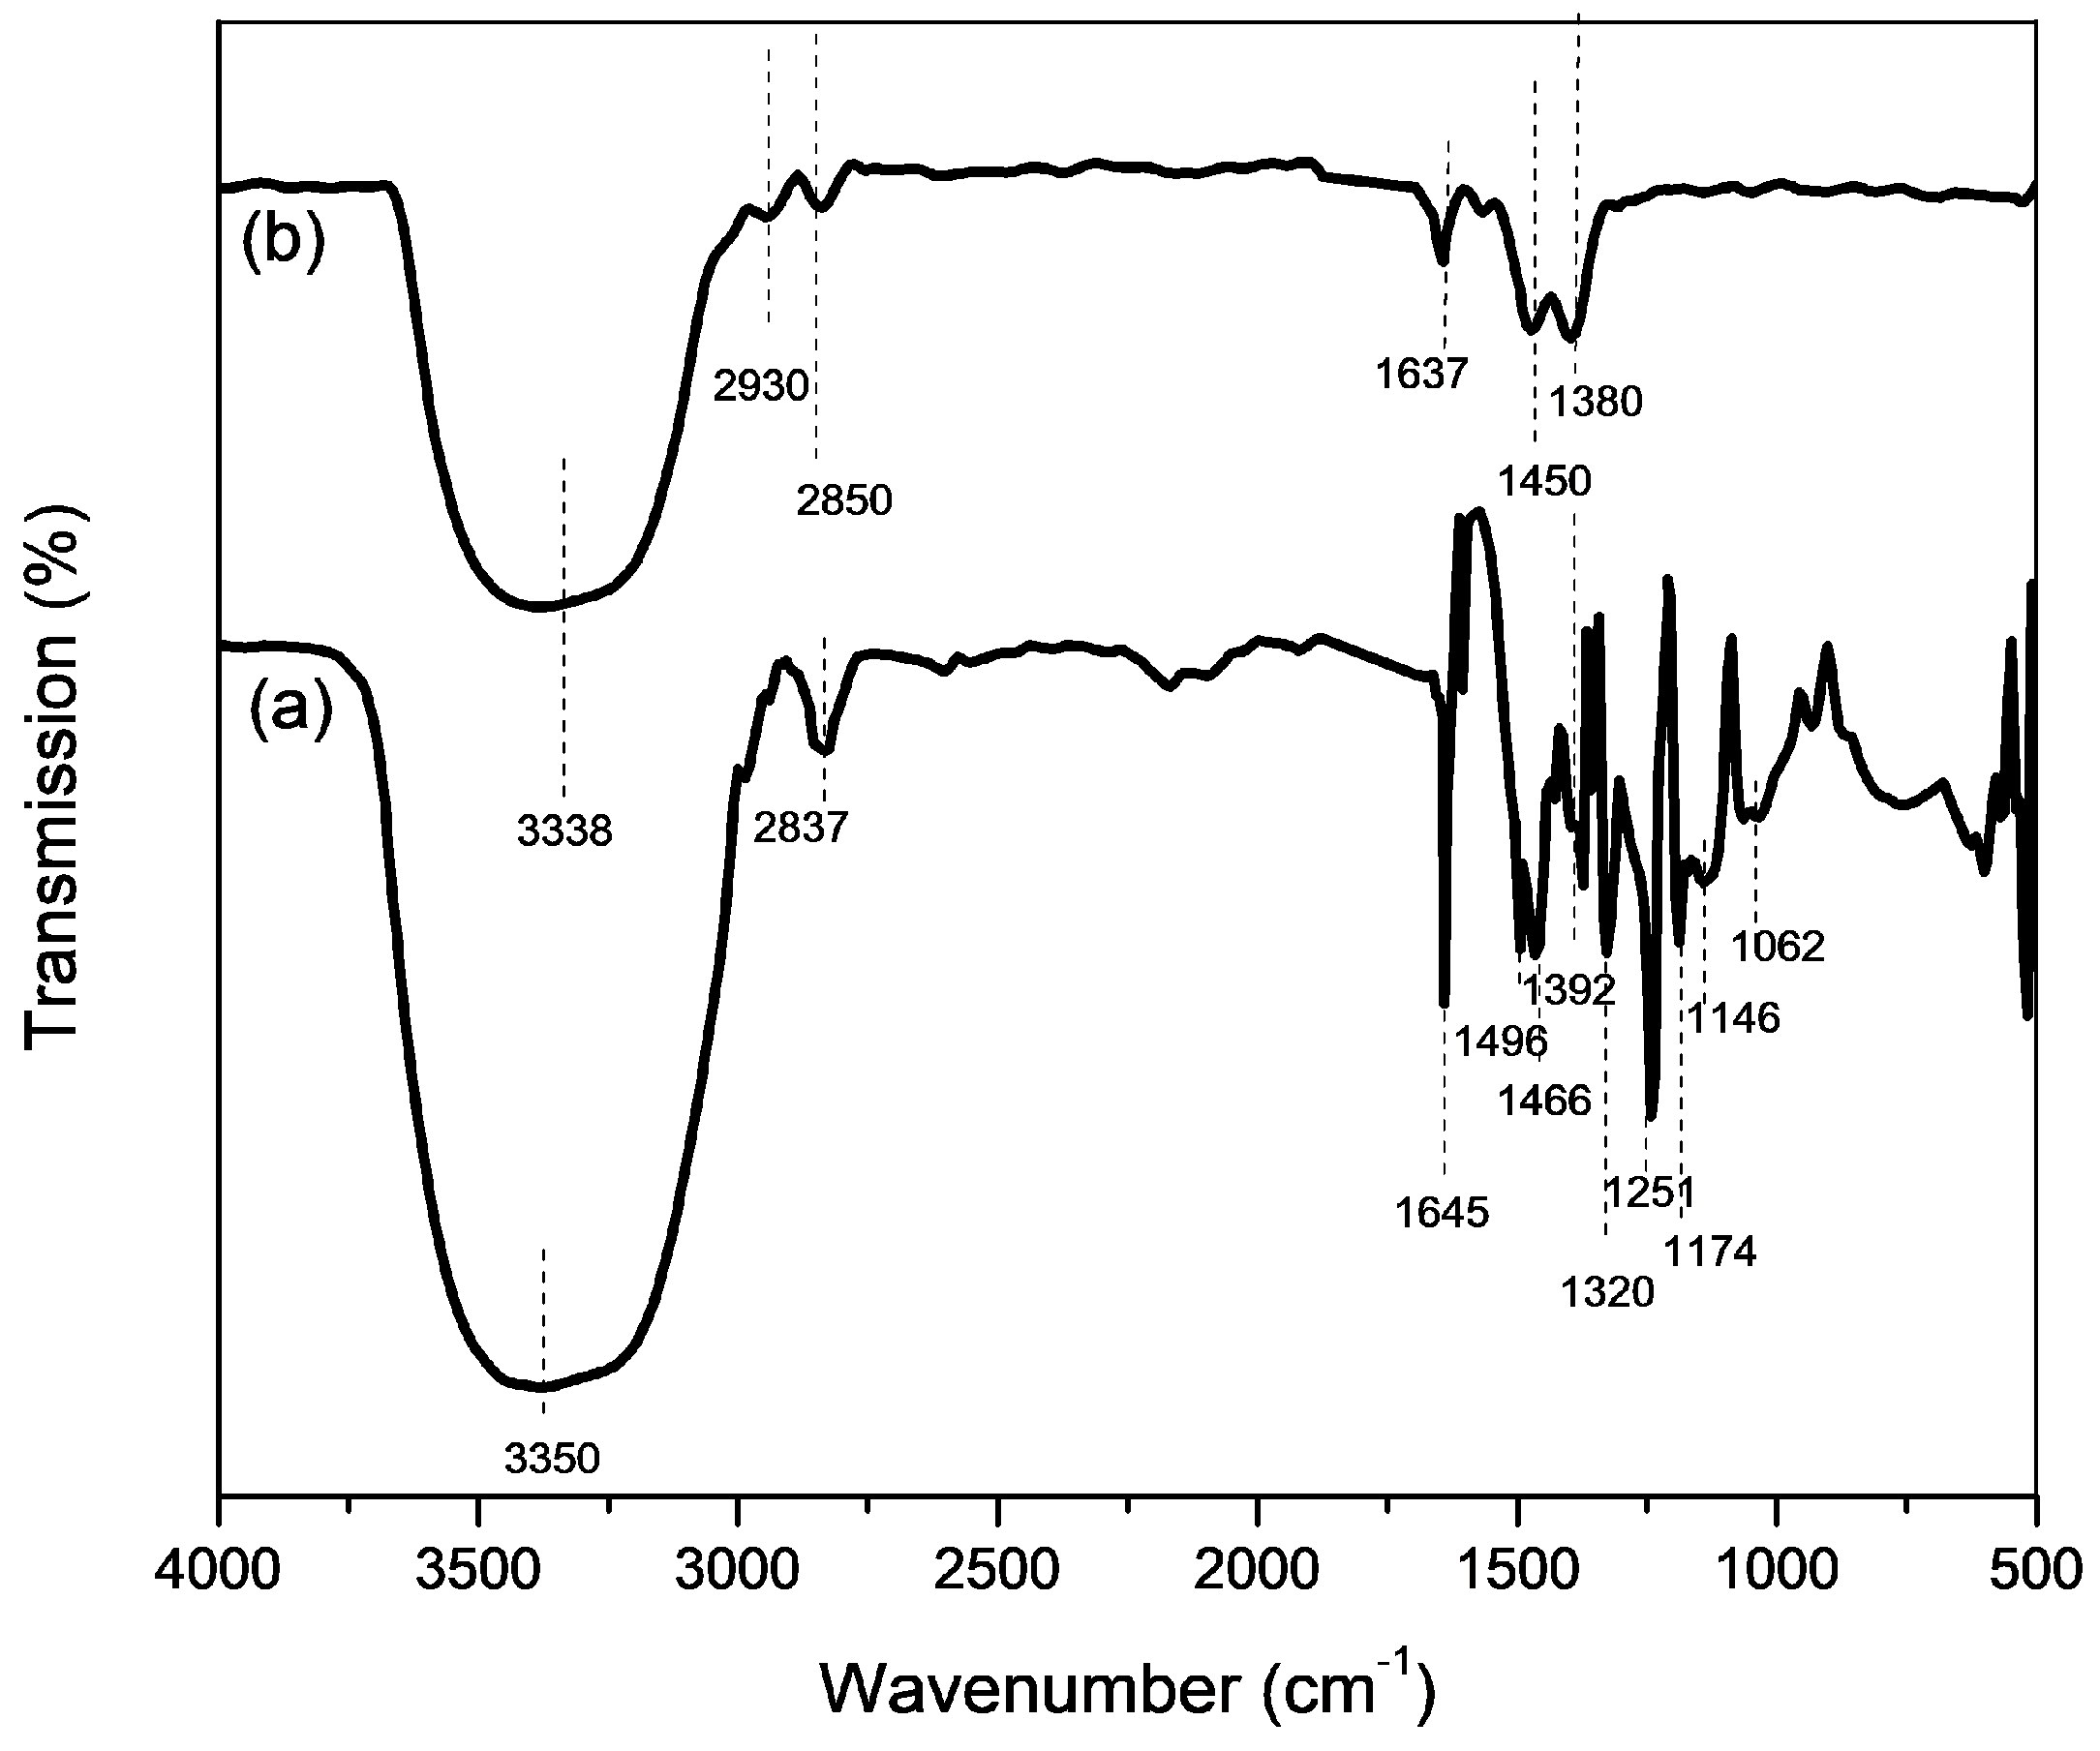
The change in structure of MB after photodegradation was confirmed by recording FTIR spectra shown in Figure 11 before (a) and after (b) photocatalytic activity. The differences in both the spectra clearly validate the change in structure of the MB dye molecule post treatment, and are in agreement with the previous studies [39,40]. The main functional moiety associated with MB was detected at ~2900 cm−1 for methylene asymmetric stretching (C-H). The other functional moieties are observed for overlapped OH and NH at 3350 cm−1, CH=N at 1645 cm−1, C=C side rings in the range of 1500 to 1400 cm−1, CH3 or CH2 stretching in the range of 1400 to 1300 cm−1, C-N stretching absorption peaks at 1252 cm−1, C-H at 1176 cm−1, C-N at 1146 and C-S-C at 1060 cm−1, and C-H out plane bending observed in the range of 800 cm−1. After photodegradation of MB by ROS produced by CXTi under visible light, most of the characteristic absorption peaks linked with MB weakened or disappeared, which suggests the breakdown of the MB molecule at the interface of the CXTi. The main decomposed peaks were observed at 3338 and 1637 cm−1 for H-OH, 1470 for N-H and 2930 and 2850 cm−1 for C-H, which suggests successful degradation of MB by CXTi under visible light irradiation.
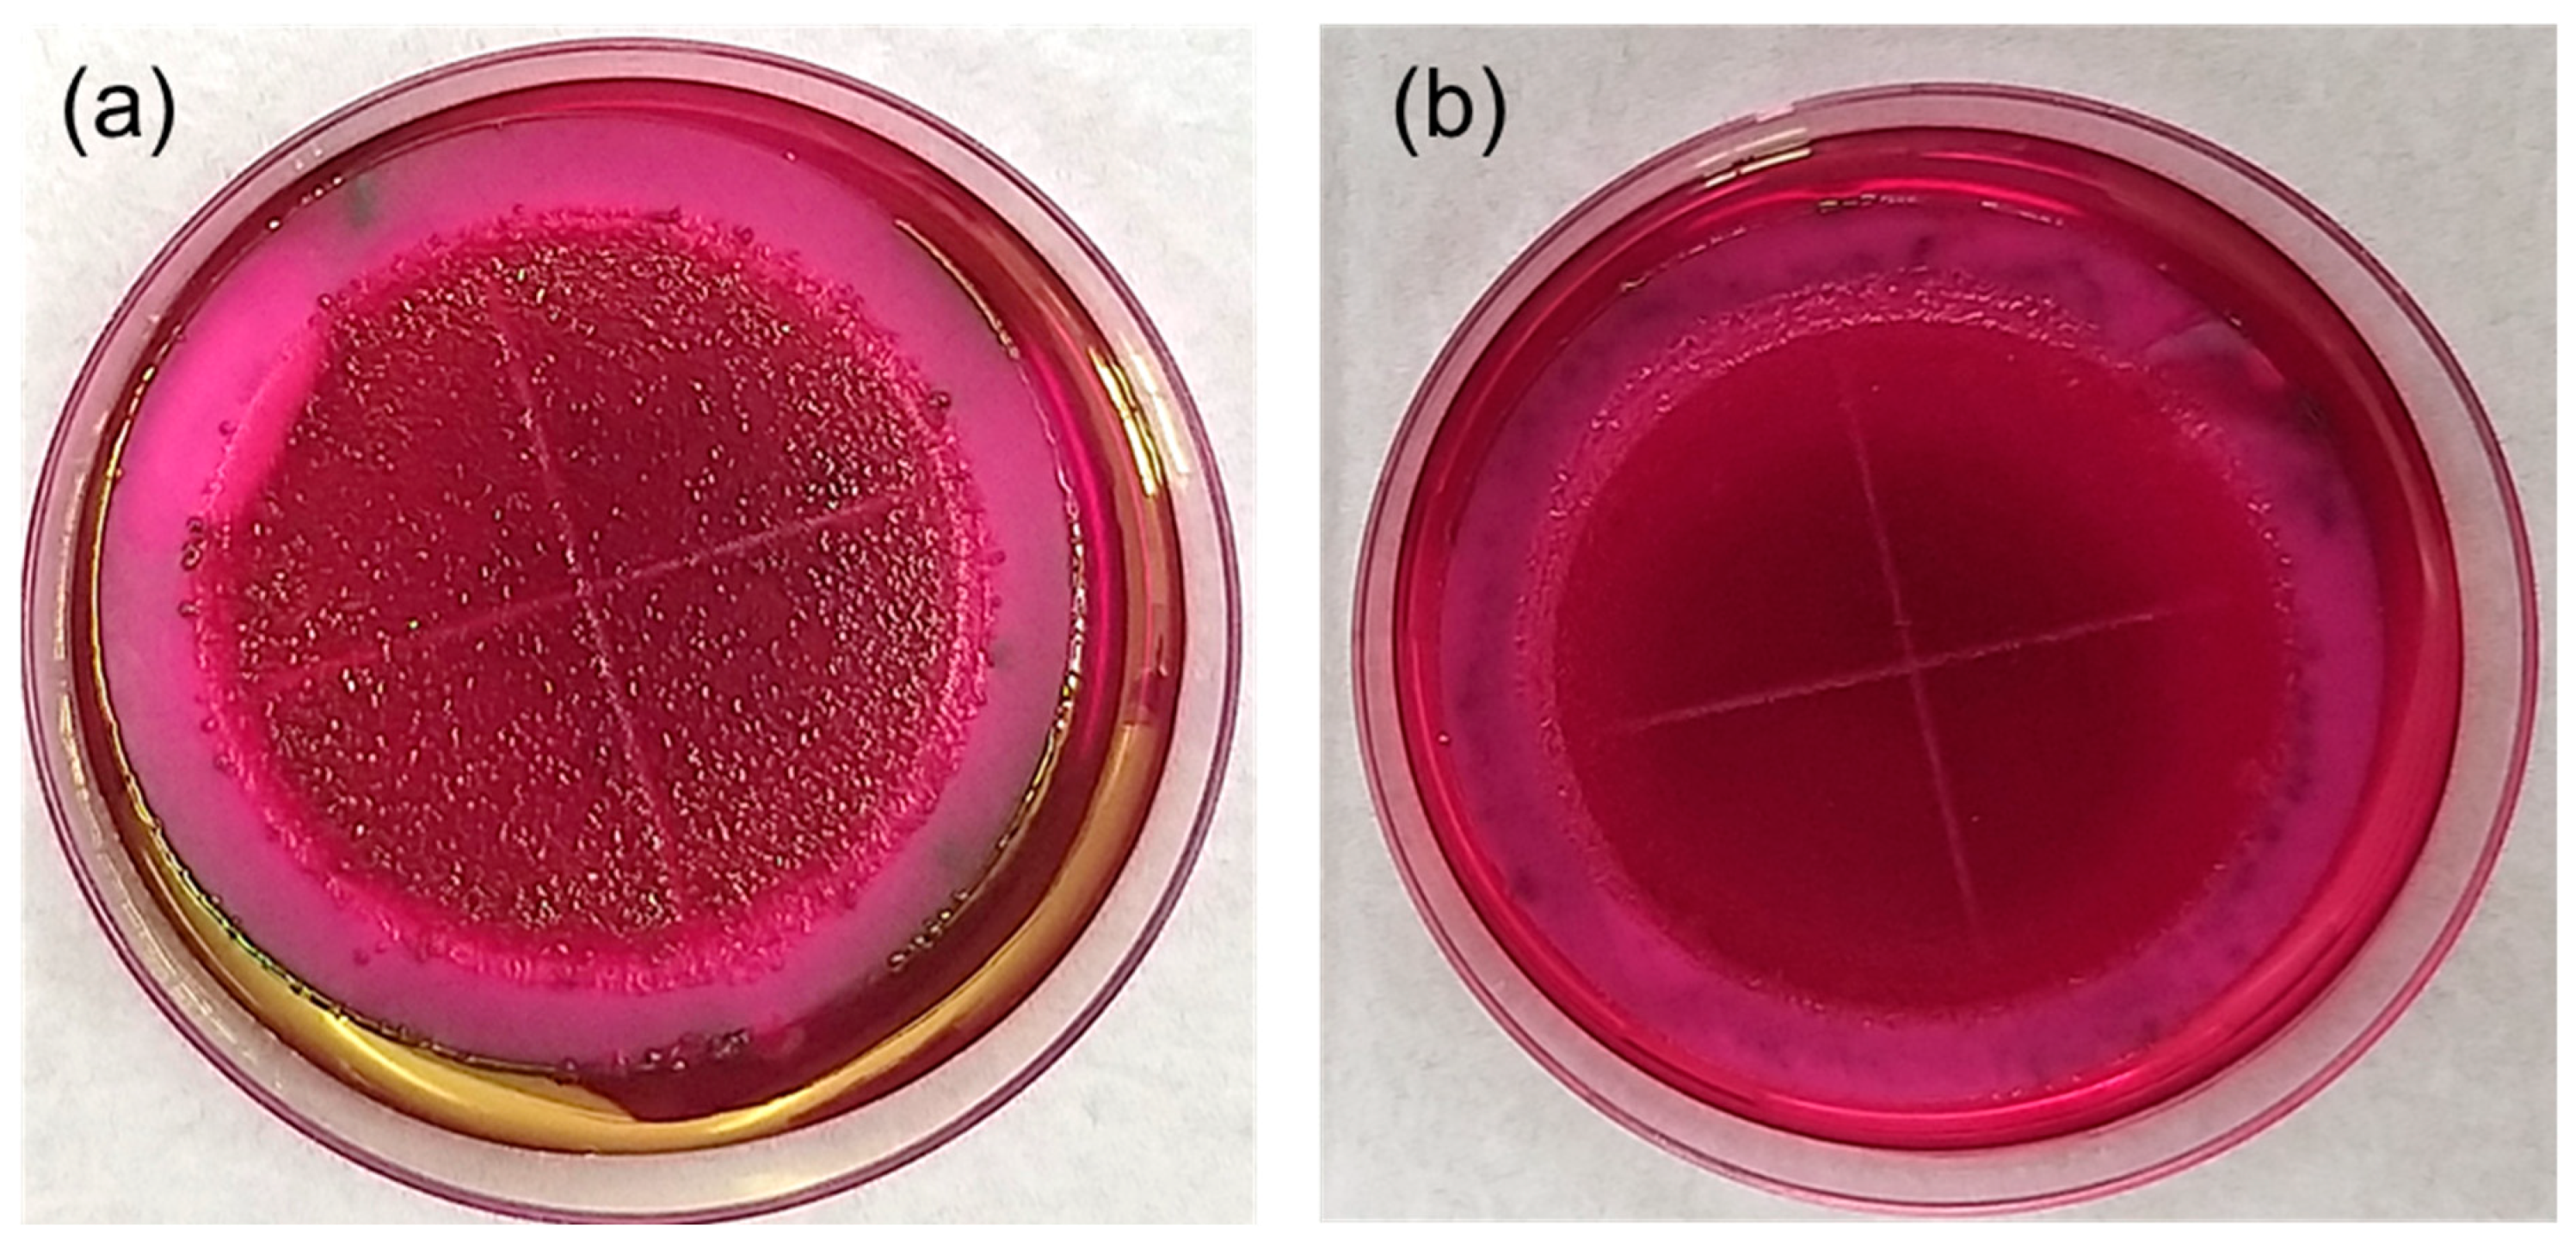
Photogenerated ROS have been reported to kill bacteria by attacking the cell wall, leading to cell rupture, reduction in growth and ultimately cell death [34]. It has been reported that the usual first target of ROS is the cell wall; e.g., in E. coli, the cell wall is composed of lipopolysaccharide, peptidoglycan and phosphatidyl-ethanolamine, which have been reported to be affected by ROS [41]. Secondly, the rupture of the cell membrane occurs, leading to leakage of cellular matter and the ultimate breakdown of the cell [42]. Thirdly, cell lysis progresses by inhibiting the respiratory chain, followed by damage to DNA [43]. The antimicrobial performance of CXTi was studied by conducting tests using a membrane filtration procedure according to a standard method (9222 membrane filter technique for members of the coliform group [44]). The performance was tested against the reduction in total and faecal coliform bacteria and E. coli. After treating contaminated water with CXTi, the calculation of bacteria was performed by counting the number of colonies, colony forming units (CFU per 100 mL) and developed post incubation colonies grown on the grid after 24 h. Pictures of petri plates before (control) and after (surviving bacteria) treatment are shown in Figure 12 and Figure 13, and numerical data is presented in Table 4. The reduction in colonies signifies complete eradication of almost all surviving bacteria. Remarkable antimicrobial activity is attributed to the production of a sufficient amount of ROS to attack the bacterial cell wall for complete destruction.

3. Materials and Method

3.1. Synthesis of CXTi

CX and TiO2 were combined using a sol–gel process. 5.43 g of resorcinol (SigmaAldrich, ReagentPlus, 99%, Poole, UK) was completely dissolved in 50 mL of deionised water. 0.02 g of catalyst, sodium carbonate (Na2CO3, Sigma-Aldrich, anhydrous, ≥99.5%) and 2.96 g of formaldehyde (37 wt%) were added to the resorcinol solution under continuous stirring, at room temperature. The pH recorded at this point was 7.4. A titania sol* was obtained using a conventional method described elsewhere [45], and added dropwise to the system. The integrated system was stirred at 23 °C for 2 h, after which the sol mixture was aged at 85 °C for 72 h. Aging was followed by solvent exchange through immersion of wet monolithic CXTi in acetone. After 72 h, CX Ti was dried in a vacuum oven (Townson and Mercer 1425 Digital Vacuum Oven) at 110 °C for 48 h, and the ultimate CXTi was obtained with 30 wt% TiO2 (theoretical percentage).
*Briefly, 3.6 g of precursor, titanium isopropoxide (TTIP) (98+%, ACROS Organics™, Geel, Belgium), was mixed with ethanol, followed by dropwise addition of HCl and water solution in the following molar ratio: 1 TTIP:10 EtOH:0.3 HCl:0.1 H2O. The mixture was stirred at room temperature for the hydrolysis reaction to occur, and a homogenous solution was obtained after 2 h of agitation. The anatase phase of TiO2 deposited was confirmed by X-ray diffraction spectrum [46,47,48] (displayed in Figure S2, Supplementary Materials).

3.2. Structural Characterisation

Morphology of the materials was studied using micrograph images obtained via field emission electron scanning microscopy (FESEM) TESCAN-MIRA. The chemical linkages were investigated through Fourier Transform Infrared (FTIR) Spectroscopy (MB3000 series, scanned in the range 4000–400 nm, at an interval 4 cm−1, over 16 scans). Surface area was studied by obtaining N2 adsorption isotherms at −196 °C (Micromeritics ASAP 2420) and using BET analysis; pore size was estimated using BJH theory [20]. Absorption vs. wavelength spectra were obtained using UV-Vis Spectrophotometry (Varian Cary 5000 UV-Vis NIR Spectrophotometer Hellma Analytics).

3.3. Adsorption and Photocatalytic Performance

The adsorption experiments were conducted by adding 0.01 g of CXTi to 25 mL of prepared concentrations of MB solution in the range 20–200 mg L−1. The pH of the solutions was adjusted if required using 1M HCl and 1M NaOH. The adsorption equilibria were established by agitating the systems using an orbital shaker (VWR 3500 Analog Orbital Shaker unit), set to 125 rpm at 23 °C, in the dark. After a given time, the solution was centrifuged for 15 min and the supernatant was collected for measurement. The concentration of the treated solution was determined using UV-Vis spectrophotometry (Varian Cary 5000 UV-Vis NIR Spectrophotometer Hellma Analytics). Likewise, post adsorption, the concentration after photocatalytic treatment was determined at given time intervals of exposure to visible light (irradiance 111 W m−2).
The equilibrium adsorption capacity, qe (mg g−1), was calculated using
q e = ( C o C e ) . V ( l ) W
The corresponding percentage removal of MB was calculated by
Removal   % = C o C e C o × 100 %
where Co and Ce are the initial MB and final concentration, respectively. W is the weight (g) of the adsorbent and V is the volume (L) of MB solution.
The effect of contact time was determined using aliquots of MB solution (25 mL, 100 mg L−1) and 0.01 g adsorbent gel, added into flasks and agitated for contact times in the range 5 min to 4 h. The samples were prepared and treated as above, and the amount of adsorption was calculated using Equation (11).
q t = ( C o C t ) . V W
where Co and Ct are the initial MB and equilibrium concentration at a given time, respectively, V is the volume of solution (L), and W is the mass of adsorbent sample in (g). Equilibrium concentration was determined by plotting q t versus time of aliquots collected, at different time intervals.

3.4. Antimicrobial Performance

A stock solution of lab-cultivated bacteria was prepared with volume ratio 1:100. For the detection of bacteria, mEndo and mFC agars were prepared, and a membrane filtration procedure (MF) was performed according to 9222 standard methods for the examination of water and wastewater using the membrane filter (MF) technique for members of the coliform group [44].
Briefly, 250 mL transparent sterile water bottles were filled with 200 mL of contaminated water. According to standard microbiological examination (9000), the suggested sample volume to be filtered using membrane filtration for coliform or E. coli testing in drinking water is 100 mL. Therefore, 100 mL of each treated sample was measured twice, once for detection of E. coli, and the remaining 100 mL for detection of faecal coliform. The bottles were labelled with the respective sample codes and 0.1 g of CXTi was added to the contents of the bottle. After preparation, sample bottles were placed on an orbital shaker (VRN 360 Gemmy, Taipei, Taiwan) at 200 rpm for 90 min, to establish equilibrium. The bottles were then exposed to visible light. CXTi was filtered out and the membrane filtration procedure was carried out. 100 mL of each treated water sample was filtered twice using microfiltered paper, which was placed on mEndo and mFC agar petri plates. These plates were incubated for 24 h, at 35 °C for mEndo and at 44 °C for mFC agar plates. mEndo (pink plates) form a dark red, mucoid or dark centre without metallic sheen. E. coli will form colonies with a metallic sheen. mFC (blue plates) are for the detection of faecal coliform. Faecal coliforms form blue colonies on this medium, and E. coli will form flat dark blue colonies. The grown bacterial colonies were counted according to the standard counting procedure. The cell density of the original sample was calculated and compared with the cell density of water treated with CXTi. The counts were reported as coliform colony units (CFU/100 mL).

4. Conclusions

The CXTi adsorbent–photocatalyst was successfully synthesised within this study, using a sol–gel method to combine a resorcinol–formaldehyde xerogel (CX) with titanium dioxide (TiO2). As expected, the integration of TiO2 into the carbon xerogel material modified the electronic structure of TiO2, which enabled visible light response, and the CXTi sample demonstrated efficient adsorbent–photocatalyst behaviour for the removal of MB under given conditions. The formation of a heterojunction between TiO2 and the CX material was confirmed using spectroscopic methods. The kinetics of MB adsorption revealed that agitation for 90 min was sufficient to attain equilibrium, and the kinetic profiles better fitted a pseudo second order model, indicating chemical processes are involved within MB removal. The equilibrium adsorption data were best described by the Sips model, suggesting heterogeneity of the sample surface, which is fully in line with the mixed material composite produce here. Additionally, the mesoporous carbon phase provides a high surface area for optimised adsorption, and photocatalysis is enabled by the inclusion of TiO2, resulting in the complete eradication of microbes under given conditions. The excellent adsorption–photodegradation abilities exhibited by CXTi, achieved through the synergistic effects of combining CX and titania, present an economically viable option for water treatment, as they can be effectively recovered and reused. Recycling efficiency tests, against the reduction in MB, demonstrated a minimal loss ( ~ 5%) in dye degradation efficiency by the fourth repeated cycle (Figure 14), suggesting good reusability of over 90% efficiency with repeated use. Thus, CXTi is a promising candidate for efficient removal of a wide range of synthetic azo dyes, as well as microbes, from industrial effluents.

Supplementary Materials

The following supporting information can be downloaded at: https://www.mdpi.com/article/10.3390/molecules27238483/s1, Table S1: Parameters calculated from piecewise linear fittings to Intra-particle diffusion model, corresponding to Figure 7. Figure S1: X-ray diffraction (XRD) spectrum of Carbon Xerogel (CX) indicating two broad diffraction peaks of CX at 2θ = 24° and 2θ = 44°, represented by highlighted region in light grey. These findings are similar to previously described XRD pattern obtained for CX derived from resorcinol-formaldehyde [46,47]. Figure S2: X-ray diffraction spectrum of Carbon Xerogel/TiO2 (CXTi) indicating the presence of anatase phase at 2θ = 25°, represented by highlighted region light grey. These findings are similar to previously described carbon/titania systems [48].

Author Contributions

Methodology, A.S. and A.J.F.; formal analysis, A.S. and A.J.F.; resources, A.J.F.; data curation, A.S. and R.S.; writing—original draft preparation, A.S.; writing—review and editing, A.J.F.; supervision, A.J.F.; project administration, A.J.F. and H.R.; funding acquisition, A.J.F. and H.R. All authors have read and agreed to the published version of the manuscript.

Funding

This research received no external funding.

Institutional Review Board Statement

Not applicable.

Informed Consent Statement

Not applicable.

Data Availability Statement

Not applicable.

Acknowledgments

Anam Safri thanks Ashleigh Fletcher and the department of Chemical and Process Engineering, University of Strathclyde, for funding this work. The authors gratefully acknowledge the administrative and technical support in conducting microbial analysis at PCRWR.

Conflicts of Interest

The authors declare no conflict of interest.

References

  1. Manikandan, S.; Karmegam, N.; Subbaiya, R.; Devi, G.K.; Arulvel, R.; Ravindran, B.; Awasthi, M.K. Emerging nano-structured innovative materials as adsorbents in wastewater treatment. Bioresour. Technol. 2021, 320, 124394. [Google Scholar] [CrossRef] [PubMed]
  2. Zhang, G.; Song, A.; Duan, Y.; Zheng, S. Enhanced photocatalytic activity of TiO2/zeolite composite for abatement of pollutants. Microporous Mesoporous Mater. 2018, 255, 61–68. [Google Scholar] [CrossRef]
  3. Lakshmi, S.; Renganathan, R.; Fujita, S. Study on TiO2-mediated photocatalytic degradation of methylene blue. J. Photochem. Photobiol. A Chem. 1995, 88, 163–167. [Google Scholar] [CrossRef]
  4. Kumari, P.; Alam, M.; Siddiqi, W.A. Usage of nanoparticles as adsorbents for waste water treatment: An emerging trend. Sustain. Mater. Technol. 2019, 22, e00128. [Google Scholar] [CrossRef]
  5. Wang, H.; Lewis, J. Second-generation photocatalytic materials: Anion-doped TiO2. J. Phys. Condens. Matter 2005, 18, 421. [Google Scholar] [CrossRef]
  6. Khalid, N.; Majid, A.; Tahir, M.B.; Niaz, N.; Khalid, S. Carbonaceous-TiO2 nanomaterials for photocatalytic degradation of pollutants: A review. Ceram. Int. 2017, 43, 14552–14571. [Google Scholar] [CrossRef]
  7. Malekshahi Byranvand, M.; Nemati Kharat, A.; Fatholahi, L.; Malekshahi Beiranvand, Z. A review on synthesis of nano-TiO2 via different methods. J. Nanostructures 2013, 3, 1–9. [Google Scholar]
  8. Mehta, A.; Mishra, A.; Basu, S.; Shetti, N.P.; Reddy, K.R.; Saleh, T.A.; Aminabhavi, T.M. Band gap tuning and surface modification of carbon dots for sustainable environmental remediation and photocatalytic hydrogen production—A review. J. Environ. Manag. 2019, 250, 109486. [Google Scholar] [CrossRef]
  9. Thapliyal, P.C.; Singh, K. Aerogels as promising thermal insulating materials: An overview. J. Mater. 2014. [Google Scholar] [CrossRef] [Green Version]
  10. Xu, P.; Drewes, J.E.; Heil, D.; Wang, G. Treatment of brackish produced water using carbon aerogel-based capacitive deionization technology. Water Res. 2008, 42, 2605–2617. [Google Scholar] [CrossRef]
  11. Das, S.; Heasman, P.; Ben, T.; Qiu, S. Porous organic materials: Strategic design and structure–function correlation. Chem. Rev. 2017, 117, 1515–1563. [Google Scholar] [CrossRef] [PubMed]
  12. Awadallah-F, A.; Al-Muhtaseb, S.A. Nanofeatures of resorcinol–formaldehyde carbon microspheres. Mater. Lett. 2012, 87, 31–34. [Google Scholar] [CrossRef]
  13. Wang, Y.; Chang, B.; Guan, D.; Dong, X. Mesoporous activated carbon spheres derived from resorcinol-formaldehyde resin with high performance for supercapacitors. J. Solid State Electrochem. 2015, 19, 1783–1791. [Google Scholar] [CrossRef]
  14. Awadallah-F, A.; Elkhatat, A.M.; Al-Muhtaseb, S.A. Impact of synthesis conditions on meso-and macropore structures of resorcinol–formaldehyde xerogels. J. Mater. Sci. 2011, 46, 7760–7769. [Google Scholar] [CrossRef]
  15. Chen, Y.; Gao, H.; Xiang, J.; Dong, X.; Cao, Y. Enhanced photocatalytic activities of TiO2-reduced graphene oxide nanocomposites controlled by TiOC interfacial chemical bond. Mater. Res. Bull. 2018, 99, 29–36. [Google Scholar] [CrossRef]
  16. Jiang, Y.; Meng, L.; Mu, X.; Li, X.; Wang, H.; Chen, X.; Wang, X.; Wang, W.; Wu, F.; Wang, X. Effective TiO2 hybrid heterostructure fabricated on nano mesoporous phenolic resol for visible-light photocatalysis. J. Mater. Chem. 2012, 22, 23642–23649. [Google Scholar] [CrossRef]
  17. Safri, A.; Fletcher, A.J. Effective carbon/TiO2 gel for enhanced adsorption and demonstrable visible light driven photocatalytic performance. Gels 2022, 8, 215. [Google Scholar] [CrossRef]
  18. Zaleska, A. Doped-TiO2: A review. Recent Pat. Eng. 2008, 2, 157–164. [Google Scholar] [CrossRef]
  19. Bardestani, R.; Patience, G.S.; Kaliaguine, S. Experimental methods in chemical engineering: Specific surface area and pore size distribution measurements—BET, BJH, and DFT. Can. J. Chem. Eng. 2019, 97, 2781–2791. [Google Scholar] [CrossRef]
  20. Aranovich, G.L.; Donohue, M.D. Adsorption isotherms for microporous adsorbents. Carbon 1995, 33, 1369–1375. [Google Scholar] [CrossRef]
  21. Azeez, F.; Al-Hetlani, E.; Arafa, M.; Abdelmonem, Y.; Nazeer, A.A.; Amin, M.O.; Madkour, M. The effect of surface charge on photocatalytic degradation of methylene blue dye using chargeable titania nanoparticles. Sci. Rep. 2018, 8, 1–9. [Google Scholar] [CrossRef] [PubMed]
  22. Azizian, S. Kinetic models of sorption: A theoretical analysis. J. Colloid Interface Sci. 2004, 276, 47–52. [Google Scholar] [CrossRef] [PubMed]
  23. Rafatullah, M.; Sulaiman, O.; Hashim, R.; Ahmad, A. Adsorption of methylene blue on low-cost adsorbents: A review. J. Hazard. Mater. 2010, 177, 70–80. [Google Scholar] [CrossRef] [PubMed]
  24. Ebelegi, A.N.; Ayawei, N.; Wankasi, D. Interpretation of adsorption thermodynamics and kinetics. Open J. Phys. Chem. 2020, 10, 166. [Google Scholar] [CrossRef]
  25. Tan, K.; Hameed, B. Insight into the adsorption kinetics models for the removal of contaminants from aqueous solutions. J. Taiwan Inst. Chem. Eng. 2017, 74, 25–48. [Google Scholar] [CrossRef]
  26. Wang, J.; Guo, X. Adsorption kinetic models: Physical meanings, applications, and solving methods. J. Hazard. Mater. 2020, 390, 122156. [Google Scholar] [CrossRef]
  27. Tran, H.N.; Wang, Y.-F.; You, S.-J.; Chao, H.-P. Insights into the mechanism of cationic dye adsorption on activated charcoal: The importance of π–π interactions. Proc. Saf. Environ. Prot. 2017, 107, 168–180. [Google Scholar] [CrossRef]
  28. Ayawei, N.; Ebelegi, A.N.; Wankasi, D. Modelling and interpretation of adsorption isotherms. J. Chem. 2017. [Google Scholar] [CrossRef] [Green Version]
  29. Al-Ghouti, M.A.; Da’ana, D.A. Guidelines for the use and interpretation of adsorption isotherm models: A review. J. Hazard. Mater. 2020, 393, 122383. [Google Scholar] [CrossRef]
  30. Makuła, P.; Pacia, M.; Macyk, W. How to correctly determine the band gap energy of modified semiconductor photocatalysts based on UV–Vis spectra. J. Phys. Chem. Lett. 2018, 9, 6814–6817. [Google Scholar] [CrossRef] [Green Version]
  31. Wang, N.; Zhu, L.; Huang, Y.; She, Y.; Yu, Y.; Tang, H. Drastically enhanced visible-light photocatalytic degradation of colorless aromatic pollutants over TiO2 via a charge-transfer-complex path: A correlation between chemical structure and degradation rate of the pollutants. J. Catal. 2009, 266, 199–206. [Google Scholar] [CrossRef]
  32. Fujisawa, J.-i.; Matsumura, S.; Hanaya, M. A single TiOC linkage induces interfacial charge-transfer transitions between TiO2 and a π-conjugated molecule. Chem. Phys. Lett. 2016, 657, 172–176. [Google Scholar] [CrossRef]
  33. Zhang, G.; Choi, W. A low-cost sensitizer based on a phenolic resin for charge-transfer type photocatalysts working under visible light. Chem. Commun. 2012, 48, 10621–10623. [Google Scholar] [CrossRef] [PubMed]
  34. Kim, S.; Ghafoor, K.; Lee, J.; Feng, M.; Hong, J.; Lee, D.-U.; Park, J. Bacterial inactivation in water, DNA strand breaking, and membrane damage induced by ultraviolet-assisted titanium dioxide photocatalysis. Water Res. 2013, 47, 4403–4411. [Google Scholar] [CrossRef]
  35. do Carmo Batista, W.V.F.; da Cunha, R.; dos Santos, A.C.; dos Reis, P.M.; Furtado, C.A.; Silva, M.C.; de Fátima Gorgulho, H. Synthesis of a reusable magnetic photocatalyst based on carbon xerogel/TiO2 composites and its application on acetaminophen degradation. Ceram. Int. 2022, 48, 34395–34404. [Google Scholar] [CrossRef]
  36. da Cunha, R.; do Carmo Batista, W.V.F.; de Oliveira, H.L.; dos Santos, A.C.; dos Reis, P.M.; Borges, K.B.; Martelli, P.B.; Furtado, C.A.; de Fátima Gorgulho, H. Carbon Xerogel/TiO2 composites as photocatalysts for acetaminophen degradation. J. Photochem. Photobiol. A Chem. 2021, 412, 113248. [Google Scholar] [CrossRef]
  37. Bailón-García, E.; Elmouwahidi, A.; Álvarez, M.A.; Carrasco-Marín, F.; Pérez-Cadenas, A.F.; Maldonado-Hódar, F.J. New carbon xerogel-TiO2 composites with high performance as visible-light photocatalysts for dye mineralization. Appl. Catal. B Environ. 2017, 201, 29–40. [Google Scholar] [CrossRef]
  38. Liang, Z.; Zhang, J.; Liu, H.; Shi, J. Enhancement of the photocatalytic activity of a TiO2/carbon aerogel based on a hydrophilic secondary pore structure. RSC Adv. 2016, 6, 68416–68423. [Google Scholar]
  39. Houas, A.; Lachheb, H.; Ksibi, M.; Elaloui, E.; Guillard, C.; Herrmann, J.-M. Photocatalytic degradation pathway of methylene blue in water. Appl. Catal. B Environ. 2001, 31, 145–157. [Google Scholar] [CrossRef]
  40. Barışçı, S.; Turkay, O.; Dimoglo, A. Review on greywater treatment and dye removal from aqueous solution by ferrate (VI). In Ferrites and Ferrates: Chemistry and Applications in Sustainable Energy and Environmental Remediation; ACS Symposium Series; ACS Publications: Washington, DC, USA, 2016; Volume 1238, pp. 349–409. [Google Scholar] [CrossRef]
  41. de Dicastillo, C.L.; Correa, M.G.; Martínez, F.B.; Streitt, C.; Galotto, M.J. Antimicrobial effect of titanium dioxide nanoparticles. In Antimicrobial Resistance: A One Health Perspective; BoD—Books on Demand: Norderstedt, Germany, 2020. [Google Scholar] [CrossRef] [Green Version]
  42. Albukhaty, S.; Al-Bayati, L.; Al-Karagoly, H.; Al-Musawi, S. Preparation and characterization of titanium dioxide nanoparticles and in vitro investigation of their cytotoxicity and antibacterial activity against Staphylococcus aureus and Escherichia coli. Anim. Biotechnol. 2022, 33, 864–870. [Google Scholar] [CrossRef] [PubMed]
  43. Stankic, S.; Suman, S.; Haque, F.; Vidic, J. Pure and multi metal oxide nanoparticles: Synthesis, antibacterial and cytotoxic properties. J. Nanobiotechnology 2016, 14, 1–20. [Google Scholar] [CrossRef] [Green Version]
  44. American Public Health Association. 9222 Membrane filter technique for members of the coliform group. In Standard Methods For the Examination of Water and Wastewater; American Public Health Association: Washington, DC, USA, 2018; Volume 27. [Google Scholar] [CrossRef]
  45. Khan, M.A.; Akhtar, M.S.; Yang, O.-B. Synthesis, characterization and application of sol–gel derived mesoporous TiO2 nanoparticles for dye-sensitized solar cells. Sol. Energy 2010, 84, 2195–2201. [Google Scholar] [CrossRef]
  46. Lin, C.; Ritter, J. Effect of synthesis pH on the structure of carbon xerogels. Carbon 1997, 35, 1271–1278. [Google Scholar] [CrossRef]
  47. Fonseca-Correa, R.A.; Giraldo, L.; Moreno-Piraján, J.C. Dataset of xerogel synthesis in basic medium at different resorcinol/catalyst ratios. Data Brief 2018, 17, 1056–1061. [Google Scholar] [CrossRef]
  48. Singh, S.; Bhatnagar, A.; Dixit, V.; Shukla, V.; Shaz, M.; Sinha, A.; Srivastava, O.; Sekkar, V. Synthesis, characterization and hydrogen storage characteristics of ambient pressure dried carbon aerogel. Int. J. Hydrog. Energy 2016, 41, 3561–3570. [Google Scholar] [CrossRef]
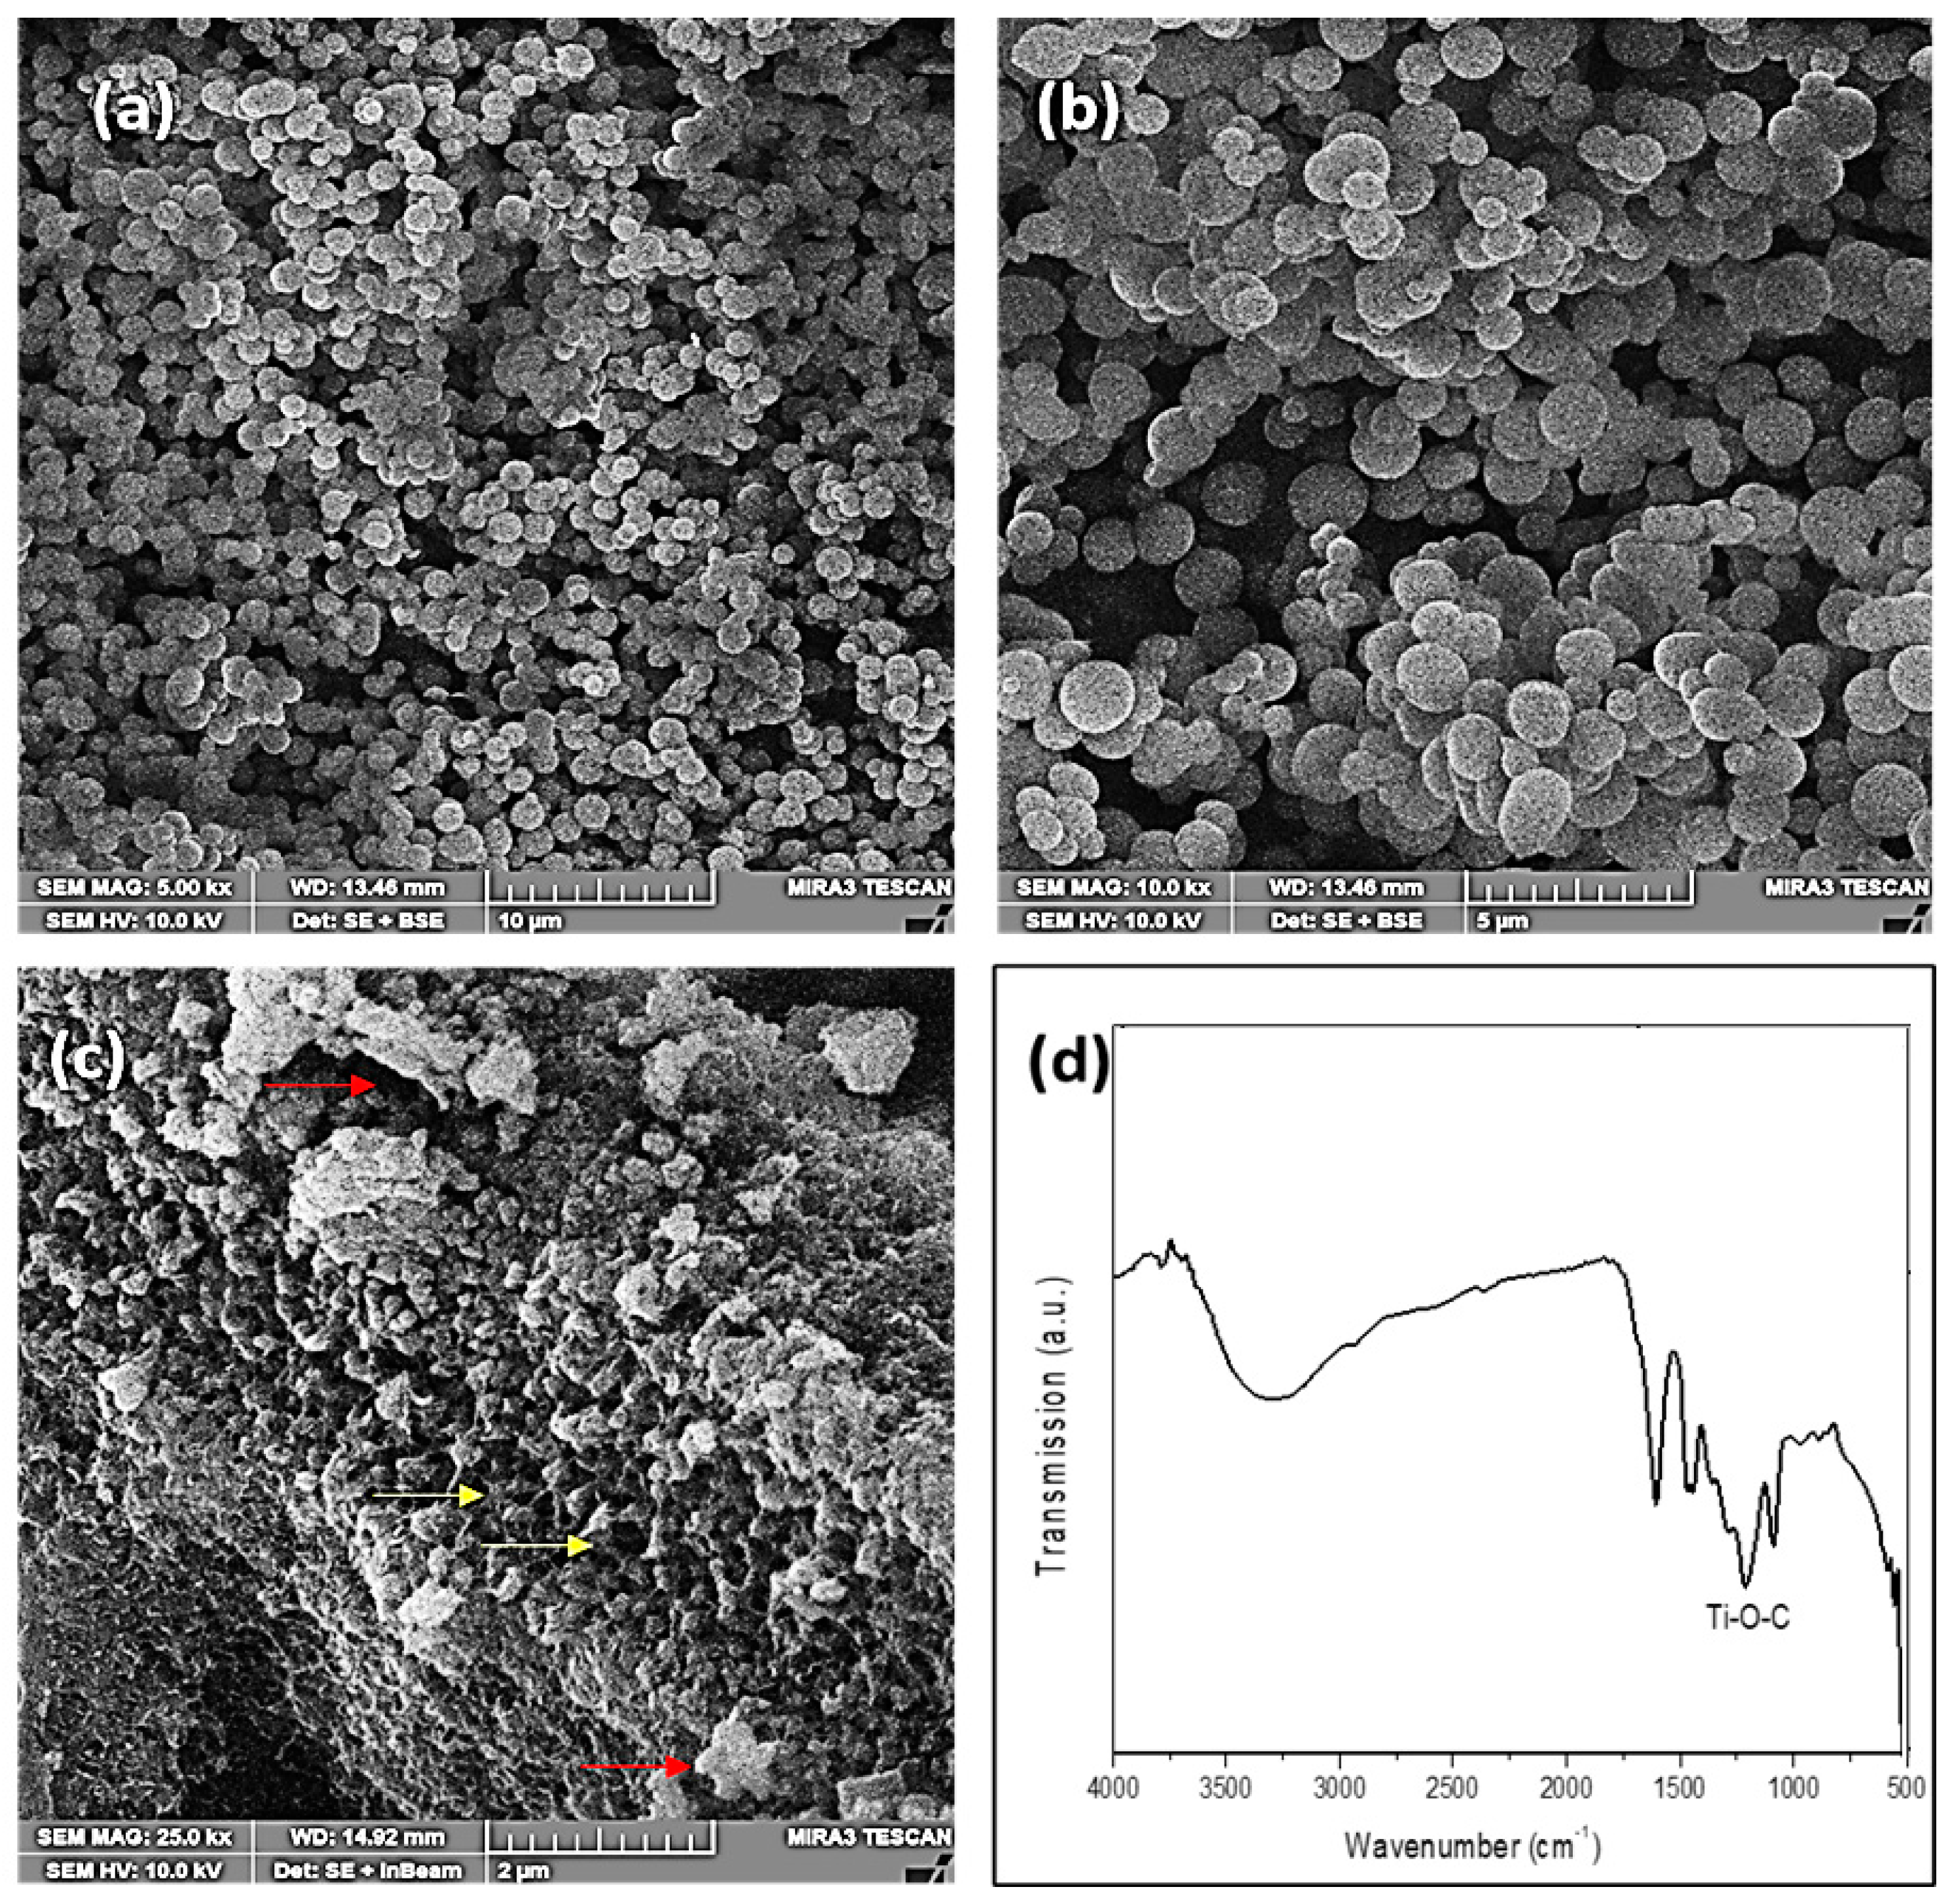
Figure 1. (ac) FESEM micrographs (contrast altered) at different magnifications and (d) FTIR spectrum of CXTi synthesised in this study.
Molecules 27 08483 g001
Figure 2. Nitrogen adsorption/desorption isotherm of CXTi synthesised in this study.
Molecules 27 08483 g002
Figure 3. Effect of (a) adsorbent dosage and (b) pH on the adsorption capacity of methylene blue using CXTi synthesised in this study (T = 23 °C, adsorbent dose = 0.01 g, C0 = 100 mg L−1).
Molecules 27 08483 g003
Figure 4. Effect of contact time (0–240 min) on MB adsorption on CXTi synthesised in this study, at initial concentrations of 50, 100, 150 and 200 mg L−1. Note: Error bars are negligibly small, hence the overlap of the limits.
Molecules 27 08483 g004
Figure 5. Pseudo first order and pseudo second order model fittings to experimental data for adsorption of MB on CXTi synthesised in this study, at initial concentrations of 50, 100, 150 and 200 mg L−1 (T = 23 °C, dose = 0.01 g mL−1).
Molecules 27 08483 g005
Figure 6. Elovich model fitting to experimental data for adsorption of MB on CXTi synthesised in this study, at initial concentrations of 50, 100, 150 and 200 mg L−1 (T = 23 °C, dose = 0.01 g mL−1).
Molecules 27 08483 g006
Figure 7. FTIR spectra of CXTi recorded before and after the adsorption treatment.
Molecules 27 08483 g007
Figure 8. The intra-particle diffusion model linearly fitted to experimental data for adsorption of MB onto CXTi synthesised in this study, at initial concentrations of 50, 100, 150 and 200 mg L−1 (T = 23 °C, dose = 0.01 g mL−1).
Molecules 27 08483 g008
Figure 9. Adsorption isotherm fittings for Langmuir, Freundlich and Sips isotherm models for MB adsorption on CXTi synthesised in this study.
Molecules 27 08483 g009
Figure 10. (a) UV-Vis absorption spectrum of CXTi synthesised in this study, (b) Tauc plot of CXTi, (c) post adsorption photocatalytic performance of CXTi under visible light irradiation and (d) kinetics of combined adsorption and photodegradation of MB on CXTi.
Molecules 27 08483 g010
Scheme 1. Proposed photocatalytic mechanism of CXTi under visible light irradiation.
Molecules 27 08483 sch001
Figure 11. FTIR of (a) pure MB (b) MB after photodegradation.
Molecules 27 08483 g011
Figure 12. Pictures of petri plates for detection of total coliforms following 24 h incubation at 35 °C (a) before water treatment and (b) after water treatment with CXTi. The colonies that were dark red, mucoidal and had dark centres were counted. Dark centres that produce metallic sheen are considered to be total coliform colonies. Metallic green colonies indicate the presence of E. coli in a water sample.
Molecules 27 08483 g012
Figure 13. Pictures of petri plates for detection of faecal coliforms following 24 h incubation at 44.5 °C (a) before water treatment and (b) after water treatment with CXTi. Only blue colonies are counted, which are considered to be faecal coliform colonies. E. coli form dark blue flat colonies.
Molecules 27 08483 g013
Figure 14. CXTi reusability after testing against degradation of MB dye (C0 = 100 mg L−1, T = 23 °C, dose = 0.01 g mL−1, total treatment time 120 min).
Molecules 27 08483 g014
Table 1. Kinetic constants for MB adsorption by CXTi; qexp is the experimental amount adsorbed at equilibrium.
50 mg L−1100 mg L−1150 mg L−1200 mg L−1
qexp113217220221
Pseudo first order
qt mg g−1112211216217
k1 min−10.1040.1190.1140.177
R20.9630.9590.9470.975
Pseudo second order
qt mg g−1120225230229
k2 (10−3) g mg−1 min−11.400.8750.8391.43
R20.9930.9930.9900.999
Elovich
R20.9760.9770.9790.979
Table 2. Parameters for MB adsorption at equilibrium computed from Langmuir, Freundlich and Sips isotherm model equations.
Isotherm ModelParameters
Experimental qe (mg g−1)218
LangmuirqL (mg g−1)255
KL (L mg−1)0.087
RL0.103
R20.951
FreundlichKF mg g−1 (L mg−1)1/n60.5
nF3.35
R20.861
Sipsqs (mg g−1)217
Ks (L mg−1)0.007
ns2.28
R20.992
Table 3. Characteristics and degradation performance of comparable systems.
MaterialProcedureInorganic ContentSurface Area m2 g−1Band gap (eV)PollutantRemoval EfficiencyRef.
Magnet photocatalyst based on Carbon Xerogels/TiO2 Photoinactivation under UV irradiation Fe3O4/SiO2/N-CXTi = 70%
Fe3O4/N-CXTi = 67%
Fe3O4/SiO2/N-CXTi = 388
Fe3O4/N-CXTi = 212
Fe3O4/SiO2/N-CXTi = 3.22
Fe3O4/SiO2/N-CXTi = 3.10
AcetaminophenFe3O4/SiO2/N-CXTi = 98%
Fe3O4/SiO2/N-CXTi = 85%
[35]
Carbon/TiO2 gelsAdsorption–Photodegradation under UV–Vis irradiation10%5882.97Methylene blue, microbes74%[17]
Carbon Xerogel/TiSimultaneous adsorption–photodegradation38%6502.68Acetaminophen96%[36]
Carbon Xerogel/TiO2 compositeAdsorption–photodegradation33%4012.60Orange G70%[37]
TiO2/Carbon Aerogel compositePhotoinactivation under UV irradiation85%124-Dimethyl phthalate (DMP)83%[38]
Carbon Xerogel/TitaniaAdsorption–photodegradation30%3842.24Methylene blue, Indicator microorganisms99%This work
Table 4. Antimicrobial results after performing tests against reduction in total and faecal coliform and E. coli in control conditions and treatment using CXTi synthesised in this study.
Total ColiformFaecal ColiformE. coli
Control210180176
Post Treatment with CXTi<1<1<1
Publisher’s Note: MDPI stays neutral with regard to jurisdictional claims in published maps and institutional affiliations.