Article

Fluorescence vs. Phosphorescence: Which Scenario Is Preferable in Au(I) Complexes with Benzothiadiazoles?

by
Radmir. M. Khisamov
,
Alexey A. Ryadun
,
Sergey N. Konchenko
and
Taisiya S. Sukhikh
*
Nikolaev Institute of Inorganic Chemistry, Siberian Branch of the Russian Academy of Sciences, 3 Lavrentiev Ave., 630090 Novosibirsk, Russia
*
Author to whom correspondence should be addressed.
Molecules 2022, 27(23), 8162; https://doi.org/10.3390/molecules27238162
Submission received: 7 November 2022 / Revised: 19 November 2022 / Accepted: 21 November 2022 / Published: 23 November 2022
(This article belongs to the Special Issue Photochemistry and Photophysics of Metal Complexes)

Abstract

:
The photoluminescence of Au(I) complexes is generally characterized by long radiative lifetimes owing to the large spin-orbital coupling constant of the Au(I) ion. Herein, we report three brightly emissive Au(I) coordination compounds, 1, 2a, and 2b, that reveal unexpectedly short emission lifetimes of 10–20 ns. Polymorphs 2a and 2b exclusively exhibit fluorescence, which is quite rare for Au(I) compounds, while compound 1 reveals fluorescence as the major radiative pathway, and a minor contribution of a microsecond-scale component. The fluorescent behaviour for 12 is rationalized by means of quantum chemical (TD)-DFT calculations, which reveal the following: (1) S0–S1 and S0–T1 transitions mainly exhibit an intraligand nature. (2) The calculated spin-orbital coupling (SOC) between the states is small, which is a consequence of overall small metal contribution to the frontier orbitals. (3) The T1 state features much lower energy than the S1 state (by ca. 7000 cm−1), which hinders the SOC between the states. Thus, the S1 state decays in the form of fluorescence, rather than couples with T1. In the specific case of complex 1, the potential energy surfaces for the S1 and T2 states intersect, while the vibrationally resolved S1–S0 and T2–S0 calculated radiative transitions show substantial overlap. Thus, the microsecond-scale component for complex 1 can stem from the coupling between the S1 and T2 states.

1. Introduction

Au(I) is a heavy d10 ion, whose coordination compounds have widespread applications, particularly in areas associated with light emission [1,2,3,4]. For these applications, understanding the origin of photophysical processes and the structure–property relationships is essential, as they play a decisive role in the characteristics of functional materials [5,6,7]. Au coordination compounds generally reveal a phosphorescent nature of luminescence (both conventional phosphorescence and delayed fluorescence) [8,9,10,11], which is tailored by the heavy atom effect. The latter promotes spin-orbit coupling (SOC) between singlet and triplet states, thus facilitating intersystem crossing (ISC) between them, which relaxes the spin ‘forbidden’ radiative transitions [12]. In general, the heavier the metal atom of a coordination compound, the stronger the SOC [13,14,15]. However, recent studies revealed that the presence of heavy atoms does not guarantee efficient ISC, while the nature of ligands may play a critical role in determining the radiation pathway [16,17,18]. To this end, the theoretical understanding of the relaxation processes is crucial, especially since conventional ISC between the S1 and T1 states is not necessarily the only pathway [19,20]. For instance, in a recently reported Au(III) complex, the S1 state couples with T4 and T5, resulting in phosphorescence as a major radiation pathway, while the relative Au(I) complex mainly demonstrates fluorescence due to the absence of triplet states energetically close to S1 [21]. The study of two Pt(II) complexes revealed the existence of two channels, S1–T1 and S1–T2; structural differences in the complexes result in a dominance of either one or the other channel, which induces their different luminescent behaviour [22]. Recently reported benzothiadiazole-based Au(I) compounds feature high quantum yields, reaching 97% in various organic matrices [23]. Notably, in the latter complexes, only a prompt fluorescence was observed.
Inspired by these encouraging examples, we study the luminescent properties of novel Au(I) complexes 1, 2a, and 2b with two closely related ligands bearing benzothiadiazole (btd) moiety. In this context, amino-substituted btds open up a great scope for the design of photoactive materials: a slight variation of the composition and structure of btds results in a wide variation of energetic characteristics of electronic transitions, which is the key to fine-tuning the photophysical properties [24,25,26,27]. Herein, we chose two phosphorus-nitrogen ligands, comprising the NH-btd moiety as a chromophore, and PPh2 moiety as a readily accessible unit for the metal coordination. Synthesized compounds 12 exhibit prompt fluorescence, unusual for Au(I) complexes. We provide an interpretation of this phenomenon using quantum chemical DFT calculations.

2. Results and Discussion

2.1. Synthesis and Crystal Structure of the Compounds

The new compound N-(diphenylphosphino)-2,1,3-benzothiadiazole-4-amine (PN; Scheme 1) was prepared by the reaction of 4-amino-2,1,3-benzothiadiazole and chlorodiphenylphosphine, in the presence of triethylamine as a base. The corresponding 1,3-phosphinoamine, PCN, was prepared by the one-pot condensation of diphenylphospine, benzaldehyde, and 4-amino-2,1,3-benzothaidiazole as reported recently [28]. Reactions of equimolar amounts of (THT)AuCl (THT–tetrahydrothiophene) with PN and PCN yielded complexes [Au(PN)Cl] (1) and [Au(PCN)Cl] (2), respectively. Changing the molar ratio of the phosphinoamines and Au to 1:2 produced the same complexes. For complex 2, we obtained two polymorphs, 2a and 2b. The first one (2a) precipitated by slow concentration of a tetrahydrofuran (THF) solution under vacuum, while the second polymorph (2b) was formed from oversaturated oily THF solution. Both polymorphs can be obtained as a single phase, as evidenced by powder X-ray diffraction (XRD) analysis (Figures S1–S3).
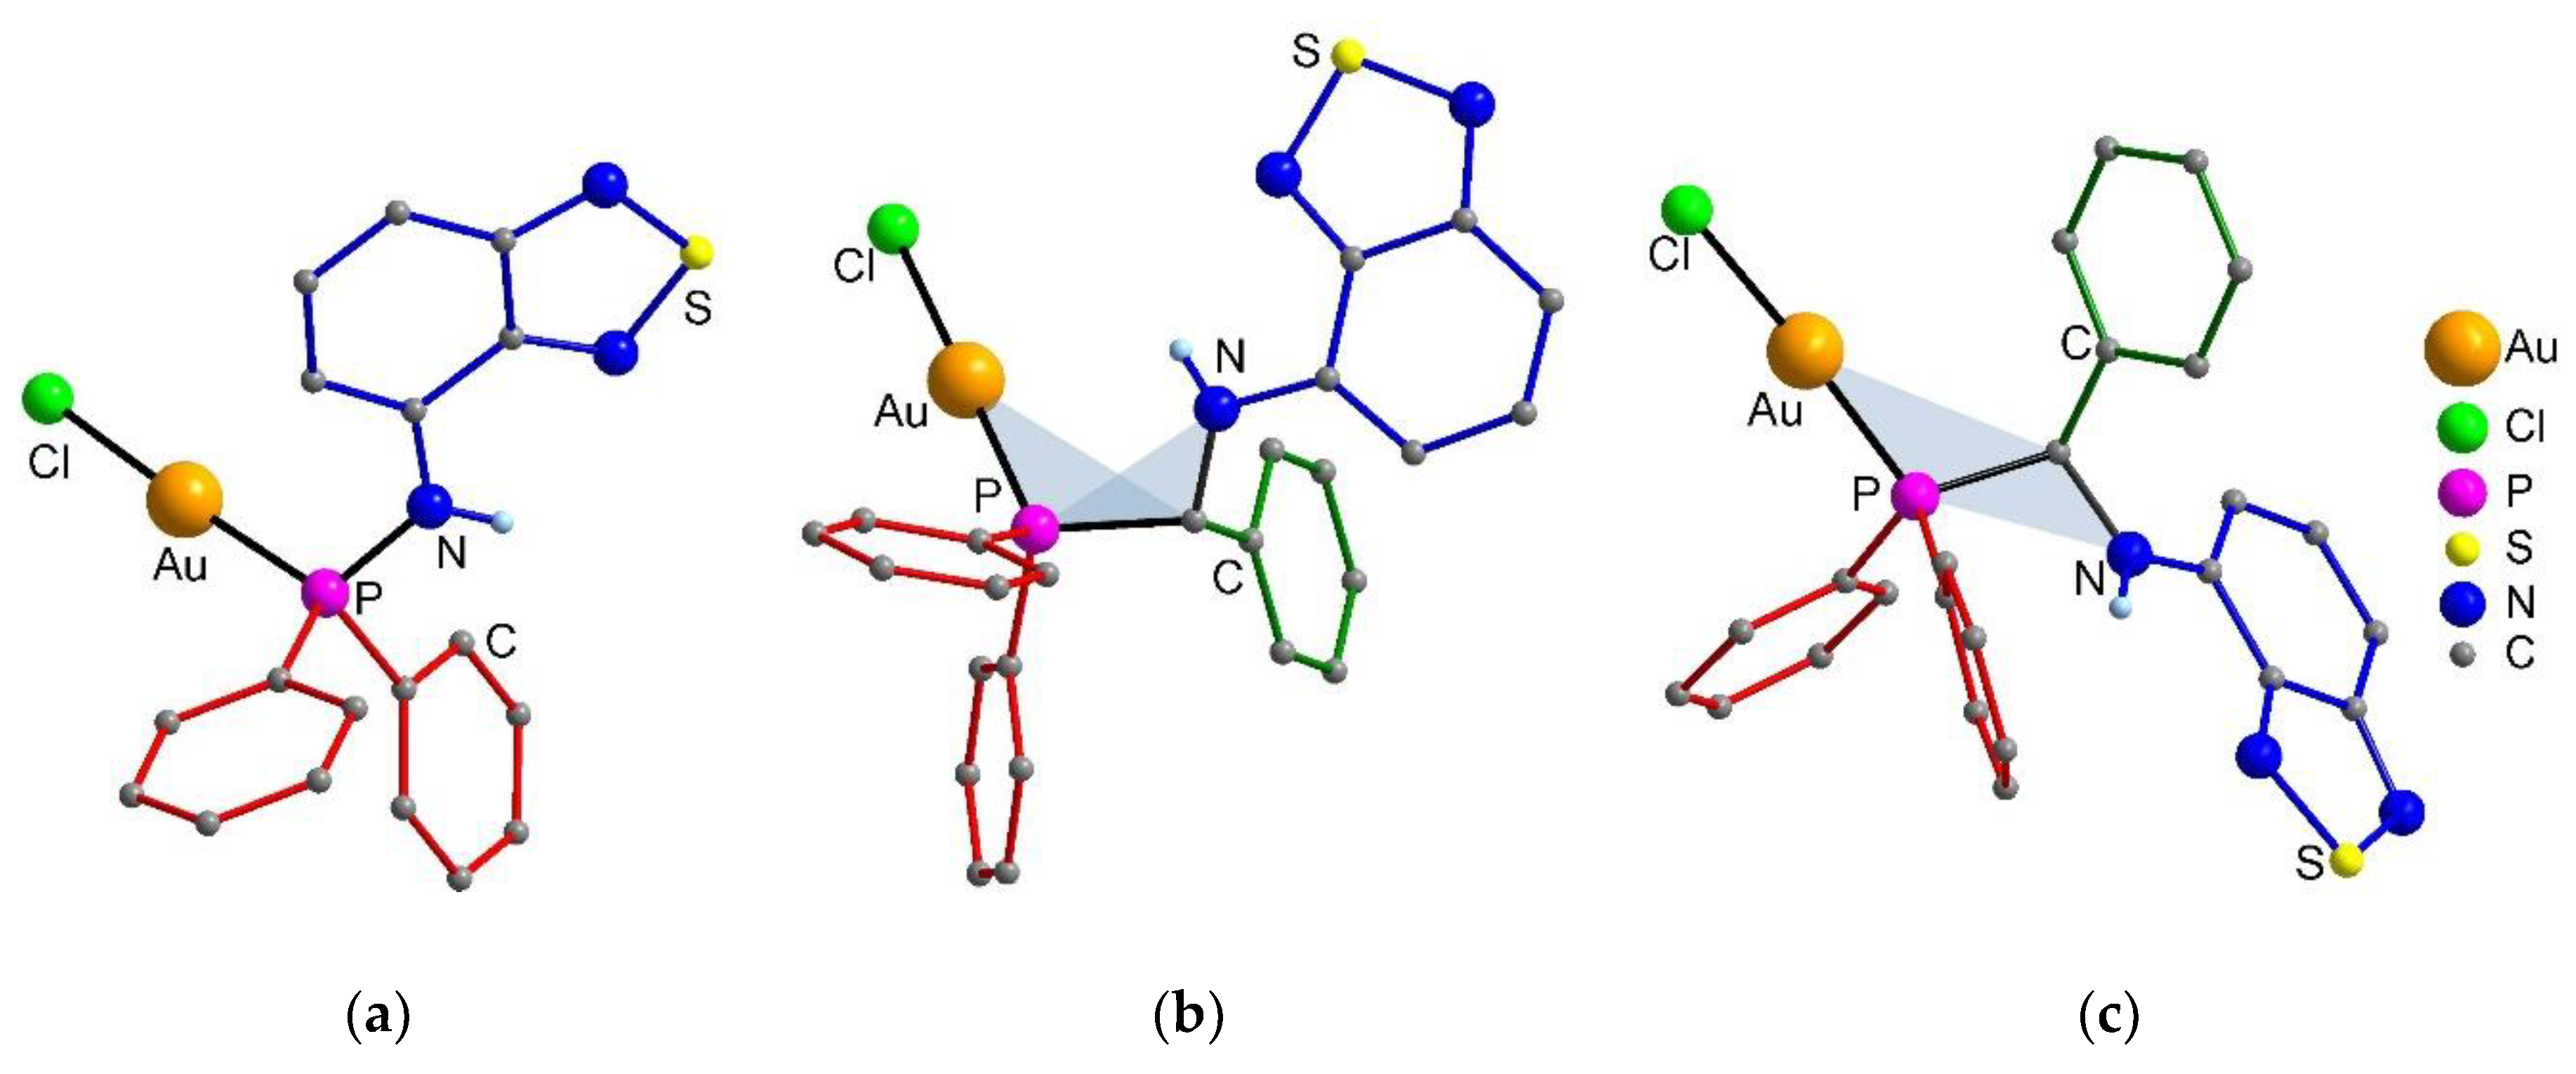
According to single-crystal XRD analysis, compounds 1, 2a, and 2b exhibit a linear coordination environment of the metal by the Cl and P atoms (Figure 1). Except for these, Au(I) reveals neither intra- nor intermolecular contacts. No other specific intermolecular interactions were found. The geometry of molecule 2a mainly differs from 2b in the torsion angle {Au–P–C–N} (56.2° in 2a versus 165.7° in 2b). According to DFT calculations, the single molecules have similar Gibbs energy (the energy difference is less than 1 kJ·mol−1), while the calculated energy barrier (both in vacuum and in THF), corresponding to the transition from 2a to 2b, amounts to 30 kJ·mol−1 (Figure 2). This implies that the conformers 2a and 2b can easily transform to each other in the solution, which is corroborated by the presence of one set of signals in the corresponding 31P and 1H NMR spectra. Upon crystallization, either one or the other conformer is implemented, depending on a slight variation in the conditions; specifically, almost the entire amount of the dissolved complex can precipitate as pure phase 2a.

2.2. Photophysical Properties and TD-DFT Calculations

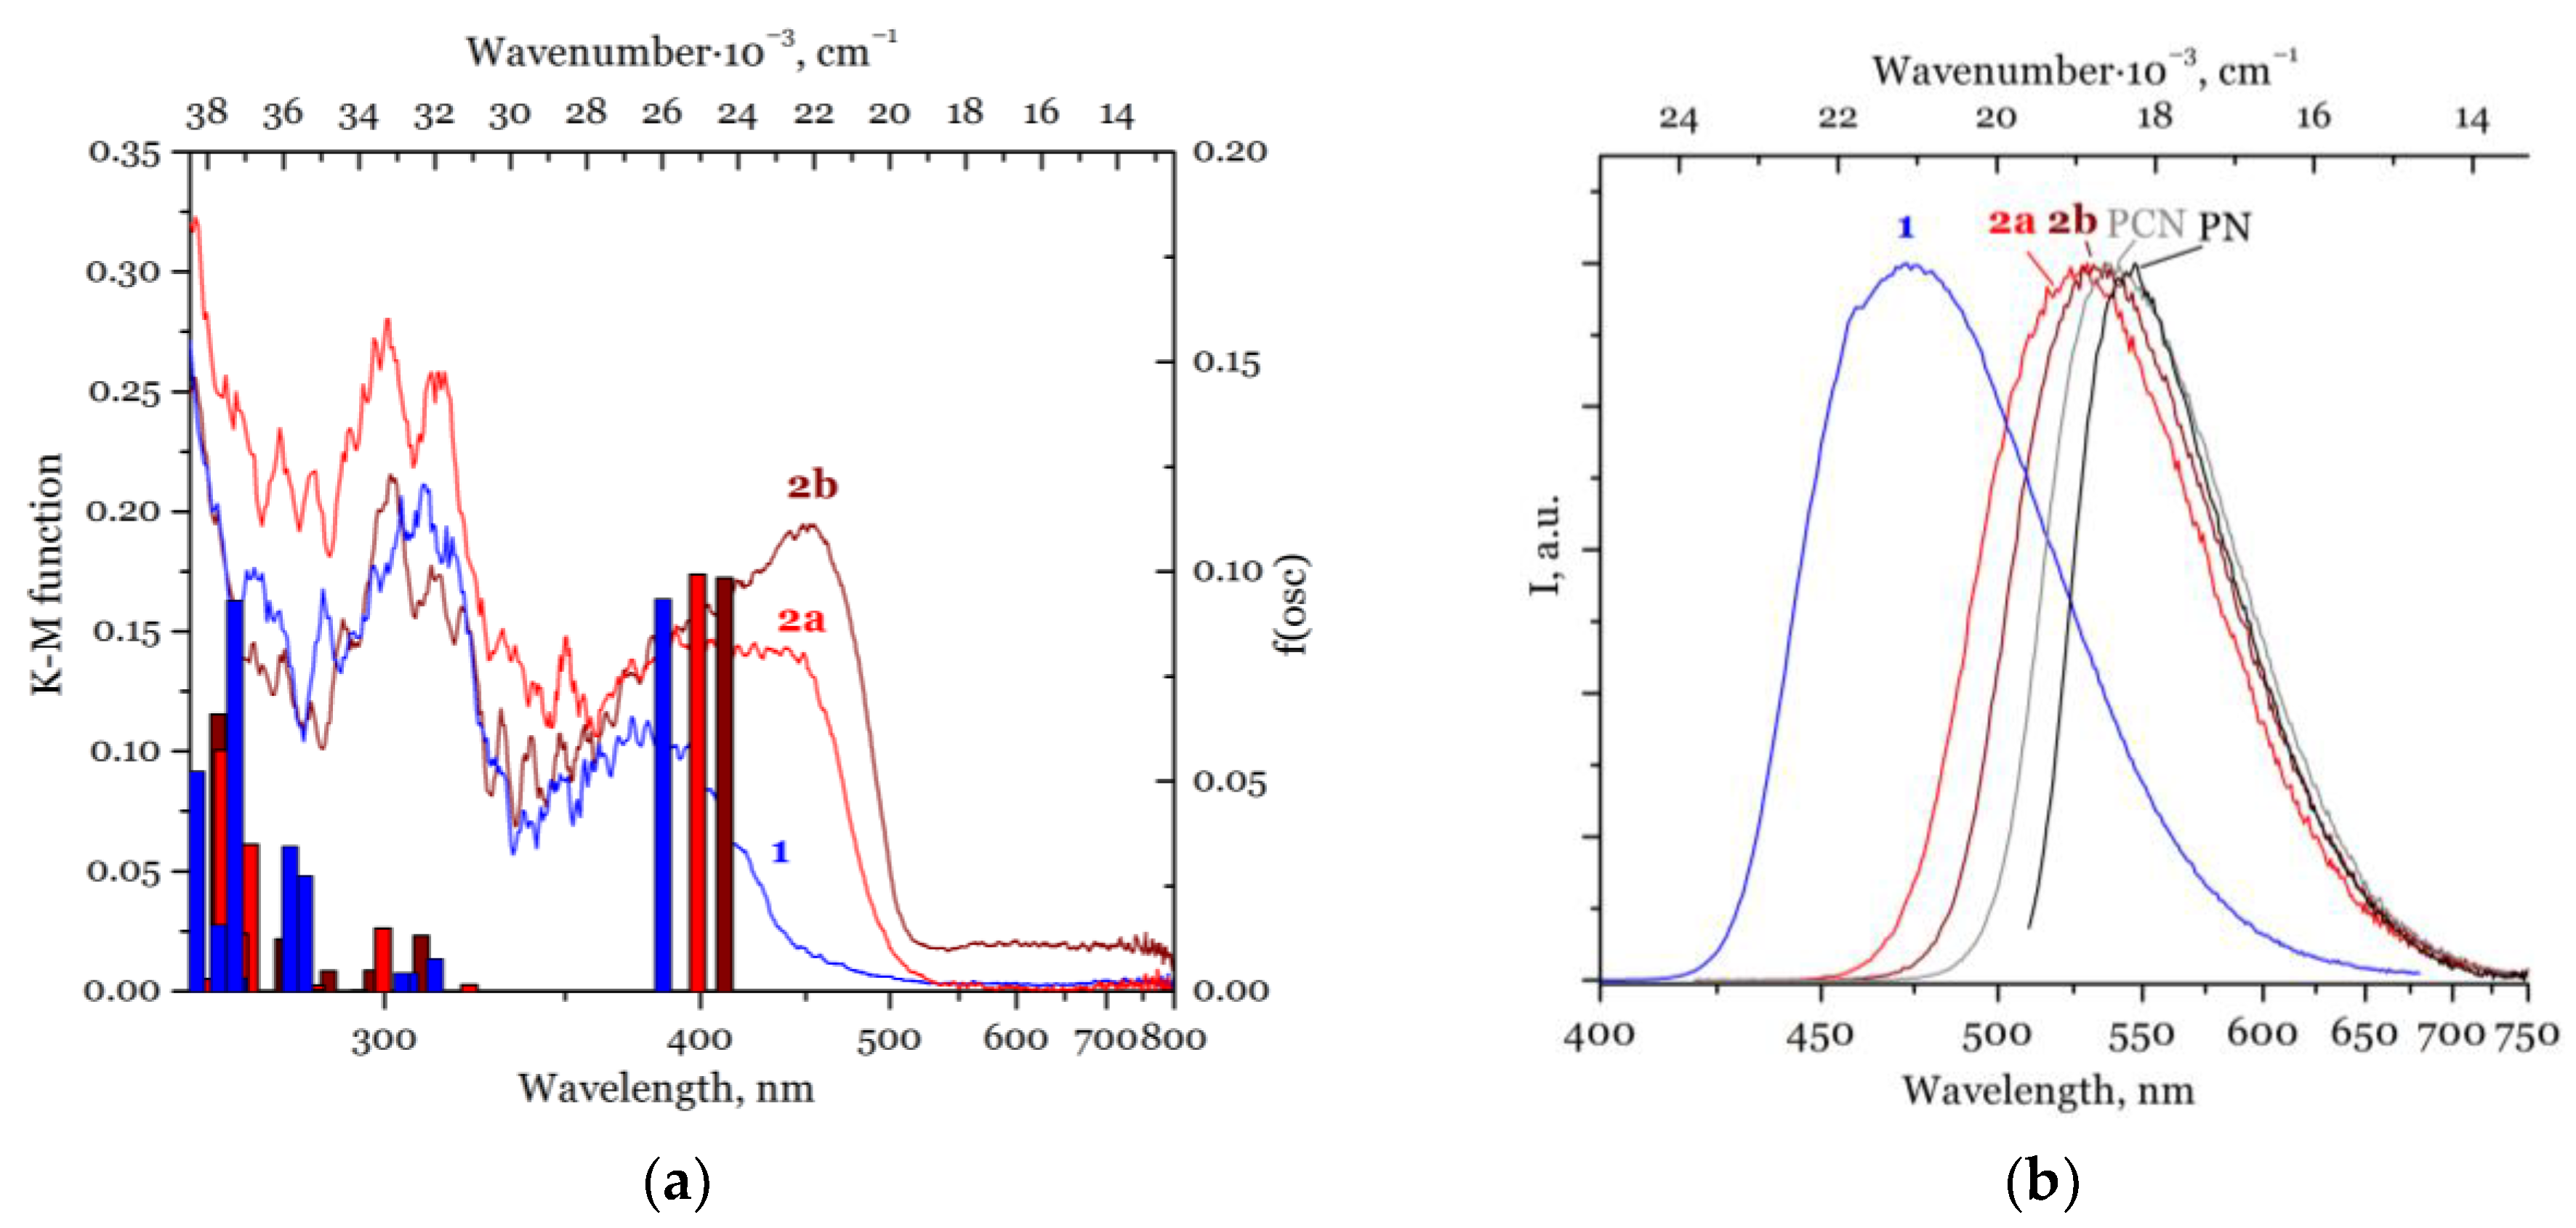
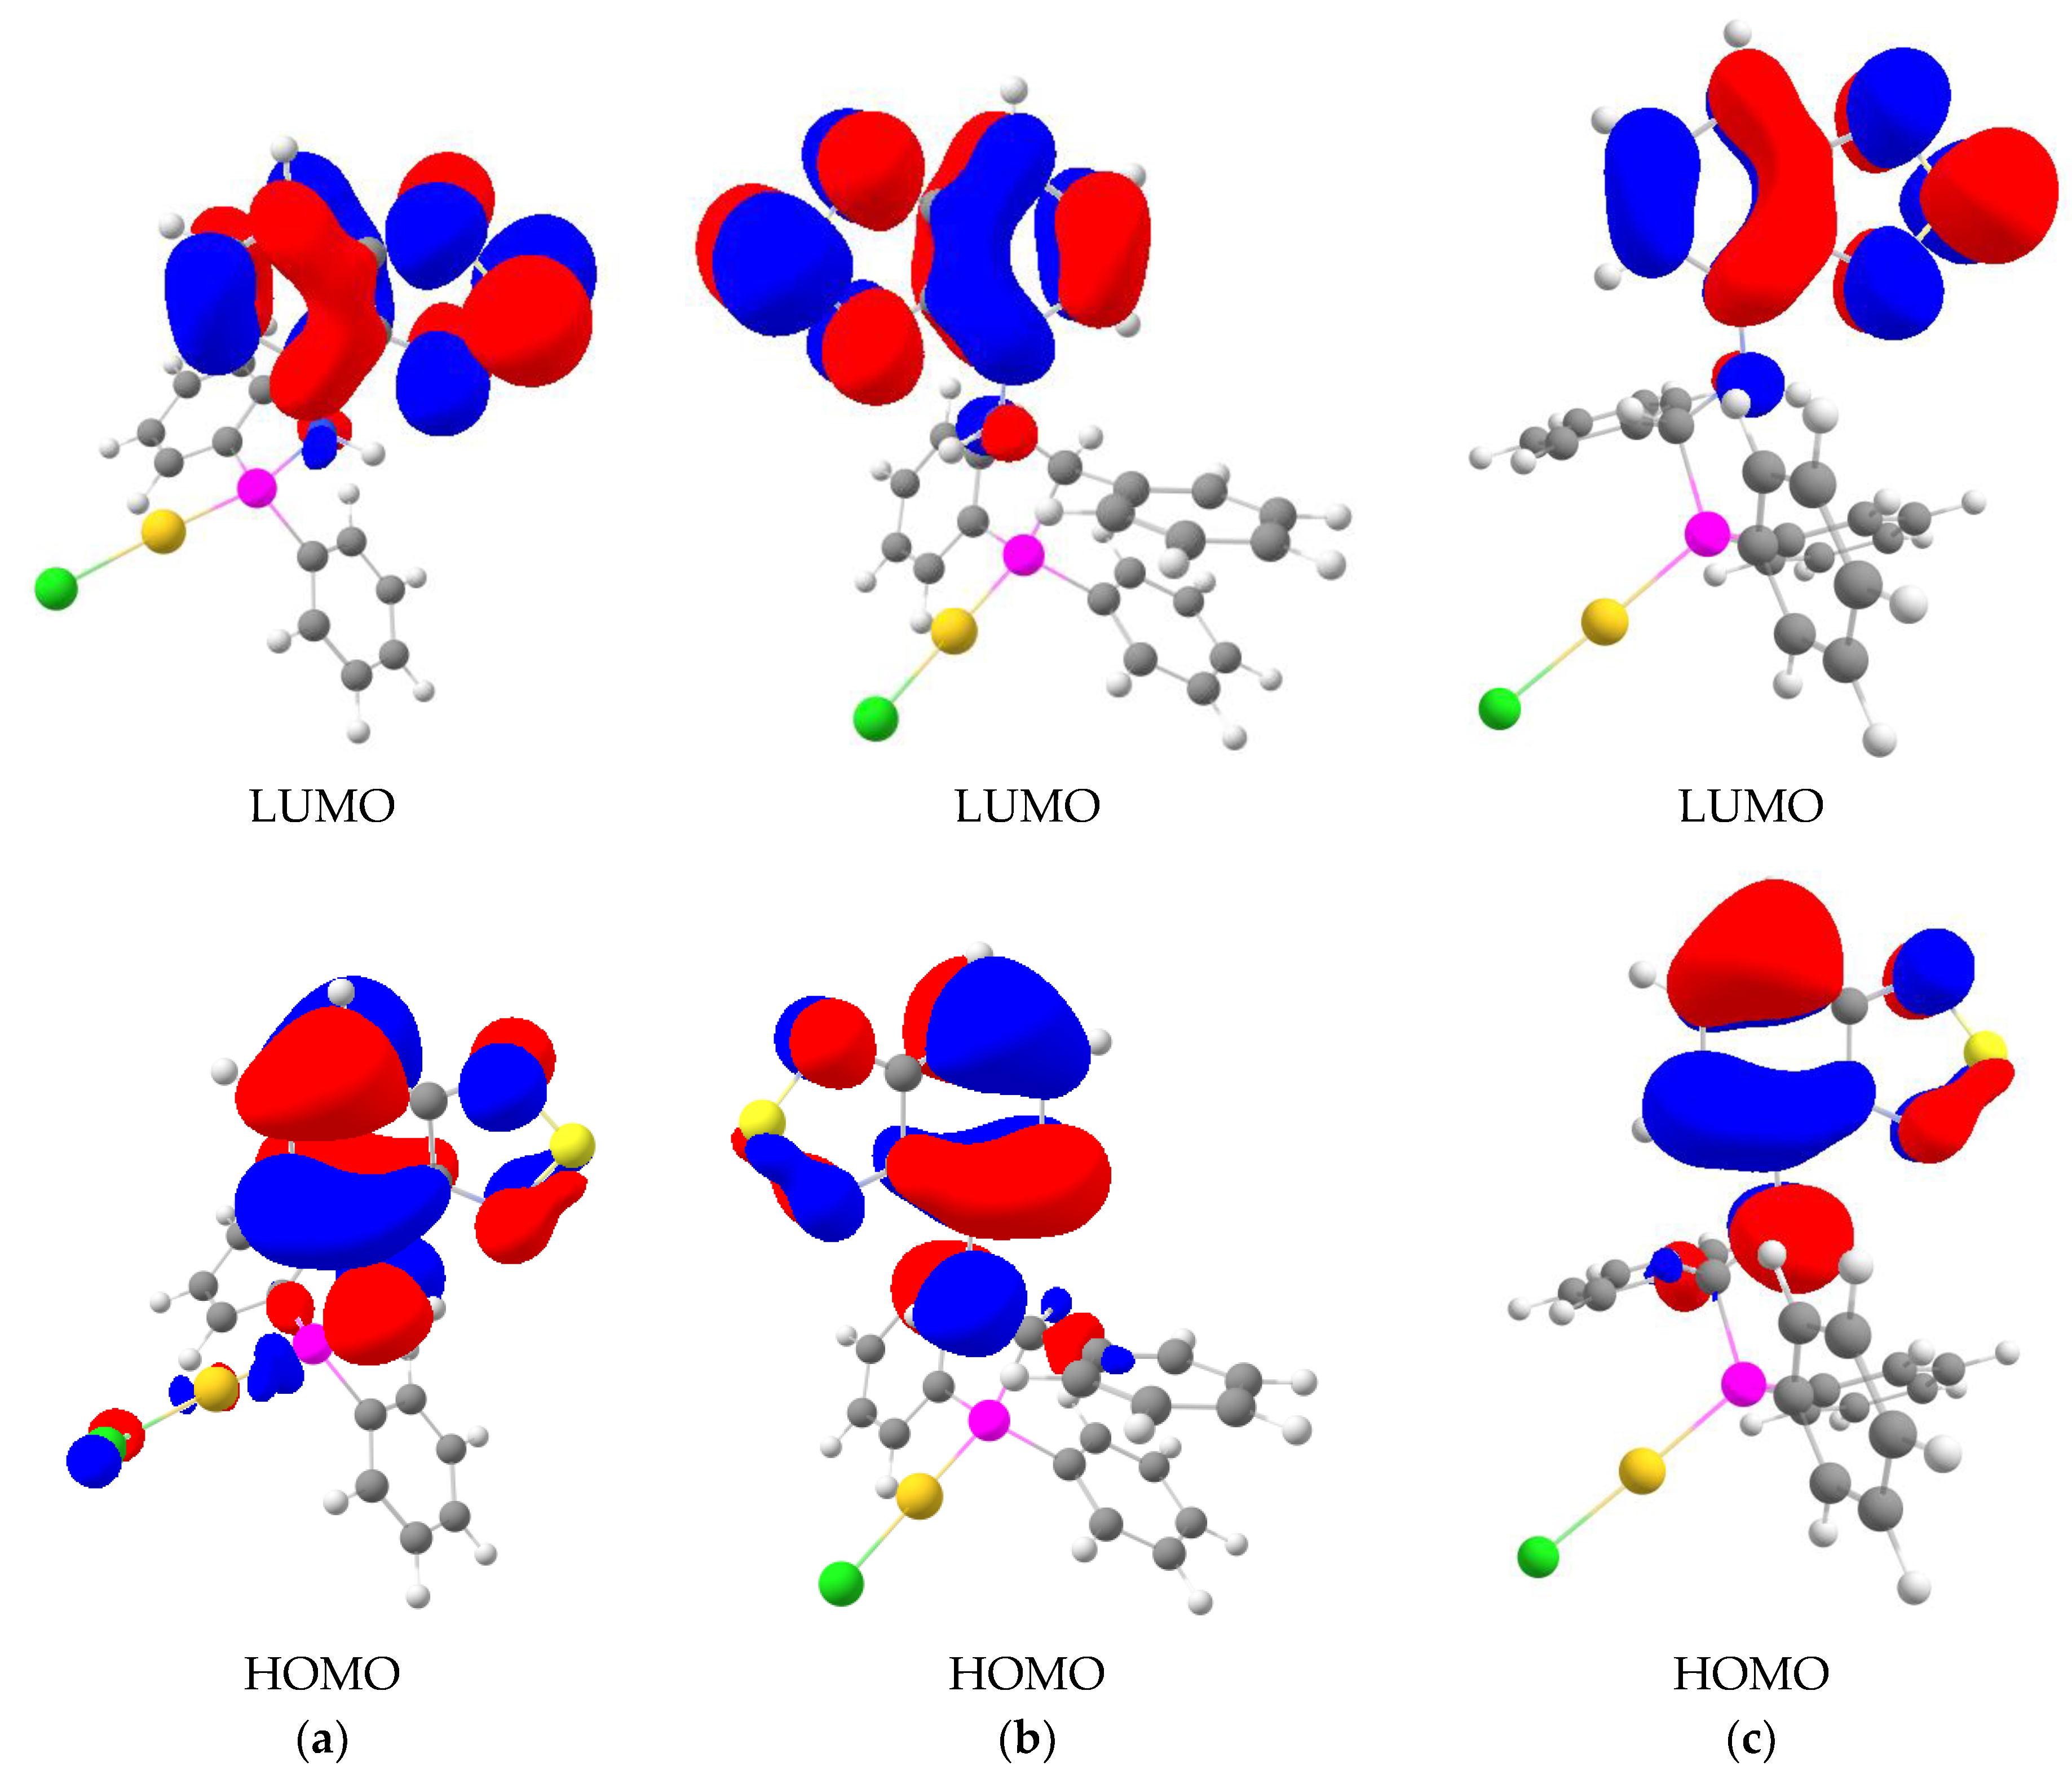
The UV-Vis spectra were measured for 12 in the solid state (Figure 3, Table 1). The shape of the spectra is quite similar, with the exception that the long wavelength band for compound 1 is hypsochromically shifted as compared to 2a and 2b. According to TD-DFT calculations for the single molecules at their ground-state optimised geometry (Tables S1–S6), the long wavelength band corresponds to the S0S1 transition between HOMO and LUMO orbitals (Figure 4, Figures S4 and S5). The transition has a locally excited (LE) character with a notable contribution of an intraligand charge transfer (ILCT) from the periphery to the thiadiazole moiety, which is common for btd derivatives (Figure 4) [28,29,30,31]. In addition, compound 1 features a minor contribution of Au and Cl orbitals to the HOMO, which implies the presence of (M+X)LCT (metal- and halogen-to-ligand charge transfer). Upon photoexcitation, solids 12 exhibit a bright emission, with the absolute quantum yields of 30–34% (Table 1). The position of the bands does not depend on the excitation wavelength in the range of 300–400 nm (Figure S6). The luminescence spectra of compounds 2a and 2b reveal a hypsochromic shift of the emission band by ca. 450 and 100 cm−1, respectively, compared with free PCN. Compound 1 exhibits a more pronounced hypsochromic shift by ca. 2750 cm−1 compared with PN. The absorption and emission spectra of 2a and 2b in THF solution (Figure S7) are identical, suggesting that there is one emitting species in the solution.
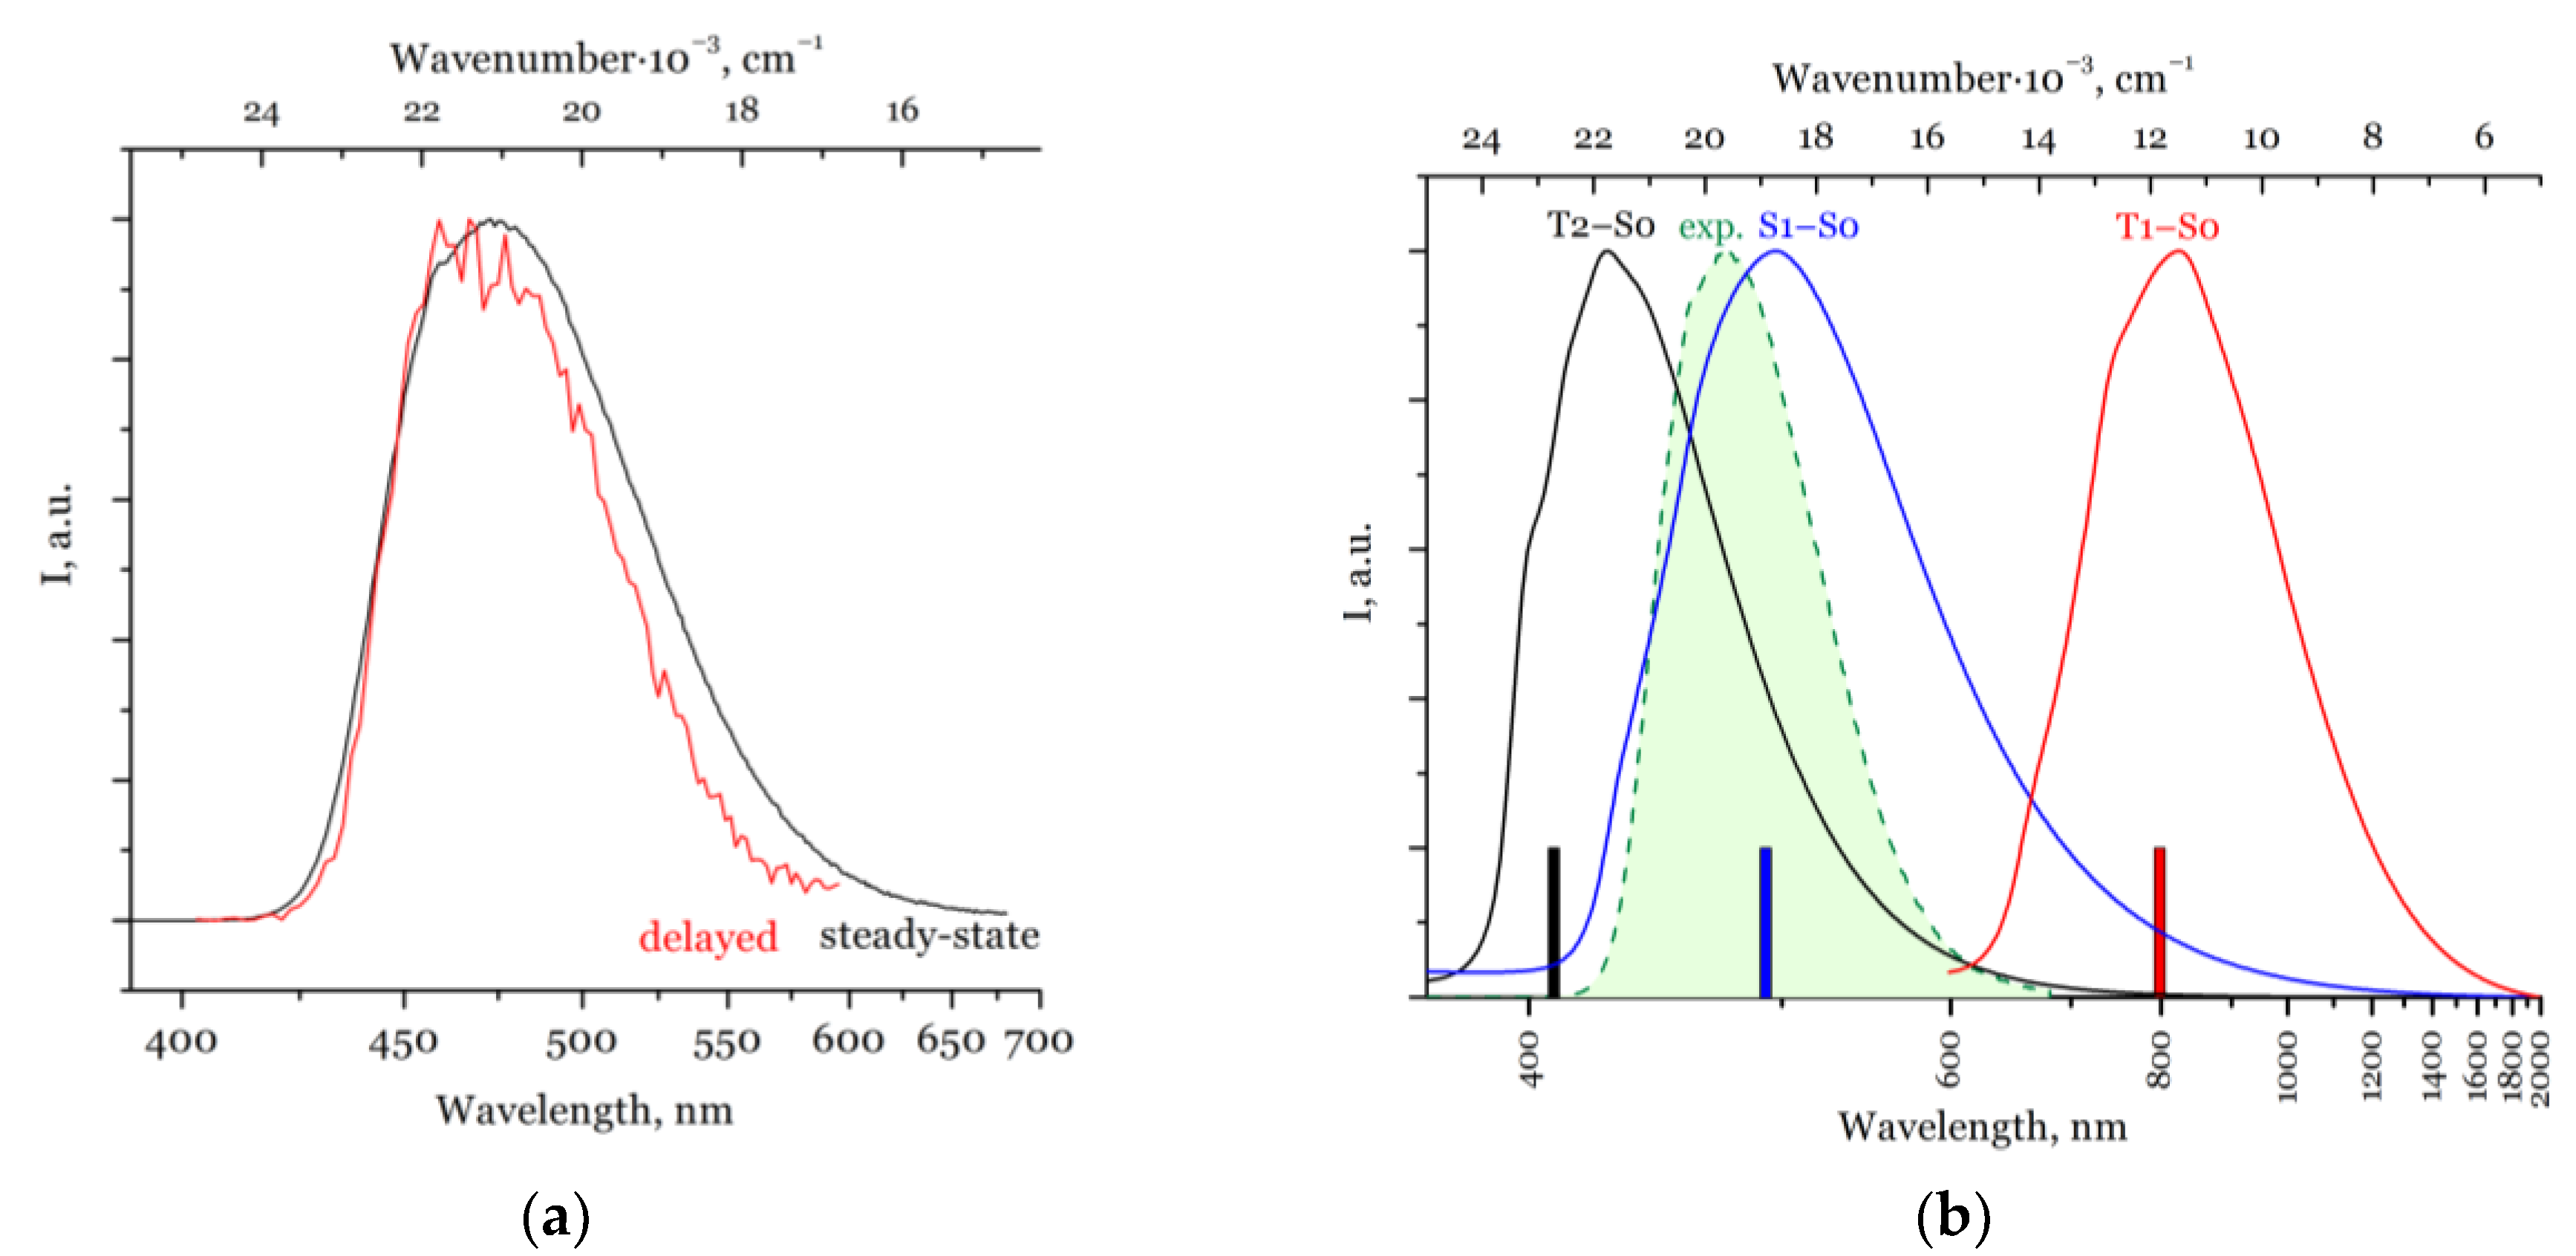
Unexpectedly, the emission decay curves of solids 12 exhibit kinetics on the nanosecond scale, which yields the emission lifetimes of 10–20 ns (Figures S8–S10). This is not typical for Au complexes, which usually reveal microsecond-scale kinetics owing to efficient SOC between the singlet and triplet states. The emission bands change negligibly upon cooling from room temperature to 77 K (Figure S11). Compounds 2a and 2b show exclusively prompt luminescence, while 1 features a weak afterglow signal after a time delay of 300 μs; the position of the corresponding band approximately coincides with that in the steady-state spectrum (Figure 5a). Thus, we can speculate that both prompt and delayed emission result from the same excited state. Since the microsecond-scale component (with an estimated lifetime of 100 μs) is not detected against the background of the nanosecond-scale kinetics, we assume it has a contribution of less than 1% of the overall emission.
One should note that the afterglow intensity decreases under constant irradiation of a sample of 1, even in deaerated conditions. Within an hour, the signal drops by 10 times under a 450 W source of white light. Under the same conditions, the overall steady-state emission spectrum changes negligibly. This implies that the triplet states decompose due to processes in the solid, and are less photostable compared to the singlet excited states. The afterglow signal and its behaviour persist for samples from several parallel syntheses.
To gain insights into the peculiar fluorescent behaviour of compounds 12, we performed TD-DFT calculations for the emission transitions from the singlet and triplet excited states (Table 1), as well as the SOC matrix elements between these states (Tables S7 and S8). For complexes 2a and 2b, the calculated SOC is weak (the coefficients are 10 cm−1 and less), which is in line with the observed absence of a phosphorescence. The calculated SOC for 1 is several times higher, which is still quite weak, but it enables the mixing of the singlet and triplet states. For the complexes, the brightest excitation transition in the long wavelength region is S0–S1, while the others (including S2 and S3) feature a much shorter wavelength and a 10 times lower magnitude of oscillator strength (Table 2). Therefore, we consider the S1–Tn channels as the most probable pathways. The calculated T1 energy level is widely separated from the S1 level (the difference between vertical S0–S1 and S0–T1 transitions of ca. 7000 cm−1). This results in a very slow ISC from the S1 sate and thus enables fluorescence from this state. A similar observation was observed for Pt complexes that also feature high ΔE(S1−T1) of 6000 cm−1 resulting in the fluorescence along with conventional phosphorescence [32].
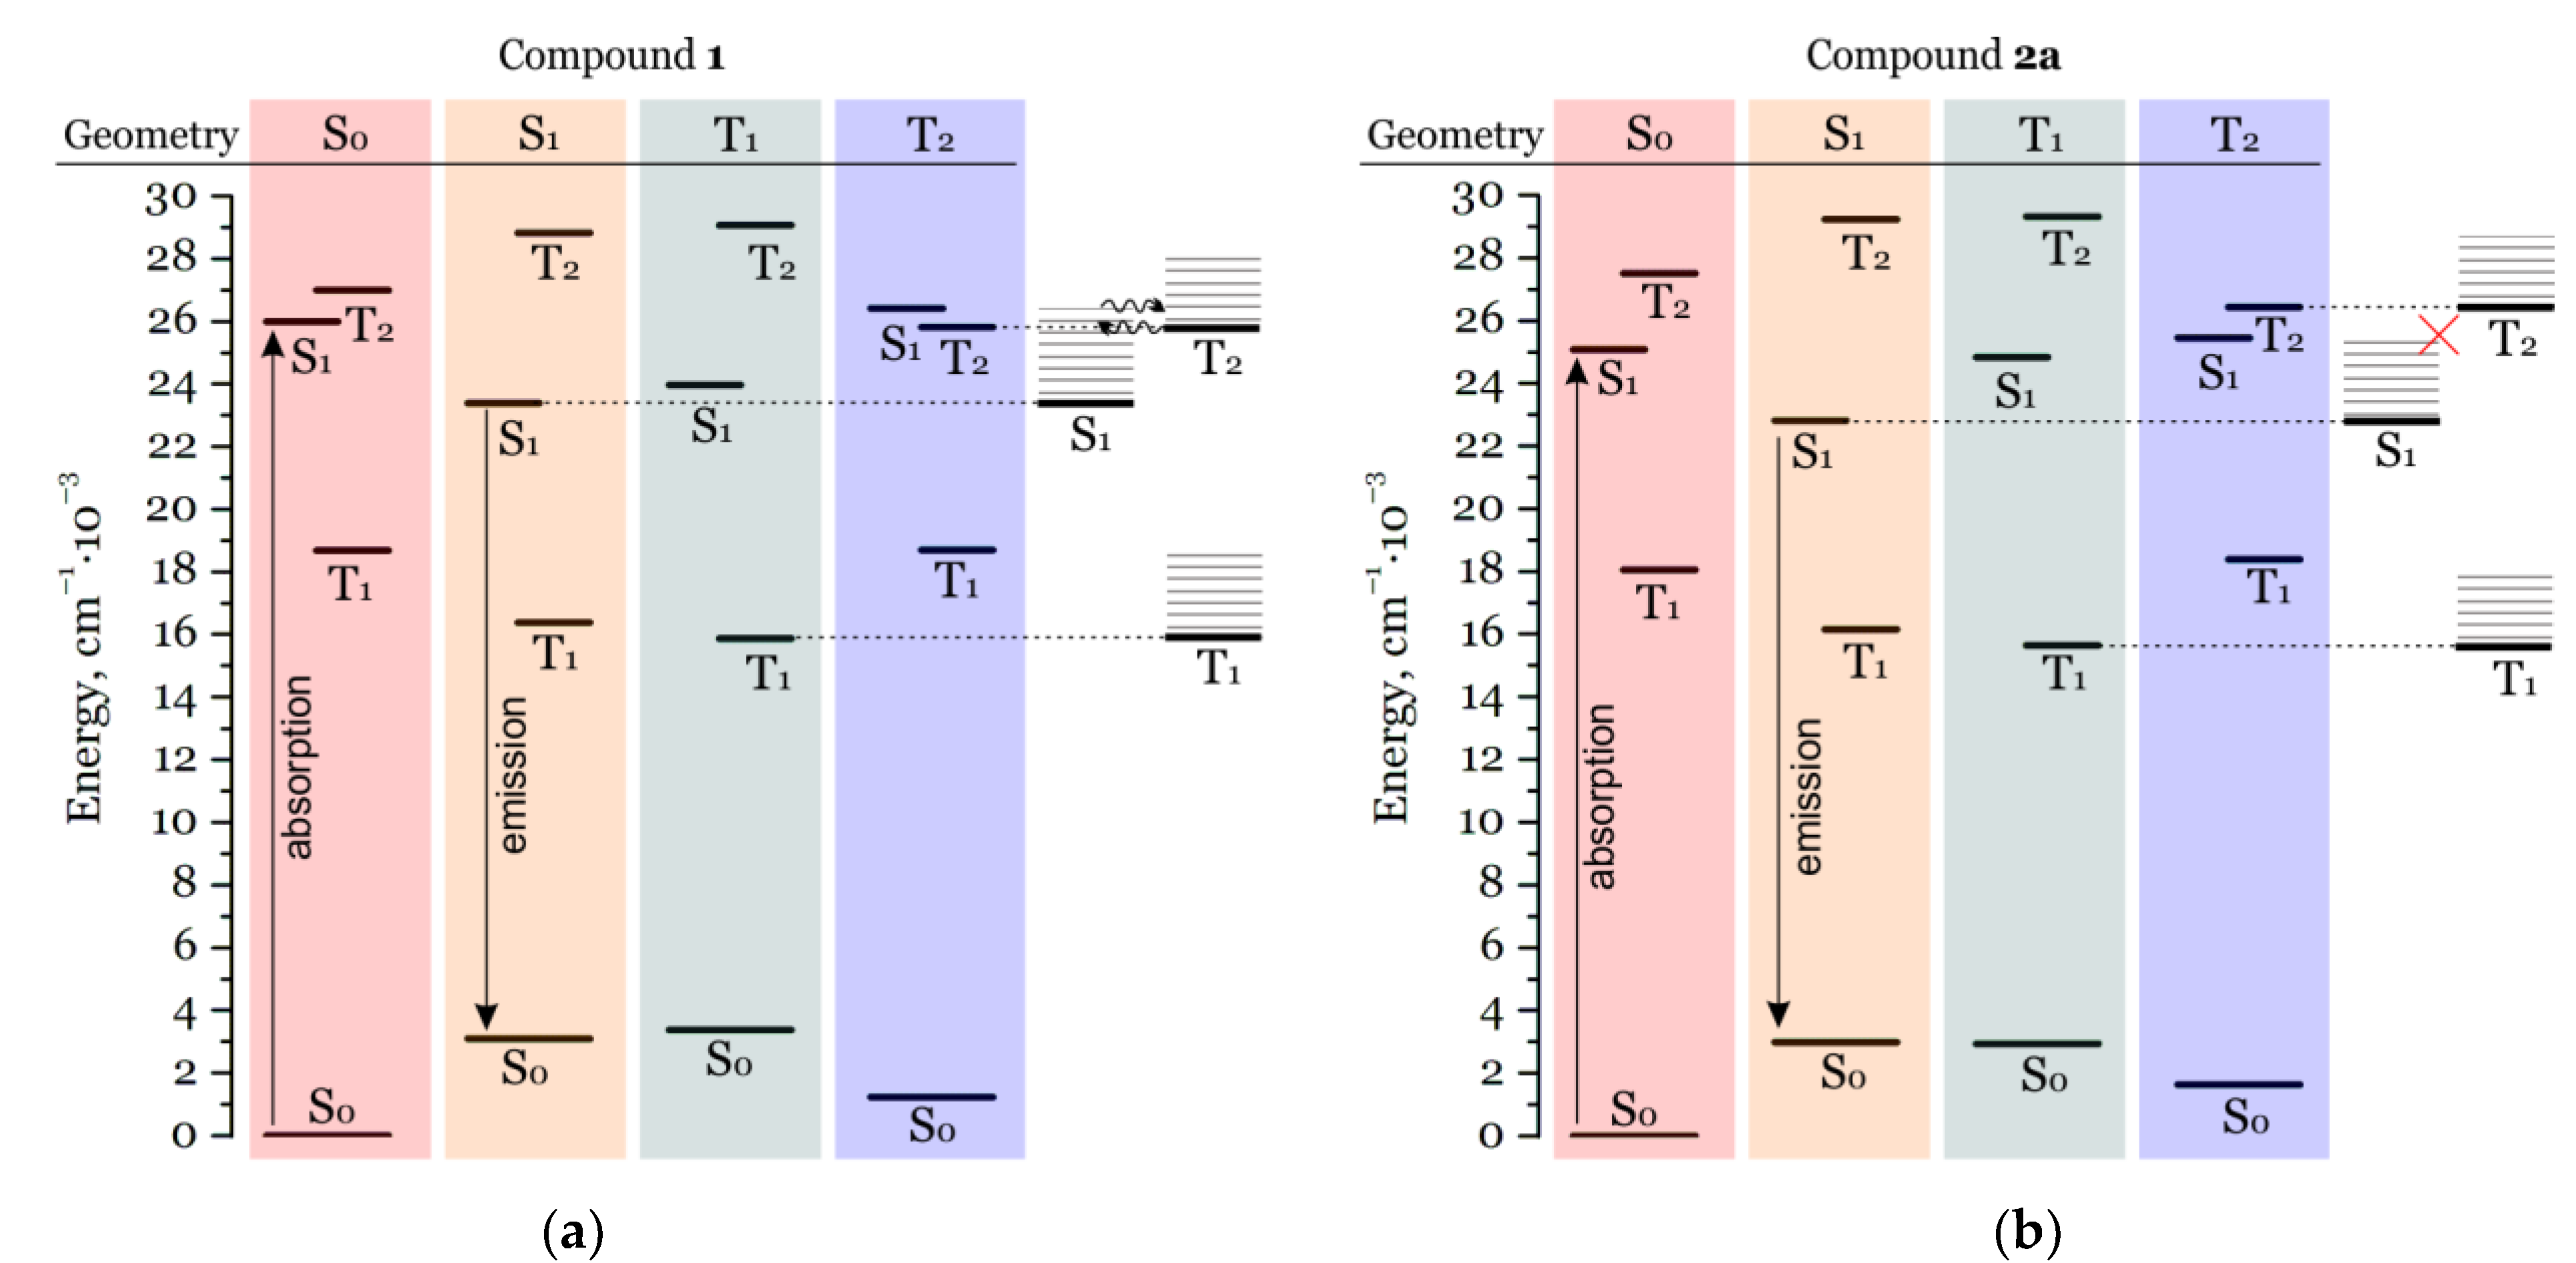
For complex 1, the T2 level locates energetically much closer to S1 than does T1. Vibrationally resolved calculated T2–S0 and S1–S0 emission spectra strongly overlap owing to the presence of a large number of vibrational sublevels of the S1 and T2 manifolds (Figure 5b). The comparison of energies at different geometry states (Figure 6) revealed that the potential energy surface (PES) for the S0 state has a local minimum at the T2 equilibrium geometry, while no imaginary frequencies were found for this geometry. As evidenced by the energy diagram, the PESs for the S1 and T2 states intersect: for the equilibrium T2-geometry, the energies for the S1 and T2 states show reverse order as compared to the equilibrium of the S1 geometry. Note also that the HOMO orbital for the relaxed T2 state differs from that for S1 state by a higher contribution of Au and Cl atoms (Figure S12). In addition, the SOC matrix elements between S1 and T2 at the T2 equilibrium geometry are almost twice as large as those at the S0 and S1 geometries (Table S8). Therefore, we assume that the vibronic SOC [33] between the S1 and T2 states is a process responsible for ISC in complex 1, and, consequently, for the minor microsecond-scale emission in the visible region. This process is much less favourable with respect to the S1–S0 radiation relaxation, thus resulting in the fluorescence as the major pathway. A portion of absorbed energy could release as a phosphorescence from the T1 state, but our calculations predict its manifestation in the infrared region. Thus, it is not detectable under the measurement conditions.
Complexes 2a and 2b exhibit a larger ΔE(S1−T2) compared to complex 1, and the vibrational sublevels for the S1 and T2 manifolds show almost null overlap. In addition, the potential energy surfaces for S1 and T2 do not intersect. This may be the reason why 2a and 2b do not show an afterglow signal. Figure 6 represents energy diagrams that summarize the different behaviours arising from the differences in the excited states of complexes 1 and 2a. For 2b, (Figure S13) the diagram is similar to that for 2a.

3. Materials and Methods

3.1. General

All manipulations for the syntheses were performed using the Schlenk technique and a glovebox. Solvents were purified using the standard technique and stored under an argon atmosphere. The 1,3-aminophosphine was synthesized as described recently [28]. Elemental analyses were performed on various MICRO cube instruments (Langenselbold, Germany) for C, H, N, and S elements. IR-spectra were recorded on a Fourier IR spectrometer FT-801 (Simex, Novosibirsk, Russia) in KBr pellets. 1H NMR spectra (500.13 MHz) and 31P NMR spectra (202.45 MHz) were obtained with a Bruker DRX-500 spectrometer (Madison, Wisconsin, USA) in dry CDCl3 at room temperature (RT); the solvent peak was used as an internal reference.
The diffuse reflectance UV-Vis spectra of the solid samples (Figure S14) were obtained with a Shimadzu UV-3101 spectrophotometer (Kyoto, Japan) at RT. Samples for the measurements were prepared by a thorough grinding of a mixture of the compounds under study (about 0.01 mol fraction) with BaSO4, which was also used as a standard. Spectral dependences of the diffuse reflectance were converted into spectra of a Kubelka-Munk function. Emission and excitation spectra of solids were recorded at RT on a Fluorolog 3 spectrometer (Horiba Jobin Yvon, Edison, NJ, USA) equipped with a cooled PC177CE-010 photon detection module (Horiba Jobin Yvon, Edison, NJ, USA) with a PMT R2658 photomultiplier (Horiba Jobin Yvon, Edison, NJ, USA). Excitation and emission spectra were corrected for source intensity (lamp and grating) and emission spectral response (detector and grating) by standard correction curves. For the measurements, powdered samples were placed between two nonfluorescent quartz plates. The emission decay curves were recorded on the same instrument using the TCSPC (time-correlated single photon counting) technique. A Horiba Nanoled laser diode (350 nm) was used as an excitation source. The curves were fitted by either one or two exponential decays; the fit yielded the emission lifetime values. Absolute PL quantum yields (QY) for the solids were recorded using the Quanta-φ device of Fluorolog 3. For the photostability experiment, solid sample 1 was constantly irradiated under Ar conditions with a full-range spectrum Xe lamp ushio uxl450s-0 (450 W; Horiba Jobin Yvon, Edison, NJ, USA) for 1 h.
The UV-Vis spectra of the solutions in 1 cm quartz cuvettes in an argon atmosphere were obtained with Agilent Cary 60 spectrometer (Santa Clara, California, USA). The emission and excitation spectra of the same solutions were recorded on an Agilent Cary Eclipse spectrometer.

3.2. Theoretical Calculations

The ground state geometries were optimized in a vacuum, without any constraints, at the DFT level using the PBE0 functional [34], def2-TZVP(-f) basis set, def2-ECP effective core potential (60 core electrons) for the Au atoms and D3(BJ) dispersion correction. The equilibrium geometries of the S1 (for 2a) and T2 states (for comparison between the geometries, see Figure S15) were optimized by TD(TDA)-PBE0-D3BJ/def2-TZVP(-f), and the T1 state was optimized by UPBE0-D3BJ/def2-TZVP(-f) in the gaseous state, without any constraints. The equilibrium geometry of the S1 state for 2b was optimized by TD-BHandHLYP-D3BJ rather than TD-PBE0-D3BJ, because the optimization with the PBE0 functional yielded a twisted structure (Figure S16), with an underestimated energy of fluorescence. Optimization at the TD-BHandHLYP-D3BJ/def2-TZVP(-f) level of theory provided more reliable geometry and emission energy. The Frank–Condon and emission energies for all complexes were then calculated at the TD(A)-PBE0/def2-TZVP(-f) level. Regular TD-DFT was used for the singlet states, and the Tamm–Dancoff approximation of TD-DFT was used for the triplet states due to triplet instability problems in TD-DFT [35]. For the acceleration of calculations resolution of identity for the Coulomb part (RI) and the chain of spheres for the Fock exchange (COSX), approximations were used with the corresponding auxiliary basis [36,37]. Correspondence to the minima of optimized geometries were verified by analytical harmonic vibrational frequency calculations for the ground states and T1 (UKS), and by numerical harmonic vibrational frequency calculations for the excited states.
The scalar-relativistic ZORA method was used with the SARC-ZORA-TZVP basis set for Au atoms to take into account relativistic effects in the photophysical properties; the ZORA-def2-TZVP basis set was used for the other atoms with SARC/J and AutoAux auxiliary basis sets for acceleration via the RIJCOSX algorithm. The quasi-degenerate perturbation theory was used for the calculation of spin-orbital coupling regarding the ZORA-TDA-DFT results [38]. The SOC integrals were calculated by the RI-SOMF(1X) method [39]. The calculations of SOC between states do not include vibronic coupling and non-adiabatic couplings. All geometry optimizations and TD(TDA)-DFT calculations were conducted using hte Orca 4.2.1 program. Molecular orbitals were visualized using ChemCraft 1.8.
Vibronically resolved fluorescence (from S1 state) and phosphorescence (from T1 and T2 states) spectra were calculated by the path integral approach implemented in the ESD subprogram of Orca 5.0.3. Low-energy normal modes were cut due to their anharmonicity (TCutFreq value is 100 cm−1). The line shape was set by VOIGT option, which is the mean product of the Gaussian and Lorentzian curves (Linew parameter is 20 cm−1 and Inlinew parameter is 100 cm−1).

3.3. Syntheses

3.3.1. Synthesis of PN

At 0 °C, a solution of Ph2PCl (0.594 mL, 3.31 mmol) in toluene (5 mL) was added dropwise to a solution of NH2-btd (0.500 g, 3.31 mmol) and Et3N (0.922 mL, 6.62 mmol) in toluene (5 mL). The resulting mixture was allowed to warm up to RT and stirred overnight. The precipitate of Et3N·HCl was removed by filtration and rinsed four times with 3 mL of toluene. The solutions were combined, and all volatiles were evaporated. The residue was purified by column chromatography (silica gel, ethyl acetate:hexane = 1:10), followed by recrystallization from diethyl ether. Yield 0.876 g (79%). Calc. for C18H14N3PS (335.36): C 64.5, H 4.2, N 12.5, S 9.6. Found C 64.4, H 4.4, N 12.1, S 9.8. 31P{H} NMR (C6D6, δ, ppm): 28.4 (s). 1H NMR (C6D6, δ, ppm): 7.45–7.42 (m, 4H), 7.19–7.03 (m, 5H, 1H from btd-H + solvent), 7.06–7.03 (m, 7H), 5.96 (d, 1H). IR-spectrum (KBr, cm−1): 3281 s, 3050 m, 3000 w, 1599 w, 1541 s, 1487 s, 1433 s, 1383 s, 1290 m, 1082 s, 1044 m, 1024 w, 905 s, 850 m, 816 m, 739 s, 696 s.

3.3.2. Synthesis of [Au(PN)Cl] (1)

A mixture of PN (25 mg, 0.0745 mmol) and (THT)AuCl (24 mg, 0.0745 mmol) was dissolved in CH3CN and was stirred at RT overnight to give a clear solution. The solvent was evaporated, and the oil residue was extracted by toluene in vacuum at 60 °C to opbtain a yellow crystalline product. Yield: 25 mg (74%). Calc. for C18H14AuClN3PS (567.78 g/mol): C 38.1, H 2.5, N 7.4, S 5.6. Found C 37.8, H 2.4, N 7.0, S 6.1. 31P{H} NMR (CDCl3, δ, ppm): 57.46 (s). 1H NMR (CDCl3, δ, ppm): 7.88–7.83 (m, 4H), 7.67–7.63 (m, 2H), 7.60–7.57 (m, 5H), 7.45 (dd, 1H, J1 = 9 Hz, 7.4 Hz), 7.13 (d, 1H, J = 7.3 Hz), 6.01 (d, 1H, J = 4.7 Hz). IR (cm−1): 3372 (m), 3045 (w), 2919 (w), 2850 (w), 2016 (w), 1993 (w), 1962 (w), 1940 (w), 1917 (w), 1890 (w), 1816 (w), 1728 (w), 1696 (w), 1642 (w), 1607 (w), 1545 (s), 1489 (m), 1436 (m), 1379 (s), 1298 (m), 1270 (w), 1180 (w), 1160 (w), 1109 (s), 1084 (s), 1043 (w), 1001 (w), 909 (s), 872 (m), 828 (w), 797 (w), 763 (w), 743 (s), 717 (w), 707 (w), 690 (s), 655 (w).

3.3.3. Synthesis of [Au(PCN)Cl] (2a)

A mixture of PCN (50 mg, 0.118 mmol) and (THT)AuCl (38 mg, 0.118 mmol) was dissolved in THF (5 mL). The yellowish solution was stirred at RT overnight and concentrated under vacuum. A portion of crystals suitable for single-crystal XRD analysis was formed after exposure of the solution at 2 °C for 1 day. The crystals were separated and washed with diethyl ether. The mother liquor was further concentrated to isolate an additional portion of the compound. The fine powder was separated and washed with diethyl ether. Total yield: 75 mg (97%). Calc. for AuC25H20N3PSCl (657.90 g/mol): C 45.6, H 3.1, N 6.4, S 4.9. Found C 46.1, H 3.2, N 6.2, S 5.1. 31P{H} NMR (CDCl3, δ, ppm): 44.4 (s). 1H NMR (CDCl3, δ, ppm): 7.76 (dd, 2H), 7.52 (t, 1H), 7.46–7.38 (m, 5H), 7.30 (t, 2H), 7.25 (d, 2H), 7.20–7.12 (m, 5H), 6.31 (p, 1H), 6.03 (t, 1H), 5.68 (dd, 1H). IR (cm−1): 3353 (m), 3056 (m), 2912 (m), 2853 (w), 1971 (w), 1901 (w), 1804 (w), 1606 (w), 1550 (s), 1494 (s), 1434 (s), 1408 (s), 1364 (w), 1298 (s), 1183 (m), 1124 (w), 1105 (s), 1079 (w), 1026 (w), 1000 (w), 916 (w), 900 (m), 853 (m), 830 (m), 796 (m), 777 (w), 735 (s), 694 (s), 632 (w)

3.3.4. Synthesis of [Au(PCN)Cl] (2b)

The compound is obtained by fast concentration of a solution of 2 in THF to give an oily sample. Subsequent exposure of the sample in a small amount of THF yielded a portion of crystals 2b. To obtain bulk 2b, a portion of the obtained crystals was sown on an oversaturated solution of the compound in THF. Calcd for AuC25H20N3PSCl (657.90 g/mol): C 45.6, H 3.1, N 6.4, S 4.9; found C 45.9, H 3.1, N 6.3, S 4.8. IR (cm−1): 3396 (m), 3067 (w), 3023 (w), 2903 (w), 1606 (w), 1552 (s), 1500 (s), 1436 (w), 1413 (m), 1368 (w), 1308 (m), 1198 (w), 1130 (w), 1104 (m), 1077 (w), 1030 (w), 1000 (w), 901 (m), 855 (w), 832 (w), 797 (w), 776 (w), 740 (s), 695 (s), 557 (m).

3.4. X-ray Data

Single-crystal XRD data for compounds 12 (Tables S9–S11) were collected at 150 K with a Bruker D8 Venture diffractometer (Madison, Wisconsin, USA) with a CMOS PHOTON III detector (Bruker, Madison, Wisconsin, USA) and IμS 3.0 microfocus source (MoKα radiation (λ = 0.71073 Å), collimating Montel mirrors; Incoatec GmbH, Geesthacht, Germany). The crystal structures were solved using the SHELXT [40] and were refined using the SHELXL [41] programs with OLEX2 GUI [42]. Atomic displacement parameters for non-hydrogen atoms were refined anisotropically. Hydrogen atoms were placed geometrically, with the exception of those in the amino groups, which were localized from the residual electron density map and refined with the restraining of the N–H bond (0.88 Å). The structures of 12 were deposited to the Cambridge Crystallographic Data Centre (CCDC) as a supplementary publication, No. 2217671-2217673.
Powder XRD data for the compounds (Figures S1–S3) were collected at RT with a Bruker D8 Advance diffractometer in Bragg–Brentano geometry with an energy discriminating Eyger XE T detector (CuKα radiation).

4. Conclusions

In summary, we synthesized Au(I) compounds 12 comprising closely related PN and PCN ligands. The latter comprise NH-btd moiety as a chromophore, and PPh2 moiety as a readily accessible unit for the metal coordination. The main difference between the ligands is that one of them (PN) contains a P–N bond, while in the other (PCN), the P and N atoms are separated by a methylene bridge (Scheme 1). Such differences alter the nature of the luminescence of the corresponding complexes: polymorphs 2a and 2b exclusively exhibit fluorescence, which is not typical of Au(I) compounds, while compound 1 reveals fluorescence as the major radiative pathway, and a minor contribution of the microsecond-scale component.
We interpreted the unusual fluorescent behaviour using quantum chemical TD(A)-DFT calculations. In the complexes, the frontier molecular orbitals, responsible for the S0–S1 and S0–T1 transitions, are located almost exclusively on the PN and PCN ligands, i.e., the transitions mainly have an intraligand nature. Owing to the overall small metal contribution to the orbitals, the SOC is small. In addition, the T1 state has much lower energy than does the S1 (by ca. 7000 cm−1) state, which further hinders the ISC from S1. It thus enables the latter state to decay in the form of fluorescence as a dominant radiative process. In the specific case of complex 1, the emission origin is not only limited to the prompt S1 decay, but also occurs with a mixing of singlet and triplet states, resulting in the presence of a minor microsecond-scale component. This behaviour is probably governed by a small contribution of (M+X)LCT, in the case of 1, which is absent in 2a and 2b. As a possible channel, the SOC between the S1 and T2 states can contribute to ISC, owing to rich vibronic structure of the corresponding singlet and triplet manifolds.

Supplementary Materials

The following supporting information can be downloaded at: https://www.mdpi.com/article/10.3390/molecules27238162/s1, Figures S1–S3: Simulated and experimental powder XRD patterns; Tables S1–S6: DFT calculation of Frank–Condon excitation processes; Figures S4 and S5: Frontier molecular orbitals of 12 in their S0 optimized geometry; Figure S6: UV-Vis, emission and excitation spectra of the solids; Figure S7: UV-Vis, emission, and excitation spectra of 2 in THF; Figures S8–S10: Emission decay kinetics for the compounds; Figure S11: Emission of the compounds at 77–300 K; Tables S7 and S8: Calculated values of selected spin-orbit coupling matrix elements for the complexes; Figure S12: Comparison of frontier orbitals of complex 1 in different equilibrium geometries; Figure S13: Representation of energy levels for different geometry states of the complexes; Figure S14: IR-spectra of the compounds; Figure S15: Comparison of equilibrium geometries of the complexes in different states; Figure S16. Overlaid geometries for S1 equilibrium state of 2b obtained by two different DFT methods. Table S9: Crystal data and structure refinement for the compounds; Table S10: Selected bond lengths for the structures; Table S11: Selected bond angles for the structures.

Author Contributions

Conceptualization, T.S.S.; funding acquisition, T.S.S.; investigation, R.M.K., A.A.R. and T.S.S.; supervision, S.N.K.; visualization, R.M.K. and T.S.S.; writing—original draft, R.M.K.; writing—review and editing, S.N.K. and T.S.S. All authors have read and agreed to the published version of the manuscript.

Funding

This research was funded by the Russian Science Foundation (project no. 21-73-10096). Powder XRD and luminescence kinetics studies were supported by the Ministry of Science and Higher Education of the Russian Federation (No. 121031700313-8 and No. 121031700321-3).

Institutional Review Board Statement

Not applicable.

Informed Consent Statement

Not applicable.

Data Availability Statement

Not applicable.

Acknowledgments

We are grateful to the Irkutsk Supercomputer Center of SB RAS for providing access to the HPC-cluster «Akademik V.M. Matrosov» (Irkutsk Supercomputer Center of SB RAS, Irkutsk: ISDCT SB RAS; http://hpc.icc.ru, accessed on 3 November 2022).

Conflicts of Interest

The authors declare no conflict of interest.

Sample Availability

Samples of compounds 12 are available from the authors.

References

  1. Tao, Y.; Wang, Y.; Hu, S.; Young, D.J.; Lu, C.; Li, H.-X.; Ren, Z.-G. A photoluminescent Au(I)/Ag(I)/PNN coordination complex for relatively rapid and reversible alcohol sensing. Dalton Trans. 2021, 50, 6773–6777. [Google Scholar] [CrossRef]
  2. He, X.; Yam, V.W.-W. Luminescent gold(I) complexes for chemosensing. Coord. Chem. Rev. 2011, 255, 2111–2123. [Google Scholar] [CrossRef]
  3. Cheng, S.; Chen, Z.; Yin, Y.; Sun, Y.; Liu, S. Progress in mechanochromic luminescence of gold(I) complexes. Chin. Chem. Lett. 2021, 32, 3718–3732. [Google Scholar] [CrossRef]
  4. Kinzhalov, M.A.; Grachova, E.V.; Luzyanin, K.V. Tuning the luminescence of transition metal complexes with acyclic diaminocarbene ligands. Inorg. Chem. Front. 2022, 9, 417–439. [Google Scholar] [CrossRef]
  5. Jin, M.; Ito, H. Solid-state luminescence of Au(I) complexes with external stimuli-responsive properties. J. Photochem. Photobiol. C 2022, 51, 100478. [Google Scholar] [CrossRef]
  6. Shafikov, M.Z.; Daniels, R.; Kozhevnikov, V.N. Unusually fast phosphorescence from Ir(III) complexes via dinuclear molecular design. J. Phys. Chem. Lett. 2019, 10, 7015–7024. [Google Scholar] [CrossRef]
  7. Petrovskii, S.K.; Paderina, A.V.; Sizova, A.A.; Baranov, A.Y.; Artem’ev, A.A.; Sizov, V.V.; Grachova, E.V. Luminescence behaviour of Au(I)–Cu(I) heterobimetallic coordination polymers based on alkynyl-tris(2-pyridyl)phosphine Au(I) complexes. Dalton Trans. 2020, 49, 13430–13439. [Google Scholar] [CrossRef] [PubMed]
  8. Au-Yeung, C.C.; Li, L.-K.; Tang, M.-C.; Lai, S.-L.; Cheung, W.-L.; Ng, M.; Chan, M.-Y.; Yam, V.W.-W. Molecular design of efficient yellow- to red-emissive alkynylgold(III) complexes for the realization of thermally activated delayed fluorescence (TADF) and their applications in solution-processed organic light-emitting devices. Chem. Sci. 2021, 12, 9516–9527. [Google Scholar] [CrossRef]
  9. Baranov, A.Y.; Slavova, S.O.; Berezin, A.S.; Petrovskii, S.K.; Samsonenko, D.G.; Bagryanskaya, I.Y.; Fedin, V.P.; Grachova, E.V.; Artem’ev, A.V. Controllable synthesis and luminescence behavior of tetrahedral Au@Cu4 and Au@Ag4 clusters supported by tris(2-pyridyl)phosphine. Inorg. Chem. 2022, 61, 10925–10933. [Google Scholar] [CrossRef]
  10. Shakirova, J.R.; Grachova, E.V.; Gurzhiy, V.V.; Koshevoy, I.O.; Melnikov, A.S.; Sizova, O.V.; Tunik, S.P.; Laguna, A. Luminescent heterometallic gold–copper alkynyl complexes stabilized by tridentate phosphine. Dalton Trans. 2012, 41, 2941–2949. [Google Scholar] [CrossRef]
  11. Feuerstein, W.; Holzer, C.; Gui, X.; Neumeier, L.; Klopper, W.; Breher, F. Synthesis of new donor-substituted biphenyls: Pre-ligands for highly luminescent (C^C^D) gold(III) pincer complexes. Chem. Eur. J. 2020, 26, 17156–17164. [Google Scholar] [CrossRef]
  12. Moitra, T.; Karak, P.; Chakraborty, S.; Ruud, K.; Chakrabarti, S. Behind the scenes of spin-forbidden decay pathways in transition metal complexes. Phys. Chem. Chem. Phys. 2021, 23, 59–81. [Google Scholar] [CrossRef]
  13. Artem’ev, A.V.; Demyanov, Y.V.; Rakhmanova, M.I.; Bagryanskaya, I.Y. Pyridylarsine-based Cu(I) complexes showing TADF mixed with fast phosphorescence: A speeding-up emission rate using arsine ligands. Dalton Trans. 2022, 51, 1048–1055. [Google Scholar] [CrossRef]
  14. Demyanov, Y.V.; Sadykov, E.H.; Rakhmanova, M.I.; Novikov, A.S.; Bagryanskaya, I.Y.; Artem’ev, A.V. Tris(2-pyridyl)arsine as a new platform for design of luminescent Cu(I) and Ag(I) complexes. Molecules 2022, 27, 6059. [Google Scholar] [CrossRef]
  15. Mońka, M.; Serdiuk, I.E.; Kozakiewicz, K.; Hoffman, E.; Szumilas, J.; Kubicki, A.; Park, S.Y.; Bojarski, P. Understanding the internal heavy-atom effect on thermally activated delayed fluorescence: Application of Arrhenius and Marcus theories for spin–orbit coupling analysis. J. Mater. Chem. C 2022, 10, 7925–7934. [Google Scholar] [CrossRef]
  16. Tong, G.S.M.; Chow, P.K.; Che, C.-M. Where is the heavy-atom effect? Role of the central ligand in tetragold(I) ethynyl complexes. Angew. Chem. Int. Ed. 2010, 49, 9206–9209. [Google Scholar] [CrossRef]
  17. Mihaly, J.J.; Stewart, D.J.; Grusenmeyer, T.A.; Phillips, A.T.; Haley, J.E.; Zeller, M.; Gray, T.G. Photophysical properties of organogold(I) complexes bearing a benzothiazole-2,7-fluorenyl moiety: Selection of ancillary ligand influences white light emission. Dalton Trans. 2019, 48, 15917–15927. [Google Scholar] [CrossRef]
  18. Abramova, E.O.; Paderina, A.V.; Slavova, S.O.; Kostenko, E.A.; Eliseenkov, E.V.; Petrovskii, S.K.; Gitlina, A.Y.; Boyarskiy, V.P.; Grachova, E.V. Just add the gold: Aggregation-induced-emission properties of alkynylphosphinegold(I) complexes functionalized with phenylene–terpyridine subunits. Inorg. Chem. 2021, 60, 18715–18725. [Google Scholar] [CrossRef] [PubMed]
  19. Deng, D.; Suo, B.; Zou, W. New Light on an Old Story: Breaking Kasha’s rule in phosphorescence mechanism of organic boron compounds and molecule design. Int. J. Mol. Sci. 2022, 23, 876. [Google Scholar] [CrossRef]
  20. Shekhovtsov, N.A.; Kokina, T.E.; Vinogradova, K.A.; Panarin, A.Y.; Rakhmanova, M.I.; Naumov, D.Y.; Pervukhina, N.V.; Nikolaenkova, E.B.; Krivopalov, V.P.; Czerwieniec, R.; et al. Near-infrared emitting copper(I) complexes with a pyrazolylpyrimidine ligand: Exploring relaxation pathways. Dalton Trans. 2022, 51, 2898–2911. [Google Scholar] [CrossRef]
  21. Chan, K.T.; Tong, G.S.M.; To, W.-P.; Yang, C.; Du, L.; Phillips, D.L.; Che, C.-M. The interplay between fluorescence and phosphorescence with luminescent gold(I) and gold(III) complexes bearing heterocyclic arylacetylide ligands. Chem. Sci. 2017, 8, 2352–2364. [Google Scholar] [CrossRef] [PubMed] [Green Version]
  22. Moitra, T.; Alam, M.M.; Chakrabarti, S. Intersystem crossing rate dependent dual emission and phosphorescence from cyclometalated platinum complexes: A second order cumulant expansion based approach. Phys. Chem. Chem. Phys. 2018, 20, 23244–23251. [Google Scholar] [CrossRef] [PubMed]
  23. Pinto, A.; Echeverri, M.; Gómez-Lor, B.; Rodríguez, L. How to achieve near unity fluorescence quantum yields on gold(I) benzothiadiazole-based derivatives. Dyes Pigm. 2022, 202, 110308. [Google Scholar] [CrossRef]
  24. Sukhikh, T.S.; Ogienko, D.S.; Bashirov, D.A.; Konchenko, S.N. Luminescent complexes of 2,1,3-benzothiadiazole derivatives. Russ. Chem. Bull. 2019, 68, 651–661. [Google Scholar] [CrossRef]
  25. Sukhikh, T.S.; Khisamov, R.M.; Bashirov, D.A.; Komarov, V.Y.; Molokeev, M.S.; Ryadun, A.A.; Benassi, E.; Konchenko, S.N. Tuning of the coordination and emission properties of 4-amino-2,1,3-benzothiadiazole by introduction of diphenylphosphine group. Cryst. Growth Des. 2020, 20, 5796–5807. [Google Scholar] [CrossRef]
  26. Pylova, E.K.; Khisamov, R.M.; Bashirov, D.A.; Sukhikh, T.S.; Konchenko, S.N. The effect of halides and coordination mode of 4-amino-2,1,3-benzothiadiazole on the luminescence properties of its Zn complexes. CrystEngComm 2022. accepted manuscript. [Google Scholar] [CrossRef]
  27. Ceriani, C.; Corsini, F.; Mattioli, G.; Mattiello, S.; Testa, D.; Po, R.; Botta, C.; Griffini, G.; Beverina, L. Sustainable by design, large Stokes shift benzothiadiazole derivatives for efficient luminescent solar concentrators. J. Mater. Chem. C 2021, 9, 14815–14826. [Google Scholar] [CrossRef]
  28. Khisamov, R.M.; Ryadun, A.A.; Konchenko, S.N.; Sukhikh, T.S. Molecular environment effects that modulate the photophysical properties of novel 1,3-phosphinoamines based on 2,1,3-benzothiadiazole. Molecules 2022, 27, 3857. [Google Scholar] [CrossRef]
  29. Patrizi, B.; Iagatti, A.; Abbondanza, L.; Bussotti, L.; Zanardi, S.; Salvalaggio, M.; Fusco, R.; Foggi, P. Ultrafast intramolecular and solvation dynamics in 4,7-bis (4,5-dibutylbenzo[1,2-b:4,3-b′]bisthiophene[1,2-b:4,3-b′]bisthiophen-2-yl)-2,1,3-benzothiadiazole. J. Phys. Chem. C 2019, 123, 5840–5852. [Google Scholar] [CrossRef]
  30. Pritchina, E.A.; Gritsan, N.P.; Rakitin, O.A.; Zibarev, A.V. 2,1,3-Benzochalcogenadiazoles: Regularities and peculiarities over a whole chalcogen pentad O, S, Se, Te and Po. Targets Heterocycl. Syst. 2019, 23, 143–154. [Google Scholar] [CrossRef]
  31. Plyuta, N.; Cauchy, T.; Hauser, A.; Lloret, F.; Julve, M.; Avarvari, N. Zinc(II) and copper(II) complexes with benzothiadiazole Schiff-base ligands. Polyhedron 2022, 224, 115994. [Google Scholar] [CrossRef]
  32. Shafikov, M.Z.; Kozhevnikov, D.N.; Bodensteiner, M.; Brandl, F.; Czerwieniec, R. Modulation of intersystem crossing rate by minor ligand modifications in cyclometalated platinum(II) complexes. Inorg. Chem. 2016, 55, 7457–7466. [Google Scholar] [CrossRef] [PubMed]
  33. Rodriguez-Serrano, A.; Rai-Constapel, V.; Daza, M.C.; Doerr, M.; Marian, C.M. Internal heavy atom effects in phenothiazinium dyes: Enhancement of intersystem crossing via vibronic spin–orbit coupling. Phys. Chem. Chem. Phys. 2015, 17, 11350–11358. [Google Scholar] [CrossRef] [PubMed] [Green Version]
  34. Perdew, J.P.; Burke, K.; Ernzerhof, M. Generalized gradient approximation made simple. Phys. Rev. Lett. 1996, 77, 3865–3868. [Google Scholar] [CrossRef] [Green Version]
  35. Peach, M.J.G.; Tozer, D.J. Overcoming low orbital overlap and triplet instability problems in TDDFT. J. Phys. Chem. A 2012, 116, 9783–9789. [Google Scholar] [CrossRef]
  36. Izsák, R.; Neese, F. An overlap fitted chain of spheres exchange method. J. Chem. Phys. 2011, 135, 144105. [Google Scholar] [CrossRef]
  37. Izsák, R.; Neese, F.; Klopper, W. Robust fitting techniques in the chain of spheres approximation to the Fock exchange: The role of the complementary space. J. Chem. Phys. 2013, 139, 094111. [Google Scholar] [CrossRef]
  38. de Souza, B.; Neese, F.; Izsák, R. On the theoretical prediction of fluorescence rates from first principles using the path integral approach. J. Chem. Phys. 2018, 148, 034104. [Google Scholar] [CrossRef]
  39. Neese, F. Efficient and accurate approximations to the molecular spin-orbit coupling operator and their use in molecular g-tensor calculations. J. Chem. Phys. 2005, 122, 034107. [Google Scholar] [CrossRef]
  40. Sheldrick, G.M. SHELXT—Integrated space-group and crystal-structure determination. Acta Crystallogr. Sect. A 2015, 71, 3–8. [Google Scholar] [CrossRef]
  41. Sheldrick, G.M. Crystal structure refinement with SHELXL. Acta Crystallogr. Sect. C 2015, 71, 3–8. [Google Scholar] [CrossRef] [PubMed] [Green Version]
  42. Dolomanov, O.V.; Bourhis, L.J.; Gildea, R.J.; Howard, J.A.K.; Puschmann, H. OLEX2: A complete structure solution, refinement and analysis program. J. Appl. Crystallogr. 2009, 42, 339–341. [Google Scholar] [CrossRef]
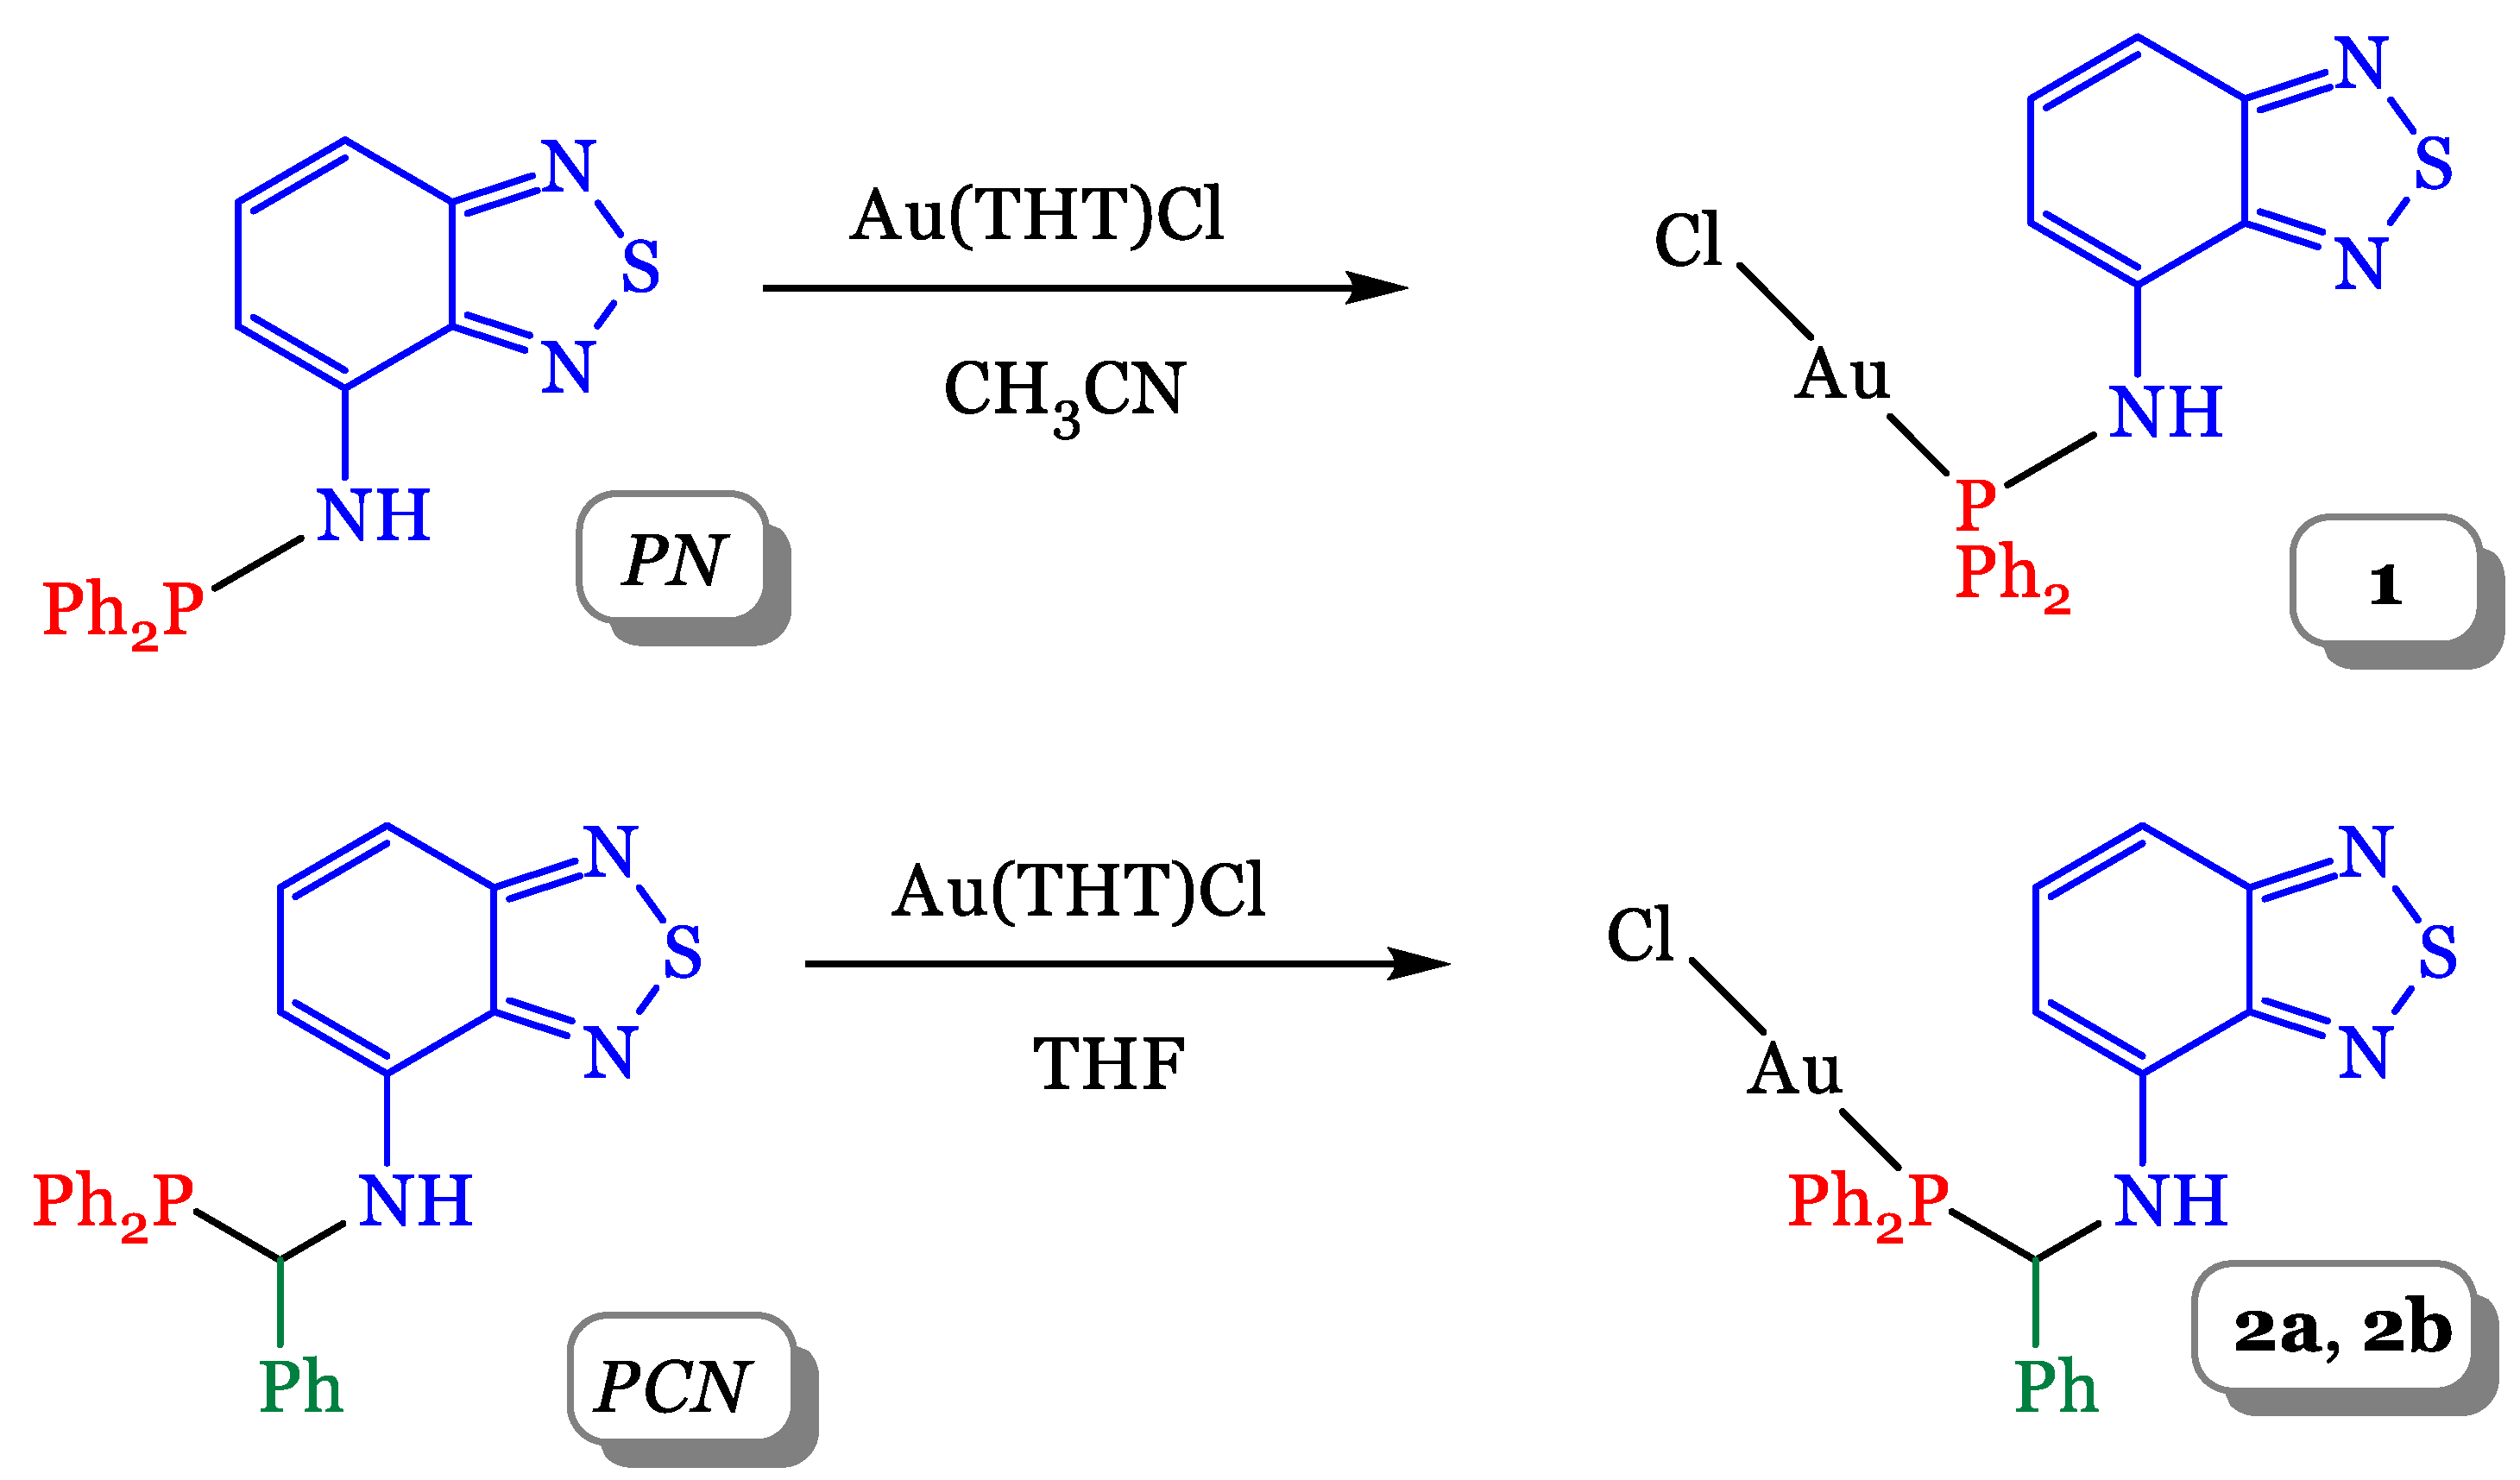
Scheme 1. Synthesis of compounds 1, 2a, and 2b.
Molecules 27 08162 sch001
Figure 1. Crystal structures of compounds 1 (a), 2a, (b) and 2b, (c). Hydrogen atoms, except those belonging to the NH groups, are omitted. {Au–P–C–N} torsion angles are highlighted with transparent blue triangles.
Molecules 27 08162 g001
Figure 2. (a) Gibbs energy scans of {AuPPh2Cl} moiety rotation around the P–C bond for the molecule [Au(PCN)Cl]. (b) Schematic representation of the corresponding conformers 2a and 2b.
Molecules 27 08162 g002
Figure 3. (a) Experimental UV-Vis spectra of solid samples 12 mixed with BaSO4 in the form of Kubelka-Munk functions (lines) and the calculated vertical S0–Sn transitions and their oscillator strength (TD-PBE0/def2-TZVP(-f)) (vertical bars). (b) The corresponding experimental normalized photoluminescence spectra (excitation wavelength 350 nm for 1 and 400 nm for 2a and 2b).
Molecules 27 08162 g003
Figure 4. Frontier orbitals for compounds 1 (a), 2a (b), and 2b (c) at their S0 equilibrium geometries (isovalue = 0.03).
Molecules 27 08162 g004
Figure 5. (a) Experimental normalized steady-state and delayed (after 300 μs) emission spectra of solid sample 1 (excitation wavelength 350 nm). (b) Experimental steady-state emission spectrum of 1 (dashed line) and the corresponding calculated vibrationally resolved emission spectra (solid lines) for the transitions from the triplet (T1 and T2) and singlet (S1) states. Vertical bars indicate the corresponding TD-DFT-computed emission energies of the transitions.
Molecules 27 08162 g005
Figure 6. Representation of energy levels for different geometry states (So, S1, T1, and T2) of compounds 1 (a) and 2a,b regarding the example of 2a (b) in the energy range from 0 to 30 × 103 cm−1.
Molecules 27 08162 g006
Table 1. Experimental absorption and emission maxima (λAbs and λEm), calculated energies of vertical (S0→S1) and emission (S1→S0, T1→S0 and T2→S0) transitions (TD(A)-PBE0/def2-TZVP(-f)), experimental emission lifetimes (τ), and absolute quantum yield of the emission (QY; at the excitation by 350 nm) for the compounds.
CompoundλAbs, nmE(S0→S1), nmλEm, nmE(S1→S0), nmE(T1→S0), nmE(T2→S0), nmτ, μsτ, nsQY, %
1310, 3803844704927984071001034
2a310, 360–500 (br.)3995255047854041530
2b310, 360–500 (br.)4105355128334039, 1933
Table 2. Calculated characteristics for vertical S0–Sn (n = 1–3) transitions for compounds 12.
12a2b
nλ, nmfElectronic States *λ, nmfElectronic States *λ, nmfElectronic States *
13840.093H→L3990.099H→L4100.093H→L
23120.008H→L + 13220.002H→L + 13090.013H→L + 1
33060.004H–1→L3000.015H→L + 22970.005H→L + 2
*—the contribution of all listed orbital transitions is more than 0.97.
Publisher’s Note: MDPI stays neutral with regard to jurisdictional claims in published maps and institutional affiliations.