
Triplet Emitting C^N^C Cyclometalated Dibenzo[c,h]Acridine Pt(II) Complexes

 , , ,
, , , 
Abstract

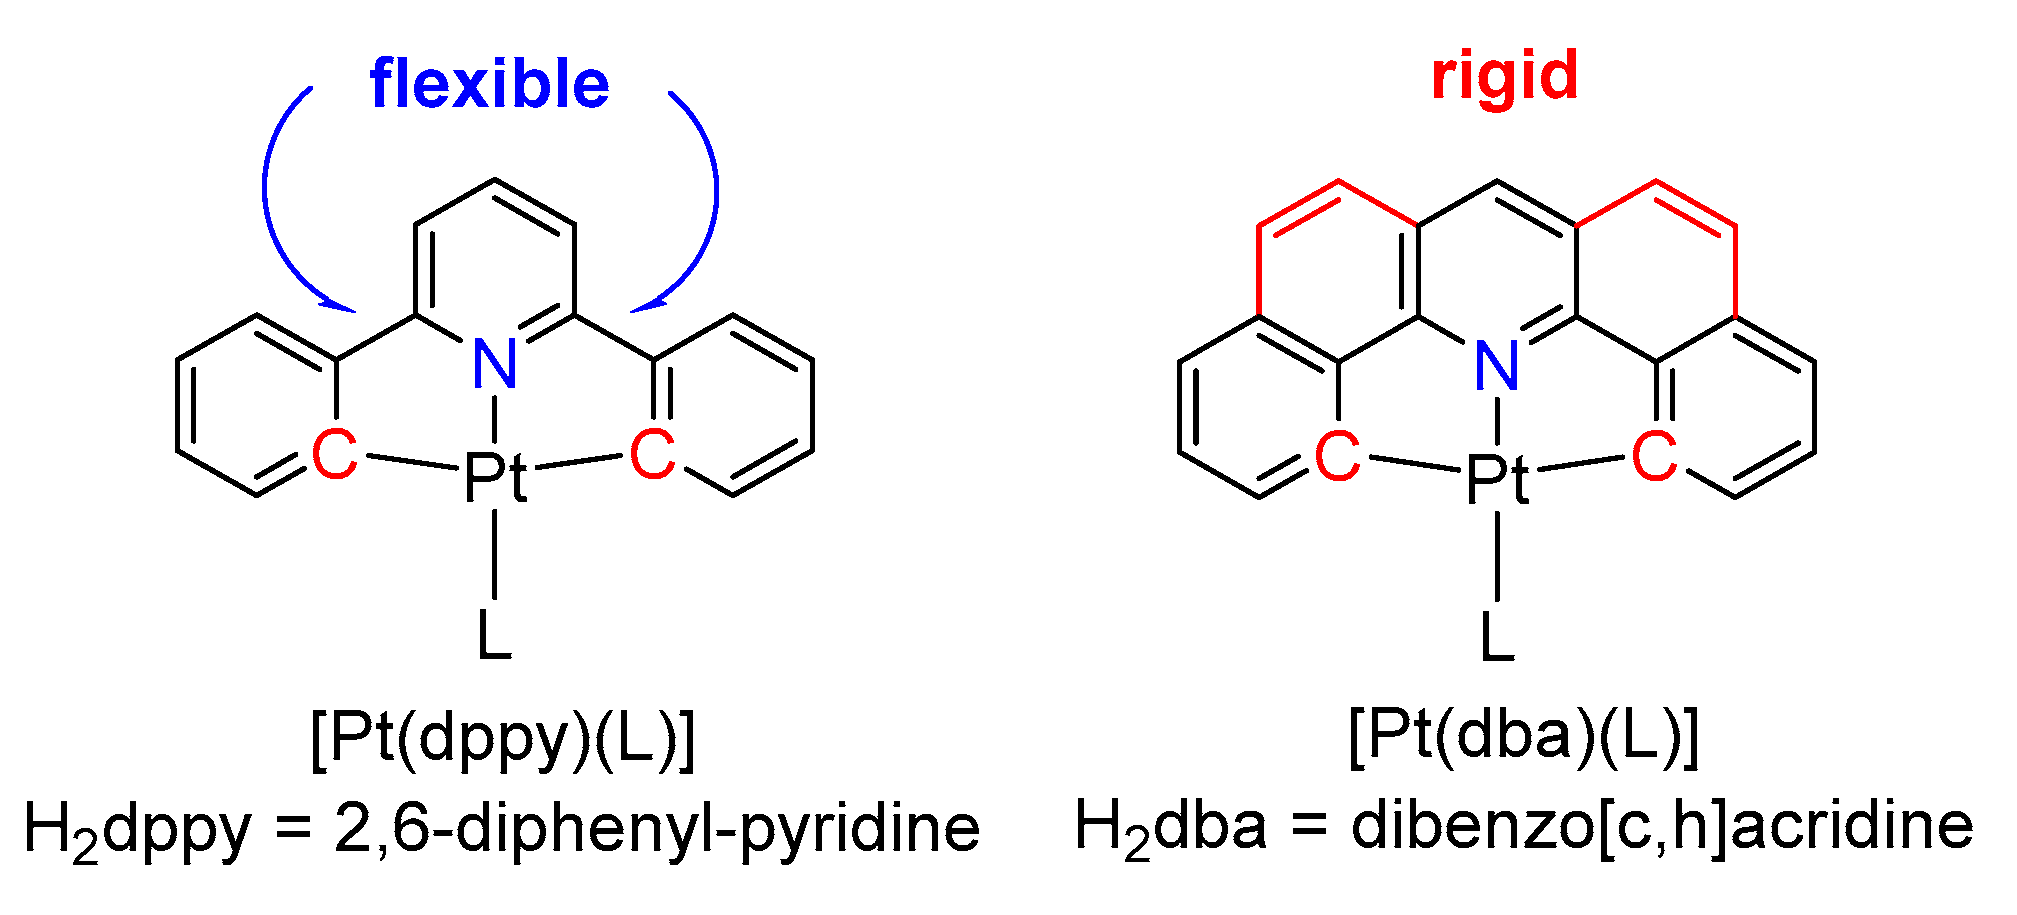
1. Introduction
2. Results and Discussion
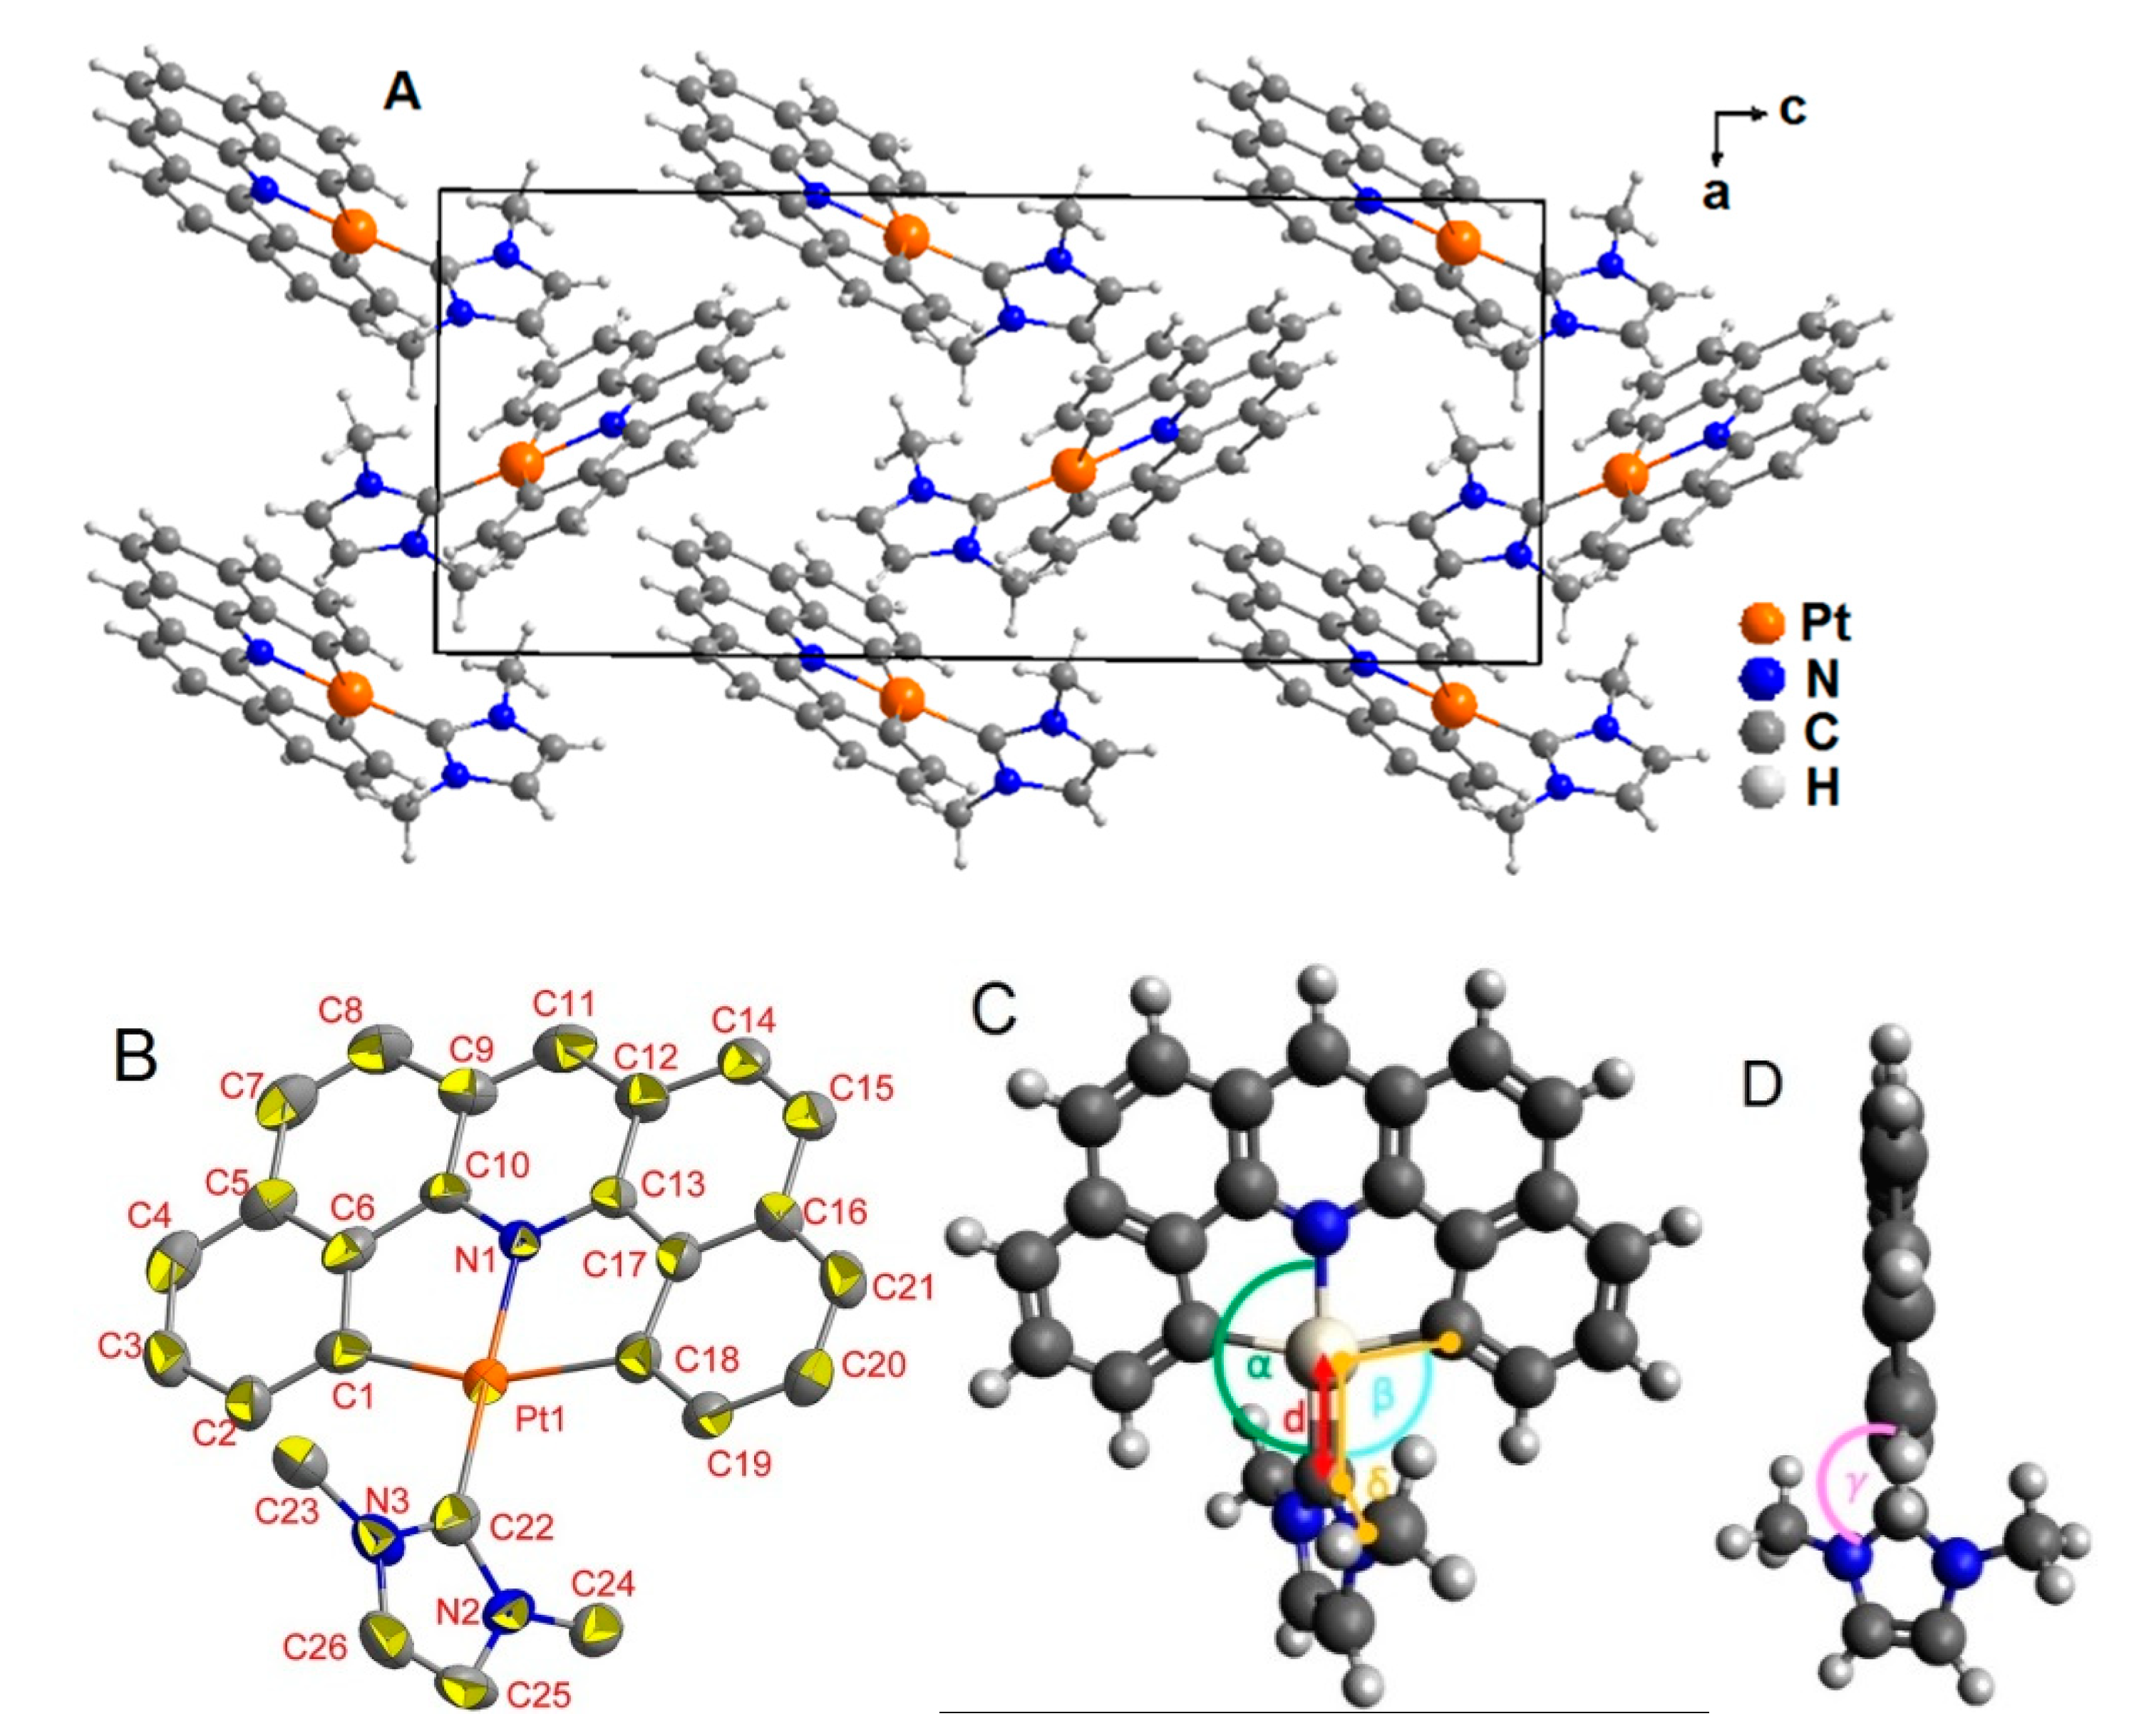
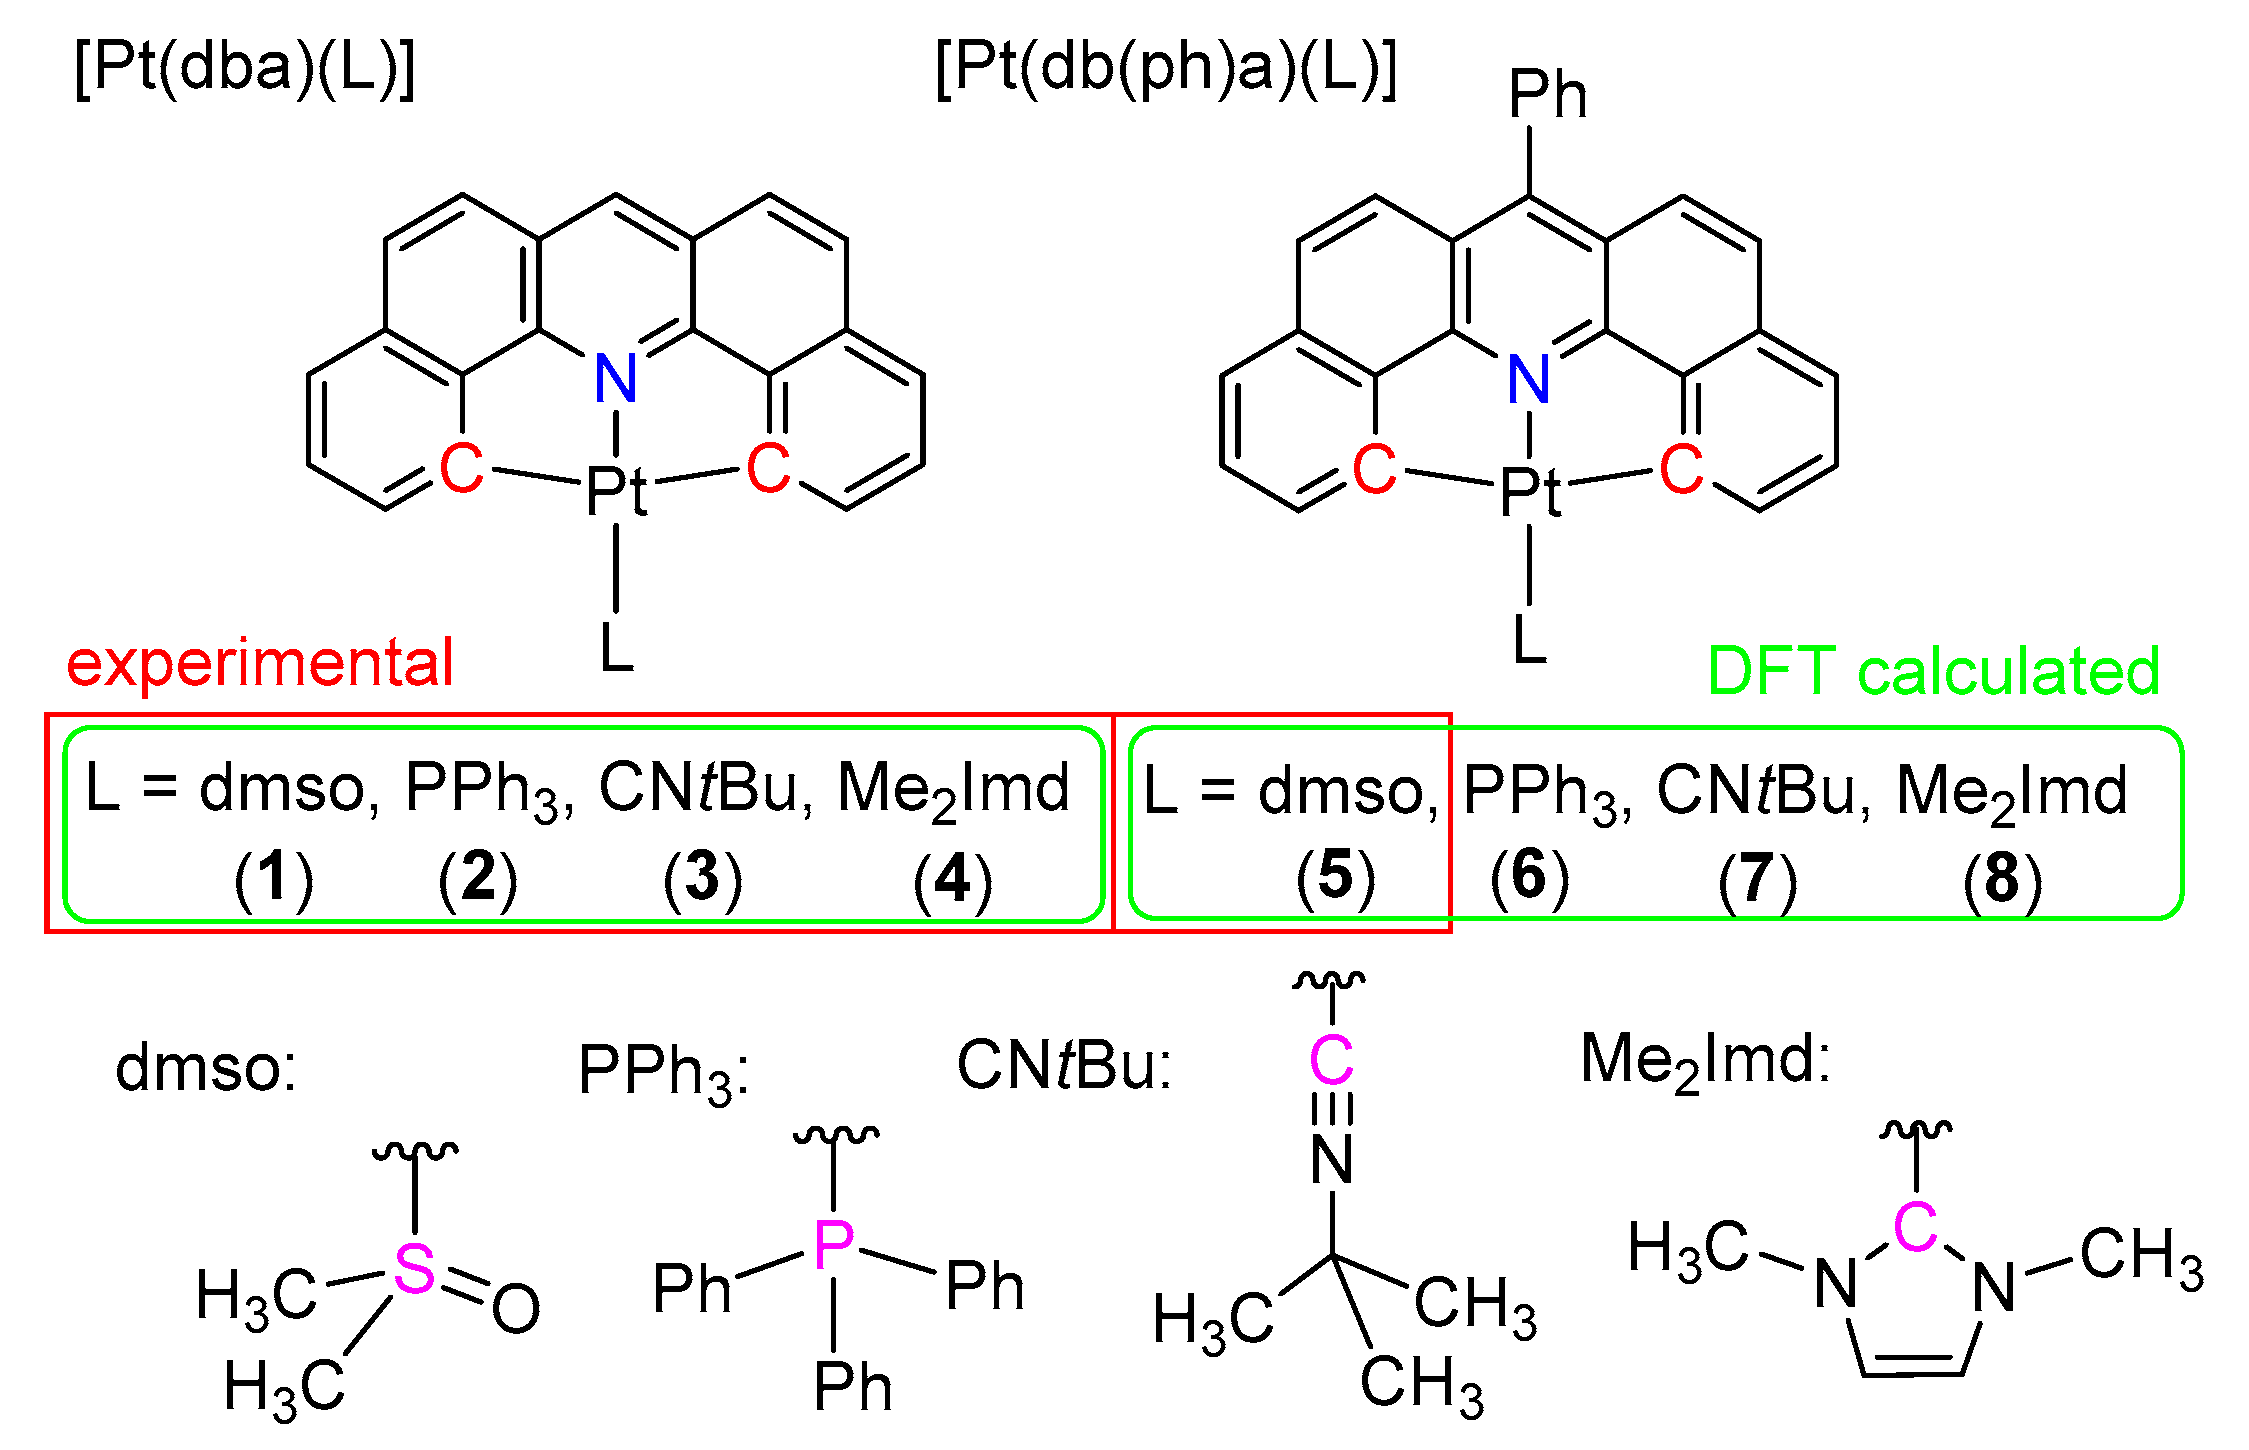
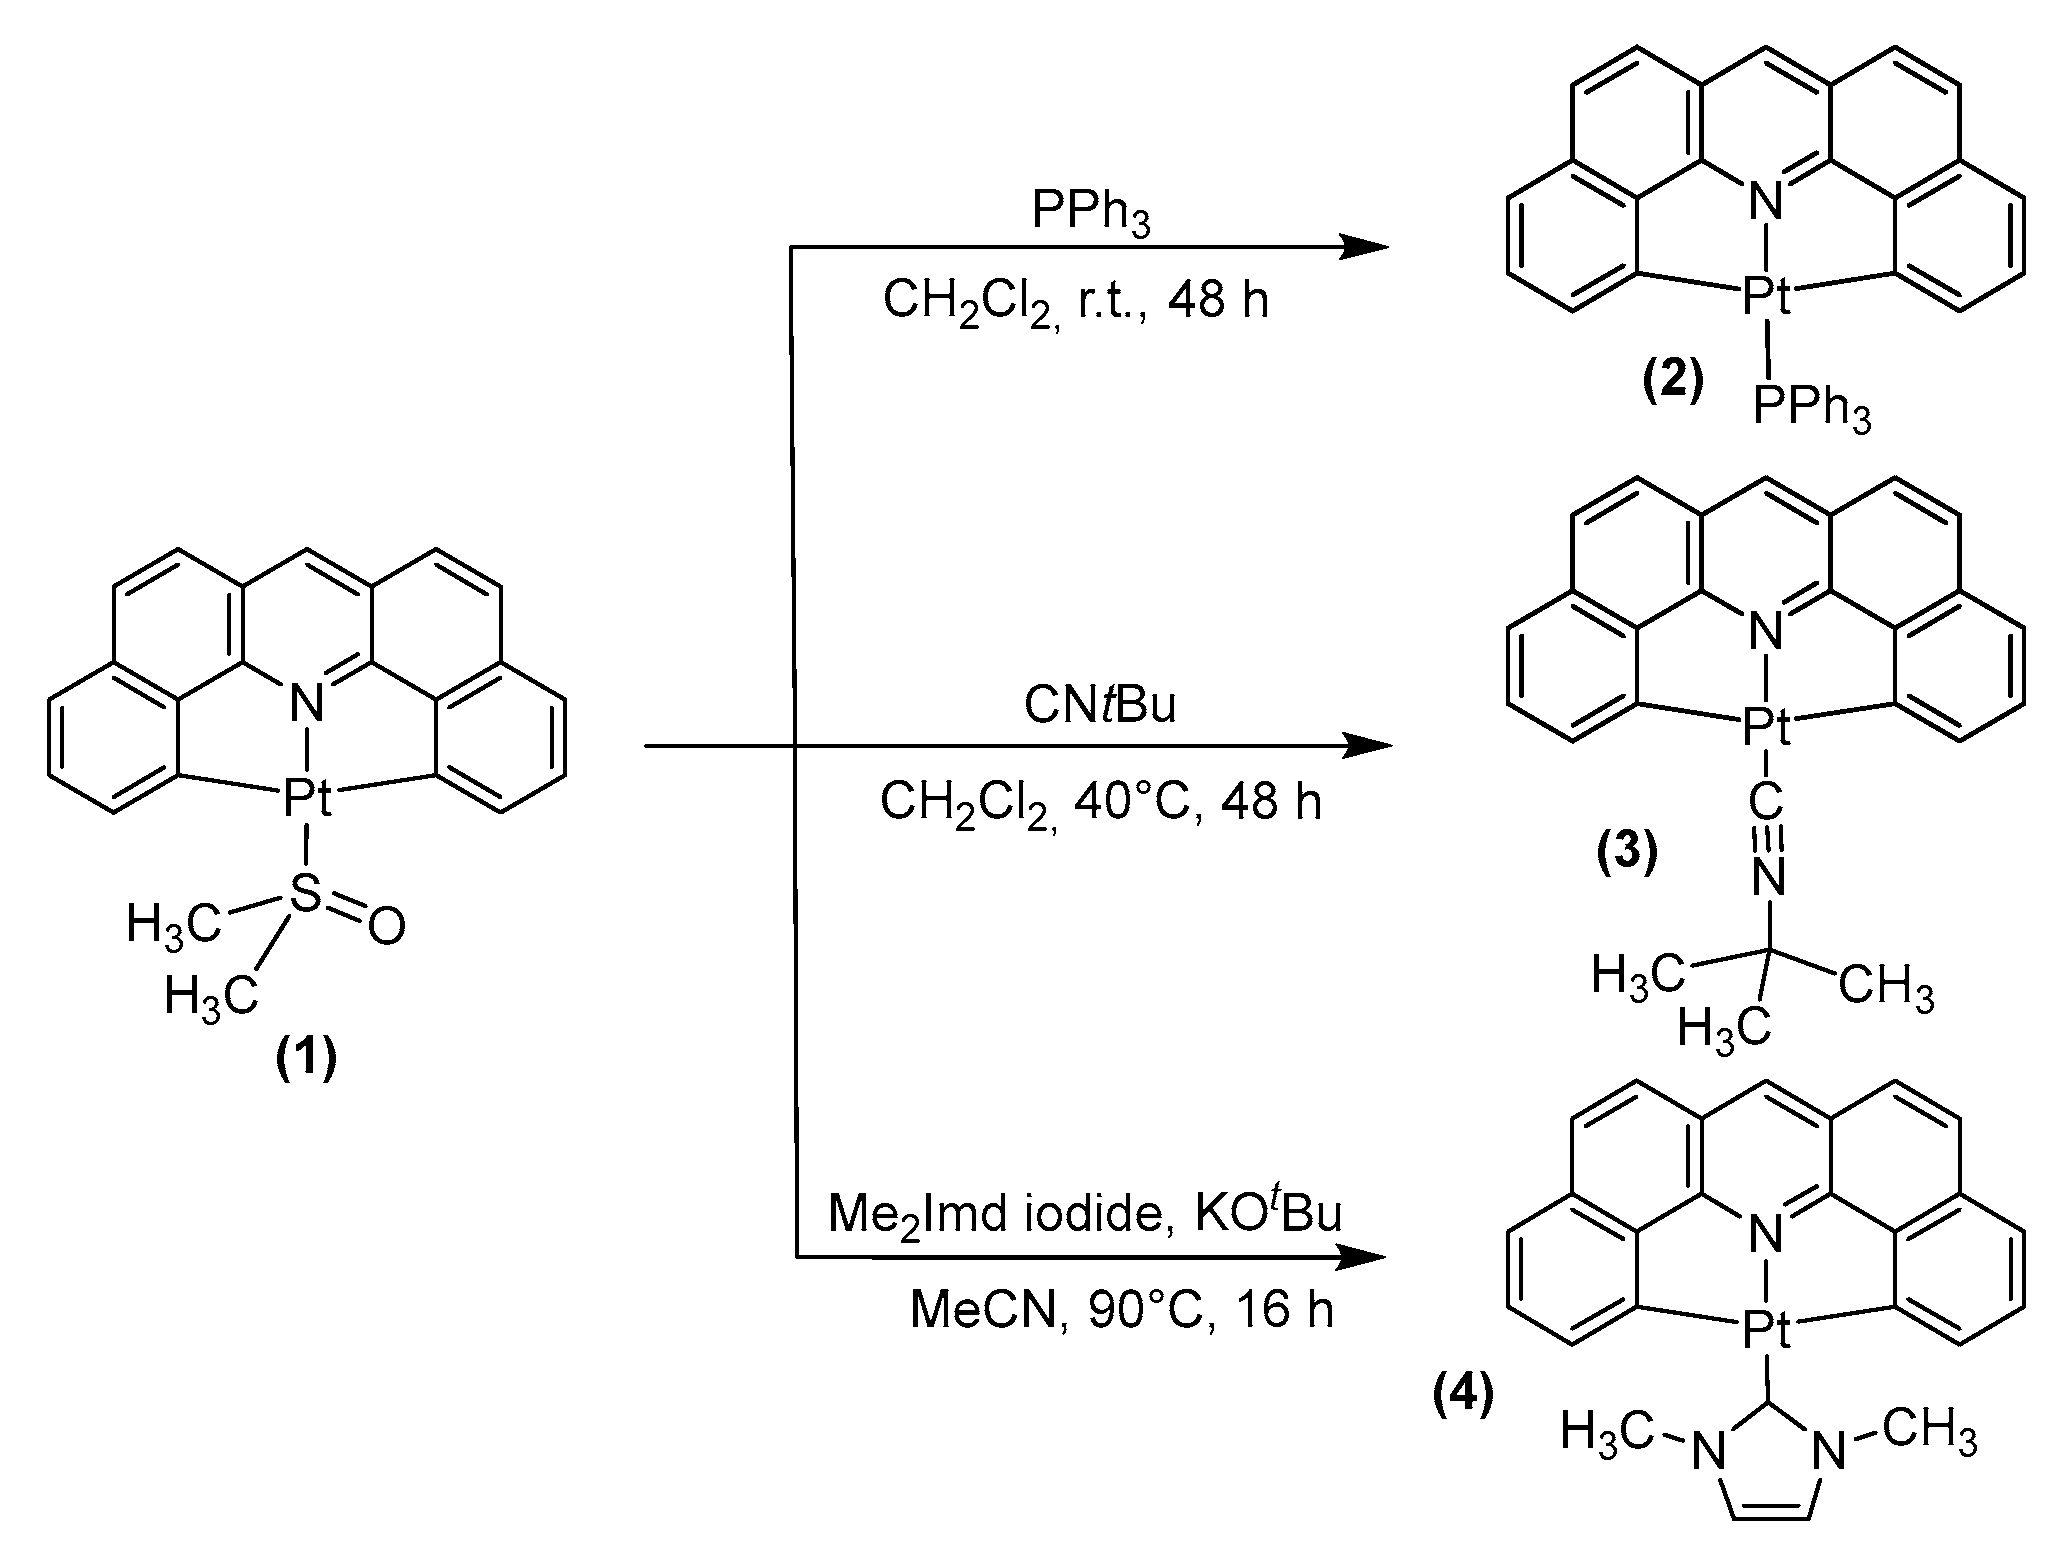
2.1. Synthesis, Analytical Characterization and Molecular Structures
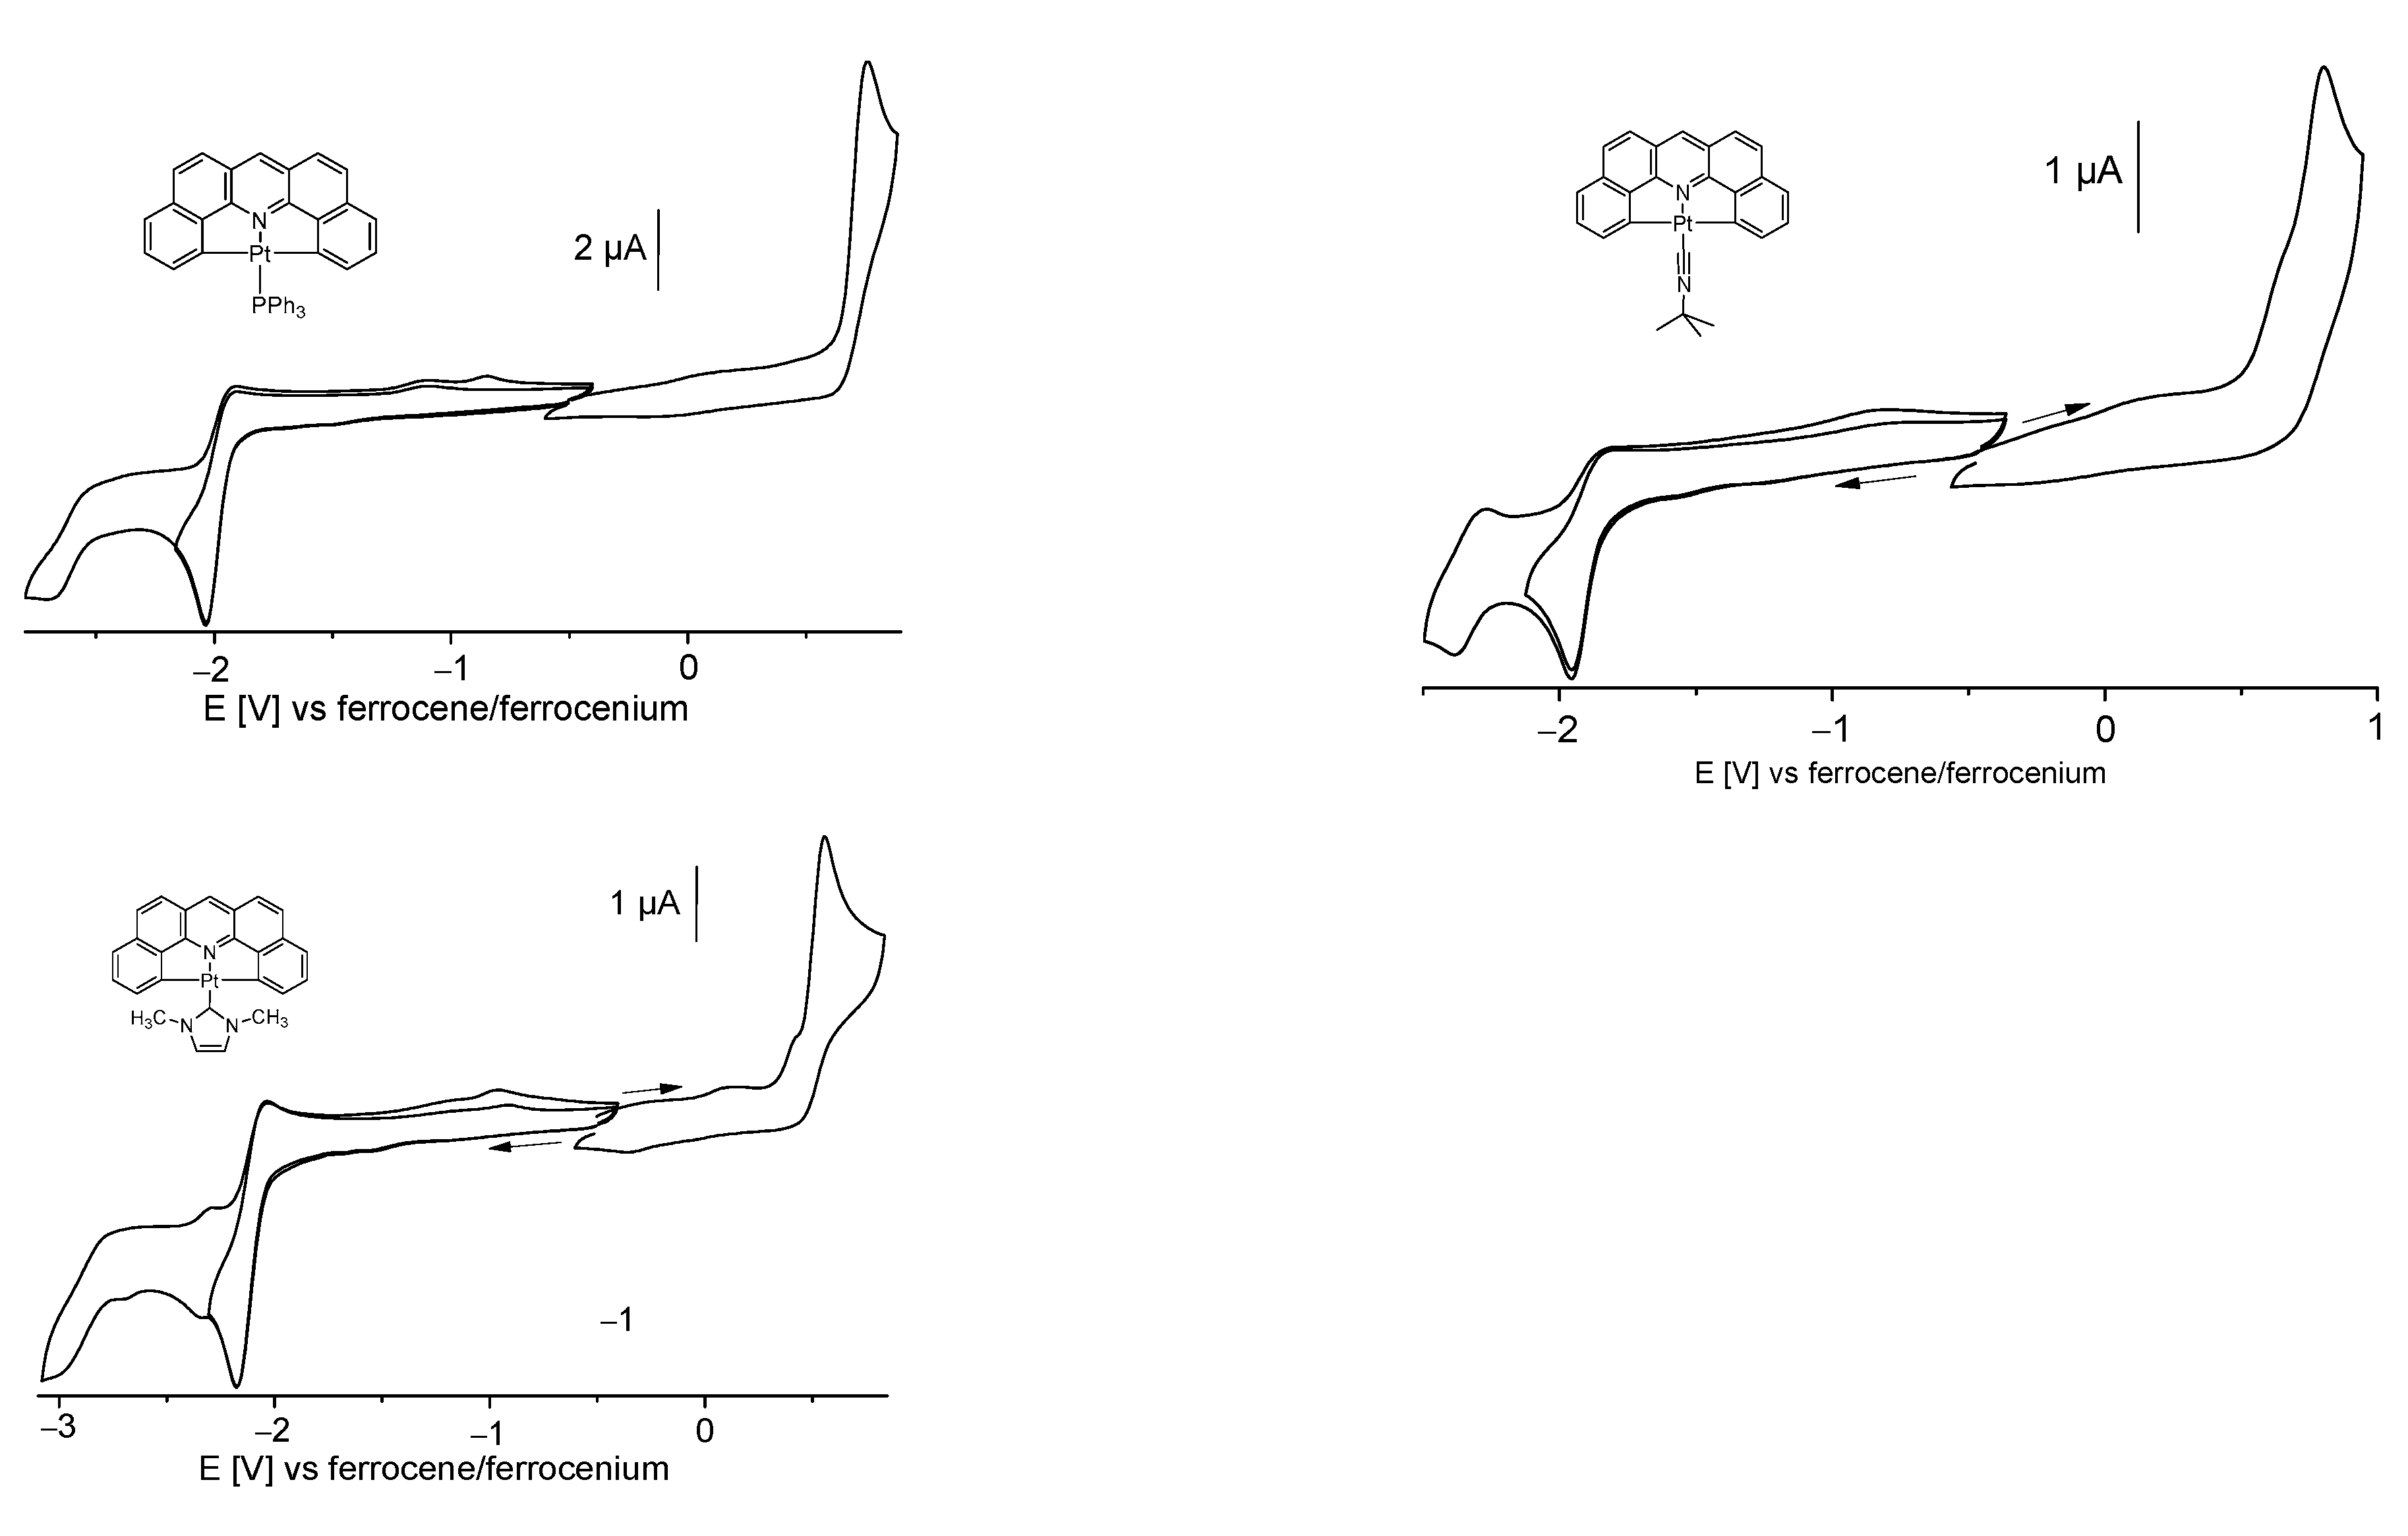
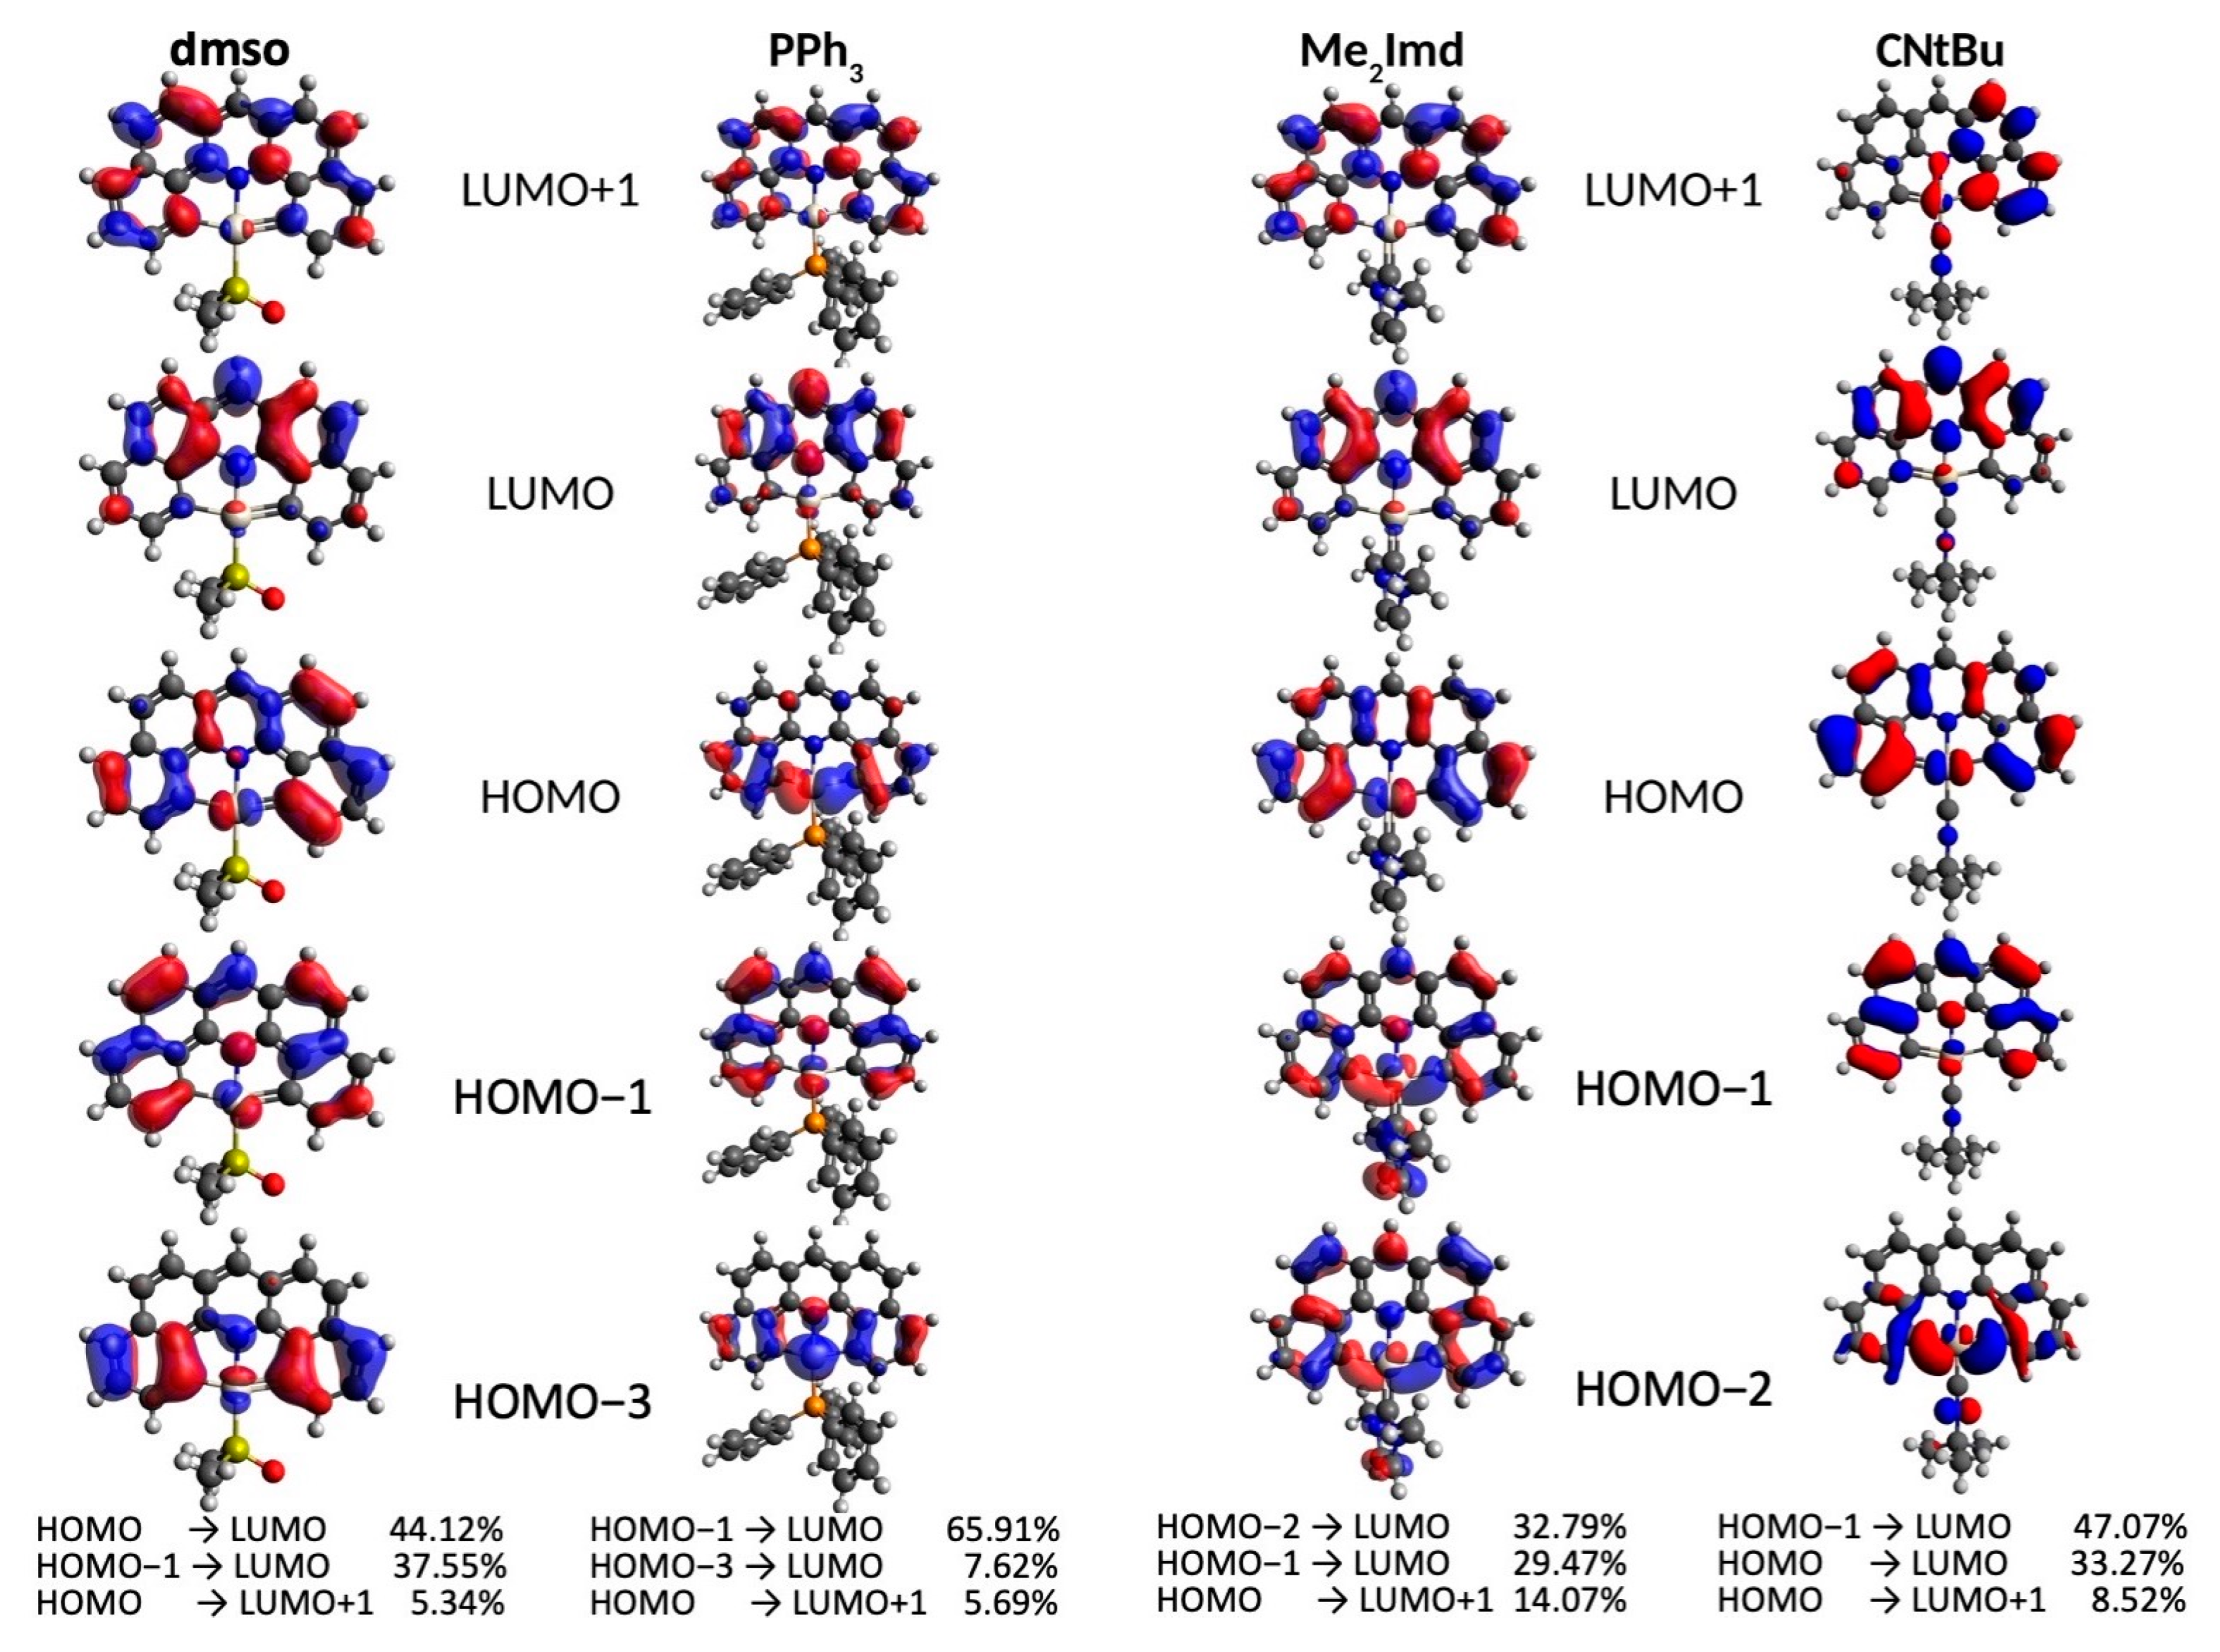
2.2. Electrochemistry and DFT-Calculated Orbitals
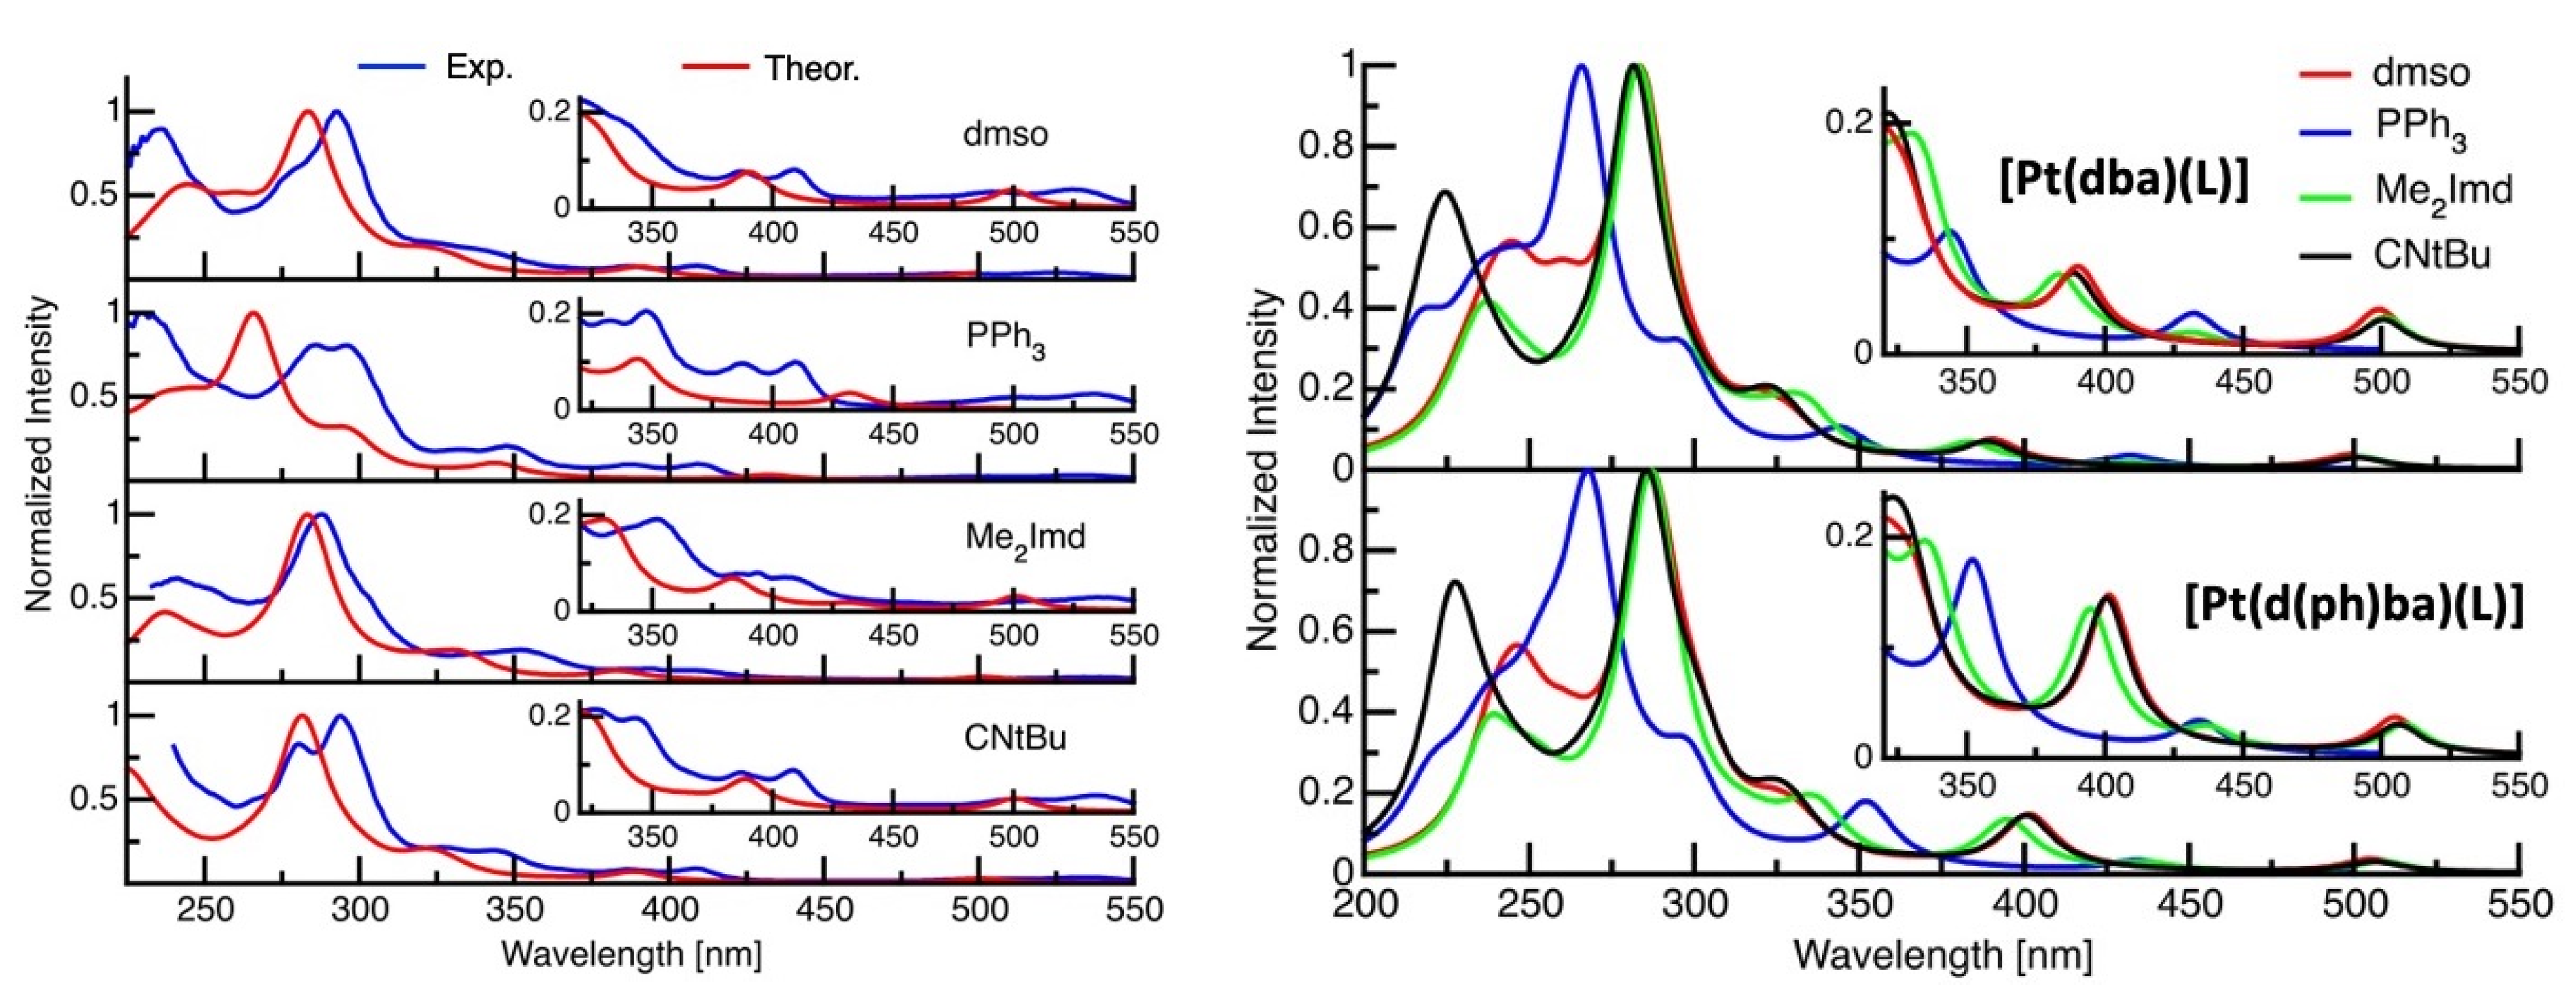
2.3. UV-Vis Absorption Spectroscopy
2.4. TD-DFT Calculated Absorption Spectra
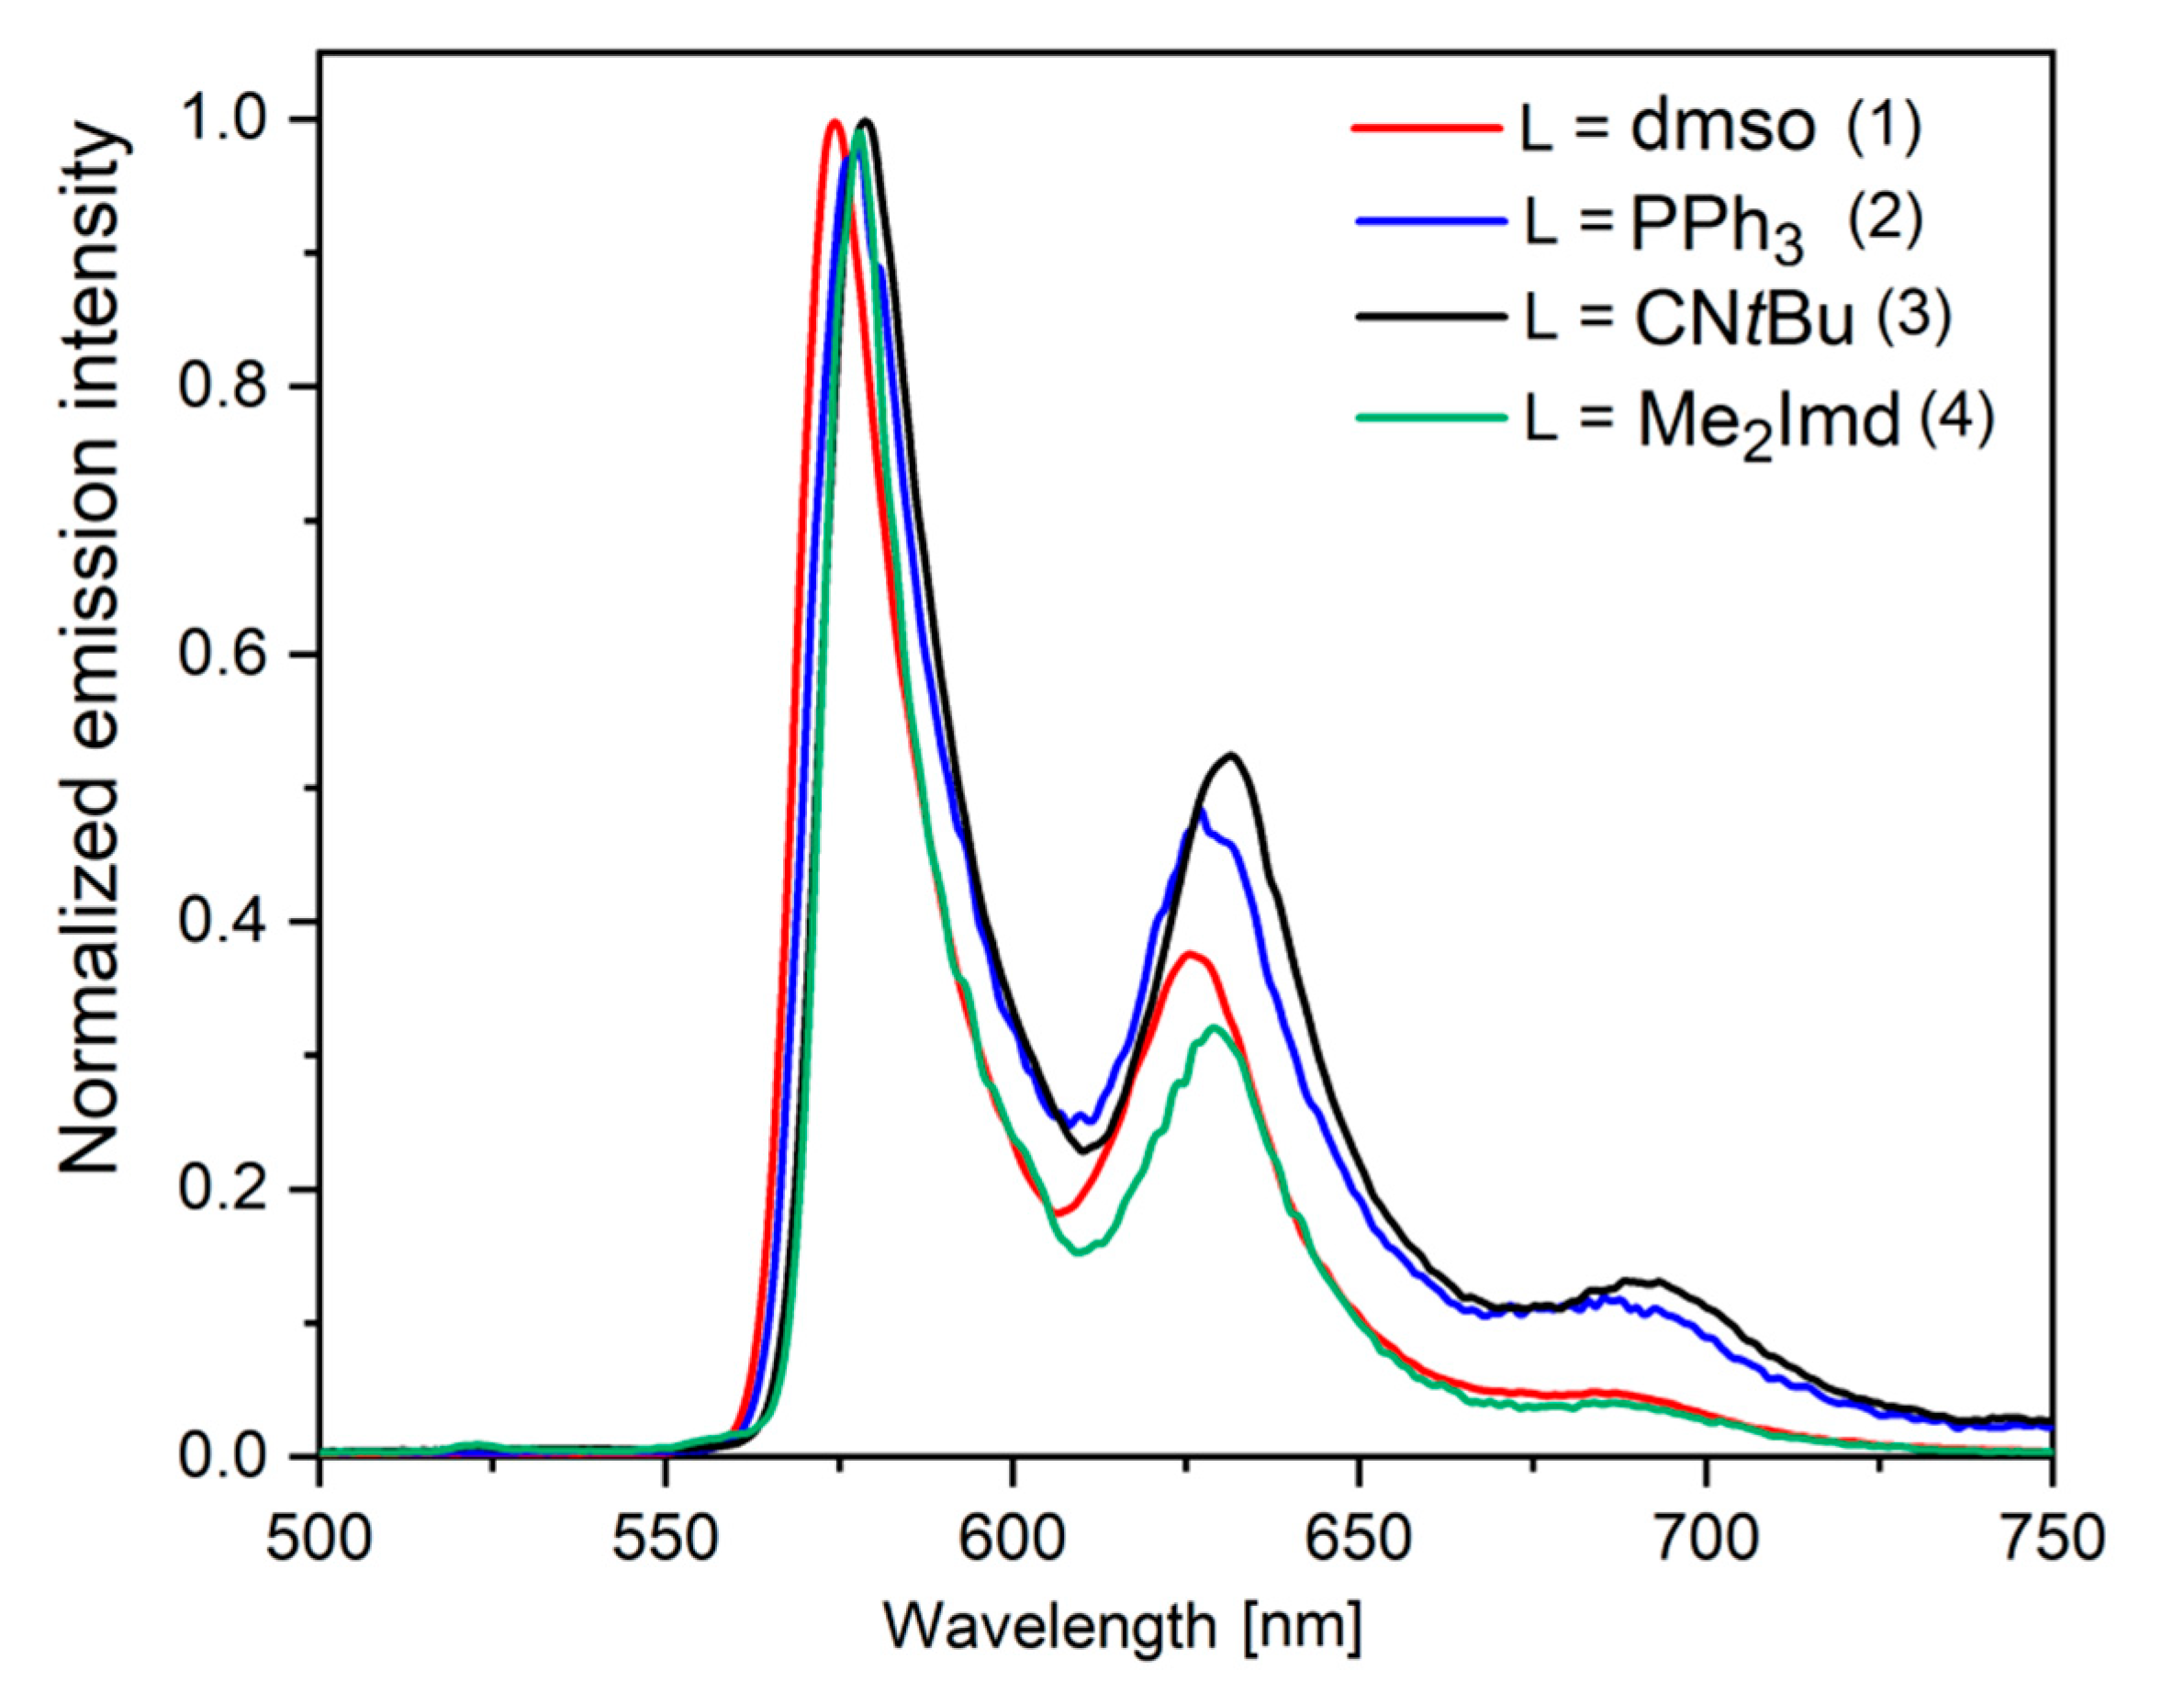
2.5. Time-Resolved Photoluminescence Spectroscopy
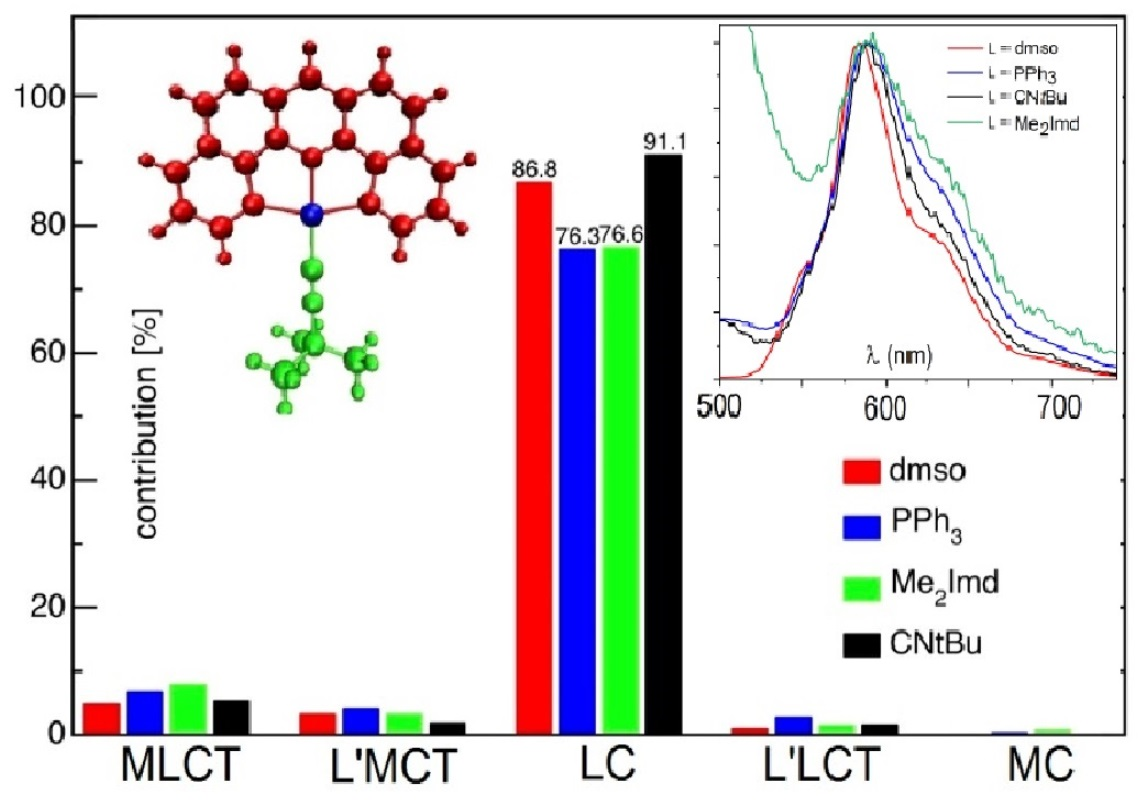
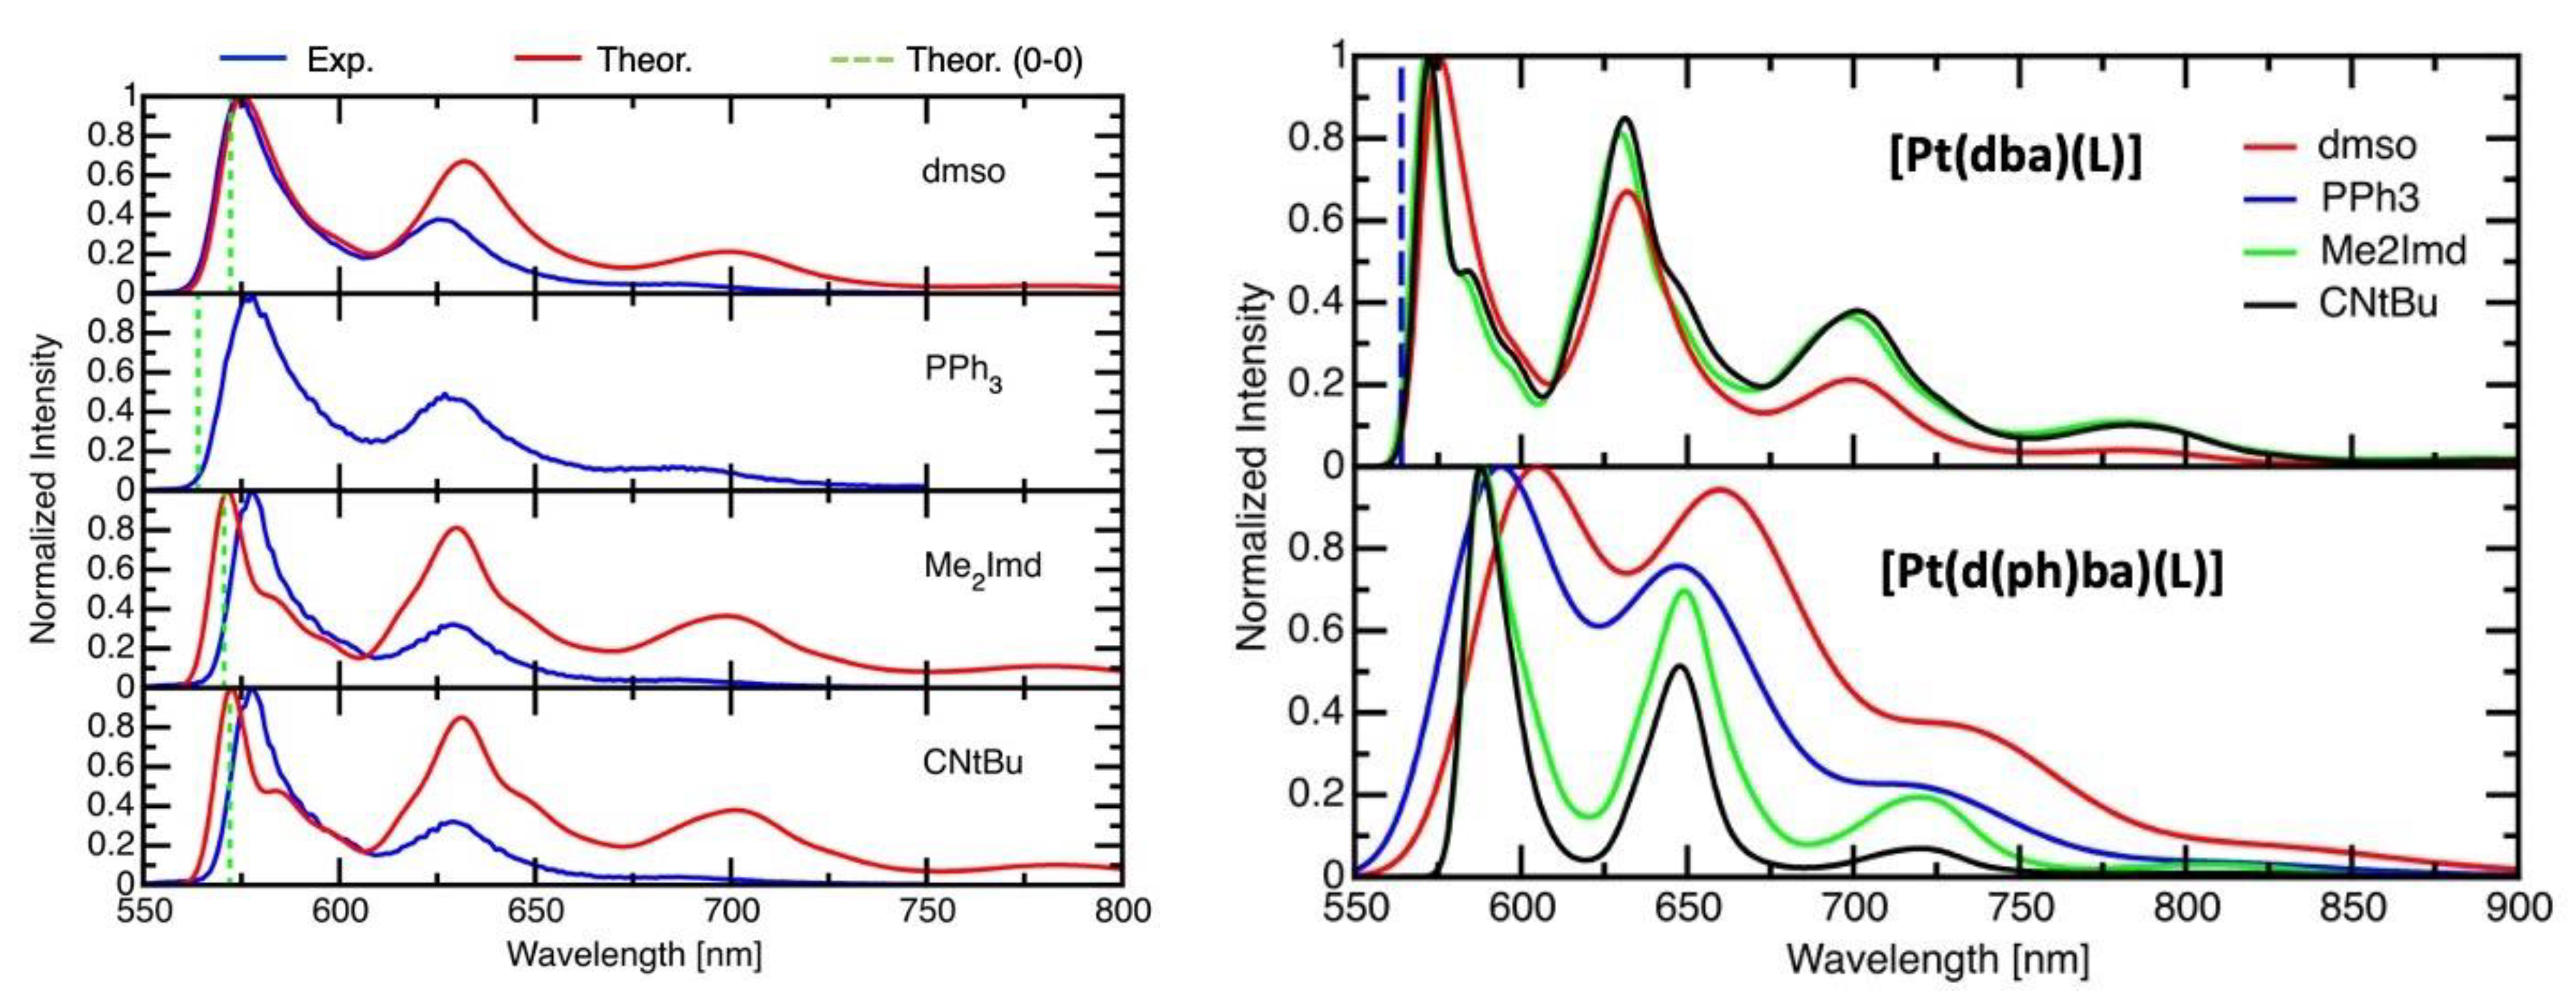
2.6. DFT-Calculated Emission Spectra
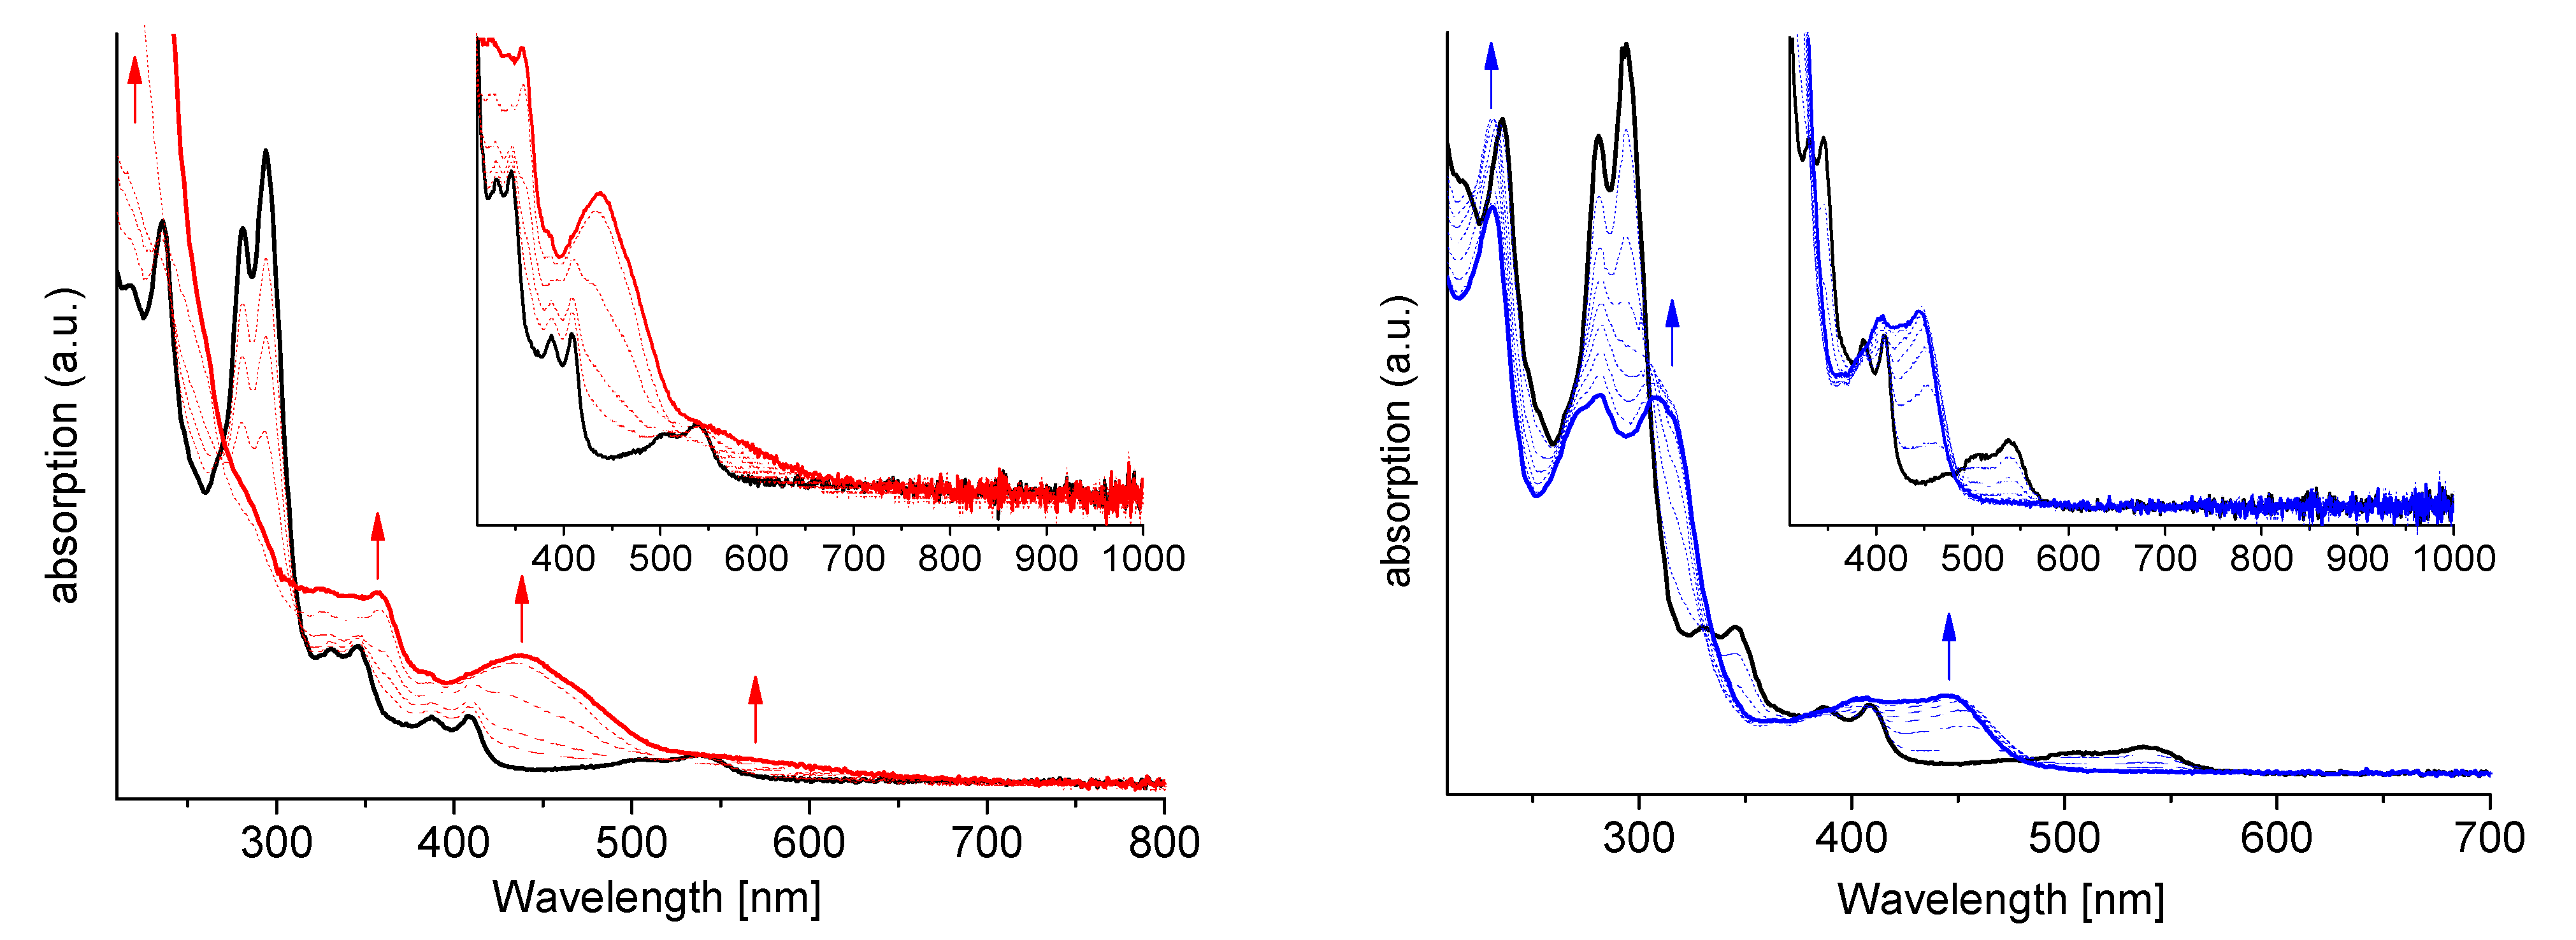
2.7. Spectroelectrochemistry (SEC)
3. Experimental Section
3.1. General Information
3.2. Syntheses
3.2.1. Synthesis of [Pt(dba)(PPh3)] (2)
3.2.2. Synthesis of [Pt(dba)(CNtBu)] (3)
3.2.3. Synthesis of [Pt(dba)(Me2Imd)] (4)
3.3. Instrumentation
3.4. X-ray Diffractometric Analysis of Single Crystals for Structure Determination
3.5. Computational Details
3.5.1. Vibrationally Resolved Emission Spectra
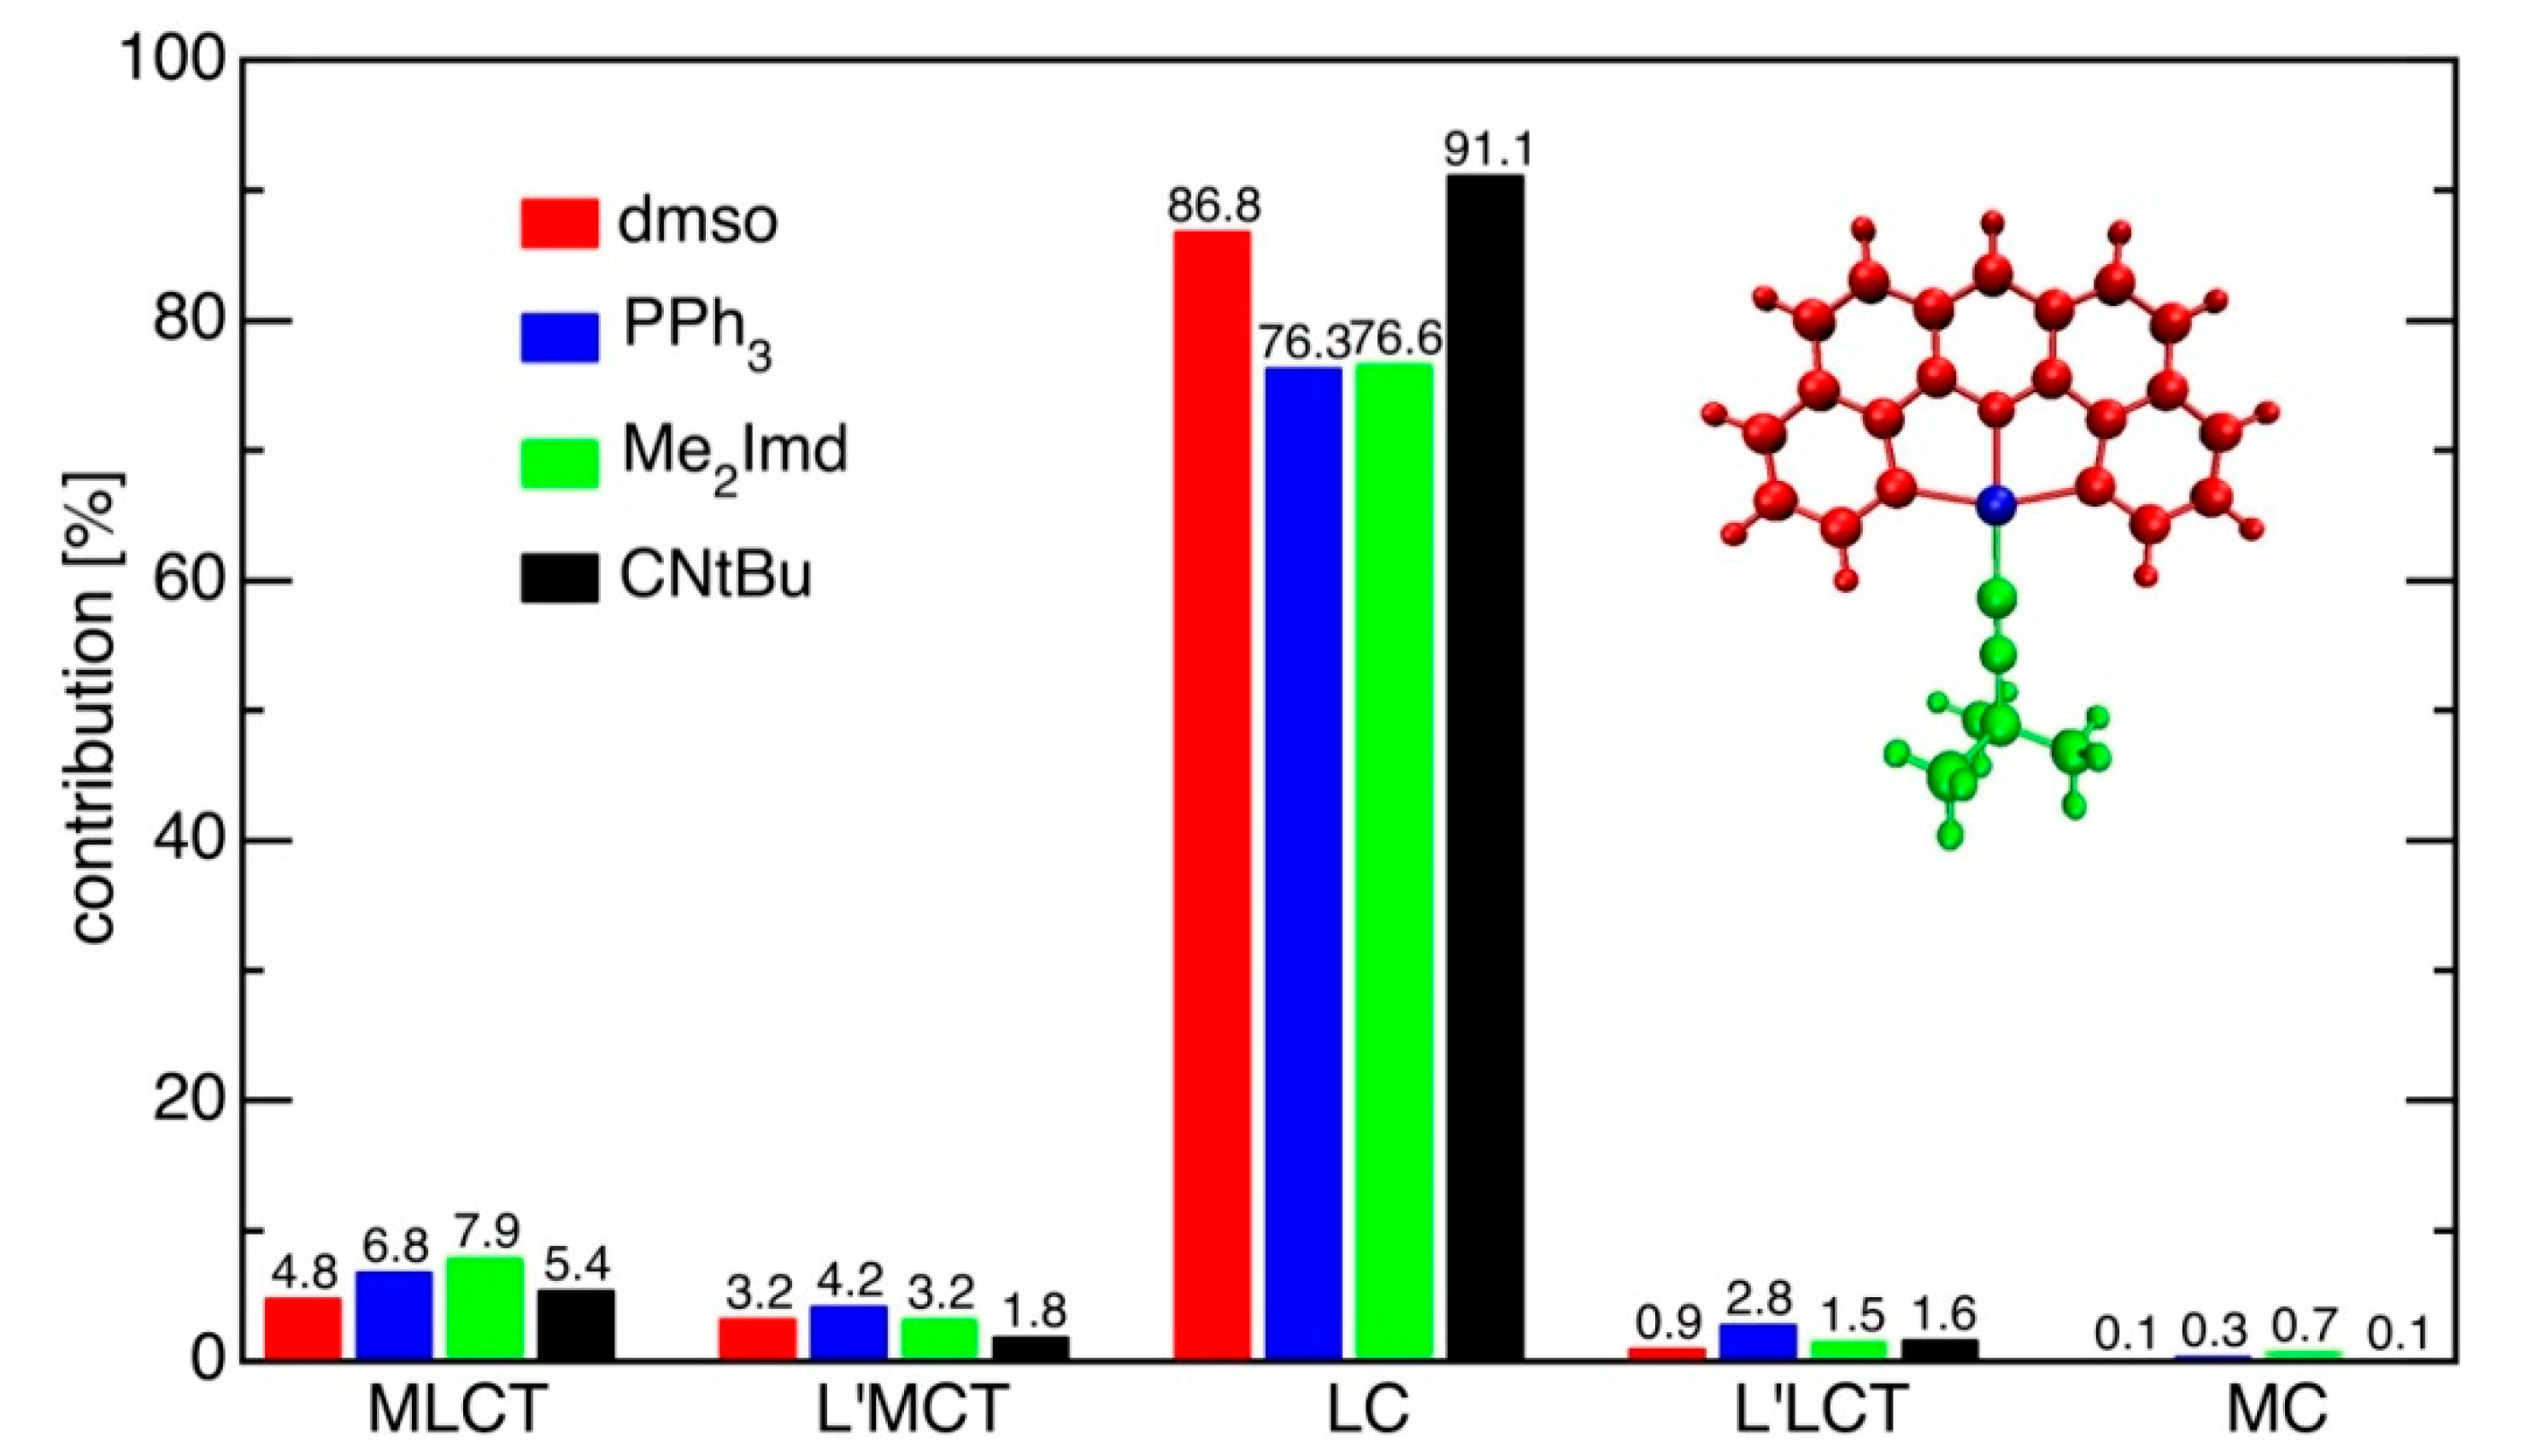
3.5.2. Character of the T1 State
3.5.3. Absorption Spectra
4. Conclusions
Supplementary Materials
Author Contributions
Funding
Institutional Review Board Statement
Informed Consent Statement
Data Availability Statement
Acknowledgments
Conflicts of Interest
References
- Mori, K.; Yamashita, H. Metal Complexes Supported on Solid Matrices for Visible-Light-Driven Molecular Transformations. Chem.-Eur. J. 2016, 22, 11122–11137. [Google Scholar] [CrossRef]
- Parasram, M.; Gevorgyan, V. Visible light-induced transition metal-catalyzed transformations: Beyond conventional photosensitizers. Chem. Soc. Rev. 2017, 46, 6227–6240. [Google Scholar] [CrossRef]
- Zhao, Q.; Li, F.; Huang, C. Phosphorescent chemosensors based on heavy-metal complexes. Chem. Soc. Rev. 2010, 39, 3007–3030. [Google Scholar] [CrossRef]
- Law, A.S.-Y.; Lee, L.C.-C.; Lo, K.K.-W.; Yam, V.W.-W. Aggregation and Supramolecular Self-Assembly of Low-Energy Red Luminescent Alkynylplatinum(II) Complexes for RNA Detection, Nucleolus Imaging, and RNA Synthesis Inhibitor Screening. J. Am. Chem. Soc. 2021, 143, 5396–5405. [Google Scholar] [CrossRef]
- Li, K.; Tong, G.S.M.; Wan, Q.; Cheng, G.; Tong, W.-Y.; Ang, W.-H.; Kwong, W.-L.; Che, C.-M. Highly phosphorescent platinum(II) emitters: Photophysics, materials and biological applications. Chem. Sci. 2016, 7, 1653–1673. [Google Scholar] [CrossRef]
- Fantacci, S.; De Angelis, F. A computational approach to the electronic and optical properties of Ru(II) and Ir(III) polypyridyl complexes: Applications to DSC, OLED and NLO. Coord. Chem. Rev. 2011, 255, 2704–2726. [Google Scholar] [CrossRef]
- Housecroft, C.E.; Constable, E.C. Over the LEC rainbow: Colour and stability tuning of cyclometallated iridium(III) complexes in light-emitting electrochemical cells. Coord. Chem. Rev. 2017, 350, 155–177. [Google Scholar] [CrossRef]
- Yersin, H. Highly Efficient OLEDs with Phosphorescent Materials; Wiley-VCH: Weinheim, Germany, 2008. [Google Scholar] [CrossRef]
- Bizzarri, C.; Spuling, E.; Knoll, D.M.; Volz, D.; Bräse, S. Sustainable metal complexes for organic light-emitting diodes (OLEDs). Coord. Chem. Rev. 2018, 373, 49–82. [Google Scholar] [CrossRef]
- Ravotto, L.; Ceroni, P. Aggregation induced phosphorescence of metal complexes: From principles to applications. Coord. Chem. Rev. 2017, 346, 62–76. [Google Scholar] [CrossRef]
- Yersin, H.; Rausch, A.F.; Czerwieniec, R.; Hofbeck, T.; Fischer, T. The triplet state of organo-transition metal compounds. Triplet harvesting and singlet harvesting for efficient OLEDs. Coord. Chem. Rev. 2011, 255, 2622–2652. [Google Scholar] [CrossRef]
- Zhen, X.; Qu, R.; Chen, W.; Wu, W.; Jiang, X. The development of phosphorescent probes for in vitro and in vivo bioimaging. Biomater. Sci. 2021, 9, 285–300. [Google Scholar] [CrossRef] [PubMed]
- Chen, Y.; Guan, R.; Zhang, C.; Huang, J.; Ji, L.; Chao, H. Two-photon luminescent metal complexes for bioimaging and cancer phototherapy. Coord. Chem. Rev. 2016, 310, 16–40. [Google Scholar] [CrossRef]
- Balachandran, C.; Yokoi, K.; Naito, K.; Haribabu, J.; Tamura, Y.; Umezawa, M.; Tsuchiya, K.; Yoshihara, T.; Tobita, S.; Aoki, S. Cyclometalated Iridium(III) Complex–Cationic Peptide Hybrids Trigger Paraptosis in Cancer Cells via an Intracellular Ca2+ Overload from the Endoplasmic Reticulum and a Decrease in Mitochondrial Membrane Potential. Molecules 2021, 26, 7028. [Google Scholar] [CrossRef] [PubMed]
- Haribabu, J.; Tamura, Y.; Yokoi, K.; Balachandran, C.; Umezawa, M.; Tsuchiya, K.; Yamada, Y.; Karvembu, R.; Aoki, S. Synthesis and Anticancer Properties of Bis- and Mono(cationic peptide) Hybrids of Cyclometalated Iridium(III) Complexes: Effect of the Number of Peptide Units on Anticancer Activity. Eur. J. Inorg. Chem. 2021, 2021, 1796–1814. [Google Scholar] [CrossRef]
- Kalinowski, J.; Fattori, V.; Cocchi, M.; Williams, J.A.G. Light-emitting devices based on organometallic platinum complexes as emitters. Coord. Chem. Rev. 2011, 255, 2401–2425. [Google Scholar] [CrossRef]
- Koshevoy, I.O.; Krause, M.; Klein, A. Non-Covalent Intramolecular Interactions through Ligand-Design Promoting Efficient Luminescence from Transition Metal Complexes. Coord. Chem. Rev. 2020, 405, 213094. [Google Scholar] [CrossRef]
- Gray, H.B.; Záliš, S.; Vlček, A. Electronic structures and photophysics of d8-d8 complexes. Coord. Chem. Rev. 2017, 345, 297–317. [Google Scholar] [CrossRef]
- Ganesan, P.; Hung, W.; Tso, J.; Ko, C.; Wang, T.; Chen, P.; Hsu, H.; Liu, S.; Lee, G.; Chou, P.; et al. Functional Pyrimidinyl Pyrazolate Pt(II) Complexes: Role of Nitrogen Atom in Tuning the Solid-State Stacking and Photophysics. Adv. Funct. Mater. 2019, 29, 1900923. [Google Scholar] [CrossRef]
- Cinninger, L.M.; Bastatas, L.D.; Shen, Y.; Holliday, B.J.; Slinker, J.D. Luminescent properties of a 3,5-diphenylpyrazole bridged Pt(II) dimer. Dalton Trans. 2019, 48, 9684–9691. [Google Scholar] [CrossRef]
- Yam, V.W.-W.; Au, V.K.-M.; Leung, S.Y.-L. Light-Emitting Self-Assembled Materials Based on d8 and d10 Transition Metal Complexes. Chem. Rev. 2015, 115, 7589–7728. [Google Scholar] [CrossRef]
- Cnudde, M.; Brünink, D.; Doltsinis, N.L.; Strassert, C.A. Tetradentate N^N°N^N-type luminophores for Pt(II) complexes: Synthesis, photophysical and quantum-chemical investigation. Inorg. Chim. Acta 2021, 518, 120090. [Google Scholar] [CrossRef]
- Li, G.; Ameri, L.; Fleetham, T.; Zhu, Z.-Q.; Li, J. Stable and efficient blue and green organic light emitting diodes employing tetradentate Pt(II) complexes. Appl. Phys. Lett. 2020, 117, 253301. [Google Scholar] [CrossRef]
- Yu, F.; Sheng, Y.; Wu, D.; Qin, K.; Li, H.; Xie, G.; Xue, Q.; Sun, Z.; Lu, Z.; Ma, H.; et al. Blue-Phosphorescent Pt(II) Complexes of Tetradentate Pyridyl−Carbolinyl Ligands: Synthesis, Structure, Photophysics, and Electroluminescence. Inorg. Chem. 2020, 59, 14493–14500. [Google Scholar] [CrossRef] [PubMed]
- Cheng, G.; Kwak, Y.; To, W.-P.; Lam, T.-L.; Tong, G.S.M.; Sit, M.-K.; Gong, S.; Choi, B.; Choi, W.il.; Yang, C.; et al. High-Efficiency Solution-Processed Organic Light-Emitting Diodes with Tetradentate Platinum(II) Emitters. ACS Appl. Mater. Interfaces 2019, 11, 45161–45170. [Google Scholar] [CrossRef]
- Fleetham, T.; Li, G.; Li, J. Phosphorescent Pt(II) and Pd(II) Complexes for Efficient, High-Color-Quality, and Stable OLEDs. Adv. Mater. 2017, 29, 1601861. [Google Scholar] [CrossRef]
- Krause, M.; von der Stück, R.; Brünink, D.; Buss, S.; Doltsinis, N.L.; Strassert, C.A.; Klein, A. Platinum and palladium complexes of tridentate -C^N^N (phen-ide)-pyridine-thiazol ligands—A case study involving spectroelectrochemistry, photoluminescence spectroscopy and TD-DFT calculations. Inorg. Chim. Acta 2021, 518, 120093. [Google Scholar] [CrossRef]
- Hebenbrock, M.; González-Abradelo, D.; Hepp, A.; Meadowcroft, J.; Lefringhausen, N.; Strassert, C.A.; Müller, J. Influence of the ancillary ligands on the luminescence of platinum(II) complexes with a triazole-based tridentate C^N^N luminophore. Inorg. Chim. Acta 2021, 516, 119988. [Google Scholar] [CrossRef]
- Sivchik, V.; Kochetov, A.; Eskelinen, T.; Kisel, K.S.; Solomatina, A.I.; Grachova, E.V.; Tunik, S.P.; Hirva, P.; Koshevoy, I.O. Modulation of Metallophilic and π–π Interactions in Platinum Cyclometalated Luminophores with Halogen Bonding. Chem.-Eur. J. 2021, 27, 1787–1794. [Google Scholar] [CrossRef]
- Puttock, E.V.; Sturala, J.; Kistemaker, J.C.M.; Williams, J.A.G. Platinum(II) Complexes of Tridentate-Coordinating Ligands Based on Imides, Amides, and Hydrazides: Synthesis and Luminescence Properties. Eur. J. Inorg. Chem. 2021, 2021, 335–347. [Google Scholar] [CrossRef]
- Eskelinen, T.; Buss, S.; Petrovskii, S.K.; Grachova, E.V.; Krause, M.; Kletsch, L.; Klein, A.; Strassert, C.A.; Koshevoy, I.O.; Hirva, P. Photophysics and Excited State Dynamics of Cyclometalated [M(C^N^N)(CN)] (M = Ni, Pd, Pt) Complexes: A Theoretical and Experimental Study. Inorg. Chem. 2021, 60, 8777–8789. [Google Scholar] [CrossRef]
- Gangadharappa, S.C.; Maisuls, I.; Schwab, D.A.; Kösters, J.; Doltsinis, N.L.; Strassert, C.A. Compensation of Hybridization Defects in Phosphorescent Complexes with Pnictogen-Based Ligands—A Structural, Photophysical, and Theoretical Case-Study with Predictive Character. J. Am. Chem. Soc. 2020, 142, 21353–21367. [Google Scholar] [CrossRef]
- Garbe, S.; Krause, M.; Klimpel, A.; Neundorf, I.; Lippmann, P.; Ott, I.; Brünink, D.; Strassert, C.A.; Doltsinis, N.L.; Klein, A. Cyclometalated Pt Complexes of CNC Pincer Ligands: Luminescence and Cytotoxic Evaluation. Organometallics 2020, 39, 746–756. [Google Scholar] [CrossRef]
- Iwakiri, A.; Konno, Y.; Shinozaki, K. Determination of excimer emission quantum yield of Pt(dpb)Cl (dpbH = 1,3-di(2-pyridyl)benzene and its analogues in solution. J. Lumin. 2019, 207, 482–490. [Google Scholar] [CrossRef]
- Garoni, E.; Boixel, J.; Dorcet, V.; Roisnel, T.; Roberto, D.; Jacquemin, D.; Guerchais, V. Controlling the emission in flexibly-linked (N^C^N)platinum dyads. Dalton Trans. 2018, 47, 224–232. [Google Scholar] [CrossRef]
- Kletsch, L.; Jordan, R.; Köcher, A.S.; Buss, S.; Strassert, C.A.; Klein, A. Photoluminescence of Ni(II), Pd(II), and Pt(II) Complexes [M(Me2dpb)Cl] Obtained from C-H Activation of 1,5-Di(2-pyridyl)-2,4-dimethylbenzene (Me2dpbH). Molecules 2021, 26, 5051. [Google Scholar] [CrossRef] [PubMed]
- Schulze, B.; Friebe, C.; Jäger, M.; Görls, H.; Birckner, E.; Winter, A.; Schubert, U.S. PtII Phosphors with Click-Derived 1,2,3-Triazole-Containing Tridentate Chelates. Organometallics 2018, 37, 145–155. [Google Scholar] [CrossRef]
- Hebenbrock, M.; Stegemann, L.; Kösters, J.; Doltsinis, N.L.; Müller, J.; Strassert, C.A. Phosphorescent Pt(II) complexes bearing a monoanionic C^N^N luminophore and tunable ancillary ligands. Dalton Trans. 2017, 46, 3160–3169. [Google Scholar] [CrossRef] [PubMed]
- Rodrigue-Witchel, A.; Rochester, D.L.; Zhao, S.-B.; Lavelle, K.B.; Williams, J.A.G.; Wang, S.; Connick, W.B.; Reber, C. Pressure-induced variations of MLCT and ligand-centered luminescence spectra in square-planar platinum(II) complexes. Polyhedron 2016, 108, 151–155. [Google Scholar] [CrossRef]
- Rausch, A.F.; Murphy, L.; Williams, J.A.G.; Yersin, H. Improving the Performance of Pt(II) Complexes for Blue Light Emission by Enhancing the Molecular Rigidity. Inorg. Chem. 2012, 51, 312–319. [Google Scholar] [CrossRef]
- Pander, P.; Zaytsev, A.V.; Sil, A.; Williams, J.A.G.; Kozhevnikov, V.N.; Dias, F.B. Enhancement of thermally activated delayed fluorescence properties by substitution of ancillary halogen in a multiple resonance-like diplatinum(II) complex. J. Mater. Chem. C 2022, 10, 4851–4860. [Google Scholar] [CrossRef]
- Li, G.; Wen, J.; Zhan, F.; Lou, W.; Yang, Y.-F.; Hu, Y.; She, Y. Fused 6/5/6 Metallocycle-Based Tetradentate Pt(II) Emitters for Efficient Green Phosphorescent OLEDs. Inorg. Chem. 2022, 61, 11218–11231. [Google Scholar] [CrossRef]
- Zhu, L.; Sha, C.; Lv, A.; Xie, W.; Shen, K.; Chen, Y.; Xie, G.; Ma, H.; Li, H.; Hang, X.-C. Tetradentate Pt(II) Complexes with Peripheral Hindrances for Highly Efficient Solution-Processed Blue Phosphorescent OLEDs. Inorg. Chem. 2022, 61, 10402–10409. [Google Scholar] [CrossRef] [PubMed]
- Zhang, X.; Ao, L.; Han, Y.; Gao, Z.; Wang, F. Modulating Pt...Pt metal–metal interactions through conformationally switchable molecular tweezer/guest complexation. Chem. Commun. 2018, 54, 1754–1757. [Google Scholar] [CrossRef]
- Lu, W.; Chan, M.C.W.; Cheung, K.-K.; Che, C.-M. π–π Interactions in Organometallic Systems. Crystal Structures and Spectroscopic Properties of Luminescent Mono-, Bi-, and Trinuclear Trans-cyclometalated Platinum(II) Complexes Derived from 2,6-Diphenylpyridine. Organometallics 2001, 20, 2477–2486. [Google Scholar] [CrossRef]
- Yam, V.W.-W.; Tang, R.P.-L.; Wong, K.M.-C.; Lu, X.-X.; Cheung, K.-K.; Zhu, N. Syntheses, Electronic Absorption, Emission, and Ion-Binding Studies of Platinum(II) C^N^C and Terpyridyl Complexes Containing Crown Ether Pendants. Chem.-Eur. J. 2002, 8, 4066–4076. [Google Scholar] [CrossRef]
- Kui, S.C.F.; Hung, F.-F.; Lai, S.-L.; Yuen, M.-Y.; Kwok, C.-C.; Low, K.-H.; Chui, S.S.-Y.; Che, C.-M. Luminescent Organoplatinum(II) Complexes with Functionalized Cyclometalated C^N^C Ligands: Structures, Photophysical Properties, and Material Applications. Chem.-Eur. J. 2012, 18, 96–109. [Google Scholar] [CrossRef] [PubMed]
- Zhang, Q.; Wang, S.; Zhu, Y.; Zhang, C.; Cao, H.; Ma, W.; Tian, X.; Wu, J.; Zhou, H.; Tian, Y. Functional Platinum(II) Complexes with Four-Photon Absorption Activity, Lysosome Specificity, and Precise Cancer Therapy. Inorg. Chem. 2021, 60, 2362–2371. [Google Scholar] [CrossRef]
- Zhu, R.; Chen, X.; Shu, N.; Shang, Y.; Wang, Y.; Yang, P.; Tang, Y.; Wang, F.; Xu, J. Computational Study of Photochemical Relaxation Pathways of Platinum(II) Complexes. J. Phys. Chem. A 2021, 125, 10144–10154. [Google Scholar] [CrossRef] [PubMed]
- Sanning, J.; Stegemann, L.; Ewen, P.R.; Schwermann, C.; Daniliuc, C.G.; Zhang, D.; Lin, N.; Duan, L.; Wegner, D.; Doltsinis, N.L.; et al. Colour-tunable asymmetric cyclometalated Pt(II) complexes and STM-assisted stability assessment of ancillary ligands for OLEDs. J. Mater. Chem. C 2016, 4, 2560–2565. [Google Scholar] [CrossRef]
- Yam, V.W.-W.; Wong, K.M.-C. Luminescent metal complexes of d6, d8 and d10 transition metal centres. Chem. Commun. 2011, 47, 11579–11592. [Google Scholar] [CrossRef]
- Chow, P.-K.; Cheng, G.; Tong, G.S.M.; To, W.-P.; Kwong, W.-L.; Low, K.-H.; Kwok, C.-C.; Ma, C.; Che, C.-M. Luminescent Pincer Platinum(II) Complexes with Emission Quantum Yields up to Almost Unity: Photophysics, Photoreductive C-C Bond Formation, and Materials Applications. Angew. Chem. Int. Ed. 2015, 54, 2084–2089. [Google Scholar] [CrossRef]
- Wang, L.; Zhang, Y.; Li, J.; He, H.; Zhang, J. Influence of primary and auxiliary ligand on spectroscopic properties and luminescent efficiency of organoplatinum(II) complexes bearing functionalized cyclometalated C^N^C ligands. Dalton Trans. 2014, 43, 14029–14038. [Google Scholar] [CrossRef]
- Qiu, D.; Wu, J.; Xie, Z.; Cheng, Y.; Wang, L. Synthesis, photophysical and electrophosphorescent properties of mononuclearPt(II) complexes with arylamine functionalized cyclometalating ligands. J. Organomet. Chem. 2009, 694, 737–746. [Google Scholar] [CrossRef]
- Krause, M.; Maisuls, I.; Buss, S.; Strassert, C.A.; Winter, A.; Schubert, U.S.; Nair, S.S.; Dietzek-Ivanšic, B.; Klein, A. Photophysical Study on the Rigid Pt(II) Complex [Pt(naphen)(Cl)] (Hnaphen = Naphtho[1,2-b][1,10]Phenanthroline and De-rivatives. Molecules 2022, 27, 7022. [Google Scholar] [CrossRef]
- Krause, M.; Friedel, J.; Buss, S.; Brünink, D.; Berger, A.; Strassert, C.A.; Doltsinis, N.L.; Axel Klein, A. Isoelectronic Pt(II) complexes of cyclometalating C^N^N ligands with phenyl/(benzo)thiophenyl and pyridyl/(benzo)thiazolyl moieties. Dalton Trans. 2022, 51, 16181–16194. [Google Scholar] [CrossRef]
- Föller, J.; Friese, D.H.; Riese, S.; Kaminski, J.M.; Metz, S.; Schmidt, D.; Würthner, F.; Lambert, C.; Marian, C.M. On the photophysical properties of IrIII, PtII, and PdII (phenylpyrazole) (phenyldipyrrin) complexes. Phys. Chem. Chem. Phys. 2020, 22, 3217–3233. [Google Scholar] [CrossRef] [PubMed]
- Martinez, C.R.; Iverson, B.L. Rethinking the term “pi-stacking”. Chem. Sci. 2012, 3, 2191–2201. [Google Scholar] [CrossRef]
- Janiak, C. A critical account on π–π stacking in metal complexes with aromatic nitrogen-containing ligands. J. Chem. Soc. Dalton Trans. 2000, 2000, 3885–3896. [Google Scholar] [CrossRef]
- Jain, R.; Al Mamun, A.; Buchanan, R.M.; Kozlowski, P.M.; Grapperhaus, C.A. Ligand-Assisted Metal-Centered Electrocatalytic Hydrogen Evolution upon Reduction of a Bis(thiosemicarbazonato)Ni(II) Complex. Inorg. Chem. 2018, 57, 13486–13493. [Google Scholar] [CrossRef]
- Klein, A.; Kaiser, A.; Wielandt, W.; Belaj, F.; Wendel, E.; Bertagnolli, H.; Zalis, S. Halide Ligands-More Than Just σ-Donors? A Structural and Spectroscopic Study of Homologous Organonickel Complexes. Inorg. Chem. 2008, 47, 11324–11333. [Google Scholar] [CrossRef]
- Maisuls, I.; Wang, C.; Gutierrez Suburu, M.E.; Wilde, S.; Daniliuc, C.-G.; Brünink, D.; Doltsinis, N.L.; Ostendorp, S.; Wilde, G.; Kösters, J.; et al. Ligand-controlled and nanoconfinement-boosted luminescence employing Pt(II) and Pd(II) complexes: From color-tunable aggregation-enhanced dual emitters towards self-referenced oxygen reporters. Chem. Sci. 2021, 12, 3270–3281. [Google Scholar] [CrossRef]
- Williams, J.A.G. The coordination chemistry of dipyridylbenzene: N-deficient terpyridine or panacea for brightly luminescent metal complexes? Chem. Soc. Rev. 2009, 38, 1783–1801. [Google Scholar] [CrossRef]
- Sillen, A.; Engelborghs, Y. The Correct Use of “Average” Fluorescence Parameters. Photochem. Photobiol. 1998, 67, 475–486. [Google Scholar] [CrossRef]
- Plasser, F. TheoDORE: A toolbox for a detailed and automated analysis of electronic excited state computations. J. Chem. Phys. 2020, 152, 084108. [Google Scholar] [CrossRef]
- Bregenholt Zederkof, D.; Møller, K.B.; Nielsen, M.M.; Haldrup, K.; González, L.; Mai, S. Resolving Femtosecond Solvent Reorganization Dynamics in an Iron Complex by Nonadiabatic Dynamics Simulations. J. Am. Chem. Soc. 2022, 144, 12861–12873. [Google Scholar] [CrossRef] [PubMed]
- Mai, S.; González, L. Unconventional two-step spin relaxation dynamics of [Re(CO)3(im)(phen)]+ in aqueous solution. Chem. Sci. 2019, 10, 10405–10411. [Google Scholar] [CrossRef] [PubMed]
- Von der Stück, R.; Krause, M.; Brünink, D.; Buss, S.; Doltsinis, N.L.; Strassert, C.A.; Klein, A. Luminescent Pd(II) Complexes with Tridentate -C^N^N Arylpyridine-(benzo)thiazole Ligands. Z. Anorg. Allg. Chem. 2022, 648, e202100278. [Google Scholar] [CrossRef]
- Vogt, N.; Sandleben, A.; Kletsch, L.; Schäfer, S.; Chin, M.T.; Vicic, D.A.; Hörner, G.; Klein, A. Role of the X Coligands in Cyclometalated [Ni(Phbpy)X] Complexes (HPhbpy = 6-Phenyl-2,2′-bipyridine). Organometallics 2021, 40, 1776–1785. [Google Scholar] [CrossRef]
- Hamacher, C.; Hurkes, N.; Kaiser, A.; Klein, A.; Schüren, A. Electrochemistry and Spectroscopy of Organometallic Terpyridine Nickel Complexes. Inorg. Chem. 2009, 48, 9947–9951. [Google Scholar] [CrossRef]
- Braterman, P.S.; Song, J.-I.; Wimmer, F.M.; Wimmer, S.; Kaim, W.; Klein, A.; Peacock, R.D. Electrochemistry and Spectroelectrochemistry (EPR, UV-Vis-Near-IR) of Platinum(II) 2,2′-Bipyridine and Ring-Metalated Bipyridine Complexes: PtII(L−) and PtI(L−) but Not PtI(L). Inorg. Chem. 1992, 31, 5084–5088. [Google Scholar] [CrossRef]
- Klein, A.; Kaim, W. Axial Shielding of 5d8 and 5d7 Metal Centers in Dimesitylplatinum Complexes with Unsaturated Chelate Ligands: Spectroscopic and Spectroelectrochemical Studies of Four Different Oxidation States. Organometallics 1995, 14, 1176–1186. [Google Scholar] [CrossRef]
- Gardner, S.S.; Kawamoto, T.; Curran, D.P. Synthesis of 1,3-Dialkylimidazol-2-ylidene Boranes from 1,3-Dialkylimidazolium Iodides and Sodium Borohydride. J. Org. Chem. 2015, 80, 9794–9797. [Google Scholar] [CrossRef] [PubMed]
- Sheldrick, G.M. ShelXT—Integrated space-group and crystal-structure determination. Acta Crystallogr. Sect. A Found. Crystallogr. 2015, 71, 3–8. [Google Scholar] [CrossRef] [PubMed]
- Sheldrick, G.M. SHELXL-2017/1, Program for the Solution of Crystal Structures; University of Göttingen: Göttingen, Germany, 2017. [Google Scholar]
- Sheldrick, G.M. Crystal structure refinement with SHELXL. Acta Crystallogr. Sect. C Struct. Chem. 2015, 71, 3–8. [Google Scholar] [CrossRef]
- STOE X-RED. Data Reduction Program, Version 1.31/Windows; STOE & Cie: Darmstadt, Germany, 2005. [Google Scholar]
- STOE X-SHAPE. Crystal Optimisation for Numerical Absorption Correction, Version 1.06/Windows; STOE & Cie: Darmstadt, Germany, 1999. [Google Scholar]
- Frisch, M.J.; Trucks, G.W.; Schlegel, H.B.; Scuseria, G.E.; Robb, M.A.; Cheeseman, J.R.; Scalmani, G.; Barone, V.; Mennucci, B.; Petersson, G.A.; et al. Gaussian 09 Revision D.01; Gaussian Inc.: Wallingford, CT, USA, 2009. [Google Scholar]
- Yanai, T.; Tew, D.P.; Handy, N.C. A new hybrid exchange–correlation functional using the Coulomb-attenuating method (CAM-B3LYP). Chem. Phys. Lett. 2004, 393, 51–57. [Google Scholar] [CrossRef]
- Grimme, S.; Ehrlich, S.; Goerigk, L. Effect of the damping function in dispersion corrected density functional theory. J. Comp. Chem. 2011, 32, 1456–1465. [Google Scholar] [CrossRef] [PubMed]
- Andrae, D.; Häußermann, U.; Dolg, M.; Stoll, H.; Preuß, H. Energy-adjusted ab initio pseudopotentials for the second and third row transition elements. Theor. Chem. Acc. 1990, 77, 123–141. [Google Scholar] [CrossRef]
- Dunning, T.H.; Hay, P.J. Modern Theoretical Chemistry; Schaefer, H.F., Ed.; Plenum: New York, NY, USA, 1977; Volume 3. [Google Scholar]
- Barone, V.; Bloino, J.; Biczysko, M. Vibrationally-Resolved Electronic Spectra in GAUSSIAN 09; GAUSSIAN 09, Revision A.02; Gaussian Inc.: Wallingford, CT, USA, 2009; pp. 1–20. [Google Scholar]
- Barone, V.; Bloino, J.; Biczysko, M.; Santoro, F. Fully Integrated Approach to Compute Vibrationally Resolved Optical Spectra: From Small Molecules to Macrosystems. J. Chem. Theory Comput. 2009, 5, 540–554. [Google Scholar] [CrossRef]
- Tomasi, J.; Mennucci, B.; Cammi, R. Quantum Mechanical Continuum Solvation Models. Chem. Rev. 2005, 105, 2999–3094. [Google Scholar] [CrossRef]
- Skid, W.M. UFF, a Full Periodic Table Force Field for Molecular Mechanics and Molecular Dynamics Simulations. J. Am. Chem. Soc. 1992, 114, 10024–10035. [Google Scholar] [CrossRef]
- Adamo, C.; Barone, V. Toward reliable density functional methods without adjustable parameters: The PBE0 model. J. Chem. Phys. 1999, 110, 6158–6169. [Google Scholar] [CrossRef]


| State | dmso(1) | PPh3(2) | CNtBu(3) | Me2Imd(4) | |
|---|---|---|---|---|---|
| d Pt-X [Å] | exp. | 2.19(7) | 2.23(2) | 1.89(3) | 1.99(1) |
| calc. S0 | 2.34 | 2.35 | 1.92 | 1.99 | |
| calc. T1 | 2.35 | 2.39 | 1.92 | 1.99 | |
| α = N-Pt-X [°] | exp. | 173.2(6) | 176.2(1) | 177.6(1) | 177.8(4) |
| calc.S0 | 174.1 | 176.7 | 179.8 | 179.7 | |
| calc. T1 | 179.1 | 177.4 | 179.8 | 179.8 | |
| β = C-Pt-X [°] | exp. | 94.47(7) | 96.8(1) | 102.9(1) | 101.9(4) |
| calc. S0 | 94.7 | 97.1 | 100.4 | 100.3 | |
| calc. T1 | 99.4 | 99.2 | 100.4 | 100.4 | |
| γ = Pt-X-Y [°] | exp. | 115.7(9) | 113.4(2) | 177.4(3) | 128.7(9) |
| calc. S0 | 115.1 | 114.5 | 179.7 | 127.8 | |
| calc. T1 | 115.2 | 114.2 | 179.9 | 127.8 | |
| δ = C-Pt-X-Y [°] | exp. | 129.9(1) | 68.8(2) | 17.8(5) | 57.9(1) |
| calc. S0 | 111.1 | 65.5 | 5.1 | 64.2 | |
| calc. T1 | 107.7 | 101.9 | −33.0 | 64.2 |
| Reduction | Reduction | Oxidation | Echem Gap | ||
|---|---|---|---|---|---|
| L = | E1/2 Red2 | E1/2 Red1 | ΔRed1−Red2 | Epa Ox1 | ΔOx1−Red1 |
| dmso (1) | −2.70 (irr) | −1.98 (irr) | 0.72 | 0.93 | 2.91 |
| PPh3 (2) | −2.70 (irr) | −1.96 | 0.74 | 0.75 | 2.71 |
| CNtBu (3) | −3.26 | −1.89 | 1.37 | 0.80 | 2.69 |
| Me2Imd (4) | −3.02 (irr) | −2.10 | 0.92 | 0.55 | 2.65 |
| L = | λmax (ε) | λmax (ε) | λmax (ε) | λmax (ε) | λmax/eV | λcut-off b/nm | λcut-off b/eV |
|---|---|---|---|---|---|---|---|
| dmso (1) | 292 (47.8) | 340 (8.3) | 409 (4.1) | 525 (1.9) | 2.36 | 566 | 2.19 |
| PPh3 (2) | 296 (50.2) | 347 (12.7) | 409 (6.2) | 532 (2.1) | 2.33 | 577 | 2.15 |
| CNtBu (3) | 294 (27.0) | 343 (5.2) | 408 (2.4) | 533 (1.0) | 2.33 | 578 | 2.15 |
| Me2Imd (4) | 300 (24.8) | 352 (8.9) | 406 (3.2) | 536 (1.3) | 2.31 | 580 | 2.14 |
| L = | τ(air)/ns | τ(Ar)/µs | τ(77 K)/µs | ΦL (air) ± 0.02 | ΦL (Ar) ± 0.02 | ΦL (77 K) ± 0.02 | kr (77 K)/ 104 s−1 |
|---|---|---|---|---|---|---|---|
| dmso (1) | τ = 336.0 ± 0.5 | τ = 14.040 ± 0.013 | τ1 = 27.9 ± 1.2 (24%) τ2 = 47.4 ± 0.4 (76%) τav_amp = 42.79 ± 0.06 | <0.02 | 0.24 | 0.82 | 1.90 ± 0.05 |
| PPh3 (2) | τ1 = 157.1 ± 0.3 (27%) τ2 = 4.1± 0.3 (73%) τav_amp = 46 ± 4 | τ = 9.279 ± 0.008 | τ1 = 40 ± 3 (14%) τ2 = 26.4 ± 0.4 (86%) τav_amp = 28.40 ± 0.03 | <0.02 | <0.02 | 0.90 | 3.16 ± 0.08 |
| CNtBu (3) | τ1 = 259.2 ± 0.7 (52%) τ2 = 6.9 ± 0.3 (48%) τav_amp = 139.0 ± 1.6 | τ = 3.167 ± 0.002 | τ1 = 38.4 ± 0.6 (14%) τ2 = 27.08 ± 0.12 (86%) τav_amp = 28.640 ± 0.016 | 0.04 | 0.11 | 0.80 | 2.80 ± 0.08 |
| Me2Imd (4) | τ1 = 340 ± 20 (1%) τ2 = 7.0 ± 0.3 (24%) τ3 = 21.0 ± 1.2 (75%) τav_amp = 22.4 ± 0.6 | τ1 = 2.13 ± 0.07 (2%) τ2 = 0.022 ± 0.001 (98%) τav_amp = 0.061 ± 0.004 | τ1 = 60 ± 2 (2%) τ2 = 15.59 ± 0.05 (98%) τav_amp = 16.7 ± 0.04 | <0.02 | 0.04 | 0.86 | 5.16 ± 0.13 |
| H2dba | τ/10−3= 6.404 ± 0.009 | τ = 6.81 ± 0.03 | n.d. | 0.42 | 0.42 | 0.53 | n.d. |
Publisher’s Note: MDPI stays neutral with regard to jurisdictional claims in published maps and institutional affiliations. |
© 2022 by the authors. Licensee MDPI, Basel, Switzerland. This article is an open access article distributed under the terms and conditions of the Creative Commons Attribution (CC BY) license (https://creativecommons.org/licenses/by/4.0/).
Share and Cite
Friedel, J.; Krause, M.; Jordan, R.; Maisuls, I.; Brünink, D.; Schwab, D.; Doltsinis, N.L.; Strassert, C.A.; Klein, A. Triplet Emitting C^N^C Cyclometalated Dibenzo[c,h]Acridine Pt(II) Complexes. Molecules 2022, 27, 8054. https://doi.org/10.3390/molecules27228054
Friedel J, Krause M, Jordan R, Maisuls I, Brünink D, Schwab D, Doltsinis NL, Strassert CA, Klein A. Triplet Emitting C^N^C Cyclometalated Dibenzo[c,h]Acridine Pt(II) Complexes. Molecules. 2022; 27(22):8054. https://doi.org/10.3390/molecules27228054
Chicago/Turabian StyleFriedel, Joshua, Maren Krause, Rose Jordan, Iván Maisuls, Dana Brünink, Dominik Schwab, Nikos L. Doltsinis, Cristian A. Strassert, and Axel Klein. 2022. "Triplet Emitting C^N^C Cyclometalated Dibenzo[c,h]Acridine Pt(II) Complexes" Molecules 27, no. 22: 8054. https://doi.org/10.3390/molecules27228054
APA StyleFriedel, J., Krause, M., Jordan, R., Maisuls, I., Brünink, D., Schwab, D., Doltsinis, N. L., Strassert, C. A., & Klein, A. (2022). Triplet Emitting C^N^C Cyclometalated Dibenzo[c,h]Acridine Pt(II) Complexes. Molecules, 27(22), 8054. https://doi.org/10.3390/molecules27228054