Abstract
Chitosan oligosaccharide (COS) is a bioactive compound derived from marine by-products. COS consumption has been demonstrated to lower the risk of diabetes. However, there are limited data on the inhibitory effect of low-molecular-weight COSs with different degrees of polymerization (DP) on α-glucosidase. This study investigates the α-glucosidase inhibitory activity of two low-molecular-weight COSs, i.e., S-TU-COS with DP2–4 and L-TU-COS with DP2–5, both of which have different molecular weight distributions. The inhibition constants of the inhibitors binding to free enzymes (Ki) and an enzyme–substrate complex (Kii) were investigated to elucidate the inhibitory mechanism of COSs with different chain lengths. The kinetic inhibition model of S-TU-COS showed non-completive inhibition results which are close to the uncompetitive inhibition results with Ki and Kii values of 3.34 mM and 2.94 mM, respectively. In contrast, L-TU-COS showed uncompetitive inhibition with a Kii value of 5.84 mM. With this behavior, the IC50 values of S-TU-COS and L-TU-COS decreased from 12.54 to 11.84 mM and 20.42 to 17.75 mM, respectively, with an increasing substrate concentration from 0.075 to 0.3 mM. This suggests that S-TU-COS is a more potent inhibitor, and the different DP of COS may cause significantly different inhibition (p < 0.05) on the α-glucosidase activity. This research may provide new insights into the production of a COS with a suitable profile for antidiabetic activity.
1. Introduction
Type 2 diabetes mellitus (T2DM) is classified as a complicated heterogeneous group of metabolic disorders that are characterized by unusually high blood glucose levels (hyperglycemia) from deficiencies in insulin action, insulin secretion, or both. This causes harm to the heart, vascular, eyes, kidneys, and nerves over time [1]. Lowering the blood sugar levels is one method of achieving strategy for the maintenance of T2DM. The inhibition of carbohydrate-digesting enzymes, especially α-amylase (EC 3.2.1.1) and α-glucosidase (EC 3.2.1.20) delays glucose absorption [2]. Presently, a T2DM treatment with synthetic medicines is often utilized clinically to manage the blood glucose levels of the patients. Acarbose (Figure 1a) is one of the well-known α-glucosidase inhibitors. As a result, α-glucosidase inhibitors from natural sources have attracted increasing attention for decreasing their long-term adverse effects on the health of the user.
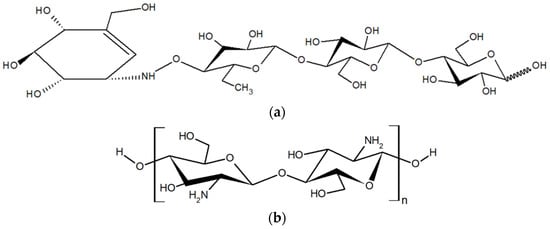
Figure 1.
Chemical structure of acarbose (a) and chitosan oligosaccharide (COS) (b).
Chitosan oligosaccharides (COS) are degraded by depolymerization from chitin or chitosan using a chemical or enzymatic hydrolysis procedure [3,4], with it having a degree of polymerization that is less than 20 [5]. COSs have recently been increasingly used in a wide range of health applications including in pharmaceuticals [6], functional foods [7], and biomedical [8] due to their high solubility properties, poor viscosity, and they are more easily absorbed than chitosan is, and chitin is included in positive physiological activities [9] such as the antioxidant [10,11], anti-Alzheimer [12], anti-bacterial [13], anti-inflammatory [14], anti-tumor [15,16], anti- hypertension [17], anti-obesity [18,19], and anti-diabetes ones [20,21,22]. Furthermore, additional studies have revealed that the variety of biological activities of COS are related to the chemical structures including its size and the degree of acetylation (DA), which depend on the production process [23,24,25]. Doan et al. [26] found that COSs with different molecular weights inhibited yeast α-glucosidase differently, and that the inhibitory mechanism followed the mixed noncompetitive inhibition model. Jo et al. [27] illustrated that COSs with low, medium, and high molecular weights reduced the activities of rat intestine α-glucosidase, but they were less efficient at inhibiting porcine pancreatic α-amylase. Yu et al. [21] discovered that low-MW COSs inhibit α-glucosidase in the Caco-2 intestinal cells as well as in the glucose transporters SGLT1 and GLUT2 in a way that differs from the acarbose effect. Moreover, clinical investigations have shown that COSs with low-MW lower the hyperglycemia levels in subjects with prediabetes [28], including among healthy subjects [29]. These observations suggest that low-MW COSs might be effectively utilized as a natural alternative medicine or ingredient supplement in medical foods, dietary supplements, or functional foods for the management of hyperglycemia and diabetes.
However, the inhibition mechanism of low-MW COSs with different chain lengths on α-glucosidase has not been elucidated. In addition, the production of COSs usually ends up with mixture of COSs with various chain lengths which could affect the consistency and the effectiveness of the post-prandial glucose control. Consequently, the aim of this study was to investigate the effect of different chain lengths and the DP composition of two low-MW COS mixtures, which are a COS with a shorter chain (S-TU-COS; DP2–4) and a COS with a longer chain (L-TU-COS; DP2–5) (Figure 1b), on the α-glucosidase inhibitory potency. Their half-maximal inhibitory concentration (IC50) values with varying substrate concentrations were evaluated. Moreover, this research also studied the inhibition mechanisms by evaluating their kinetic parameters. The outcome of this research could lead to new insights of the quality control of COS the production, especially for the DP and their distribution. This is essential for the consistency of effective antidiabetic properties of the DPs and the development of natural-sourced functional oligosaccharides with minimized side effects, while maximizing the other health benefits.
2. Results and Discussion
2.1. COS Molecular Weight Distribution
The provided COS mixtures contained oligomers with varying degrees of polymerization, ranging from DP2 to DP5. The molecular weight distribution and the molar fractions of each oligomer within both of the mixtures were confirmed by high-performance liquid chromatography (HPLC) and they were compared with the corresponding standard oligomers. The S-TU-COS comprised mainly DP2, DP3, and DP4, as illustrated in Figure 2a. The L-TU-COS mixture consisted of four oligomers including DP2, DP3, DP4, and DP5, as shown in Figure 2b.
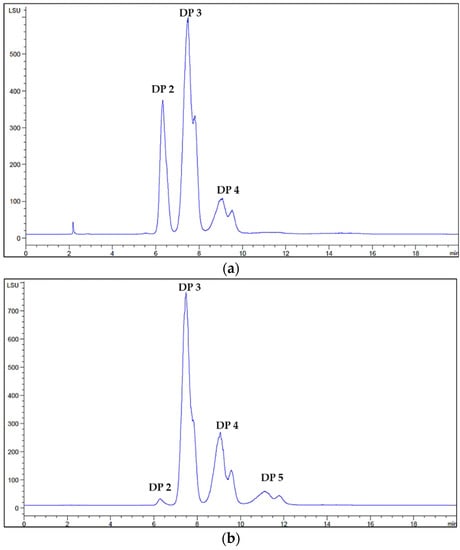
Figure 2.
HPLC chromatogram of S-TU-COS with DP2–4 (a) and L-TU-COS with DP2–5 (b).
At 10 mg/mL of both of the COS mixtures, the concentration of the S-TU-COS compositions with DP2, DP3 and DP4 were of 4.10, 4.20, and 1.80 mM, respectively (Table 1). Therefore, the average molecular weight S-TU-COS was 566 Da. For L-TU-COS, the concentrations of DP2, DP3, DP4, and DP5 were 0.8, 4.20, 2.40, and 1.50 mM, respectively, resulting in an average molecular weight of 713 Da. Therefore, the molar fractions of DP3 in S-TU-COS and L-TU-COS were 42 and 47%, respectively. There being very similar molar fractions of DP3 in both of the samples allowed us to investigate the inhibitory effect of DP2 and DP4 when it was mixed with DP5 on α-glucosidase.

Table 1.
The concentration of each DP in S-TU-COS and L-TU-COS and their average molecular weight.
2.2. Evaluation of α-Glucosidase Inhibitory Activity
The in vitro α-glucosidase inhibitory activity, which indirectly indicated the potential antidiabetic activity, was represented by the IC50 at varying concentration of the surrogate substrate, pNPG. The IC50 values of S-TU-COS and L-TU-COS slightly decreased from 12.54 to 11.84 mM and 20.42 to 17.75 mM (p < 0.05), respectively, with an increasing substrate concentration from 0.075 to 0.3 mM (Table 2 and Figure S2). Acarbose exhibited a slight rising trend in the IC50 values from 0.1638 to 0.1835 mM (p < 0.05) with an increasing pNPG concentration (Table 2 and Figure S3). In comparison to acarbose, a generally known anti-diabetic drug, both of the COSs displayed much weaker α-glucosidase inhibition activity levels, as illustrated by their higher IC50 values. In comparison between the two types of COSs, S-TU-COS exhibited lower IC50 values than L-TU-COS did at all of the substrate concentrations, indicating that it was a slightly stronger inhibitor. Since S-TU-COS has much larger content of DP2, or chitobiose, than L-TU-COS did, this result seems to indicate that chitobiose is a more effective inhibitor than chitotetraose and chitopentaose are. This is unlike the previous report by Doan et al. [26] where only COSs with molecular weights between 1600–6500 Da exhibited an inhibitory activity on yeast α-glucosidase. On the other hand, COSs with molecular weights between 221–424 Da did not show an inhibitory activity [26]. However, Jo et al. [27] investigated rat α-glucosidase inhibitions from COSs with increasing MWs, and they reported that the molecular weight of the COS did not influence the inhibitory effect on α-glucosidase. Since the sources of the COSs in all of the studies were different, they may have different purity and molecular weight distribution, giving rise to an inconsistency in the inhibitory effects. In addition, the sequences and structures of the yeast and mammalian enzymes were rather different, which could greatly affect the inhibitory mechanism of the COSs.
Table 2.
The IC50 values of S-TU-COS, L-TU-COS, and acarbose on α-glucosidase inhibition.
Both of the COS-inhibitory activities appeared to increase as the substrate concentration increased, as illustrated by the lower IC50 values. This differs from the trend in acarbose where the IC50 values gradually increase upon the increase in the pNPG concentration, indicating the loss of the inhibitory activity. These behaviors imply that both the COS and acarbose exhibited different inhibition mechanisms. The increases in IC50 are observed in a competitive inhibitor. This trend in acarbose are similar to its known competitive inhibition behavior [30,31].
The decline in IC50 is the characteristic of an uncompetitive inhibitor, where the inhibitor binds with the enzyme–substrate complex rather than the free enzyme. In addition, the mixed mode inhibition could follow such trend depending on the Ki and Kii of the inhibitors. To distinguish between the mechanism and the effect of the chain length on the enzyme inhibition, their kinetic parameters were determined.
2.3. Inhibition Kinetic of α-Glucosidase Activity
S-TU-COS, L-TU-COS, and acarbose were further investigated to identify the mode of enzyme inhibition using Lineweaver–Burk plots. The mixed-mode Michaelis–Menten equation was used to calculate the kinetic parameters including Michaelis constant (KM), the maximal velocity (Vmax), and the kinetic constant (Ki and Kii)
The Lineweaver–Burk plots of S-TU-COS (Figure 3a) generated straight lines, and all of the inhibitor concentrations have very close x-axis intersections, suggesting that it behaved in a non-competitive inhibition fashion. On the other hand, L-TU-COS (Figure 4a) produced rather parallel straight lines at all of the inhibitor concentrations, indicating an uncompetitive inhibition behavior. In contrast, acarbose exhibited a competitive inhibition fashion, where the best-fit lines of all of the data sets intersected on the y-axis at very close co-ordinates, as illustrated in Figure 5a. With these trends, the data were fitted into the Michaelis–Menten equations in suitable inhibition modes to find the kinetic parameters and confirm their inhibition mechanisms.
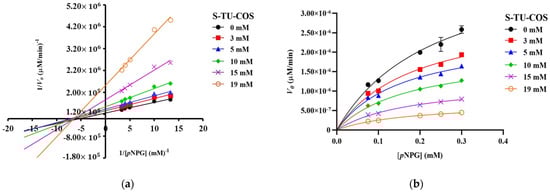
Figure 3.
Kinetic analysis of α-glucosidase inhibition. (a) Lineweaver–Burk plot and (b) Michaelis–Menten plot of the inhibition kinetic by S-TU-COS with different concentrations of pNPG. The values are given as mean ± SD (n = 3).
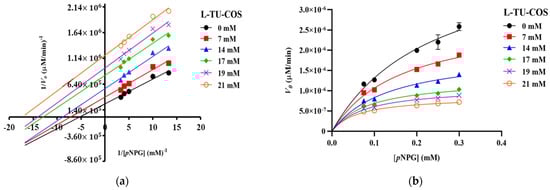
Figure 4.
Kinetic analysis of α-glucosidase inhibition. (a) Lineweaver–Burk plot and (b) Michaelis–Menten plot of the inhibition kinetic by L-TU-COS with different concentrations of pNPG. The values are given as mean ± SD (n = 3).
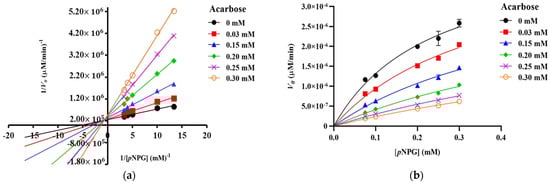
Figure 5.
Kinetic analysis of α-glucosidase inhibition. (a) Lineweaver–Burk plot and (b) Michaelis–Menten plot of the inhibition kinetic by acarbose with different concentrations of pNPG. The values are given as mean ± SD (n = 3).
As the concentration of S-TU-COS increased, the Vmax significantly decreased (p < 0.05) from 3.07 10−6 to 7.06 10−7 µM/min, while the apparent KM remained relatively unchanged, but it was slightly lower than the KM without the inhibitor (p > 0.05) (Figure 3b and Table 3). The α value that was generated from the mixed-mode inhibition was 0.61, implying that S-TU-COS can bind to both to free enzymes and the enzyme–substrate complex, but the latter was preferable. Indeed, the Ki and Kii values of S-TU-COS were 3.34 ± 0.64 and 2.94 ± 0.62 mM, respectively. Since the Ki value was much higher than the KM of pNPG at 0.24 ± 0.033 mM, it would have poorly competed for the active site and the binding with the free enzymes must have taken place at other sites. Therefore, the kinetic parameters suggested that S-TU-COS exhibited a non-competitive inhibition mode, which is in good agreement with the trend on Lineweaver–Burk graph.
Table 3.
Kinetic parameters of S-TU-COS, L-TU-COS, and acarbose (positive control) on α-glucosidase inhibition from the Michaelis–Menten plots.
In L-TU-COS, Vmax also dropped from 2.84 10−6 to 8.55 10−7 µM/min, but the apparent KM values significantly decreased from 0.17 to 0.062 mM (p < 0.05) upon us increasing the L-TU-COS concentration (Figure 4b and Table 3). The α value that was obtained from the mixed-mode inhibition was 0.18, implying that it preferred binding to the enzyme–substrate complex over the free enzymes, which resulting in uncompetitive behavior. This α value was much lower than that of S-TU-COS, indicating that the longer COSs could not bind well with the free enzymes. When it was binding with the enzyme–substrate complex, the Kii of L-TU-COS was 5.84 ± 0.99 mM which was nearly double the Kii of S-TU-COS, indicating that there was a poorer binding at the higher DP.
From Table 3, the KM of yeast α-glucosidase for pNPG was 0.24 ± 0.033 mM, which is in good agreement with the previously reported value of 0.3 mM [32]. This suggested that the COSs may not be able to compete well for the active site when they are using pNPG as a substrate. The fact that the binding of the COSs with the free enzymes and the enzyme–substrate complex greatly depends on the chain length, even at 1 DP increments, the binding sites of each DP may be different. The results from this study have led to a hypothesis that COSs with DP2–3 can bind with both free enzymes and the enzyme–substrate complex with a higher preference towards the latter. L-TU-COS suddenly lost its binding with the free enzymes, and this mixture has much lower DP2 than S-TU-COS did. Therefore, it is possible that only DP2 can bind to the free enzymes, while longer DPs can only bind to the E–S complex at a different site from DP2. As the chain becomes longer, it can no longer bind with the free enzymes, and gradually, it lost the affinity with the enzyme–substrate complex due to the binding site being inaccessible.
Our findings differed from the study of Doan et al. [26] who previously reported that COSs with molecular weights of 221–424 Da (DP1-DP2) did not display an α-glucosidase inhibition activity in yeast enzyme, while COSs with high molecular weights (1600–6500 Da) exhibited a mixed noncompetitive inhibition type. Jo et al. [27] on the other hand, found no difference in rat and porcine α-glucosidase when they were using COSs with molecular weights that were less than 1000 Da and above 10,000 Da. These differences may arise from the COS preparation methods as well as the actual molar fraction of each oligomer within the mixture. In this study, the molar fraction of each chito-oligomer in the sample was confirmed by an HPLC with a specific standard rather than with mixed molecular weights. Therefore, this provides a higher resolution on the inhibitory activity of each chito-oligomer.
For a better comprehension of the kinetic behavior of the α-glucosidase inhibition, particularly the enzyme’s catalytic efficiency in the presence of inhibitors, the Vmax/KM was further investigated. Since the concentration was kept constant throughout the study, the Vmax/KM also reflected the kcat/KM under each condition.
Acarbose exhibited a competitive inhibitory behavior, which means that the affinity between the enzyme and the substrate appears to be weaker. An increase in the competitive inhibitor concentration would result in lowering kcat/KM, and subsequently, lowering the enzyme catalytic efficiency in a non-linear fashion. In this study, the Vmax/KM values of acarbose decreased from 1.87 10−5 ± 9.21 10−7 to 2.58 10−6 ± 2.27 10−7 mM (p < 0.05) with an increasing acarbose concentration from 0 to 0.30 mM (Table 3). Since the competitive inhibitor is competing for the active site, higher substrate concentrations, especially the accumulation of uncatalyzed substrates results in the ineffectiveness of the inhibitor.
In S-TU-COS, the Vmax significantly decreases, while the apparent KM was rather unaffected. Therefore, the Vmax/KM was greatly reduced from 1.87 10−5 ± 9.21 10−7 to 4.00 10−6 ± 2.51 10−7 mM (p < 0.05) with an increasing S-TU-COS concentration from 0 to 19 mM (Table 3). Since only the Vmax was affected, the concentration of the enzyme would appear to be lower. Unlike during competitive inhibitor where the higher substrate concentration can alleviate the inhibitory effect, non-competitive inhibitor has a greater inhibitory effect as the substrate concentration increases due to the formation of the enzyme–substrate complex. In this case, the Vmax/KM dropped to only 21% of the inhibitor-free condition.
L-TU-COS exhibited uncompetitive inhibition behavior whereby both the Vmax and KM were reduced upon the increase in the inhibitor concentration. Theoretically, the apparent kcat and KM were and , respectively. Therefore, the kcat/KM in the presence of this type of inhibitor will not be affected. In this study, the Vmax/KM values of L-TU-COS slightly decreased from 1.87 10−5 ± 9.21 10−7 to 1.37 10−5 ± 5.78 10−7 mM (p < 0.05) with an increasing L-TU-COS concentration from 0 to 21 mM (Table 3). The Vmax/KM was still greater than 70% when the L-TU-COS reached 22 mM. Since the Vmax/KM was not affected, the presence of this type of inhibitor resulted in a lower apparent enzyme concentration, but this was not the case for the catalytic efficiency.
To further evaluate the effectiveness of both of the COS mixtures, their inhibition constants and trends were compared with those of acarbose, which is a known competitive inhibitor. In this study, the Vmax of acarbose remained unchanged (p > 0.05), and the KM values were significantly increased (p < 0.05) with an increasing acarbose concentration (Figure 5b and Table 3). When we were fitting the data into the mixed-mode inhibition, the α value of acarbose was 1.86, illustrating that it preferred to bind with free enzymes, which is the characteristics of a competitive inhibitor. These results were in good agreement with those of previous studies, which have reported that the inhibitory mechanism of acarbose follows the competitive inhibition model [30,31]. The Ki value of acarbose was 0.061 ± 0.0082 mM. which was similar to the Ki value with the human enzyme [33]. A previous study reported that the inhibitory constant of acarbose on yeast α-glucosidase was as low as 0.22 μM, which is much higher than the Ki from this study [34]. The discrepancy might be due to the enzyme-inhibitor incubation period. Such a low Ki value allowed the acarbose to compete with pNPG for the active site. On the other hand, the Ki and Kii of both of the COS mixtures were 50–100 times larger than the Ki of acarbose, making them much less effective at inhibiting α-glucosidase and possibly unable to control the postprandial blood glucose levels through this mechanism.
Overall, it can be concluded that the inhibitory efficiency of these compounds on the α-glucosidase activity was in the following order: acarbose > S-TU-COS > L-TU-COS. Although acarbose was a more effective inhibitor when it was compared to both types of COSs, it has been reported to have potential adverse effects on health [35].
3. Materials and Methods
3.1. Materials and Chemicals
Two low-molecular-weight chitosan oligosaccharides (COS) were classified by their degree of polymerization (DP) or chain length (S-TU-COS; DP2–4, L-TU-COS; DP2–5), and they were both purchased from Qingdao Hehai Biotech Co. ltd. (Qingdao, China) and Qingdao Chenland Pharmaceutical Technology Development Co. Ltd., respectively. All of the COS samples were prepared from crab shells with ≥90% degree of deacetylation (DD). The COS oligomer standards including chitobiose dihydrochloride (DP2, 413.25 Da), chitotriose trihydrochloride (DP3, 610.86 Da), chitotetraose tetrahydrochloride (DP4, 808.48 Da), and chitopentaose pentahydrochloride (DP5, 1006.1 Da) were purchased from Qingdao Hehai Biotech Co. ltd. (Qingdao, China). The purities of the COS oligomers from DP2 to 5, which were evaluated by high performance liquid chromatography (HPLC), were 98.5, 98.7, 98.8, and 98.5%, respectively. The α-Glucosidase from Saccharomyces cerevisiae (type 1, ≥10 unit/mg, EC 3.2.1.20, catalogue no G5003), p-nitrophenyl-α-D-glucopyranoside (pNPG), and acarbose were purchased from Sigma Chemical Co. (St. Louis, MO, USA). Unless it is specified, all of the other chemicals were bought from Sigma-Aldrich Co. (St. Louis, MO, USA).
3.2. HPLC Analysis of COS
The S-TU-COS and L-TU-COS mixtures were analyzed by the Agilent 1200 infinity series HPLC system using an evaporative light-scattering detector (ELSD). The COS samples were separated on Shodex Asahipak NH2P-50 4E (4.6 mm I.D. ×250 mm) (Shodex, Kyoto, Japan). The HPLC separation was optimized using a method from Dong et al. [36]. The samples were eluted with a mobile phase of acetonitrile and ultrapure water at the ratio of 70:30 (v/v). The column temperature was fixed at 30 ℃, and the flow rate was maintained at 1.0 mL/min. Both of the COS mixtures were prepared at 10 mg/mL before the analysis was performed. The concentration of each DP in the COS mixtures were estimated by each peak area using an external calibration curve. The average molecular weights (Mn) of S-TU-COS and L-TU-COS were computed by calculating the following equation:
where Mi represents the molecular weight of each DP and Ni represents the number of chains of a particular DP. In this study, the Ni was represented as the concentration of each DP calculated from the external standard curve (Figure S4).
3.3. α-Glucosidase Inhibitory Assay for IC50 Determination
The inhibition of the α-glucosidase was investigated by using the method that was modified by Flores-Bocanegra et al. [37]. Briefly, the assay was carried out by incubating 40 µL of the COS solution at various concentrations and 40 µL of Saccharomyces cerevisiae α-glucosidase (0.02 U/mL) in 280 µL of sodium phosphate buffer (0.1 M, pH 6.9) at 25 °C for 20 min. After the incubation, 40 µL of p-nitrophenyl-α-D-glucopyranoside (pNPG) with various concentrations was added to obtain the final substrate concentrations of 0.075, 0.1, 0.2, 0.25 and 0.3 mM, respectively. Before and after the incubation, the absorbance was recorded at a wavelength of 405 nm every 20 s using a double-beam UV-vis spectrophotometer (Jasco v-730) at 25 °C for 3 min. The result was measured as a percentage of the inhibitory activity using the following equation:
where Acontrol indicates the initial velocity without the inhibitor, and Asample indicates the initial velocity with the inhibitor. Acarbose, a commercially available α-glucosidase inhibitor, was used as a positive control. The potency of S-TU-COS, L-TU-COS, and acarbose for the α-glucosidase inhibition was examined by the half-maximal inhibitory concentration (IC50) value, utilizing a non-linear regression analysis (dose–response curves) [38]. The IC50 values were determined following Hill’s equation by plotting the log inhibitor concentration against the percentage inhibition using a GraphPad Prism (version 8.00) for Windows (GraphPad Software, San Diego, CA, USA, www.graphpad.com (accessed on 15 August 2022)).
3.4. Inhibition Kinetic of α-Glucosidase
The α-glucosidase inhibitory mechanisms of S-TU-COS, L-TU-COS, and acarbose were characterized by the Lineweaver–Burk plot [39] using the GraphPad Prism 8.0 software programs for each inhibitor concentration, and the pNPG concentration ranged from 0.075 to 0.3 mM. The data were fitted into both the Lineweaver–Burk and the Michaelis–Menten equation to determine the inhibition mode of the α-glucosidase for each of the COS mixtures.
The kinetic parameters, i.e., KM, Vmax, and the kinetic constants (Ki and Kii), were determined by fitting the data into the Michaelis–Menten equation [40] using the GraphPad Prism 8.0 software programs (GraphPad Inc., La Jolla, CA, USA) for Windows. The Michaelis–Menten equation, which expresses a relationship between the substrate concentration and the reaction velocity is given as follows:
where Ki represents the kinetic binding constants of the free enzymes, Kii represents the kinetic binding constant of the enzyme–substrate complex, V represents the velocity, Vmax represents the maximum velocity, KM represents the Michaelis’ constant, [S] represents the substrate concentration, and [I] represents the inhibitor concentration. The α values were calculated to determine the inhibition modes and the inhibitor binding preference.
3.5. Statistical Analysis
All of the experiments were carried out in triplicate (mean ± SD, n = 3). All of the statistical analyses were performed using GraphPad Prism (version 8.00) for Windows (GraphPad Software, San Diego, CA, USA, www.graphpad.com (accessed on 15 August 2022)).The significance of differences among the mean values was set at p < 0.05 using a one-way analysis of variance (ANOVA), which was followed by Tukey’s test.
4. Conclusions
The influence of chain length and DP of the two low-molecular-weight chitosan oligosaccharides on the α-glucosidase inhibitory activity and the inhibitory mechanisms, which are essential to the management of T2DM, were reported for the first time. We found that the S-TU-COS with DP2–4 and containing higher DP2 components had a stronger inhibitory activity on the α-glucosidase as evidenced by the lower IC50 and Kii values when it was compared to the result from the L-TU-COS with DP2–5 and containing higher DP4 and DP5 components. Furthermore, the inhibitory mechanisms of the two COS types were found to be totally different. The S-TU-COS performs non-competitive inhibition, whereas the L-TU-COS performs uncompetitive inhibition. However, S-TU-COS has a lower Kii than its Ki value, indicating that S-TU-COS has greater inhibition for binding to the enzyme–substrate complex than to the free enzymes in a similar way to L-TU-COS. Moreover, the increase in the substrate concentration resulted in an increase in the inhibition which was demonstrated with a decrease in the IC50 values of both COS types, thus confirming that both of the COSs had the same binding inhibition mechanism. This research provides insight data for the potential use of COSs with suitable chain lengths and compositions of DP for effective antidiabetic activity. However, additional in vivo investigations on α-glucosidase are necessary to validate our in vitro findings.
Supplementary Materials
The following supporting information can be downloaded at: https://www.mdpi.com/article/10.3390/molecules27238129/s1, Figure S1: IC50 values of S-TU-COS with different substrate concentration; Figure S2: IC50 values of L-TU-COS with different substrate concentrations; Figure S3: IC50 values of L-TU-COS with different substrate concentrations; Figure S4: Calibration curves.
Author Contributions
Conceptualization, S.K. and P.P.; methodology, S.K., A.W. and P.P.; validation, S.K., S.C., A.W., M.S. and P.P.; formal analysis, A.W., M.S. and P.P.; investigation, S.C., A.W., M.S. and P.P.; resources, S.C., A.W., M.S. and P.P.; data curation, S.K. and P.P.; writing—original draft preparation, S.K., S.C., A.W., M.S. and P.P.; writing—review and editing, S.K., S.C., A.W., M.S. and P.P.; visualization, S.K.; supervision, S.C., A.W., M.S. and P.P.; project administration, S.K. and P.P. All authors have read and agreed to the published version of the manuscript.
Funding
This research was funded by the NSRF via the Program Management Unit for Human Resources and Institutional Development, Research and Innovation under a Grant Number MOU-CO-2564-13555-TH. We thank the Thai Union Group PCL. and the Graduate Program in Science Innovation, Mahidol University for their collaboration and the support of the research facilities.
Institutional Review Board Statement
Not applicable.
Informed Consent Statement
Not applicable.
Data Availability Statement
Data are contained within the article.
Conflicts of Interest
The authors declare no conflict of interest.
Sample Availability
Samples of the compounds are available from the authors.
Abbreviations
T2DM: Type 2 diabetes mellitus; S-TU-COS, short chain chitosan oligosaccharide of Thai Union Group PCL; L-TU-COS, long chain chitosan oligosaccharide of Thai Union Group PCL; pNPG, p-nitrophenyl-α-D-glucopyranoside; IC50, the maximum half-inhibitory concentration; Ki, the kinetic constant of inhibitor bind to free enzyme; Kii, the kinetic constant of inhibitor bind to enzyme–substrate complex; KM, the Michaelis constant; Vmax, the maximum reaction velocity.
References
- Galicia-Garcia, U.; Benito-Vicente, A.; Jebari, S.; Larrea-Sebal, A.; Siddiqi, H.; Uribe, K.B.; Ostolaza, H.; Martin, C. Pathophysiology of Type 2 Diabetes Mellitus. Int. J. Mol. Sci. 2020, 21, 6275. [Google Scholar] [CrossRef]
- Krentz, A.J.; Bailey, C.J. Oral Antidiabetic Agents Current Role in Type 2 Diabetes Mellitus. Drugs 2005, 65, 385–411. [Google Scholar] [CrossRef]
- Yang, E.-J.; Kim, J.-G.; Kim, J.-Y.; Kim, S.; Lee, N.; Hyun, C.-G. Anti-inflammatory effect of chitosan oligosaccharides in RAW 264.7 cells. Open Life Sci. 2010, 5, 95–102. [Google Scholar] [CrossRef]
- Kim, S.; Rajapakse, N. Enzymatic production and biological activities of chitosan oligosaccharides (COS): A review. Carbohydr. Polym. 2005, 62, 357–368. [Google Scholar] [CrossRef]
- Mourya, V.K.; Inamdar, N.N.; Choudhari, Y.M. Chitooligosaccharides: Synthesis, characterization, and applications. Polym. Sci. Ser. A 2011, 53, 583–612. [Google Scholar] [CrossRef]
- Zhao, L.; Sun, T.; Wang, L. Chitosan oligosaccharide improves the therapeutic efficacy of sitagliptin for the therapy of Chinese elderly patients with type 2 diabetes mellitus. Ther. Clin. Risk Manag. 2017, 13, 739–750. [Google Scholar] [CrossRef]
- Shang, W.; Si, X.; Zhou, Z.; Wang, J.; Strappe, P.; Blanchard, C. Studies on the unique properties of resistant starch and chito-oligosaccharide complexes for reducing high-fat diet-induced obesity and dyslipidemia in rats. J. Funct. Foods 2017, 38, 20–27. [Google Scholar] [CrossRef]
- Charan, S.; Sanjiv, K.; Singh, N.; Chien, F.C.; Chen, Y.F.; Nergui, N.N.; Huang, S.H.; Kuo, C.W.; Lee, T.C.; Chen, P. Development of chitosan oligosaccharide-modified gold nanorods for in vivo targeted delivery and noninvasive imaging by NIR irradiation. Bioconjug. Chem. 2012, 23, 2173–2182. [Google Scholar] [CrossRef]
- Lodhi, G.; Kim, Y.S.; Hwang, J.W.; Kim, S.K.; Jeon, Y.J.; Je, J.Y.; Ahn, C.B.; Moon, S.H.; Jeon, B.T.; Park, P.J. Chitooligosaccharide and its derivatives: Preparation and biological applications. Biomed. Res. Int. 2014, 2014, 654913. [Google Scholar] [CrossRef]
- Qu, D.; Han, J. Investigation of the antioxidant activity of chitooligosaccharides on mice with high-fat diet. Rev. Bras. Zootec. 2016, 45, 661–666. [Google Scholar] [CrossRef]
- Mengibar, M.; Mateos-Aparicio, I.; Miralles, B.; Heras, A. Influence of the physico-chemical characteristics of chito-oligosaccharides (COS) on antioxidant activity. Carbohydr. Polym. 2013, 97, 776–782. [Google Scholar] [CrossRef]
- Jia, S.; Lu, Z.; Gao, Z.; An, J.; Wu, X.; Li, X.; Dai, X.; Zheng, Q.; Sun, Y. Chitosan oligosaccharides alleviate cognitive deficits in an amyloid-beta1–42-induced rat model of Alzheimer’s disease. Int. J. Biol. Macromol. 2016, 83, 416–425. [Google Scholar] [CrossRef]
- Benhabiles, M.S.; Salah, R.; Lounici, H.; Drouiche, N.; Goosen, M.F.A.; Mameri, N. Antibacterial activity of chitin, chitosan and its oligomers prepared from shrimp shell waste. Food Hydrocoll. 2012, 29, 48–56. [Google Scholar] [CrossRef]
- Yousef, M.; Pichyangkura, R.; Soodvilai, S.; Chatsudthipong, V.; Muanprasat, C. Chitosan oligosaccharide as potential therapy of inflammatory bowel disease: Therapeutic efficacy and possible mechanisms of action. Pharmacol. Res. 2012, 66, 66–79. [Google Scholar] [CrossRef]
- Pan, Z.; Cheng, D.D.; Wei, X.J.; Li, S.J.; Guo, H.; Yang, Q.C. Chitooligosaccharides inhibit tumor progression and induce autophagy through the activation of the p53/mTOR pathway in osteosarcoma. Carbohydr. Polym. 2021, 258, 117596. [Google Scholar] [CrossRef]
- Fernandes, J.C.; Sereno, J.; Garrido, P.; Parada, B.; Cunha, M.F.; Reis, F.; Pintado, M.E.; Santos-Silva, A. Inhibition of bladder tumor growth by chitooligosaccharides in an experimental carcinogenesis model. Mar. Drugs 2012, 10, 2661–2675. [Google Scholar] [CrossRef]
- Ngo, D.-N.; Qian, Z.-J.; Je, J.-Y.; Kim, M.-M.; Kim, S.-K. Aminoethyl chitooligosaccharides inhibit the activity of angiotensin converting enzyme. Process Biochem. 2008, 43, 119–123. [Google Scholar] [CrossRef]
- Choi, E.H.; Yang, H.P.; Chun, H.S. Chitooligosaccharide ameliorates diet-induced obesity in mice and affects adipose gene expression involved in adipogenesis and inflammation. Nutr. Res. 2012, 32, 218–228. [Google Scholar] [CrossRef]
- Huang, L.; Chen, J.; Cao, P.; Pan, H.; Ding, C.; Xiao, T.; Zhang, P.; Guo, J.; Su, Z. Anti-obese effect of glucosamine and chitosan oligosaccharide in high-fat diet-induced obese rats. Mar. Drugs 2015, 13, 2732–2756. [Google Scholar] [CrossRef]
- Kumar, S.G.; Rahman, M.A.; Lee, S.H.; Hwang, H.S.; Kim, H.A.; Yun, J.W. Plasma proteome analysis for anti-obesity and anti-diabetic potentials of chitosan oligosaccharides in ob/ob mice. Proteomics 2009, 9, 2149–2162. [Google Scholar] [CrossRef]
- Yu, S.-Y.; Kwon, Y.-I.; Lee, C.; Apostolidis, E.; Kim, Y.-C. Antidiabetic effect of chitosan oligosaccharide (GO2KA1) is mediated via inhibition of intestinal alpha-glucosidase and glucose transporters and PPARgamma expression. Biofactors 2017, 43, 90–99. [Google Scholar] [CrossRef]
- Lee, H.W.; Park, Y.S.; Choi, J.W.; Yi, S.Y.; Shin, W.S. Antidiabetic effects of chitosan oligosaccharides in neonatal streptozotocin-induced noninsulin-dependent diabetes mellitus in rats. Biol. Pharm. Bull. 2003, 26, 1100–1103. [Google Scholar] [CrossRef]
- Sanchez, A.; Mengibar, M.; Rivera-Rodriguez, G.; Moerchbacher, B.; Acosta, N.; Heras, A. The effect of preparation processes on the physicochemical characteristics and antibacterial activity of chitooligosaccharides. Carbohydr. Polym. 2017, 157, 251–257. [Google Scholar] [CrossRef]
- Cabrera, J.C.; Van Cutsem, P. Preparation of chitooligosaccharides with degree of polymerization higher than 6 by acid or enzymatic degradation of chitosan. Biochem. Eng. J. 2005, 25, 165–172. [Google Scholar] [CrossRef]
- Wang, Q.Z.; Chen, X.G.; Liu, N.; Wang, S.X.; Liu, C.S.; Meng, X.H.; Liu, C.G. Protonation constants of chitosan with different molecular weight and degree of deacetylation. Carbohydr. Polym. 2006, 65, 194–201. [Google Scholar] [CrossRef]
- Doan, C.T.; Tran, T.N.; Nguyen, V.B.; Nguyen, A.D.; Wang, S.L. Production of a thermostable chitosanase from shrimp heads via Paenibacillus mucilaginosus TKU032 conversion and its application in the preparation of bioactive chitosan oligosaccharides. Mar. Drugs 2019, 17, 217. [Google Scholar] [CrossRef]
- Jo, S.H.; Ha, K.S.; Moon, K.S.; Kim, J.G.; Oh, C.G.; Kim, Y.C.; Apostolidis, E.; Kwon, Y.I. Molecular weight dependent glucose lowering effect of low molecular weight Chitosan Oligosaccharide (GO2KA1) on postprandial blood glucose level in SD rats’ model. Int. J. Mol. Sci. 2013, 14, 14214–14224. [Google Scholar] [CrossRef]
- Kim, H.J.; Ahn, H.Y.; Kwak, J.H.; Shin, D.Y.; Kwon, Y.I.; Oh, C.G.; Lee, J.H. The effects of chitosan oligosaccharide (GO2KA1) supplementation on glucose control in subjects with prediabetes. Food Funct. 2014, 5, 2662–2669. [Google Scholar] [CrossRef]
- Jo, S.-H.; Ha, K.-S.; Lee, J.-W.; Kim, Y.-C.; Apostolidis, E.; Kwon, Y.-I. The reduction effect of low molecular weight chitosan oligosaccharide (GO2KA1) on postprandial blood glucose levels in healthy individuals. Food Sci. Biotechnol. 2014, 23, 971–973. [Google Scholar] [CrossRef]
- Rosak, C.; Mertes, G. Critical evaluation of the role of acarbose in the treatment of diabetes: Patient considerations. Diabetes Metab. Syndr. Obes. 2012, 5, 357–367. [Google Scholar] [CrossRef]
- Kim, M.J.; Lee, S.B.; Lee, H.S.; Lee, S.Y.; Baek, J.S.; Kim, D.; Moon, T.W.; Robyt, J.F.; Park, K.H. Comparative Study of the Inhibition of α-Glucosidase, α-Amylase, and Cyclomaltodextrin Glucanosyltransferase by Acarbose, Isoacarbose, and Acarviosine–Glucose. Arch. Biochem. Biophys. 1999, 371, 277–283. [Google Scholar] [CrossRef]
- Yamamoto, K.; Nakayama, A.; Yamamoto, Y.; Tabata, S. Val216 decides the substrate specificity of alpha-glucosidase in Saccharomyces cerevisiae. Eur. J. Biochem. 2004, 271, 3414–3420. [Google Scholar] [CrossRef] [PubMed]
- Caspary, W.F.; Graf, S. Inhibition of Human Intestinal a-Glucosidehydrolases by a New Complex Oligosaccharide. Res. Exp. Med. 1979, 175, 1–6. [Google Scholar] [CrossRef] [PubMed]
- Son, H.U.; Lee, S.H. Comparison of alpha-glucosidase inhibition by Cudrania tricuspidata according to harvesting time. Biomed. Rep. 2013, 1, 624–628. [Google Scholar] [CrossRef]
- Apostolidis, E.; Kwon, Y.I.; Shetty, K. Inhibitory potential of herb, fruit, and fungal-enriched cheese against key enzymes linked to type 2 diabetes and hypertension. Innov. Food Sci. Emerg. Technol. 2007, 8, 46–54. [Google Scholar] [CrossRef]
- Dong, H.; Wang, Y.; Zhao, L.; Zhou, J.; Xia, Q.; Jiang, L.; Fan, L. Purification of DP6 to 8 chitooligosaccharides by nanofiltration from the prepared chitooligosaccharides syrup. Bioresour. Bioprocess. 2014, 1, 20. [Google Scholar] [CrossRef][Green Version]
- Flores-Bocanegra, L.; Perez-Vasquez, A.; Torres-Piedra, M.; Bye, R.; Linares, E.; Mata, R. α-Glucosidase inhibitors from Vauquelinia corymbosa. Molecules 2015, 20, 15330–15342. [Google Scholar] [CrossRef]
- Prinz, H. Hill coefficients, dose-response curves and allosteric mechanisms. J. Chem. Biol. 2010, 3, 37–44. [Google Scholar] [CrossRef]
- Kim, J.H.; Kim, H.Y.; Yang, S.Y.; Kim, J.B.; Jin, C.H.; Kim, Y.H. Inhibitory activity of (-)-epicatechin-3,5-O-digallate on alpha-glucosidase and in silico analysis. Int. J. Biol. Macromol. 2018, 107, 1162–1167. [Google Scholar] [CrossRef]
- Shen, B.; Shangguan, X.; Yin, Z.; Wu, S.; Zhang, Q.; Peng, W.; Li, J.; Zhang, L.; Chen, J. Inhibitory effect of fisetin on α-glucosidase activity: Kinetic and molecular docking studies. Molecules 2021, 26, 5306. [Google Scholar] [CrossRef]
Publisher’s Note: MDPI stays neutral with regard to jurisdictional claims in published maps and institutional affiliations. |
© 2022 by the authors. Licensee MDPI, Basel, Switzerland. This article is an open access article distributed under the terms and conditions of the Creative Commons Attribution (CC BY) license (https://creativecommons.org/licenses/by/4.0/).